Estimated zip code population in 2022: 41,208 Zip code population in 2010: 34,647 Zip code population in 2000: 27,924
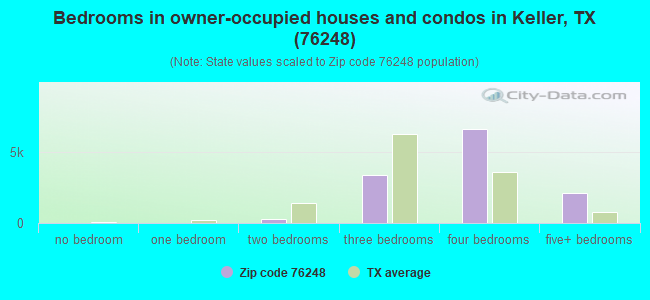
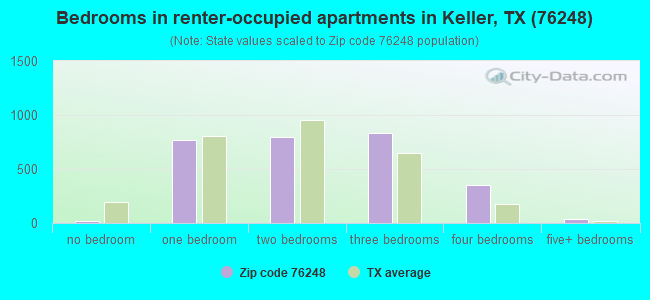
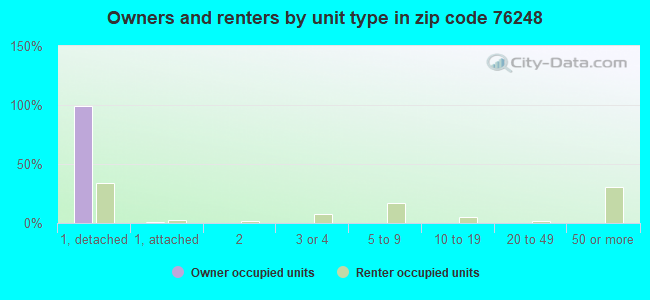
Houses and condos: 15,225 Renter-occupied apartments: 2,840
% of renters here:
19%
State:
38%
March 2022 cost of living index in zip code 76248: 96.8 (near average, U.S. average is 100)
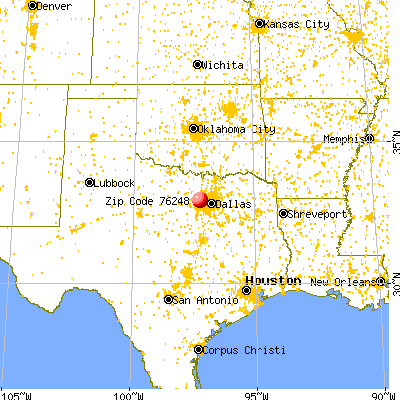
Land area: 14.4 sq. mi. Water area: 0.0 sq. mi.
Population density: 2,856 people per square mile
(average).
OSM Map
General Map
Google Map
MSN Map
OSM Map
General Map
Google Map
MSN Map
OSM Map
General Map
Google Map
MSN Map
OSM Map
General Map
Google Map
MSN Map
Please wait while loading the map...
Real estate property taxes paid for housing units in 2022:
This zip code:
1.8% ($9,973)
Texas:
1.5% ($4,050)
Median real estate property taxes paid for housing units with mortgages in 2022: $10,478 (1.8%) Median real estate property taxes paid for housing units with no mortgage in 2022: $8,752 (1.7%)
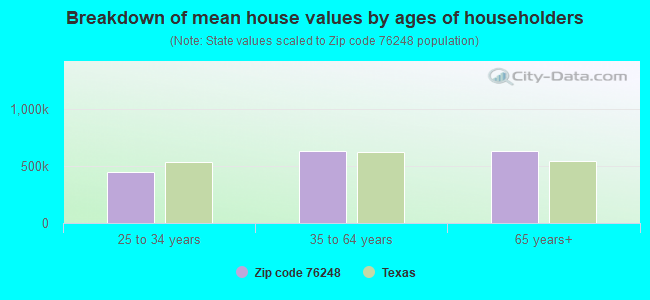
Estimated median house/condo value in 2022: $554,850
76248:
$554,850
Texas:
$275,400
According to our research of Texas and other state lists, there were 16 registered sex offenders living in 76248 zip code as of April 27, 2024. The ratio of all residents to sex offenders in zip code 76248 is 2,437 to 1. The ratio of registered sex offenders to all residents in this zip code is much lower than the state average.
Median resident age:
This zip code:
43.7 years
Texas median age:
35.6 years
Average household size:
This zip code:
2.7 people
Texas:
2.6 people
Averages for the 2020 tax year for zip code 76248, filed in 2021:
Average Adjusted Gross Income (AGI) in 2020: $145,053 (Individual Income Tax Returns)
Here:
$145,053
State:
$77,054
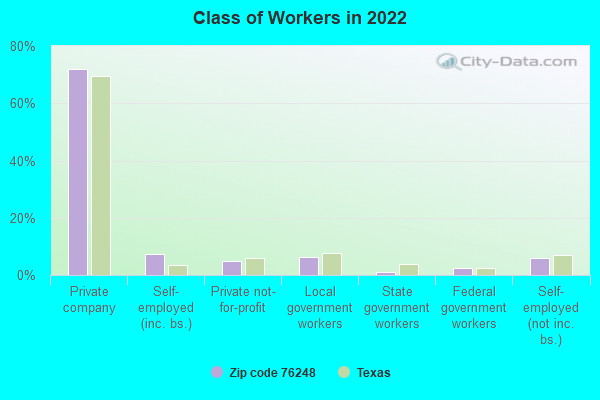
Salary/wage: $122,083 (reported on 83.0% of returns)
Here:
$122,083
State:
$62,766
(% of AGI for various income ranges: 1059.2% for AGIs below $25k, 3411.4% for AGIs $25k-50k, 6006.7% for AGIs $50k-75k, 9054.3% for AGIs $75k-100k, 19298.9% for AGIs $100k-200k, 73116.6% for AGIs over 200k)
Taxable interest for individuals: $1,977 (reported on 42.8% of returns)
This zip code:
$1,977
Texas:
$2,665
(% of AGI for various income ranges: 14.8% for AGIs below $25k, 30.5% for AGIs $25k-50k, 85.4% for AGIs $50k-75k, 99.7% for AGIs $75k-100k, 161.4% for AGIs $100k-200k, 552.3% for AGIs over 200k)
Ordinary dividends: $7,066 (reported on 36.1% of returns)
Here:
$7,066
State:
$10,044
(% of AGI for various income ranges: 36.9% for AGIs below $25k, 69.3% for AGIs $25k-50k, 168.1% for AGIs $50k-75k, 266.1% for AGIs $75k-100k, 421.5% for AGIs $100k-200k, 1914.3% for AGIs over 200k)
Net capital gain/loss in AGI: +$33,535 (reported on 34.0% of returns)
Here:
+$33,535
State:
+$39,590
(% of AGI for various income ranges: 18.6% for AGIs below $25k, 48.8% for AGIs $25k-50k, 155.9% for AGIs $50k-75k, 216.7% for AGIs $75k-100k, 596.7% for AGIs $100k-200k, 12442.9% for AGIs over 200k)
Profit/loss from business: +$20,631 (reported on 20.3% of returns)
Here:
+$20,631
State:
+$10,888
(% of AGI for various income ranges: 90.9% for AGIs below $25k, 193.1% for AGIs $25k-50k, 263.6% for AGIs $50k-75k, 453.0% for AGIs $75k-100k, 726.7% for AGIs $100k-200k, 2924.4% for AGIs over 200k)
Taxable individual retirement arrangement distribution: $30,102 (reported on 12.0% of returns)
76248:
$30,102
Texas:
$24,740
(% of AGI for various income ranges: 53.3% for AGIs below $25k, 178.8% for AGIs $25k-50k, 382.2% for AGIs $50k-75k, 632.0% for AGIs $75k-100k, 993.2% for AGIs $100k-200k, 1663.7% for AGIs over 200k)
Self-employed (Keogh) retirement plans: $24,714 (reported on 1.2% of returns)
76248:
$24,714
Texas:
$29,298
(% of AGI for various income ranges: 37.5% for AGIs $100k-200k, 300.9% for AGIs over 200k)
Total itemized deductions: $39,815 (reported on 21.1% of returns)
Here:
$39,815
State:
$40,428
(% of AGI for various income ranges: 87.2% for AGIs below $25k, 203.5% for AGIs $25k-50k, 494.6% for AGIs $50k-75k, 793.4% for AGIs $75k-100k, 1546.8% for AGIs $100k-200k, 6228.1% for AGIs over 200k)
Charity contributions: $16,091 (reported on 18.8% of returns)
Here:
$16,091
State:
$18,201
(% of AGI for various income ranges: 3.8% for AGIs below $25k, 35.3% for AGIs $25k-50k, 95.9% for AGIs $50k-75k, 161.4% for AGIs $75k-100k, 442.6% for AGIs $100k-200k, 2687.3% for AGIs over 200k)
Taxes paid: $9,065 (reported on 21.0% of returns)
76248:
$9,065
State:
$7,821
(% of AGI for various income ranges: 15.0% for AGIs below $25k, 49.5% for AGIs $25k-50k, 111.0% for AGIs $50k-75k, 224.5% for AGIs $75k-100k, 431.4% for AGIs $100k-200k, 1244.2% for AGIs over 200k)
Earned income credit: $1,959 (reported on 5.6% of returns)
Here:
$1,959
State:
$2,584
(% of AGI for various income ranges: 41.2% for AGIs below $25k, 45.1% for AGIs $25k-50k, 1.1% for AGIs $50k-75k)
Percentage of individuals using paid preparers for their 2020 taxes: 92.9%
Here:
93%
State:
92%
(% for various income ranges: 91.5% for AGIs below $25k, 92.5% for AGIs $25k-50k, 92.1% for AGIs $50k-75k, 92.4% for AGIs $75k-100k, 93.1% for AGIs $100k-200k, 95.0% for AGIs over 200k)
Averages for the 2012 tax year for zip code 76248, filed in 2013:
Average Adjusted Gross Income (AGI) in 2012: $114,703 (Individual Income Tax Returns)
Here:
$114,703
State:
$65,384
Salary/wage: $100,996 (reported on 86.8% of returns)
Here:
$100,996
State:
$52,524
(% of AGI for various income ranges: 78.0% for AGIs below $25k, 75.2% for AGIs $25k-50k, 74.5% for AGIs $50k-75k, 76.7% for AGIs $75k-100k, 84.4% for AGIs $100k-200k, 70.7% for AGIs over 200k)
Taxable interest for individuals: $1,404 (reported on 46.6% of returns)
This zip code:
$1,404
Texas:
$2,372
(% of AGI for various income ranges: 1.6% for AGIs below $25k, 0.7% for AGIs $25k-50k, 1.0% for AGIs $50k-75k, 0.7% for AGIs $75k-100k, 0.3% for AGIs $100k-200k, 0.6% for AGIs over 200k)
Ordinary dividends: $4,464 (reported on 32.1% of returns)
Here:
$4,464
State:
$9,721
(% of AGI for various income ranges: 2.2% for AGIs below $25k, 1.1% for AGIs $25k-50k, 1.5% for AGIs $50k-75k, 1.4% for AGIs $75k-100k, 0.9% for AGIs $100k-200k, 1.4% for AGIs over 200k)
Net capital gain/loss in AGI: +$18,298 (reported on 28.1% of returns)
Here:
+$18,298
State:
+$35,319
(% of AGI for various income ranges: 0.3% for AGIs $25k-50k, 0.5% for AGIs $50k-75k, 0.7% for AGIs $75k-100k, 0.7% for AGIs $100k-200k, 9.0% for AGIs over 200k)
Profit/loss from business: +$19,643 (reported on 19.4% of returns)
Here:
+$19,643
State:
+$13,732
(% of AGI for various income ranges: 7.6% for AGIs below $25k, 4.8% for AGIs $25k-50k, 4.5% for AGIs $50k-75k, 3.1% for AGIs $75k-100k, 3.0% for AGIs $100k-200k, 3.2% for AGIs over 200k)
Taxable individual retirement arrangement distribution: $24,513 (reported on 11.6% of returns)
76248:
$24,513
Texas:
$19,511
(% of AGI for various income ranges: 3.6% for AGIs below $25k, 3.7% for AGIs $25k-50k, 4.0% for AGIs $50k-75k, 4.0% for AGIs $75k-100k, 2.4% for AGIs $100k-200k, 1.9% for AGIs over 200k)
Self-employment retirement plans: $22,406 (reported on 1.1% of returns)
76248:
$22,406
Texas:
$23,938
(% of AGI for various income ranges: 0.4% for AGIs $25k-50k, 0.2% for AGIs $100k-200k, 0.3% for AGIs over 200k)
Total itemized deductions: $27,680 (16% of AGI, reported on 54.3% of returns)
Here:
$27,680
State:
$24,724
Here:
15.6% of AGI
State:
15.9% of AGI
(% of AGI for various income ranges: 14.6% for AGIs below $25k, 13.5% for AGIs $25k-50k, 16.3% for AGIs $50k-75k, 16.6% for AGIs $75k-100k, 15.7% for AGIs $100k-200k, 10.1% for AGIs over 200k)
Charity contributions: $6,425 (reported on 48.4% of returns)
Here:
$6,425
State:
$6,808
(% of AGI for various income ranges: 1.1% for AGIs below $25k, 1.9% for AGIs $25k-50k, 2.4% for AGIs $50k-75k, 2.7% for AGIs $75k-100k, 2.9% for AGIs $100k-200k, 2.8% for AGIs over 200k)
Taxes paid: $9,627 (reported on 54.0% of returns)
76248:
$9,627
State:
$6,921
(% of AGI for various income ranges: 3.2% for AGIs below $25k, 3.8% for AGIs $25k-50k, 5.1% for AGIs $50k-75k, 5.5% for AGIs $75k-100k, 5.7% for AGIs $100k-200k, 3.5% for AGIs over 200k)
Earned income credit: $1,970 (reported on 6.4% of returns)
Here:
$1,970
State:
$2,570
(% of AGI for various income ranges: 3.5% for AGIs below $25k, 0.8% for AGIs $25k-50k)
Percentage of individuals using paid preparers for their 2012 taxes: 45.2%
Here:
45%
State:
51%
(% for various income ranges: 35.7% for AGIs below $25k, 41.3% for AGIs $25k-50k, 48.1% for AGIs $50k-75k, 47.3% for AGIs $75k-100k, 46.5% for AGIs $100k-200k, 61.2% for AGIs over 200k)
Averages for the 2004 tax year for zip code 76248, filed in 2005:
Average Adjusted Gross Income (AGI) in 2004: $74,360 (Individual Income Tax Returns)
Here:
$74,360
State:
$47,881
Salary/wage: $70,998 (reported on 92.1% of returns)
Here:
$70,998
State:
$41,947
(% of AGI for various income ranges: 182.5% for AGIs below $10k, 81.9% for AGIs $10k-25k, 86.7% for AGIs $25k-50k, 89.2% for AGIs $50k-75k, 92.3% for AGIs $75k-100k, 85.9% for AGIs over 100k)
Taxable interest for individuals: $970 (reported on 49.7% of returns)
This zip code:
$970
Texas:
$2,255
(% of AGI for various income ranges: 5.8% for AGIs below $10k, 1.3% for AGIs $10k-25k, 1.0% for AGIs $25k-50k, 0.6% for AGIs $50k-75k, 0.4% for AGIs $75k-100k, 0.6% for AGIs over 100k)
Taxable dividends: $1,299 (reported on 29.3% of returns)
Here:
$1,299
State:
$4,261
(% of AGI for various income ranges: 4.0% for AGIs below $10k, 0.9% for AGIs $10k-25k, 0.6% for AGIs $25k-50k, 0.5% for AGIs $50k-75k, 0.4% for AGIs $75k-100k, 0.5% for AGIs over 100k)
Net capital gain/loss: +$4,074 (reported on 25.5% of returns)
Here:
+$4,074
State:
+$16,110
(% of AGI for various income ranges: -1.5% for AGIs below $10k, 0.3% for AGIs $10k-25k, 0.4% for AGIs $25k-50k, 0.4% for AGIs $50k-75k, 0.2% for AGIs $75k-100k, 2.3% for AGIs over 100k)
Profit/loss from business: +$11,864 (reported on 18.2% of returns)
Here:
+$11,864
State:
+$11,013
(% of AGI for various income ranges: 6.3% for AGIs below $10k, 6.7% for AGIs $10k-25k, 3.6% for AGIs $25k-50k, 2.7% for AGIs $50k-75k, 1.9% for AGIs $75k-100k, 3.0% for AGIs over 100k)
IRA payment deduction: $3,190 (reported on 2.6% of returns)
76248:
$3,190
Texas:
$3,120
(% of AGI for various income ranges: 0.3% for AGIs below $10k, 0.1% for AGIs $10k-25k, 0.2% for AGIs $25k-50k, 0.1% for AGIs $50k-75k, 0.1% for AGIs $75k-100k, 0.1% for AGIs over 100k)
Self-employed pension: $13,459 (reported on 0.8% of returns)
Here:
$13,459
Texas:
$16,401
(% of AGI for various income ranges: 0.1% for AGIs $25k-50k, 0.1% for AGIs $50k-75k, 0.1% for AGIs $75k-100k, 0.2% for AGIs over 100k)
Total itemized deductions: $20,802 (20% of AGI, reported on 59.1% of returns)
Here:
$20,802
State:
$19,631
Here:
20.3% of AGI
State:
18.9% of AGI
(% of AGI for various income ranges: 19.5% for AGIs below $10k, 14.9% for AGIs $10k-25k, 17.4% for AGIs $25k-50k, 19.1% for AGIs $50k-75k, 18.7% for AGIs $75k-100k, 15.1% for AGIs over 100k)
Charity contributions deductions: $3,658 (3% of AGI, reported on 51.9% of returns)
Here:
$3,658
State:
$4,753
Here:
3.4% of AGI
State:
4.2% of AGI
(% of AGI for various income ranges: 1.1% for AGIs below $10k, 1.5% for AGIs $10k-25k, 2.2% for AGIs $25k-50k, 2.6% for AGIs $50k-75k, 2.6% for AGIs $75k-100k, 2.7% for AGIs over 100k)
Total tax: $11,245 (reported on 84.8% of returns)
76248:
$11,245
State:
$9,058
(% of AGI for various income ranges: 5.4% for AGIs below $10k, 4.7% for AGIs $10k-25k, 6.7% for AGIs $25k-50k, 8.0% for AGIs $50k-75k, 9.3% for AGIs $75k-100k, 16.6% for AGIs over 100k)
Earned income credit: $1,643 (reported on 6.5% of returns)
Here:
$1,643
State:
$2,024
Percentage of individuals using paid preparers for their 2004 taxes: 45.1%
Here:
45%
State:
57%
(% for various income ranges: 33.7% for AGIs below $10k, 45.3% for AGIs $10k-25k, 48.2% for AGIs $25k-50k, 45.8% for AGIs $50k-75k, 44.1% for AGIs $75k-100k, 49.1% for AGIs over 100k)
Likely homosexual households (counted as self-reported same-sex unmarried-partner households)
Lesbian couples: 0.0% of all households
Gay men: 0.2% of all households
Household received Food Stamps/SNAP in the past 12 months: 270 Household did not receive Food Stamps/SNAP in the past 12 months: 14,785
Women who had a birth in the past 12 months: 468 (356 now married, 114 unmarried) Women who did not have a birth in the past 12 months: 8,470 (4,940 now married, 3,490 unmarried)
Housing units in zip code 76248 with a mortgage: 8,965 (507 second mortgage, 355 both second mortgage and home equity loan) Houses without a mortgage: 108
Median monthly owner costs for units with a mortgage: $3,002 Median monthly owner costs for units without a mortgage: $1,304
Residents with income below the poverty level in 2022:
This zip code:
3.3%
Whole state:
14.0%
Residents with income below 50% of the poverty level in 2022:
This zip code:
1.8%
Whole state:
7.4%
Median number of rooms in houses and condos:
Here:
8.2
State:
6.3
Median number of rooms in apartments:
Here:
4.3
State:
4.0
Notable locations in this zip code not listed on our city pages
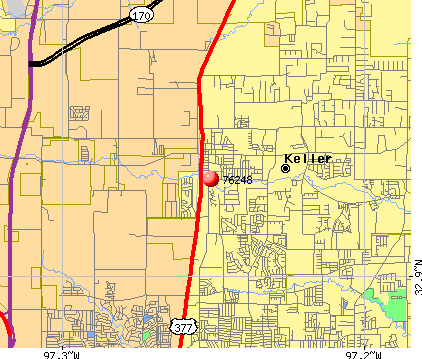
Notable locations in zip code 76248: Keller Fire and Rescue (A), Keller Fire and Rescue Station 3 (B), Keller Fire and Rescue Station 2 (C). Display/hide their locations on the map
Churches in zip code 76248 include: Amazing Grace Fellowship Church (A), Town Oaks Baptist Church (B), Church of God (C), First United Methodist Church of Keller (D), Calvary United Pentecostal Church (E), Mount Gilead Church (F). Display/hide their locations on the map
9,212 married couples with children.
1,332 single-parent households (652 men, 680 women).
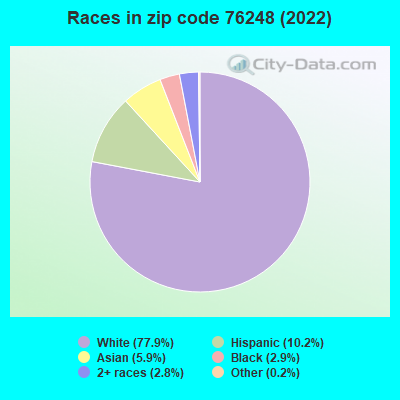
86.3% of residents of 76248 zip code speak English at home.
6.3% of residents speak Spanish at home (77% very well, 16% well, 6% not well).
3.4% of residents speak other Indo-European language at home (92% very well, 6% well, 3% not well).
2.9% of residents speak Asian or Pacific Island language at home (69% very well, 23% well, 7% not well, 1% not at all).
1.4% of residents speak other language at home (68% very well, 32% well).
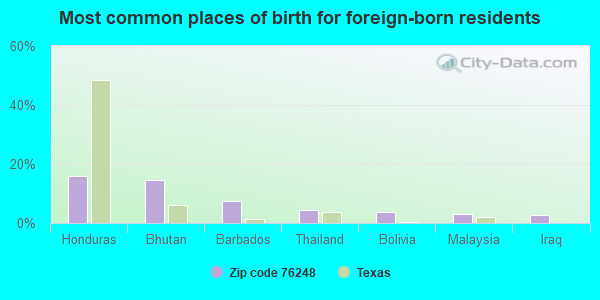
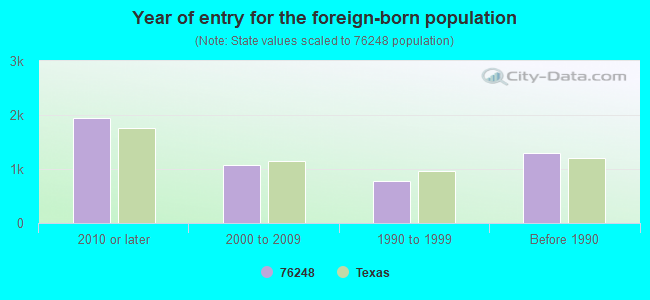
Foreign born population: 4,379 (10.6%) (63.5% of them are naturalized citizens)
Housing units lacking complete plumbing facilities: 0.1% Housing units lacking complete kitchen facilities: 0.2%
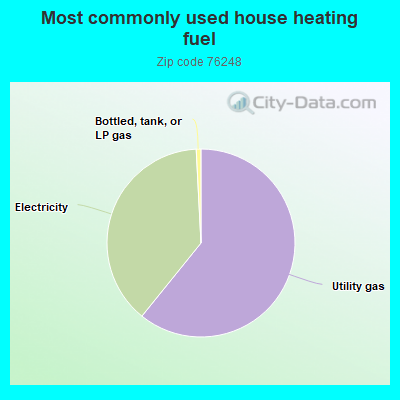
60.7%Utility gas
38.3%Electricity
0.8%Bottled, tank, or LP gas
Population in 1990: 14,313. Population change in the 1990s: +13,611 (+95.1%).
Place of birth for U.S.-born residents:
This state: 17,641
Northeast: 3,196
Midwest: 5,699
South: 5,359
West: 4,566
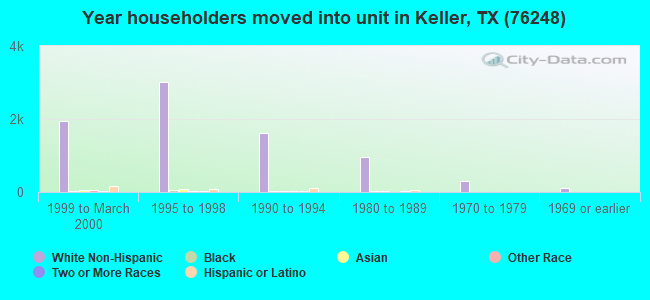
42% of the 76248 zip code residents lived in the same house 5 years ago. Out of people who lived in different houses, 41% lived in this county. Out of people who lived in different counties, 50% lived in Texas.
91% of the 76248 zip code residents lived in the same house 1 year ago. Out of people who lived in different houses, 45% moved from this county. Out of people who lived in different houses, 21% moved from different county within same state. Out of people who lived in different houses, 36% moved from different state. Out of people who lived in different houses, 1% moved from abroad.
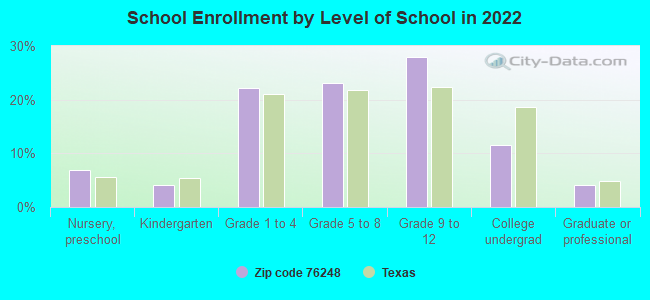
Private vs. public school enrollment:
Students in private schools in grades 1 to 8 (elementary and middle school): 741
Here:
13.5%
Texas:
8.8%
Students in private schools in grades 9 to 12 (high school): 352
Here:
10.4%
Texas:
8.0%
Students in private undergraduate colleges: 210
Here:
15.2%
Texas:
16.2%
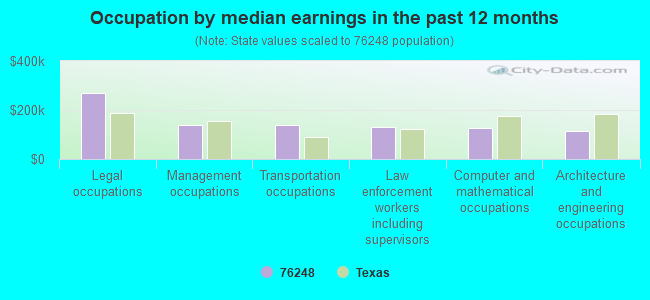
Occupation by median earnings in the past 12 months ($)
269,524Legal occupations
139,241Management occupations
137,646Transportation occupations
128,928Law enforcement workers including supervisors
124,809Computer and mathematical occupations
115,469Architecture and engineering occupations
Companies with federal contracts located in this zip code (KELLER, TX):
HASTECH SOLUTIONS, INC (921 RIDGE CT; small business) : $1,984,251 in 58 contractsfrom 2001 to 2006
Contracts for Conveyors, Other Cargo and Freight Services, Generators and Generators Sets, Electrical, Miscellaneous Special Industry Machinery, and moreby Navy, Air Force, U.S. Coast Guard, Bureau of Prisoners/Federal Prison System, and others Signed by year:2000: $0; 2001: $153,095; 2002: $311,167; 2003: $384,843; 2004: $788,412; 2005: $466,752; 2006: -$120,018.
Biggest contracts:
$277,167 with Navy for Conveyors. Signed on 2002-02-01. Completion date: 2002-04-15.
$145,086 with Air Force for Other Cargo and Freight Services. Signed on 2005-04-15. Completion date: 2005-07-08.
$121,908 with Navy for Generators and Generators Sets, Electrical. Signed on 2004-09-28. Completion date: 2004-12-02.
$107,706 with Air Force for Miscellaneous Special Industry Machinery. Signed on 2003-03-10. Completion date: 2003-04-25.
GOVISION, L P (133 SPORTS PKWY; small business) : $44,750 in 3 contractsfrom 2005 to 2006
$19,000 with Air Force for Lease or Rental of Equipment -- Photographic Equipment. Taking place in OK. Signed on 2005-06-22. Completion date: 2005-07-02.
$14,500, same as above.Signed on 2006-06-14. Completion date: 2006-07-05.
$11,250 with Army for Lease or Rental of Equipment -- Electrical and Electronic Equipment Components. Signed on 2005-04-26. Completion date: 2005-04-12.
ERIN TANSKI (417 MOONLIGHT LANE; small business) : $43,448 in 13 contractsfrom 2001 to 2004
Contracts for Technical Assistance by Army, U.S. Army Corps of Engineers - civil program financing only Signed by year:2000: $0; 2001: $4,716; 2002: $8,310; 2003: $19,133; 2004: $11,289; 2005: $0; 2006: $0.
Biggest contracts:
$9,896 with Army for Technical Assistance. Taking place in MS. Signed on 2004-02-26. Completion date: 2004-09-30.
$9,163, same as above.Signed on 2003-10-23. Completion date: 2004-09-30.
$4,716 with U.S. Army Corps of Engineers - civil program financing only for Technical Assistance. Taking place in MS. Signed on 2001-10-10. Completion date: 2001-11-01.
$3,665 with U.S. Army Corps of Engineers - civil program financing only for Technical Assistance. Signed on 2002-04-04. Completion date: 2002-09-30.
ALMAND, TODD (513 IRONWOOD DR; small business) : $40,981 in 13 contractsfrom 2004 to 2006
Contracts for Recreational Services, Other Professional Services, Other Social Services by Air Force Signed by year:2000: $0; 2001: $0; 2002: $0; 2003: $0; 2004: $2,000; 2005: $22,800; 2006: $16,181.
Biggest contracts:
$10,050 with Air Force for Recreational Services. Taking place in MS. Signed on 2006-04-10. Completion date: 2006-05-01.
$7,200 with Air Force for Recreational Services. Signed on 2005-11-18. Completion date: 2005-11-14.
$6,120 with Air Force for Recreational Services. Taking place in MO. Signed on 2005-08-26. Completion date: 2005-09-05.
$4,800 with Air Force for Recreational Services. Taking place in LA. Signed on 2006-04-21. Completion date: 2006-05-14.
PARALLEL INNOVATIONS (922 CAT HOLLOW CRT; small business)
$19,993 with Navy for Other Community Services and Development -- Basic Research (R&D). Signed on 2003-10-01. Completion date: 2003-12-12.
LOGO2U COM (1509 HIGHLAND OAKS DR; small business) : $8,891 in 2 contractsfrom 2004 to 2005
$6,286 with Army for Clothing, Special Purpose. Signed on 2005-08-25. Completion date: 2005-09-30.
$2,605 with Army for Outerwear, Men's. Signed on 2004-02-11. Completion date: 2004-02-27.
Top industries in this zip code by the number of employees in 2005:
2002 - 2018 National Fire Incident Reporting System (NFIRS) incidents
Based on the data from the years 2002 - 2018 the average number of fires per year is 131. The highest number of fire incidents - 245 took place in 2008, and the least - 80 in 2002. The data has a growing trend.
When looking into fire subcategories, the most incidents belonged to: Structure Fires (45.4%), and Outside Fires (41.5%).
Fire incident types reported to NFIRS in Zip Code 76248


 Nearest zip codes: 76182, 76244, 76148, 76054, 76034, 76180.


 : $1,984,251 in 58 contracts from 2001 to 2006
 Based on the data from the years 2002 - 2018 the average number of fires per year is 131. The highest number of fire incidents - 245 took place in 2008, and the least - 80 in 2002. The data has a growing trend.
 When looking into fire subcategories, the most incidents belonged to: Structure Fires (45.4%), and Outside Fires (41.5%).