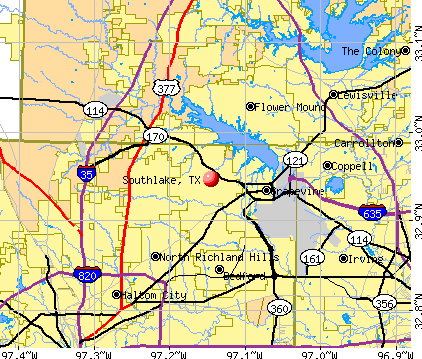
Southlake, Texas
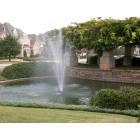
Southlake: Casual elegance abounds in Southlake
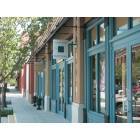
Southlake: Southlake Town Center
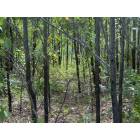
Southlake: Bob Jones Park
- add
your
Submit your own pictures of this city and show them to the world
- OSM Map
- General Map
- Google Map
- MSN Map
Population change since 2000: +44.5%
| Males: 15,231 | |
| Females: 15,871 |
| Median resident age: | 42.5 years |
| Texas median age: | 35.6 years |
Zip codes: 76092.
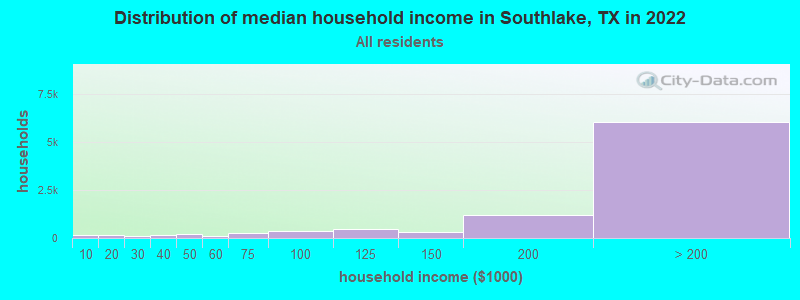
| Southlake: | over $200,000 |
| TX: | $72,284 |
Estimated per capita income in 2022: $109,587 (it was $47,597 in 2000)
Southlake city income, earnings, and wages data
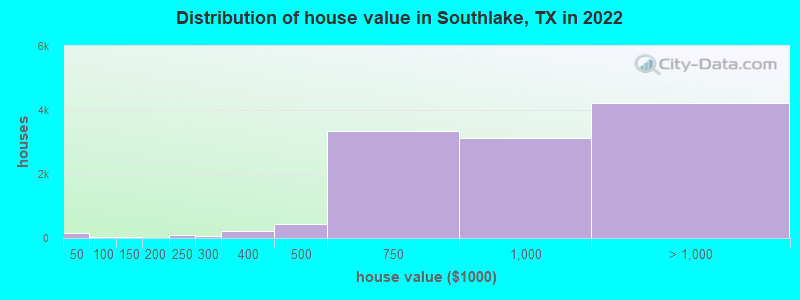
Estimated median house or condo value in 2022: $989,767 (it was $337,400 in 2000)
| Southlake: | $989,767 |
| TX: | $275,400 |
Mean prices in 2022: all housing units: over $1,000,000; detached houses: over $1,000,000; townhouses or other attached units: $608,728; in 5-or-more-unit structures: $379,430; mobile homes: $214,693
Median gross rent in 2022: $2,586.
(2.3% for White Non-Hispanic residents, 0.7% for Hispanic or Latino residents, 1.4% for two or more races residents)
Detailed information about poverty and poor residents in Southlake, TX


Compare current foreclosures near Southlake, TX:
| Photo | Address | Area | Beds / Baths | Price | Details |
|---|---|---|---|---|---|

|
#1
Marshall Rd
Southlake, TX 76092
|
4,977 sq. feet
|
5 baths 5 beds |
show details | |

|
#2
Florence Rd
Southlake, TX 76092
|
2,490 sq. feet
|
3 baths 4 beds |
show details | |

|
#3
Emerald Blvd
Southlake, TX 76092
|
4,120 sq. feet
|
4 baths 4 beds |
show details | |

|
#4
Dove Creek Trl
Southlake, TX 76092
|
3,436 sq. feet
|
3 baths 4 beds |
show details | |

|
#5
Kensington Ct
Southlake, TX 76092
|
3,266 sq. feet
|
2 baths 3 beds |
show details | |

|
#6
Briarridge Rd
Southlake, TX 76092
|
4,290 sq. feet
|
2 baths 3 beds |
show details | |

|
#7
San Juan Dr
Southlake, TX 76092
|
3,647 sq. feet
|
3 baths 5 beds |
show details | |

|
#8
Aurora Ct
Southlake, TX 76092
|
3,601 sq. feet
|
3 baths 5 beds |
show details | |

|
#9
Glen Cv
Southlake, TX 76092
|
2,422 sq. feet
|
3 baths 4 beds |
show details | |

|
#10
E Dove Rd
Southlake, TX 76092
|
1,352 sq. feet
|
2 baths 3 beds |
show details |
| Photo | Address | Area | Beds / Baths | Price | Details |
|---|---|---|---|---|---|

|
#11
Bay Meadows Dr
Southlake, TX 76092
|
4,421 sq. feet
|
4 baths 5 beds |
show details | |

|
#12
Oakhurst Dr
Southlake, TX 76092
|
- sq. feet
|
- baths - beds |
show details | |

|
#13
Reserve St, Ste 190
Southlake, TX 76092
|
- sq. feet
|
- baths - beds |
show details | |

|
#14
Dean Way
Southlake, TX 76092
|
- sq. feet
|
- baths - beds |
show details | |

|
#15
S Nolen Dr
Southlake, TX 76092
|
- sq. feet
|
- baths - beds |
show details | |

|
#16
Park Vista Cir
Southlake, TX 76092
|
- sq. feet
|
- baths - beds |
show details | |

|
#17
Dean Way
Southlake, TX 76092
|
- sq. feet
|
- baths - beds |
show details | |

|
#18
E State Highway 114 # 300
Southlake, TX 76092
|
- sq. feet
|
- baths - beds |
show details | |

|
#19
State St Ste 225
Southlake, TX 76092
|
- sq. feet
|
- baths - beds |
show details | |

|
#20
State St # 300
Southlake, TX 76092
|
- sq. feet
|
- baths - beds |
show details |
| Photo | Address | Area | Beds / Baths | Price | Details |
|---|---|---|---|---|---|

|
#21
Marie Cir
Southlake, TX 76092
|
- sq. feet
|
- baths - beds |
show details | |

|
#22
N Carroll Ave Ste 160
Southlake, TX 76092
|
- sq. feet
|
- baths - beds |
show details | |

|
#23
E Southlake Blvd, Ste 120 # 382
Southlake, TX 76092
|
- sq. feet
|
- baths - beds |
show details | |

|
#24
Main St Ste 200
Southlake, TX 76092
|
- sq. feet
|
- baths - beds |
show details | |

|
#25
Demarsh Lane
Denton, TX 76210
|
3,576 sq. feet
|
3 baths 4 beds |
$589,900
|
show details |

|
#26
Clariden Ranch Rd
Southlake, TX 76092
|
- sq. feet
|
- baths - beds |
show details | |

|
#27
Coyote Rd
Southlake, TX 76092
|
- sq. feet
|
- baths - beds |
show details | |

|
#28
Simmons Ct
Southlake, TX 76092
|
- sq. feet
|
- baths - beds |
show details | |

|
#29
Roberts Cir
Arlington, TX 76010
|
3,030 sq. feet
|
4 baths 8 beds |
show details | |

|
#30
Carrier Pl
Grand Prairie, TX 75050
|
2,099 sq. feet
|
2 baths 3 beds |
show details |
| Photo | Address | Area | Beds / Baths | Price | Details |
|---|---|---|---|---|---|

|
#31
Brett Jackson Rd
Fort Worth, TX 76179
|
600 sq. feet
|
1 baths 1 beds |
show details | |

|
#32
Ponder Dr
Dallas, TX 75229
|
2,254 sq. feet
|
2 baths 3 beds |
show details | |

|
#33
Thistle Sage Ct
Irving, TX 75063
|
1,557 sq. feet
|
3 baths 3 beds |
show details | |

|
#34
Dublin Dr
Carrollton, TX 75006
|
2,267 sq. feet
|
2 baths 4 beds |
show details | |

|
#35
Little Ranch Rd
North Richland Hills, TX 76182
|
2,889 sq. feet
|
3 baths 5 beds |
show details | |

|
#36
N Park Dr
Fort Worth, TX 76148
|
1,513 sq. feet
|
2 baths 3 beds |
show details | |

|
#37
Cooper Creek Street
Fort Worth, TX 76179
|
3,335 sq. feet
|
3 baths 5 beds |
show details | |

|
#38
Haverly Court
Keller, TX 76244
|
3,279 sq. feet
|
3 baths 4 beds |
show details | |

|
#39
Chimney Hill Dr
Arlington, TX 76012
|
3,206 sq. feet
|
3 baths 4 beds |
show details | |

|
#40
Cactus Flower Dr
Fort Worth, TX 76131
|
2,071 sq. feet
|
2 baths 4 beds |
show details |
| Photo | Address | Area | Beds / Baths | Price | Details |
|---|---|---|---|---|---|

|
#41
Apalachee Trl
Fort Worth, TX 76179
|
2,564 sq. feet
|
2 baths 3 beds |
show details | |

|
#42
Melbourn St
Haltom City, TX 76117
|
968 sq. feet
|
1 baths 2 beds |
show details | |

|
#43
Ramada Trl
Justin, TX 76247
|
2,609 sq. feet
|
2 baths 4 beds |
show details | |

|
#44
Katrine Ct
Haltom City, TX 76117
|
1,338 sq. feet
|
1 baths 3 beds |
show details | |

|
#45
Leahy Dr
Dallas, TX 75229
|
2,231 sq. feet
|
3 baths 5 beds |
show details | |

|
#46
Gillespie Drive
Justin, TX 76247
|
- sq. feet
|
2 baths 3 beds |
show details | |

|
#47
Leather Strap Dr
Haslet, TX 76052
|
3,021 sq. feet
|
2 baths 4 beds |
show details | |

|
#48
Bursey Rd
North Richland Hills, TX 76182
|
2,696 sq. feet
|
3 baths 4 beds |
show details | |

|
#49
Brazos Dr
Carrollton, TX 75007
|
- sq. feet
|
2 baths 3 beds |
show details | |

|
Check over 1 million property listings on Foreclosure.com!
|
browse all offers | |||


- 20,85566.5%White alone
- 5,50517.5%Asian alone
- 2,8519.1%Hispanic
- 1,1713.7%Two or more races
- 4201.3%Black alone
- 140.04%Other race alone
- 50.02%American Indian alone
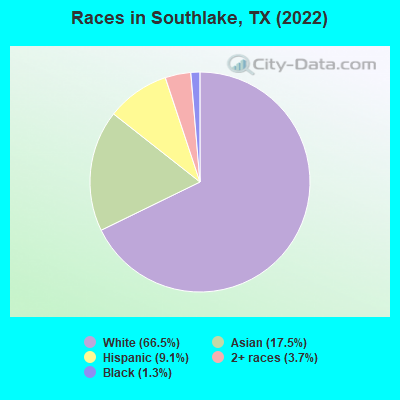
Races in Southlake detailed stats: ancestries, foreign born residents, place of birth
According to our research of Texas and other state lists, there was 1 registered sex offender living in Southlake, Texas as of April 27, 2024.
The ratio of all residents to sex offenders in Southlake is 30,137 to 1.
The ratio of registered sex offenders to all residents in this city is much lower than the state average.
Type |
2009 |
2010 |
2011 |
2012 |
2013 |
2014 |
2015 |
2016 |
2017 |
2018 |
2019 |
2020 |
2021 |
2022 |
|---|---|---|---|---|---|---|---|---|---|---|---|---|---|---|
| Murders (per 100,000) | 0 (0.0) | 0 (0.0) | 0 (0.0) | 1 (3.6) | 1 (3.6) | 0 (0.0) | 0 (0.0) | 2 (6.5) | 0 (0.0) | 0 (0.0) | 0 (0.0) | 0 (0.0) | 0 (0.0) | 1 (3.2) |
| Rapes (per 100,000) | 0 (0.0) | 1 (3.8) | 0 (0.0) | 0 (0.0) | 0 (0.0) | 0 (0.0) | 1 (3.4) | 0 (0.0) | 2 (6.3) | 3 (9.2) | 0 (0.0) | 2 (6.0) | 1 (3.0) | 6 (19.4) |
| Robberies (per 100,000) | 3 (11.0) | 3 (11.3) | 4 (14.7) | 5 (18.1) | 2 (7.1) | 1 (3.5) | 1 (3.4) | 4 (13.1) | 4 (12.6) | 4 (12.3) | 5 (15.1) | 6 (18.1) | 2 (6.1) | 3 (9.7) |
| Assaults (per 100,000) | 10 (36.8) | 12 (45.2) | 4 (14.7) | 4 (14.5) | 11 (39.2) | 6 (20.9) | 8 (26.9) | 13 (42.4) | 15 (47.2) | 4 (12.3) | 5 (15.1) | 6 (18.1) | 4 (12.2) | 6 (19.4) |
| Burglaries (per 100,000) | 99 (364.1) | 139 (523.0) | 58 (213.8) | 73 (264.5) | 78 (278.0) | 56 (195.5) | 37 (124.5) | 52 (169.7) | 56 (176.2) | 21 (64.3) | 30 (90.8) | 27 (81.6) | 37 (112.4) | 28 (90.5) |
| Thefts (per 100,000) | 401 (1,475) | 390 (1,468) | 400 (1,474) | 409 (1,482) | 365 (1,301) | 352 (1,229) | 304 (1,023) | 330 (1,077) | 311 (978.7) | 414 (1,268) | 337 (1,020) | 182 (550.1) | 257 (781.0) | 335 (1,082) |
| Auto thefts (per 100,000) | 12 (44.1) | 12 (45.2) | 4 (14.7) | 3 (10.9) | 13 (46.3) | 6 (20.9) | 12 (40.4) | 14 (45.7) | 5 (15.7) | 15 (46.0) | 20 (60.5) | 27 (81.6) | 12 (36.5) | 13 (42.0) |
| Arson (per 100,000) | 1 (3.7) | 2 (7.5) | 2 (7.4) | 5 (18.1) | 1 (3.6) | 0 (0.0) | 0 (0.0) | 0 (0.0) | 0 (0.0) | 0 (0.0) | 0 (0.0) | 0 (0.0) | 1 (3.0) | 0 (0.0) |
| City-Data.com crime index | 98.7 | 114.4 | 82.5 | 94.3 | 92.3 | 69.8 | 61.9 | 84.1 | 71.0 | 72.4 | 59.5 | 48.2 | 48.7 | 81.7 |
The City-Data.com crime index weighs serious crimes and violent crimes more heavily. Higher means more crime, U.S. average is 246.1. It adjusts for the number of visitors and daily workers commuting into cities.
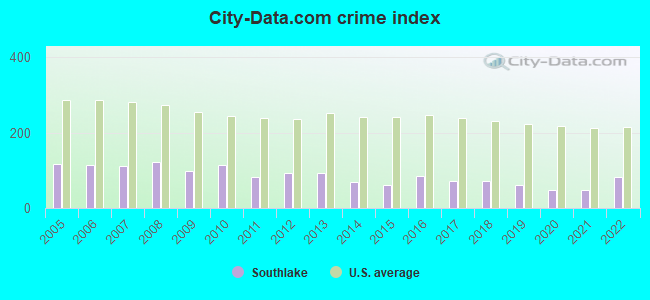
Crime rate in Southlake detailed stats: murders, rapes, robberies, assaults, burglaries, thefts, arson
Full-time law enforcement employees in 2021, including police officers: 68 (60 officers - 52 male; 8 female).
| Officers per 1,000 residents here: | 1.82 |
| Texas average: | 2.07 |
 Recent articles from our blog. Our writers, many of them Ph.D. graduates or candidates, create easy-to-read articles on a wide variety of topics.

 | Southlake ISD vs University Park ISD (85 replies) |
| Southlake - How easy it was for transplants to make friends? (55 replies) |
| Southlake vs Fort Worth privates (26 replies) |
| Struck out in Southlake looking for options (16 replies) |
| Colleyville, Aledo, or Southlake (16 replies) |
| Here looking for neighborhoods in Keller, Southlake, Flower Mound, Colleyville (20 replies) |
Latest news from Southlake, TX collected exclusively by city-data.com from local newspapers, TV, and radio stations
Southlake, TX City Guides:
Ancestries: English (13.7%), German (8.2%), American (7.6%), Irish (5.7%), European (2.8%), Italian (2.3%).
Current Local Time: CST time zone
Land area: 21.9 square miles.
Population density: 1,421 people per square mile (low).
5,067 residents are foreign born (8.7% Asia, 3.0% Europe, 2.8% Latin America).
| This city: | 16.2% |
| Texas: | 17.1% |
Median real estate property taxes paid for housing units with mortgages in 2022: $10,402 (1.0%)
Median real estate property taxes paid for housing units with no mortgage in 2022: $10,374 (1.2%)
Nearest city with pop. 50,000+: Northeast Tarrant, TX (5.7 miles  , pop. 402,130).
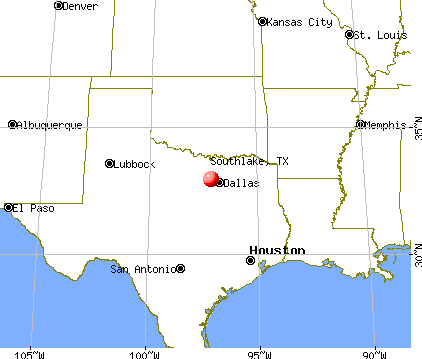
Nearest city with pop. 1,000,000+: Dallas, TX (23.2 miles , pop. 1,188,580).
Nearest cities:
), ), ), Latitude: 32.95 N, Longitude: 97.15 W
Daytime population change due to commuting: +14,340 (+45.7%)
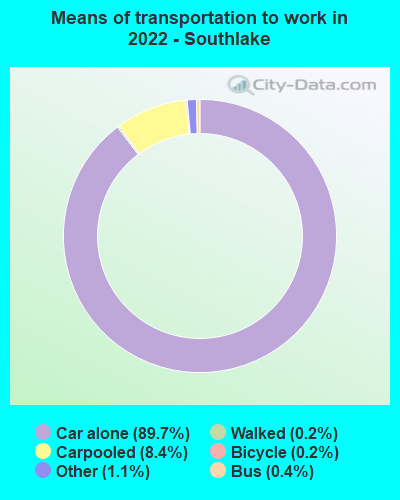
Workers who live and work in this city: 5,864 (44.0%)
Area code commonly used in this area: 817
Property values in Southlake, TX
Southlake tourist attractions:
Southlake, Texas accommodation & food services, waste management - Economy and Business Data
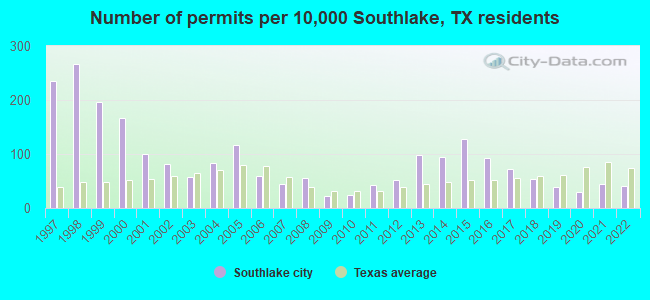
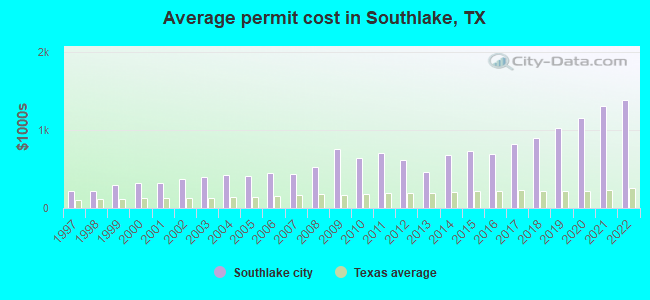
Single-family new house construction building permits:
- 2022: 89 buildings, average cost: $1,387,700
- 2021: 96 buildings, average cost: $1,313,900
- 2020: 64 buildings, average cost: $1,157,500
- 2019: 84 buildings, average cost: $1,028,900
- 2018: 117 buildings, average cost: $898,000
- 2017: 157 buildings, average cost: $817,500
- 2016: 199 buildings, average cost: $698,800
- 2015: 273 buildings, average cost: $730,500
- 2014: 202 buildings, average cost: $684,500
- 2013: 210 buildings, average cost: $465,000
- 2012: 110 buildings, average cost: $614,800
- 2011: 92 buildings, average cost: $700,900
- 2010: 54 buildings, average cost: $644,900
- 2009: 49 buildings, average cost: $763,200
- 2008: 118 buildings, average cost: $530,500
- 2007: 96 buildings, average cost: $438,400
- 2006: 129 buildings, average cost: $448,400
- 2005: 252 buildings, average cost: $411,600
- 2004: 180 buildings, average cost: $422,500
- 2003: 124 buildings, average cost: $396,200
- 2002: 176 buildings, average cost: $374,600
- 2001: 215 buildings, average cost: $326,300
- 2000: 359 buildings, average cost: $325,000
- 1999: 422 buildings, average cost: $293,000
- 1998: 575 buildings, average cost: $216,700
- 1997: 505 buildings, average cost: $216,700
| Here: | 3.0% |
| Texas: | 3.5% |
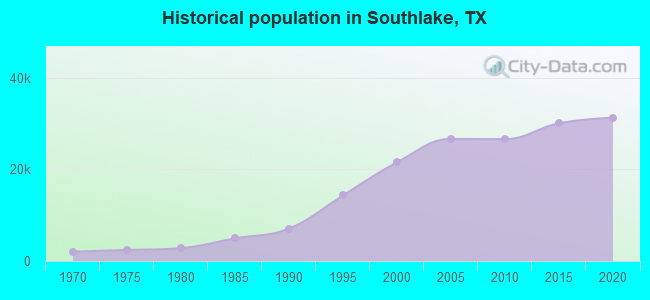
Population change in the 1990s: +14,326 (+199.2%).
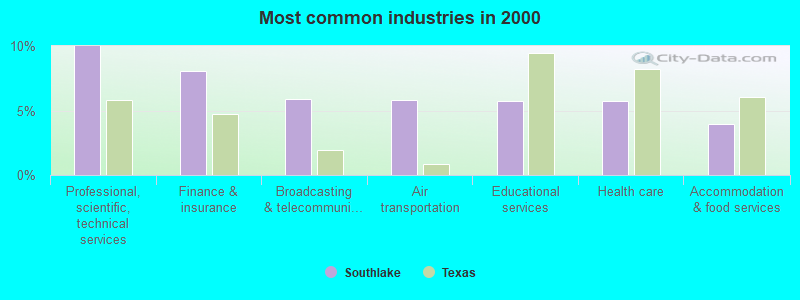
- Professional, scientific, technical services (10.0%)
- Finance & insurance (8.1%)
- Broadcasting & telecommunications (5.9%)
- Air transportation (5.8%)
- Educational services (5.8%)
- Health care (5.8%)
- Accommodation & food services (4.0%)
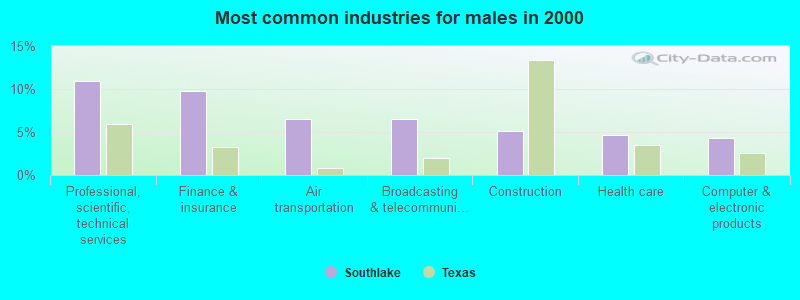
- Professional, scientific, technical services (11.0%)
- Finance & insurance (9.7%)
- Air transportation (6.5%)
- Broadcasting & telecommunications (6.5%)
- Construction (5.1%)
- Health care (4.7%)
- Computer & electronic products (4.2%)
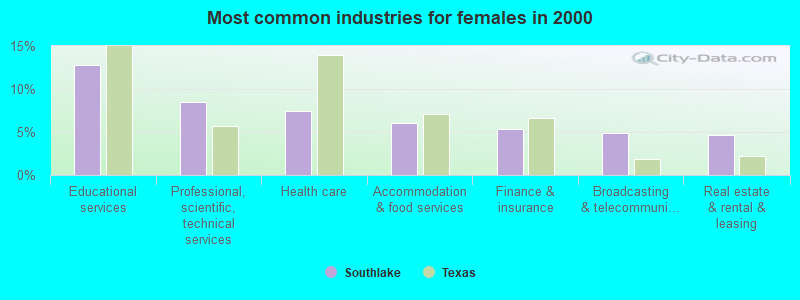
- Educational services (12.8%)
- Professional, scientific, technical services (8.5%)
- Health care (7.5%)
- Accommodation & food services (6.0%)
- Finance & insurance (5.4%)
- Broadcasting & telecommunications (4.9%)
- Real estate & rental & leasing (4.7%)
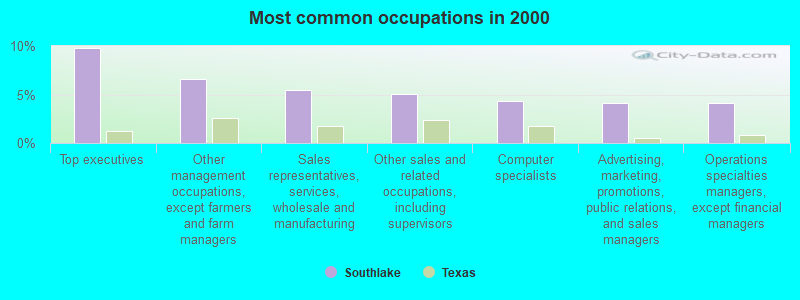
- Top executives (9.8%)
- Other management occupations, except farmers and farm managers (6.6%)
- Sales representatives, services, wholesale and manufacturing (5.4%)
- Other sales and related occupations, including supervisors (5.0%)
- Computer specialists (4.4%)
- Advertising, marketing, promotions, public relations, and sales managers (4.2%)
- Operations specialties managers, except financial managers (4.1%)
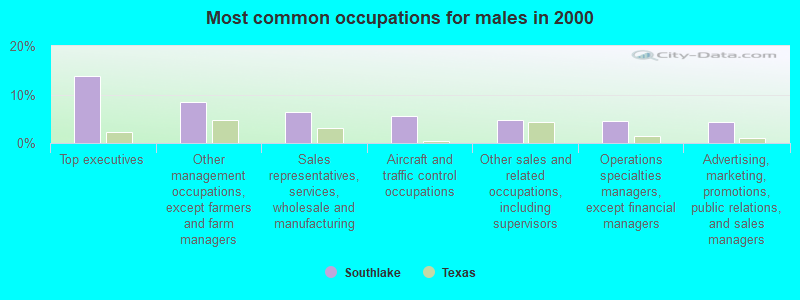
- Top executives (13.9%)
- Other management occupations, except farmers and farm managers (8.4%)
- Sales representatives, services, wholesale and manufacturing (6.5%)
- Aircraft and traffic control occupations (5.6%)
- Other sales and related occupations, including supervisors (4.6%)
- Operations specialties managers, except financial managers (4.5%)
- Advertising, marketing, promotions, public relations, and sales managers (4.4%)

- Preschool, kindergarten, elementary, and middle school teachers (6.8%)
- Other sales and related occupations, including supervisors (5.6%)
- Other office and administrative support workers, including supervisors (5.6%)
- Secretaries and administrative assistants (5.4%)
- Computer specialists (4.6%)
- Retail sales workers, except cashiers (3.8%)
- Sales representatives, services, wholesale and manufacturing (3.8%)
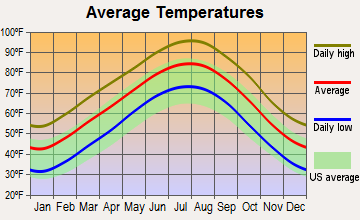
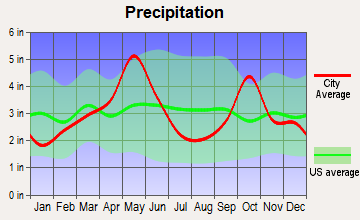
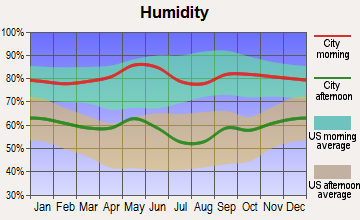
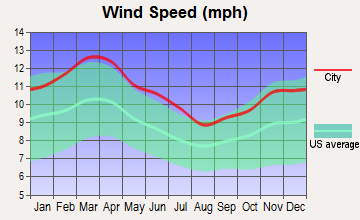
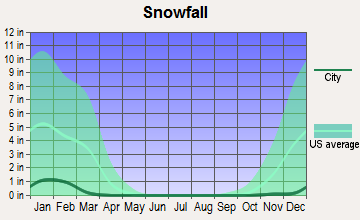
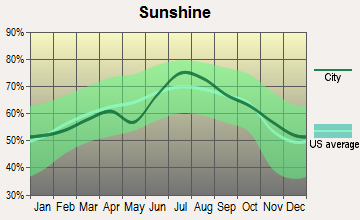
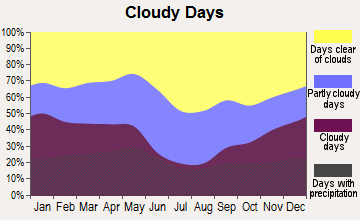
Average climate in Southlake, Texas
Based on data reported by over 4,000 weather stations
|
|


(lower is better)
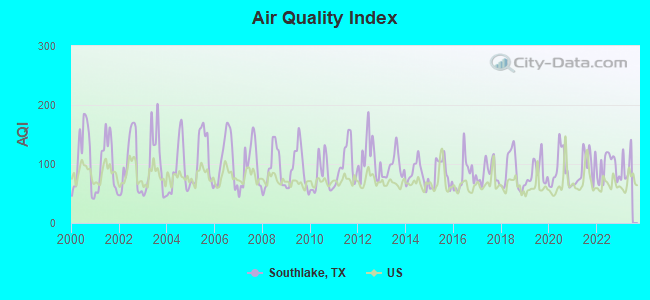
Air Quality Index (AQI) level in 2022 was 94.9. This is worse than average.
| City: | 94.9 |
| U.S.: | 72.6 |
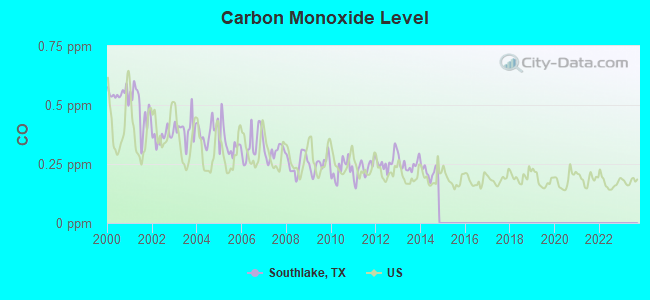
Carbon Monoxide (CO) [ppm] level in 2014 was 0.219. This is about average. Closest monitor was 15.7 miles away from the city center.
| City: | 0.219 |
| U.S.: | 0.251 |
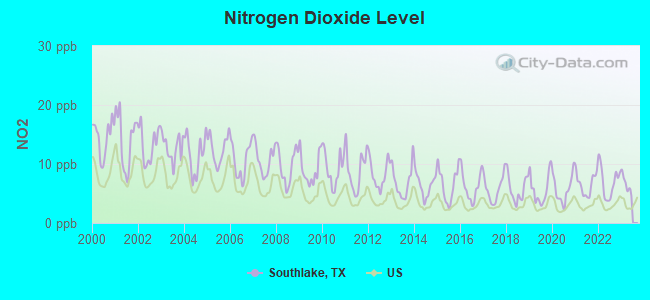
Nitrogen Dioxide (NO2) [ppb] level in 2022 was 6.92. This is worse than average. Closest monitor was 5.2 miles away from the city center.
| City: | 6.92 |
| U.S.: | 5.11 |
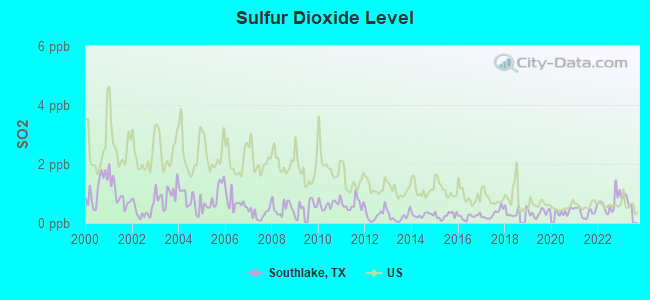
Sulfur Dioxide (SO2) [ppb] level in 2022 was 0.679. This is significantly better than average. Closest monitor was 5.2 miles away from the city center.
| City: | 0.679 |
| U.S.: | 1.515 |

Ozone [ppb] level in 2022 was 30.5. This is about average. Closest monitor was 12.1 miles away from the city center.
| City: | 30.5 |
| U.S.: | 33.3 |
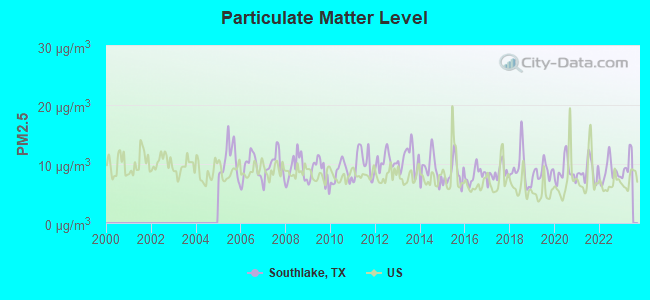
Particulate Matter (PM2.5) [µg/m3] level in 2022 was 8.62. This is about average. Closest monitor was 15.7 miles away from the city center.
| City: | 8.62 |
| U.S.: | 8.11 |
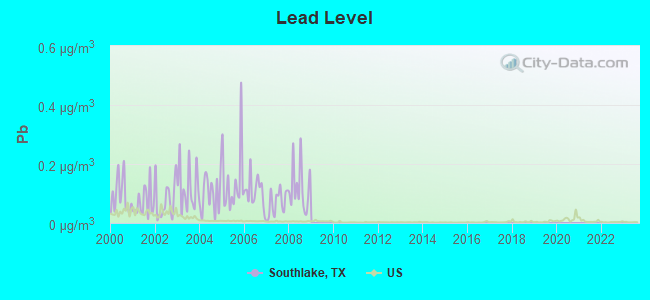
Lead (Pb) [µg/m3] level in 2008 was 0.121. This is significantly worse than average. Closest monitor was 5.2 miles away from the city center.
| City: | 0.121 |
| U.S.: | 0.009 |
Tornado activity:
Southlake-area historical tornado activity is above Texas state average. It is 152% greater than the overall U.S. average.
On 4/25/1994, a category F4 (max. wind speeds 207-260 mph) tornado 33.2 miles away from the Southlake city center killed 3 people and injured 48 people and caused between $50,000,000 and $500,000,000 in damages.
On 5/4/1960, a category F3 (max. wind speeds 158-206 mph) tornado 12.0 miles away from the city center injured 12 people and caused between $50,000 and $500,000 in damages.
Earthquake activity:
Southlake-area historical earthquake activity is significantly above Texas state average. It is 488% greater than the overall U.S. average.On 11/6/2011 at 03:53:10, a magnitude 5.7 (5.7 MW, Depth: 3.2 mi, Class: Moderate, Intensity: VI - VII) earthquake occurred 180.1 miles away from the city center
On 9/3/2016 at 12:02:44, a magnitude 5.8 (5.8 MW, Depth: 3.5 mi) earthquake occurred 240.9 miles away from Southlake center
On 6/16/1978 at 11:46:54, a magnitude 5.3 (4.4 MB, 4.6 UK, 5.3 ML) earthquake occurred 210.1 miles away from Southlake center
On 11/7/2016 at 01:44:24, a magnitude 5.0 (5.0 MW, Depth: 2.8 mi) earthquake occurred 211.4 miles away from the city center
On 5/17/2012 at 08:12:00, a magnitude 4.8 (4.8 MW, Depth: 3.1 mi, Class: Light, Intensity: IV - V) earthquake occurred 176.8 miles away from Southlake center
On 11/8/2011 at 02:46:57, a magnitude 4.8 (4.8 MW, Depth: 3.1 mi) earthquake occurred 179.9 miles away from the city center
Magnitude types: body-wave magnitude (MB), local magnitude (ML), moment magnitude (MW)
Natural disasters:
The number of natural disasters in Tarrant County (23) is greater than the US average (15).Major Disasters (Presidential) Declared: 10
Emergencies Declared: 10
Causes of natural disasters: Storms: 8, Floods: 7, Hurricanes: 7, Fires: 6, Tornadoes: 5, Wind: 1, Other: 2 (Note: some incidents may be assigned to more than one category).
Main business address for: SABRE HOLDINGS CORP (SERVICES-COMPUTER PROCESSING & DATA PREPARATION).
Hospitals and medical centers in Southlake:
- BROOKWOOD I (2900 BROOKWOOD LN)
- BROOKWOOD I I I (2410 TAYLOR ST)
- TEXAS HEALTH HARRIS METHODIST HOSPITAL SOUTHLAKE (Government - State, provides emergency services, 1545 E SOUTHLAKE BLVD)
- THE CARLYLE AT STONEBRIDGE PARK (170 STONEBRIDGE LANE)
- DIALYSIS SERVICES OF GRAPEVINE (1601 HART COURT)
- AAA HOME HEALTHCARE INC (1227 WOODSEY CT)
- RADIANT HEALTHCARE SERVICES LLC (2815 EXCHANGE BOULEVARD SUITE 400)
Airports located in Southlake:
- Lazy K Acres Airport (0TX7) (Runways: 1)
Amtrak station near Southlake:
Colleges/universities with over 2000 students nearest to Southlake:
- DeVry University-Texas (about 8 miles; Irving, TX; Full-time enrollment: 4,098)
- North Lake College (about 12 miles; Irving, TX; FT enrollment: 6,191)
- University of Dallas (about 15 miles; Irving, TX; FT enrollment: 2,192)
- The University of Texas at Arlington (about 16 miles; Arlington, TX; FT enrollment: 27,453)
- Brookhaven College (about 18 miles; Farmers Branch, TX; FT enrollment: 6,868)
- Tarrant County College District (about 18 miles; Fort Worth, TX; FT enrollment: 33,775)
- University of North Texas (about 19 miles; Denton, TX; FT enrollment: 31,694)
Public high schools in Southlake:
- CARROLL SENIOR H S (Students: 1,229, Location: 1501 W SOUTHLAKE BLVD, Grades: 11-12)
- GEORGE DAWSON MIDDLE (Students: 686, Location: 400 S KIMBALL AVE, Grades: 7-9)
- CARROLL H S (Location: 800 WHITE CHAPEL BLVD, Grades: 9-10)
Private high school in Southlake:
Public elementary/middle schools in Southlake:
- JACK D JOHNSON EL (Students: 690, Location: 1301 N CARROLL AVE, Grades: PK-4)
- EUBANKS INT (Students: 628, Location: 500 S KIMBALL AVE, Grades: 5-6)
- DON T DURHAM INT (Students: 589, Location: 801 SHADY OAKS, Grades: 5-6)
- ROBERT H ROCKENBAUGH EL (Students: 517, Location: 301 BYRON NELSON PKWY, Grades: PK-4)
- CARROLL EL (Location: 1705 W CONTINENTAL BLVD, Grades: PK-4)
- WALNUT GROVE EL (Location: 2520 N WHITE CHAPEL BLVD, Grades: PK-4)
- CARROLL MIDDLE (Location: 1800 E KIRKWOOD BLVD, Grades: 7-8)
- OLD UNION EL (Location: 1050 S CARROLL AVE, Grades: PK-4)
- FLORENCE EL (Location: 3095 JOHNSON RD, Grades: KG-4)
User-submitted facts and corrections:
- Assistant Head of The Clariden School Students: 165 Location: 100 Clariden Ranch Road
- there is a new hospital in southlake, tx. It has been there exactly 1 year now. It is: HARRIS METHODIST SOUTHLAKE 1545 E. SOUTHLAKE BLVD. SOUTHLAKE, TX 817-481-7111 added by DJ
Points of interest:
Notable locations in Southlake: Camp Burnett (A), Southlake Fire Services (B), Southlake Department of Public Safety Ambulance (C). Display/hide their locations on the map
Shopping Center: Southlake Town Square Shopping Center (1). Display/hide its location on the map
Main business address in Southlake: SABRE HOLDINGS CORP (A). Display/hide its location on the map
Churches in Southlake include: Whites Chapel United Methodist Church (A), Carroll Road Church (B), Saint Laurence Episcopal Church (C), Southlake Assembly of God Church (D), Lonesome Dove Church (E). Display/hide their locations on the map
Streams, rivers, and creeks: Kirkwood Branch (A). Display/hide its location on the map
Parks in Southlake include: Walnut Grove Park (1), Carroll Middle School Football Field and Track (2), Dragon Stadium (3). Display/hide their locations on the map
Birthplace of: Garrett Hartley - Football player, Kris Brown - 2005 NFL player (Houston Texans, born: Dec 23, 1976), Mike Brisky - Professional golfer, Sharon Gilchrist - Bluegrass musician, Kenny Brown - College basketball player (Stanford Cardinal).
Drinking water stations with addresses in Southlake and their reported violations in the past:
LAKE COUNTRY MARINA (Population served: 300, Groundwater):Past monitoring violations:BIG Q MOBILE HOME ESTATES (Population served: 60, Groundwater):
- 2 routine major monitoring violations
- 11 regular monitoring violations
Past health violations:Past monitoring violations:
- MCL, Average - Between APR-2014 and JUN-2014, Contaminant: Combined Uranium. Follow-up actions: St Violation/Reminder Notice (AUG-26-2014), St Public Notif requested (AUG-26-2014)
- MCL, Average - Between JUL-2013 and SEP-2013, Contaminant: Arsenic. Follow-up actions: St Formal NOV issued (DEC-20-2013), St Public Notif requested (JAN-02-2014), St Violation/Reminder Notice (JAN-02-2014), St Public Notif received (JUL-17-2014)
- MCL, Average - Between JUL-2013 and SEP-2013, Contaminant: Fluoride. Follow-up actions: St Formal NOV issued (DEC-20-2013), St Public Notif requested (JAN-02-2014), St Violation/Reminder Notice (JAN-02-2014), St Public Notif received (JUL-17-2014)
- MCL, Average - Between APR-2013 and JUN-2013, Contaminant: Arsenic. Follow-up actions: St Formal NOV issued (DEC-20-2013), St Public Notif requested (JAN-02-2014), St Violation/Reminder Notice (JAN-02-2014), St Public Notif received (JUL-17-2014)
- MCL, Average - Between APR-2013 and JUN-2013, Contaminant: Fluoride. Follow-up actions: St Formal NOV issued (DEC-20-2013), St Public Notif requested (JAN-02-2014), St Violation/Reminder Notice (JAN-02-2014), St Public Notif received (JUL-17-2014)
- MCL, Average - Between JAN-2013 and MAR-2013, Contaminant: Arsenic. Follow-up actions: St Formal NOV issued (DEC-20-2013), St Public Notif requested (JAN-02-2014), St Violation/Reminder Notice (JAN-02-2014), St Public Notif received (JUL-17-2014)
- 32 other older health violations
- Initial Tap Sampling for Pb and Cu - In JUL-01-2014, Contaminant: Lead and Copper Rule
- Monitoring, Source Water (GWR) - In APR-01-2014, Contaminant: E. COLI. Follow-up actions: St Public Notif requested (JUL-02-2014), St Violation/Reminder Notice (JUL-02-2014), St Compliance achieved (JUL-07-2014)
- Monitoring, Source Water (GWR) - In MAR-01-2014, Contaminant: E. COLI. Follow-up actions: St Public Notif requested (JUN-18-2014), St Violation/Reminder Notice (JUN-18-2014), St Public Notif received (JUL-17-2014)
- Initial Tap Sampling for Pb and Cu - In JAN-01-2014, Contaminant: Lead and Copper Rule
- Monitoring and Reporting (DBP) - Between JAN-2014 and MAR-2014, Contaminant: Chlorine. Follow-up actions: St Violation/Reminder Notice (JUL-02-2014), St Public Notif requested (JUL-02-2014)
- 20 routine major monitoring violations
- 2 minor monitoring violations
- 169 regular monitoring violations
- 19 other older monitoring violations
| This city: | 3.2 people |
| Texas: | 2.8 people |
| This city: | 91.1% |
| Whole state: | 69.9% |
| This city: | 1.6% |
| Whole state: | 6.0% |
Likely homosexual households (counted as self-reported same-sex unmarried-partner households)
- Lesbian couples: 0.3% of all households
- Gay men: 0.2% of all households
5 people in other group homes in 2000
Banks with most branches in Southlake (2011 data):
- First National Bank: Town Square Branch at 1540 East Southlake Boulevard, branch established on 2001/02/05; Town Square Mortgage Branch at 1253 Main, branch established on 2009/01/05. Info updated 2006/11/03: Bank assets: $310.6 mil, Deposits: $259.4 mil, headquarters in Wichita Falls, TX, positive income, Commercial Lending Specialization, 4 total offices, Holding Company: Wichita Falls Bancshares, Inc.
- Providence Bank of Texas: Messenger Service Branch at 325 East Southlake Blvd., branch established on 2009/06/01; Providence Bank Of Texas at 325 East Southlake Blvd., branch established on 2007/08/27. Info updated 2010/07/28: Bank assets: $98.0 mil, Deposits: $87.8 mil, local headquarters, positive income, Commercial Lending Specialization, 2 total offices, Holding Company: Providence Bancshares Corporation
- Bank of America, National Association: Southlake Marketplace Branch at 2025 West Southlake Blvd., branch established on 2007/06/13; Northwest Gateway Plaza Branch at 3100 East Southlake Boulevard, branch established on 1991/06/04. Info updated 2009/11/18: Bank assets: $1,451,969.3 mil, Deposits: $1,077,176.8 mil, headquarters in Charlotte, NC, positive income, 5782 total offices, Holding Company: Bank Of America Corporation
- JPMorgan Chase Bank, National Association: Southlake Blvd And Randol Mill Branc at 2300 W Southlake Blvd, branch established on 2007/06/21; Southlake Branch at 1700 East Southlake Boulevard, branch established on 2006/07/01. Info updated 2011/11/10: Bank assets: $1,811,678.0 mil, Deposits: $1,190,738.0 mil, headquarters in Columbus, OH, positive income, International Specialization, 5577 total offices, Holding Company: Jpmorgan Chase & Co.
- Compass Bank: Southlake East Branch at 2650 East Southlake Boulevard, branch established on 2006/11/29; Southlake West Branch at 2200 West Southlake Boulevard, branch established on 2003/01/13. Info updated 2011/02/24: Bank assets: $63,107.0 mil, Deposits: $46,232.4 mil, headquarters in Birmingham, AL, negative income in the last year, Commercial Lending Specialization, 720 total offices, Holding Company: Banco Bilbao Vizcaya Argentaria, S.A.
- BOKF, National Association: Southlake Kroger Branch at 2110 E. Southlake Blvd, branch established on 2004/01/01. Info updated 2012/02/28: Bank assets: $25,360.0 mil, Deposits: $19,171.3 mil, headquarters in Tulsa, OK, positive income, Commercial Lending Specialization, 189 total offices, Holding Company: Bok Financial Corporation
- Sovereign Bank: Southlake Branch at 2438 East Southlake Boulevard, branch established on 2006/05/18. Info updated 2007/04/06: Bank assets: $848.5 mil, Deposits: $665.3 mil, headquarters in Dallas, TX, positive income, Commercial Lending Specialization, 10 total offices, Holding Company: Sovereign Bancshares, Inc.
- Branch Banking and Trust Company: Southlake Main Branch at 270 N Kimball Ave, branch established on 2005/07/05. Info updated 2010/03/29: Bank assets: $168,867.6 mil, Deposits: $127,549.5 mil, headquarters in Winston Salem, NC, positive income, Commercial Lending Specialization, 1793 total offices, Holding Company: Bb&T Corporation
- Regions Bank: Southlake at 1000 East State Highway 114, branch established on 2006/04/17. Info updated 2011/02/24: Bank assets: $123,368.2 mil, Deposits: $98,301.3 mil, headquarters in Birmingham, AL, positive income, Commercial Lending Specialization, 1778 total offices, Holding Company: Regions Financial Corporation
- 6 other banks with 6 local branches
For population 15 years and over in Southlake:
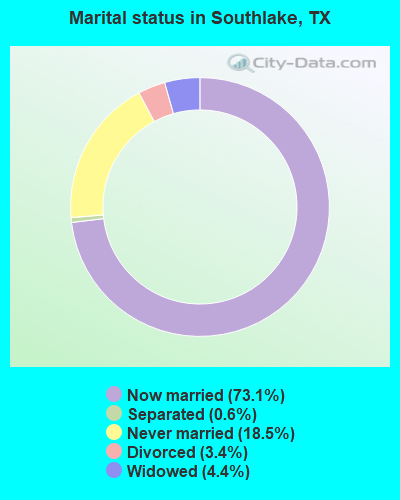
- Never married: 18.5%
- Now married: 73.1%
- Separated: 0.6%
- Widowed: 4.4%
- Divorced: 3.4%
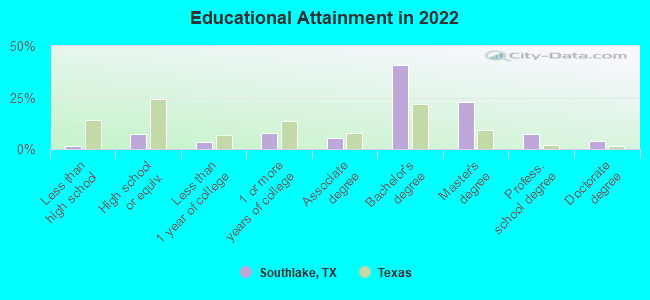
For population 25 years and over in Southlake:
- High school or higher: 98.6%
- Bachelor's degree or higher: 74.1%
- Graduate or professional degree: 33.4%
- Unemployed: 2.0%
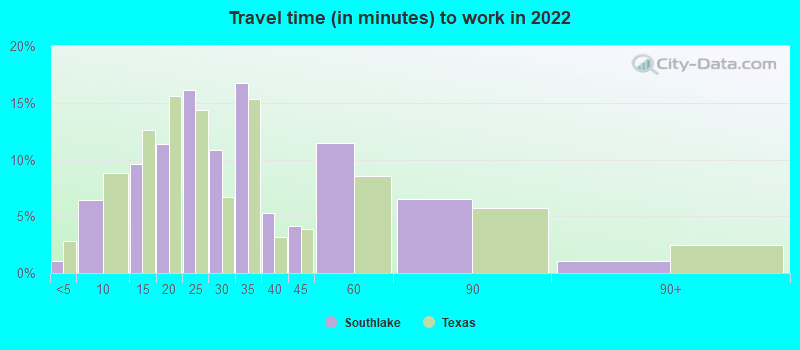
- Mean travel time to work (commute): 17.5 minutes
| Here: | 8.0 |
| Texas average: | 14.0 |
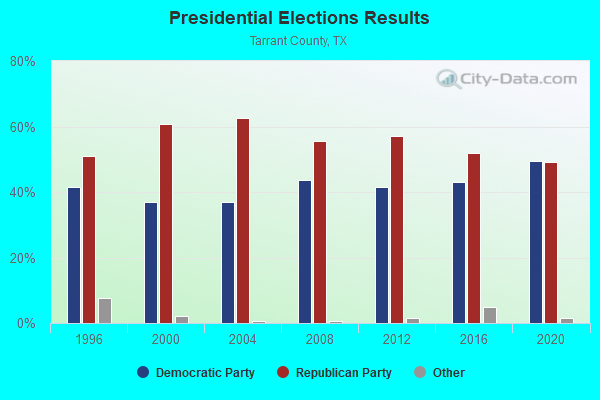
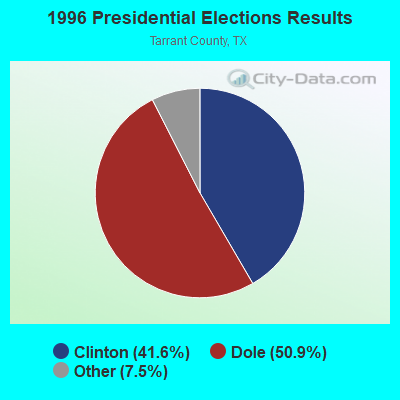
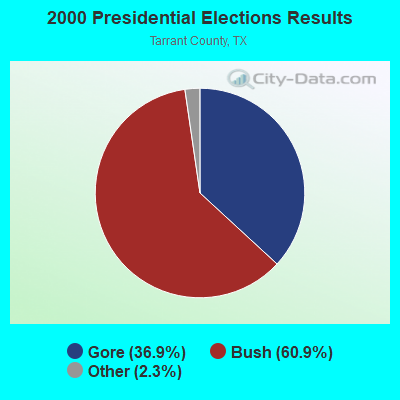
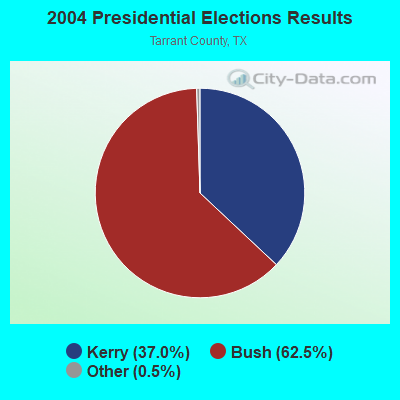
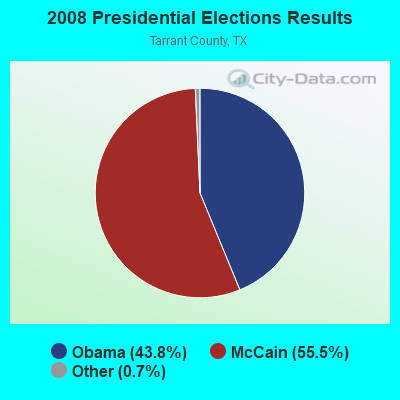
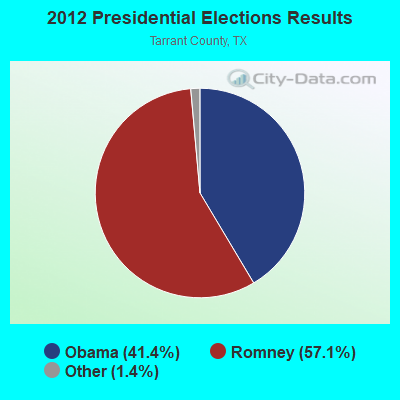
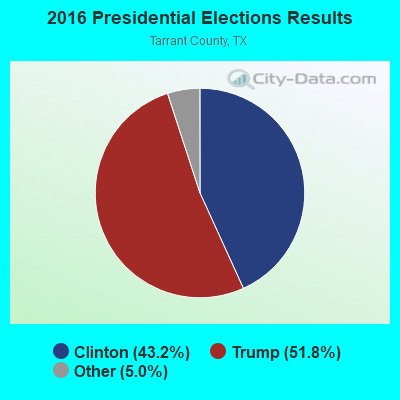
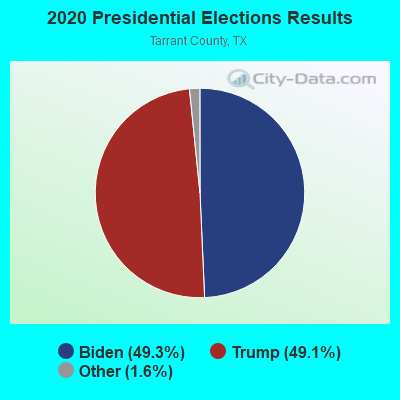
Graphs represent county-level data. Detailed 2008 Election Results
Religion statistics for Southlake, TX (based on Tarrant County data)
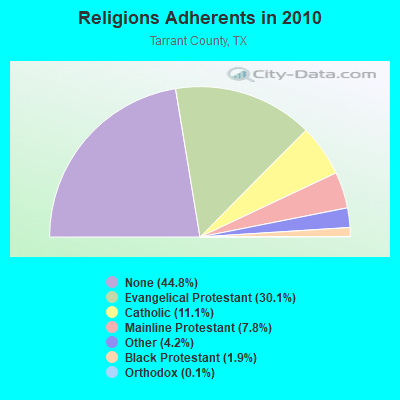
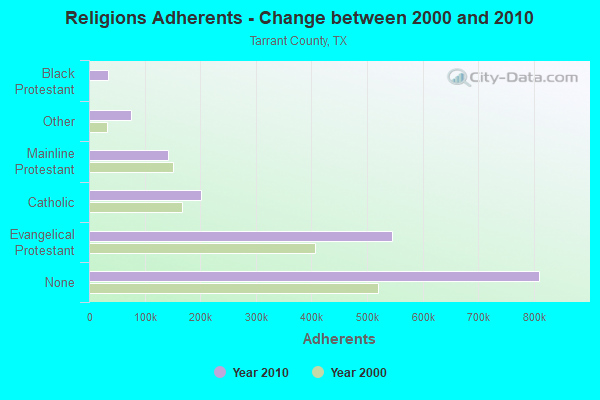
| Religion | Adherents | Congregations |
|---|---|---|
| Evangelical Protestant | 544,670 | 1,272 |
| Catholic | 200,645 | 33 |
| Mainline Protestant | 141,938 | 158 |
| Other | 75,335 | 122 |
| Black Protestant | 33,665 | 103 |
| Orthodox | 2,596 | 7 |
| None | 810,185 | - |
Food Environment Statistics:
| Tarrant County: | 1.24 / 10,000 pop. |
| Texas: | 1.47 / 10,000 pop. |
| Here: | 0.15 / 10,000 pop. |
| State: | 0.14 / 10,000 pop. |
| This county: | 1.14 / 10,000 pop. |
| Texas: | 1.11 / 10,000 pop. |
| Tarrant County: | 3.56 / 10,000 pop. |
| Texas: | 3.95 / 10,000 pop. |
| This county: | 5.68 / 10,000 pop. |
| Texas: | 6.13 / 10,000 pop. |
| Here: | 8.1% |
| Texas: | 8.9% |
| Here: | 26.1% |
| Texas: | 26.6% |
| Tarrant County: | 14.5% |
| Texas: | 15.7% |
Health and Nutrition:
| This city: | 57.4% |
| Texas: | 48.6% |
| Southlake: | 59.6% |
| Texas: | 47.4% |
| Here: | 28.0 |
| State: | 28.5 |
| Southlake: | 19.5% |
| Texas: | 20.6% |
| This city: | 6.7% |
| Texas: | 10.3% |
| Here: | 6.9 |
| State: | 6.8 |
| Southlake: | 34.9% |
| State: | 33.1% |
| Southlake: | 63.9% |
| Texas: | 56.2% |
| Southlake: | 83.3% |
| Texas: | 80.7% |
More about Health and Nutrition of Southlake, TX Residents
| Local government employment and payroll (March 2022) | |||||
| Function | Full-time employees | Monthly full-time payroll | Average yearly full-time wage | Part-time employees | Monthly part-time payroll |
|---|---|---|---|---|---|
| Parks and Recreation | 77 | $262,512 | $40,911 | 198 | $77,354 |
| Firefighters | 76 | $595,766 | $94,068 | 0 | $0 |
| Police Protection - Officers | 72 | $468,520 | $78,087 | 0 | $0 |
| Other Government Administration | 67 | $372,858 | $66,781 | 2 | $4,512 |
| Financial Administration | 30 | $202,341 | $80,936 | 0 | $0 |
| Streets and Highways | 25 | $118,031 | $56,655 | 0 | $0 |
| Water Supply | 20 | $73,211 | $43,927 | 0 | $0 |
| Judicial and Legal | 10 | $40,739 | $48,887 | 2 | $6,619 |
| Local Libraries | 8 | $37,877 | $56,816 | 8 | $5,308 |
| Sewerage | 8 | $30,885 | $46,328 | 0 | $0 |
| Police - Other | 6 | $25,765 | $51,530 | 1 | $488 |
| Fire - Other | 5 | $22,731 | $54,554 | 0 | $0 |
| Totals for Government | 404 | $2,251,236 | $66,868 | 211 | $94,281 |
Southlake government finances - Expenditure in 2017 (per resident):
- Construction - Parks and Recreation: $12,917,000 ($415.31)
Water Utilities: $3,125,000 ($100.48)
Regular Highways: $2,376,000 ($76.39)
Sewerage: $423,000 ($13.60)
General - Other: $53,000 ($1.70)
- Current Operations - Parks and Recreation: $10,646,000 ($342.29)
Water Utilities: $9,954,000 ($320.04)
Local Fire Protection: $8,365,000 ($268.95)
Police Protection: $7,994,000 ($257.03)
Central Staff Services: $5,821,000 ($187.16)
General - Other: $3,933,000 ($126.45)
Sewerage: $3,299,000 ($106.07)
General Public Buildings: $3,169,000 ($101.89)
Regular Highways: $1,948,000 ($62.63)
Financial Administration: $1,934,000 ($62.18)
Protective Inspection and Regulation - Other: $1,043,000 ($33.53)
Judicial and Legal Services: $830,000 ($26.69)
Libraries: $667,000 ($21.45)
- Intergovernmental to Local - Other - Water Utilities: $8,808,000 ($283.20)
Other - General - Other: $7,343,000 ($236.09)
Other - Sewerage: $1,518,000 ($48.81)
Other - Police Protection: $1,219,000 ($39.19)
Other - Central Staff Services: $37,000 ($1.19)
- Total Salaries and Wages: $23,604,000 ($758.92)
- Water Utilities - Interest on Debt: $1,933,000 ($62.15)
Southlake government finances - Revenue in 2017 (per resident):
- Charges - Sewerage: $6,612,000 ($212.59)
Solid Waste Management: $1,899,000 ($61.06)
Other: $589,000 ($18.94)
Parks and Recreation: $573,000 ($18.42)
- Federal Intergovernmental - Other: $2,000 ($0.06)
- Local Intergovernmental - Other: $255,000 ($8.20)
- Miscellaneous - Fines and Forfeits: $2,029,000 ($65.24)
Rents: $1,175,000 ($37.78)
Interest Earnings: $1,104,000 ($35.50)
Special Assessments: $1,104,000 ($35.50)
Donations From Private Sources: $180,000 ($5.79)
General Revenue - Other: $156,000 ($5.02)
Sale of Property: $148,000 ($4.76)
- Revenue - Water Utilities: $20,061,000 ($645.01)
- State Intergovernmental - General Local Government Support: $390,000 ($12.54)
Other: $99,000 ($3.18)
- Tax - Property: $38,032,000 ($1222.82)
General Sales and Gross Receipts: $28,414,000 ($913.57)
Public Utilities Sales: $2,908,000 ($93.50)
Other License: $2,643,000 ($84.98)
Other Selective Sales: $1,165,000 ($37.46)
Southlake government finances - Debt in 2017 (per resident):
- Long Term Debt - Beginning Outstanding - Unspecified Public Purpose: $130,229,000 ($4187.16)
Outstanding Unspecified Public Purpose: $127,035,000 ($4084.46)
Outstanding Nonguaranteed - Industrial Revenue: $44,141,000 ($1419.23)
Beginning Outstanding - Public Debt for Private Purpose: $43,812,000 ($1408.66)
Retired Unspecified Public Purpose: $19,449,000 ($625.33)
Issue, Unspecified Public Purpose: $16,255,000 ($522.64)
Issue, Nonguaranteed - Public Debt for Private Purpose: $10,509,000 ($337.89)
Retired Nonguaranteed - Public Debt for Private Purpose: $10,180,000 ($327.31)
Southlake government finances - Cash and Securities in 2017 (per resident):
- Bond Funds - Cash and Securities: $84,363,000 ($2712.46)
- Other Funds - Cash and Securities: $50,771,000 ($1632.40)
- Sinking Funds - Cash and Securities: $49,919,000 ($1605.01)
7.43% of this county's 2021 resident taxpayers lived in other counties in 2020 ($70,478 average adjusted gross income)
| Here: | 7.43% |
| Texas average: | 8.12% |
0.03% of residents moved from foreign countries ($213 average AGI)
Tarrant County: 0.03% Texas average: 0.04%
Top counties from which taxpayers relocated into this county between 2020 and 2021:
| from Dallas County, TX | |
| from Denton County, TX | |
| from Johnson County, TX |
7.19% of this county's 2020 resident taxpayers moved to other counties in 2021 ($70,939 average adjusted gross income)
| Here: | 7.19% |
| Texas average: | 7.40% |
0.03% of residents moved to foreign countries ($199 average AGI)
Tarrant County: 0.03% Texas average: 0.03%
Top counties to which taxpayers relocated from this county between 2020 and 2021:
| to Dallas County, TX | |
| to Denton County, TX | |
| to Johnson County, TX |
| Businesses in Southlake, TX | ||||
| Name | Count | Name | Count | |
|---|---|---|---|---|
| 24 Hour Fitness | 1 | Kroger | 1 | |
| 7-Eleven | 2 | Lane Bryant | 1 | |
| AT&T | 2 | Lane Furniture | 3 | |
| Aeropostale | 1 | LensCrafters | 1 | |
| American Eagle Outfitters | 1 | Lowe's | 1 | |
| Ann Taylor | 2 | MasterBrand Cabinets | 1 | |
| Apple Store | 1 | McDonald's | 2 | |
| Banana Republic | 1 | New Balance | 2 | |
| Barnes & Noble | 1 | New York & Co | 1 | |
| Baskin-Robbins | 1 | Nike | 3 | |
| Bath & Body Works | 1 | Nordstrom | 1 | |
| Bed Bath & Beyond | 1 | OfficeMax | 1 | |
| Brooks Brothers | 1 | Old Navy | 1 | |
| Burger King | 1 | Panda Express | 1 | |
| CVS | 1 | Panera Bread | 1 | |
| Cache | 1 | Papa John's Pizza | 1 | |
| Chick-Fil-A | 1 | PetSmart | 1 | |
| Chico's | 1 | Pier 1 Imports | 1 | |
| Chipotle | 1 | Pizza Hut | 1 | |
| Clarks | 1 | Pottery Barn | 1 | |
| Coldwater Creek | 2 | Qdoba Mexican Grill | 1 | |
| Costco | 1 | RadioShack | 1 | |
| Curves | 1 | SONIC Drive-In | 1 | |
| DHL | 1 | Safeway | 1 | |
| DressBarn | 1 | Soma Intimates | 1 | |
| Dressbarn | 1 | Sprint Nextel | 1 | |
| Eddie Bauer | 1 | Staples | 1 | |
| Ethan Allen | 1 | Starbucks | 4 | |
| FedEx | 5 | Steak 'n Shake | 1 | |
| GameStop | 2 | Subway | 3 | |
| Gap | 1 | T-Mobile | 3 | |
| Gymboree | 1 | T.J.Maxx | 1 | |
| H&R Block | 1 | Taco Bell | 2 | |
| Hilton | 1 | Talbots | 1 | |
| Hobby Lobby | 1 | The Cheesecake Factory | 1 | |
| Home Depot | 1 | The Room Place | 1 | |
| IHOP | 1 | Toys"R"Us | 1 | |
| J.Crew | 1 | UPS | 6 | |
| Jamba Juice | 1 | Vans | 1 | |
| JoS. A. Bank | 1 | Verizon Wireless | 2 | |
| Jones New York | 1 | Victoria's Secret | 1 | |
| Justice | 2 | Vons | 1 | |
| KFC | 1 | Walgreens | 1 | |
| Kohl's | 1 | Wendy's | 2 | |
Strongest AM radio stations in Southlake:
- KZMP (1540 AM; 50 kW; UNIVERSITY PARK, TX; Owner: ENTRAVISION HOLDINGS, LLC)
- KESS (1270 AM; 50 kW; FORT WORTH, TX; Owner: KESS-AM LICENSE CORP.)
- KBIS (1150 AM; 25 kW; HIGHLAND PARK, TX; Owner: DALLAS AM RADIO PARTNERS, L.P.)
- WBAP (820 AM; 50 kW; FORT WORTH, TX; Owner: WBAP-KSCS OPERATING, LTD.)
- KLIF (570 AM; 5 kW; DALLAS, TX; Owner: KLIF LICO, INC.)
- KAHZ (1360 AM; 50 kW; HURST, TX)
- KNAX (1630 AM; 10 kW; FT. WORTH, TX; Owner: MORTENSON BROADCASTING COMPANY)
- KHVN (970 AM; 10 kW; FORT WORTH, TX; Owner: MORTENSON BROADCASTING COMPANY)
- KRLD (1080 AM; 50 kW; DALLAS, TX; Owner: TEXAS INFINITY BROADCASTING L.P.)
- KTCK (1310 AM; 9 kW; DALLAS, TX; Owner: KRBE LICO, INC.)
- KTNO (1440 AM; 12 kW; DENTON, TX; Owner: MORTENSON BROADCASTING COMPANY)
- KSKY (660 AM; 20 kW; BALCH SPRINGS, TX; Owner: BISON MEDIA, INC.)
- KFXR (1190 AM; 50 kW; DALLAS, TX; Owner: CLEAR CHANNEL BROADCASTING LICENSES, INC.)
Strongest FM radio stations in Southlake:
- KPLX (99.5 FM; FORT WORTH, TX; Owner: KPLX LICO, INC.)
- KLUV-FM (98.7 FM; DALLAS, TX; Owner: INFINITY BROADCASTING CORPORATION OF DALLAS)
- KLLI (105.3 FM; DALLAS, TX; Owner: INFINITY BROADCASTING CORPORATION OF DALLAS)
- WRR (101.1 FM; DALLAS, TX; Owner: CITY OF DALLAS, TEXAS)
- KZPS (92.5 FM; DALLAS, TX; Owner: AMFM TEXAS LICENSES LIMITED PARTNERSHIP)
- KKDA-FM (104.5 FM; DALLAS, TX; Owner: SERVICE BROADCASTING I, LTD.)
- KHKS (106.1 FM; DENTON, TX; Owner: AMFM TEXAS LICENSES LIMITED PARTNERSHIP)
- KVIL-FM (103.7 FM; HIGHLAND PARK-DALLAS, TX; Owner: INFINITY BROADCASTING CORPORATION OF TEXAS)
- KOAI (107.5 FM; FORT WORTH, TX; Owner: INFINITY KOAI-FM, INC.)
- KBFB (97.9 FM; DALLAS, TX; Owner: RADIO ONE LICENSES, LLC)
- KSCS (96.3 FM; FORT WORTH, TX; Owner: WBAP-KSCS OPERATING, LTD.)
- KLNO (94.1 FM; FORT WORTH, TX; Owner: HBC LICENSE CORPORATION)
- KEGL (97.1 FM; FORT WORTH, TX; Owner: CITICASTERS LICENSES, L.P.)
- KRBV (100.3 FM; DALLAS, TX; Owner: INFINITY BROADCASTING CORP. OF FORT WORTH)
- KCBI (90.9 FM; DALLAS, TX; Owner: CRISWELL CENTER FOR BIBLICAL STUDIES)
- KDGE (102.1 FM; FORT WORTH-DALLAS, TX; Owner: CAPSTAR TX LIMITED PARTNERSHIP)
- KDMX (102.9 FM; DALLAS, TX; Owner: CITICASTERS LICENSES, L.P.)
- KMEO (96.7 FM; FLOWER MOUND, TX; Owner: ABC, INC.)
- KKDL (106.7 FM; MUENSTER, TX; Owner: ENTRAVISION HOLDINGS, LLC)
- KZMP-FM (101.7 FM; AZLE, TX; Owner: ENTRAVISION HOLDINGS, LLC)
TV broadcast stations around Southlake:
- KLDT (Channel 55; LAKE DALLAS, TX; Owner: JOHNSON BROADCASTING OF DALLAS, INC.)
- KXAS-TV (Channel 5; FORT WORTH, TX; Owner: STATION VENTURE OPERATIONS, LP)
- KDTN (Channel 2; DENTON, TX; Owner: NORTH TEXAS PUBLIC BROADCASTING, INC.)
- KTVT (Channel 11; FORT WORTH, TX; Owner: CBS STATIONS GROUP OF TEXAS L.P.)
- KSTR-TV (Channel 49; IRVING, TX; Owner: TELEFUTURA DALLAS LLC)
- KPXD (Channel 68; ARLINGTON, TX; Owner: PAXSON DALLAS LICENSE, INC.)
- KTXA (Channel 21; FORT WORTH, TX; Owner: VIACOM TELEVISION STATIONS GROUP OF DALLAS/FORT WORTH L.P.)
- KUVN (Channel 23; GARLAND, TX; Owner: KUVN LICENSE PARTNERSHIP, L.P.)
- KMPX (Channel 29; DECATUR, TX; Owner: WORD OF GOD FELLOWSHIP, INC.)
- WFAA-TV (Channel 8; DALLAS, TX; Owner: WFAA-TV, L.P.)
- KDFW (Channel 4; DALLAS, TX; Owner: KDFW LICENSE, INC.)
- KDTX-TV (Channel 58; DALLAS, TX; Owner: TRINITY BROADCASTING OF TEXAS, INC.)
- KXTX-TV (Channel 39; DALLAS, TX; Owner: TELEMUNDO OF TEXAS PARTNERSHIP, LP)
- KERA-TV (Channel 13; DALLAS, TX; Owner: NORTH TEXAS PUBLIC BROADCASTING, INC.)
- KDAF (Channel 33; DALLAS, TX; Owner: TRIBUNE TELEVISION COMPANY)
- KDFI (Channel 27; DALLAS, TX; Owner: NEW DMIC, INC.)
- KFWD (Channel 52; FORT WORTH, TX; Owner: HIC BROADCAST, INC.)
- KLEG-LP (Channel 44; DALLAS, TX; Owner: DILIP VISWANATH)
- K26HF (Channel 26; BRITTON, TX; Owner: MAKO COMMUNICATIONS, LLC)
- KHPK-LP (Channel 28; DE SOTO, TX; Owner: MAKO COMMUNICATIONS, LLC)
- K25FW (Channel 25; CORSICANA, TX; Owner: VENTANA TELEVISION, INC.)
- KATA-LP (Channel 60; MESQUITE, TX; Owner: JANE McGINNIS)
- KUVN-CA (Channel 31; FORT WORTH, TX; Owner: KUVN LICENSE PARTNERSHIP, L.P.)
- KJJM-LP (Channel 46; DALLAS/MESQUITE, TX; Owner: JANE McGINNIS)
- KVFW-LP (Channel 65; FORT WORTH, TX; Owner: GERALD BENAVIDES)
- National Bridge Inventory (NBI) Statistics
- 51Number of bridges
- 417ft / 127mTotal length
- $5,000Total costs
- 1,411,346Total average daily traffic
- 52,619Total average daily truck traffic
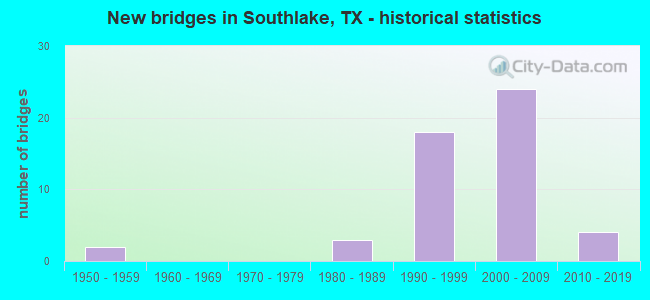
- New bridges - historical statistics
- 21950-1959
- 31980-1989
- 181990-1999
- 242000-2009
- 42010-2019
FCC Registered Broadcast Land Mobile Towers: 20 (See the full list of FCC Registered Broadcast Land Mobile Towers in Southlake, TX)
FCC Registered Microwave Towers: 24 (See the full list of FCC Registered Microwave Towers in this town)
FCC Registered Paging Towers: 2 (See the full list of FCC Registered Paging Towers)
FCC Registered Amateur Radio Licenses: 183 (See the full list of FCC Registered Amateur Radio Licenses in Southlake)
FAA Registered Aircraft Manufacturers and Dealers: 8 (See the full list of FAA Registered Manufacturers and Dealers in Southlake)
FAA Registered Aircraft: 93 (See the full list of FAA Registered Aircraft)
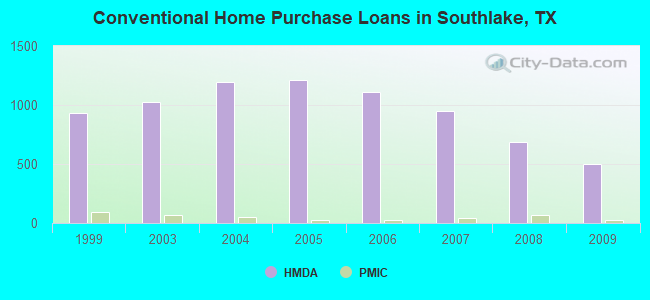
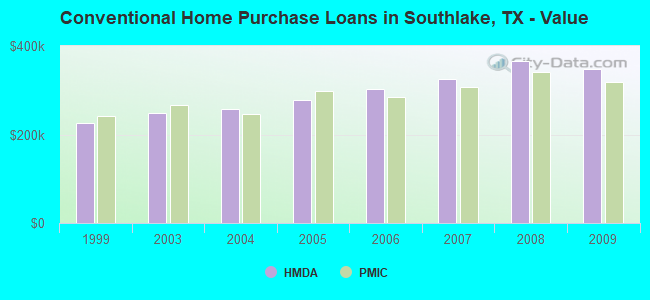
| Home Mortgage Disclosure Act Aggregated Statistics For Year 2009 (Based on 2 full and 6 partial tracts) | ||||||||||||
| A) FHA, FSA/RHS & VA Home Purchase Loans | B) Conventional Home Purchase Loans | C) Refinancings | D) Home Improvement Loans | E) Loans on Dwellings For 5+ Families | F) Non-occupant Loans on < 5 Family Dwellings (A B C & D) | |||||||
|---|---|---|---|---|---|---|---|---|---|---|---|---|
| Number | Average Value | Number | Average Value | Number | Average Value | Number | Average Value | Number | Average Value | Number | Average Value | |
| LOANS ORIGINATED | 30 | $274,885 | 497 | $347,869 | 1,361 | $310,293 | 50 | $163,430 | 0 | $0 | 18 | $329,503 |
| APPLICATIONS APPROVED, NOT ACCEPTED | 1 | $181,980 | 52 | $309,983 | 102 | $319,916 | 5 | $91,644 | 1 | $21,360,000 | 1 | $281,010 |
| APPLICATIONS DENIED | 3 | $227,487 | 58 | $356,506 | 282 | $357,473 | 27 | $106,916 | 0 | $0 | 5 | $203,326 |
| APPLICATIONS WITHDRAWN | 5 | $353,784 | 71 | $396,185 | 208 | $358,918 | 13 | $204,500 | 0 | $0 | 6 | $341,453 |
| FILES CLOSED FOR INCOMPLETENESS | 0 | $0 | 17 | $461,924 | 67 | $381,963 | 2 | $33,010 | 0 | $0 | 4 | $229,888 |
Detailed HMDA statistics for the following Tracts: 0203.05 , 1137.05, 1137.07, 1139.06, 1139.07, 1139.08, 1139.09, 1139.12
| Private Mortgage Insurance Companies Aggregated Statistics For Year 2009 (Based on 2 full and 6 partial tracts) | ||||
| A) Conventional Home Purchase Loans | B) Refinancings | |||
|---|---|---|---|---|
| Number | Average Value | Number | Average Value | |
| LOANS ORIGINATED | 29 | $319,601 | 13 | $320,002 |
| APPLICATIONS APPROVED, NOT ACCEPTED | 6 | $368,350 | 4 | $277,848 |
| APPLICATIONS DENIED | 5 | $348,994 | 1 | $510,660 |
| APPLICATIONS WITHDRAWN | 1 | $326,770 | 1 | $224,540 |
| FILES CLOSED FOR INCOMPLETENESS | 1 | $533,110 | 0 | $0 |
Detailed PMIC statistics for the following Tracts: 0203.05 , 1137.05, 1137.07, 1139.06, 1139.07, 1139.08, 1139.09, 1139.12
2002 - 2018 National Fire Incident Reporting System (NFIRS) incidents
- Fire incident types reported to NFIRS in Southlake, TX
- 55243.3%Outside Fires
- 50939.9%Structure Fires
- 15712.3%Mobile Property/Vehicle Fires
- 574.5%Other
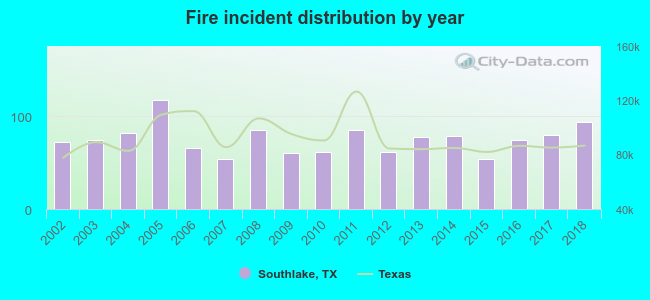 According to the data from the years 2002 - 2018 the average number of fires per year is 75. The highest number of reported fires - 117 took place in 2005, and the least - 54 in 2007. The data has an increasing trend.
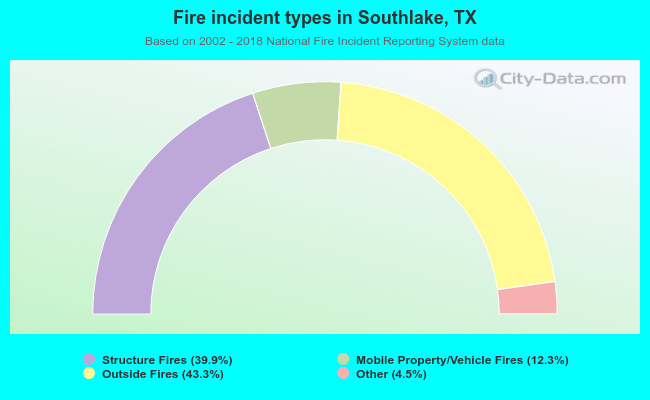 When looking into fire subcategories, the most incidents belonged to: Outside Fires (43.3%), and Structure Fires (39.9%).
Fire-safe hotels and motels in Southlake, Texas:
- Hilton Dallas/Southlake Town Square, 1400 Plaza Pl, Southlake, Texas 76092 , Phone: (817) 442-9900, Fax: (817) 442-9901
- Cambria Southlake DFW North, 2104 E State Hwy 114, Southlake, Texas 76092 , Phone: (817) 329-1010, Fax: (817) 329-0202
| Most common first names in Southlake, TX among deceased individuals | ||
| Name | Count | Lived (average) |
|---|---|---|
| John | 22 | 75.1 years |
| Mary | 21 | 81.7 years |
| James | 20 | 70.2 years |
| Dorothy | 14 | 81.1 years |
| Helen | 14 | 86.5 years |
| Robert | 10 | 69.3 years |
| William | 9 | 79.7 years |
| Ruth | 9 | 84.8 years |
| Charles | 8 | 79.4 years |
| Doris | 8 | 80.6 years |
| Most common last names in Southlake, TX among deceased individuals | ||
| Last name | Count | Lived (average) |
|---|---|---|
| Brown | 12 | 79.9 years |
| Adams | 5 | 79.6 years |
| Davis | 5 | 62.4 years |
| Williams | 5 | 60.0 years |
| Roberts | 5 | 84.2 years |
| Hall | 4 | 83.5 years |
| Cook | 4 | 75.5 years |
| Long | 4 | 83.7 years |
| Martin | 4 | 76.8 years |
| Smith | 4 | 78.7 years |
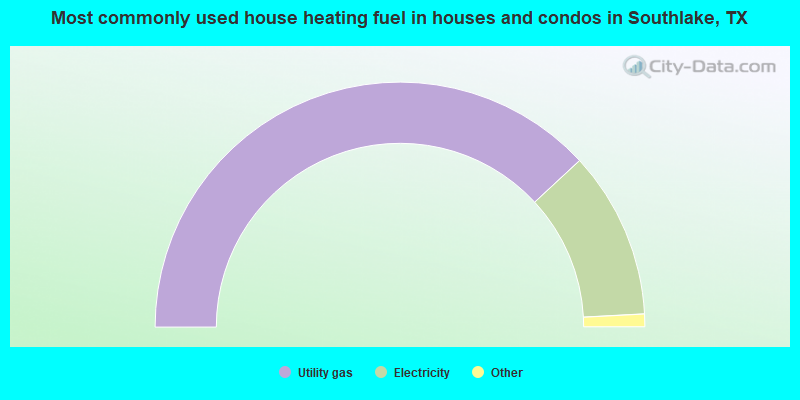
- 76.3%Utility gas
- 22.1%Electricity
- 1.3%Bottled, tank, or LP gas
- 0.4%Other fuel
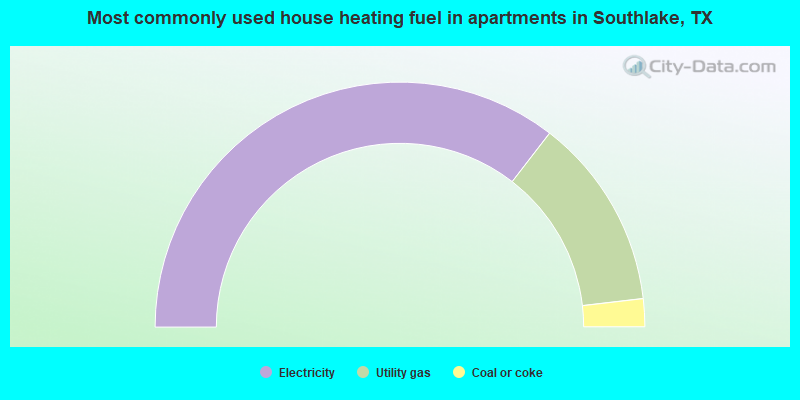
- 71.0%Electricity
- 25.4%Utility gas
- 3.7%Coal or coke
Southlake compared to Texas state average:
- Median household income significantly above state average.
- Median house value significantly above state average.
- Unemployed percentage significantly below state average.
- Black race population percentage significantly below state average.
- Hispanic race population percentage significantly below state average.
- Median age significantly above state average.
- Renting percentage significantly below state average.
- Length of stay since moving in above state average.
- Number of rooms per house significantly above state average.
- House age below state average.
- Percentage of population with a bachelor's degree or higher significantly above state average.
Southlake on our top lists:
- #7 on the list of "Top 101 cities with largest percentage of males in occupations: management occupations (population 5,000+)"
- #20 on the list of "Top 101 cities with the highest percentage of family households, population 10,000+"
- #50 on the list of "Top 101 cities with largest percentage of males in industries: management of companies and enterprises (population 5,000+)"
- #55 on the list of "Top 101 cities with the most residents born in Other Northern Europe (population 500+)"
- #75 on the list of "Top 100 cities with biggest houses"
- #100 on the list of "Top 100 cities with highest median household income"
- #69 (76092) on the list of "Top 101 zip codes with the highest average reported salary/wage in 2012 (pop 5,000+)"
- #4 on the list of "Top 101 counties with the most Evangelical Protestant adherents"
- #5 on the list of "Top 101 counties with the most Evangelical Protestant congregations"
- #7 on the list of "Top 101 counties with the most Mainline Protestant adherents"
- #13 on the list of "Top 101 counties with the most Black Protestant congregations"
- #28 on the list of "Top 101 counties with the most Black Protestant adherents"

|
|
Total of 779 patent applications in 2008-2024.