Keller, Texas

Keller: Covered bridge at Bear Creek Park in Keller TX taken April 2001

Keller: Yes Virginia, it does snow in Keller, TX.
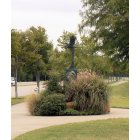
Keller: Bronze statue of flying heron on Bear Creek Parkway

Keller: Keller City Hall with American & Texas flags during 02/2010 record snow
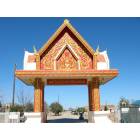
Keller: Wat Buddharatanaram, ENTRANCE TO BUDDHIST TEMPLE

Keller: Wat Buddharatanaram, Keller, Texas...home of the largest gold Buddha in America.
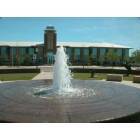
Keller: Keller (TX) Town Hall
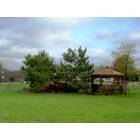
Keller: Pretty clouds over the park pavilion, Keller, TX
- add
your
Submit your own pictures of this city and show them to the world
- OSM Map
- General Map
- Google Map
- MSN Map
Population change since 2000: +65.5%
| Males: 22,536 | |
| Females: 22,716 |
| Median resident age: | 43.5 years |
| Texas median age: | 35.6 years |
Zip codes: 76248.
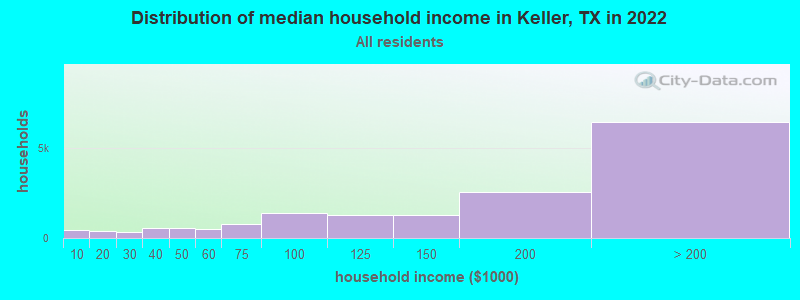
| Keller: | $156,623 |
| TX: | $72,284 |
Estimated per capita income in 2022: $72,570 (it was $31,986 in 2000)
Keller city income, earnings, and wages data
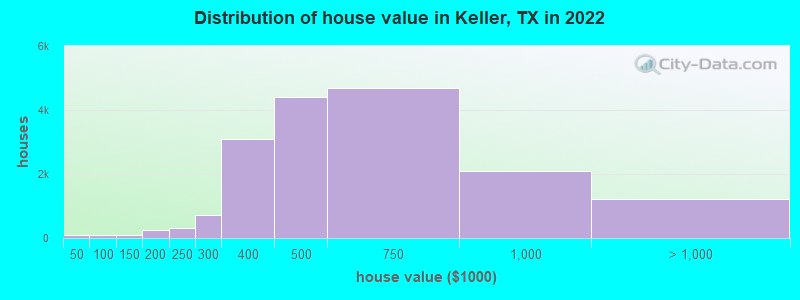
Estimated median house or condo value in 2022: $560,586 (it was $173,200 in 2000)
| Keller: | $560,586 |
| TX: | $275,400 |
Mean prices in 2022: all housing units: $640,541; detached houses: $652,044; townhouses or other attached units: $449,838; mobile homes: $46,625
Median gross rent in 2022: $1,900.
(2.6% for White Non-Hispanic residents, 23.4% for Black residents, 3.1% for Hispanic or Latino residents, 3.3% for American Indian residents, 1.4% for two or more races residents)
Detailed information about poverty and poor residents in Keller, TX


Compare current foreclosures in Keller, TX:
| Photo | Address | Area | Beds / Baths | Price | Details |
|---|---|---|---|---|---|

|
#1
Rainy Lake Dr
Keller, TX 76244
|
1,528 sq. feet
|
2 baths 3 beds |
show details | |

|
#2
Chris Dr
Keller, TX 76244
|
3,001 sq. feet
|
2 baths 4 beds |
show details | |

|
#3
Harney Dr
Keller, TX 76244
|
2,027 sq. feet
|
2 baths 4 beds |
show details | |

|
#4
Haverly Court
Keller, TX 76244
|
3,279 sq. feet
|
3 baths 4 beds |
show details | |

|
#5
Highland Oaks Dr
Keller, TX 76248
|
4,284 sq. feet
|
3 baths 6 beds |
show details | |

|
#6
Bedington Ln
Keller, TX 76244
|
2,784 sq. feet
|
2 baths 3 beds |
show details | |

|
#7
Harvest Ridge Rd
Keller, TX 76244
|
3,416 sq. feet
|
2 baths 4 beds |
show details | |

|
#8
Sheldon Trl
Keller, TX 76244
|
2,322 sq. feet
|
2 baths 4 beds |
show details | |

|
#9
Rush Creek Ct
Keller, TX 76244
|
3,128 sq. feet
|
3 baths 5 beds |
show details | |

|
#10
Bear Hollow Dr
Keller, TX 76244
|
2,249 sq. feet
|
2 baths 3 beds |
show details |
| Photo | Address | Area | Beds / Baths | Price | Details |
|---|---|---|---|---|---|

|
#11
Summersville Ln
Keller, TX 76244
|
1,506 sq. feet
|
2 baths 3 beds |
show details | |

|
#12
Sioux Creek Ln
Keller, TX 76244
|
1,427 sq. feet
|
2 baths 3 beds |
show details | |

|
#13
Stirrup Way
Keller, TX 76244
|
1,371 sq. feet
|
2 baths 3 beds |
show details | |

|
#14
Silverwood Trl
Keller, TX 76244
|
2,401 sq. feet
|
2 baths 4 beds |
show details | |

|
#15
Paint Pony Ln
Keller, TX 76248
|
1,641 sq. feet
|
2 baths 3 beds |
show details | |

|
#16
Georgetown Pl
Keller, TX 76244
|
2,899 sq. feet
|
2 baths 4 beds |
show details | |

|
#17
Tupelo Trl
Keller, TX 76244
|
2,225 sq. feet
|
2 baths 3 beds |
show details | |

|
#18
Scotts Valley St
Keller, TX 76244
|
2,354 sq. feet
|
2 baths 3 beds |
show details | |

|
#19
Granger Ln
Keller, TX 76244
|
3,199 sq. feet
|
3 baths 4 beds |
show details | |

|
#20
Graywolf Ridge Trl
Keller, TX 76244
|
3,349 sq. feet
|
2 baths 3 beds |
show details |
| Photo | Address | Area | Beds / Baths | Price | Details |
|---|---|---|---|---|---|

|
#21
Pangolin Dr
Keller, TX 76244
|
1,868 sq. feet
|
2 baths 3 beds |
show details | |

|
#22
Meredith Ln
Keller, TX 76244
|
2,506 sq. feet
|
2 baths 3 beds |
show details | |

|
#23
Hollow Valley Dr
Keller, TX 76244
|
2,937 sq. feet
|
2 baths 3 beds |
show details | |

|
#24
Corral Cir
Keller, TX 76244
|
2,770 sq. feet
|
2 baths 4 beds |
show details | |

|
#25
Cold Springs Ct
Keller, TX 76248
|
3,214 sq. feet
|
2 baths 3 beds |
show details | |

|
#26
Star Fish St
Keller, TX 76244
|
1,947 sq. feet
|
2 baths 3 beds |
show details | |

|
#27
Mirage Dr
Keller, TX 76244
|
1,547 sq. feet
|
2 baths 3 beds |
show details | |

|
#28
Cottageville Ln
Keller, TX 76244
|
1,872 sq. feet
|
2 baths 3 beds |
show details | |

|
#29
Diamond Ridge Dr
Keller, TX 76244
|
1,916 sq. feet
|
2 baths 3 beds |
show details | |

|
#30
Emmeryville Ln
Keller, TX 76244
|
2,543 sq. feet
|
2 baths 3 beds |
show details |
| Photo | Address | Area | Beds / Baths | Price | Details |
|---|---|---|---|---|---|

|
#31
Astor Dr
Keller, TX 76244
|
1,364 sq. feet
|
2 baths 3 beds |
show details | |

|
#32
Berrywood Trl
Keller, TX 76244
|
2,435 sq. feet
|
2 baths 3 beds |
show details | |

|
#33
Bayard St
Keller, TX 76244
|
1,903 sq. feet
|
2 baths 3 beds |
show details | |

|
#34
Duncan Way
Keller, TX 76244
|
3,838 sq. feet
|
3 baths 6 beds |
show details | |

|
#35
Gladney Ln
Keller, TX 76244
|
3,152 sq. feet
|
3 baths 5 beds |
show details | |

|
#36
Sundial Dr
Keller, TX 76244
|
2,244 sq. feet
|
2 baths 3 beds |
show details | |

|
#37
Jodi Dr
Keller, TX 76244
|
1,949 sq. feet
|
2 baths 3 beds |
show details | |

|
#38
Muir Dr
Keller, TX 76244
|
1,860 sq. feet
|
2 baths 4 beds |
show details | |

|
#39
Jenny Lake Trl
Keller, TX 76244
|
2,440 sq. feet
|
2 baths 3 beds |
show details | |

|
#40
Bellis Dr
Keller, TX 76244
|
3,068 sq. feet
|
2 baths 4 beds |
show details |
| Photo | Address | Area | Beds / Baths | Price | Details |
|---|---|---|---|---|---|

|
#41
Willow Rock Ln
Keller, TX 76244
|
2,601 sq. feet
|
2 baths 4 beds |
show details | |

|
#42
Ringtail Dr
Keller, TX 76244
|
1,561 sq. feet
|
2 baths 3 beds |
show details | |

|
#43
Valley Stream Way
Keller, TX 76244
|
1,631 sq. feet
|
2 baths 3 beds |
show details | |

|
#44
Blanco Creek Trl
Keller, TX 76244
|
3,697 sq. feet
|
3 baths 5 beds |
show details | |

|
#45
Cottontail Dr
Keller, TX 76244
|
1,840 sq. feet
|
2 baths 3 beds |
show details | |

|
#46
Granite Path
Keller, TX 76244
|
1,607 sq. feet
|
2 baths 3 beds |
show details | |

|
#47
Tupelo Trl
Keller, TX 76244
|
2,678 sq. feet
|
2 baths 4 beds |
show details | |

|
#48
Turkey Creek Dr
Keller, TX 76244
|
2,111 sq. feet
|
2 baths 4 beds |
show details | |

|
#49
Ripley St
Keller, TX 76244
|
2,135 sq. feet
|
2 baths 3 beds |
show details | |

|
Check over 1 million property listings on Foreclosure.com!
|
browse all offers | |||


- 34,59874.9%White alone
- 4,72710.2%Hispanic
- 2,5355.5%Asian alone
- 1,6743.6%Two or more races
- 1,2672.7%Black alone
- 2490.5%Other race alone
- 330.07%American Indian alone
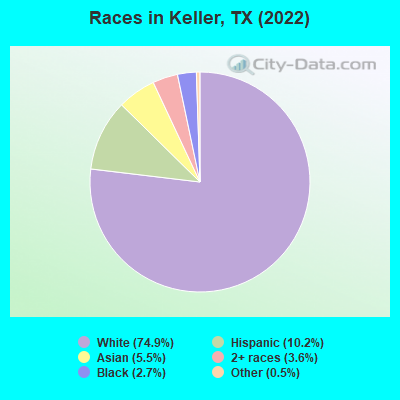
Races in Keller detailed stats: ancestries, foreign born residents, place of birth
According to our research of Texas and other state lists, there were 17 registered sex offenders living in Keller, Texas as of April 27, 2024.
The ratio of all residents to sex offenders in Keller is 2,696 to 1.
The ratio of registered sex offenders to all residents in this city is much lower than the state average.
Type |
2009 |
2010 |
2011 |
2012 |
2013 |
2014 |
2015 |
2016 |
2017 |
2018 |
2019 |
2020 |
2021 |
2022 |
|---|---|---|---|---|---|---|---|---|---|---|---|---|---|---|
| Murders (per 100,000) | 0 (0.0) | 0 (0.0) | 2 (4.9) | 0 (0.0) | 1 (2.3) | 1 (2.3) | 0 (0.0) | 0 (0.0) | 0 (0.0) | 0 (0.0) | 0 (0.0) | 1 (2.1) | 0 (0.0) | 0 (0.0) |
| Rapes (per 100,000) | 0 (0.0) | 5 (12.6) | 5 (12.4) | 2 (4.9) | 5 (11.7) | 7 (16.0) | 6 (13.3) | 8 (17.0) | 7 (14.6) | 10 (20.6) | 4 (8.3) | 10 (20.8) | 14 (29.3) | 10 (22.2) |
| Robberies (per 100,000) | 4 (9.9) | 0 (0.0) | 2 (4.9) | 4 (9.7) | 9 (21.1) | 0 (0.0) | 6 (13.3) | 3 (6.4) | 7 (14.6) | 3 (6.2) | 3 (6.2) | 1 (2.1) | 4 (8.4) | 2 (4.4) |
| Assaults (per 100,000) | 23 (56.9) | 13 (32.8) | 15 (37.1) | 9 (21.9) | 12 (28.1) | 16 (36.6) | 11 (24.4) | 19 (40.4) | 11 (23.0) | 12 (24.8) | 18 (37.2) | 27 (56.1) | 24 (50.3) | 32 (71.0) |
| Burglaries (per 100,000) | 115 (284.5) | 94 (237.2) | 90 (222.4) | 72 (175.0) | 76 (178.2) | 58 (132.7) | 62 (137.8) | 48 (102.0) | 56 (116.9) | 20 (41.3) | 33 (68.2) | 38 (79.0) | 20 (41.9) | 43 (95.4) |
| Thefts (per 100,000) | 377 (932.7) | 406 (1,025) | 398 (983.7) | 303 (736.6) | 312 (731.6) | 305 (697.8) | 258 (573.2) | 210 (446.4) | 233 (486.5) | 287 (592.5) | 302 (624.1) | 273 (567.4) | 215 (450.5) | 249 (552.4) |
| Auto thefts (per 100,000) | 12 (29.7) | 6 (15.1) | 13 (32.1) | 13 (31.6) | 2 (4.7) | 11 (25.2) | 9 (20.0) | 7 (14.9) | 11 (23.0) | 14 (28.9) | 14 (28.9) | 22 (45.7) | 10 (21.0) | 9 (20.0) |
| Arson (per 100,000) | 2 (4.9) | 1 (2.5) | 0 (0.0) | 0 (0.0) | 0 (0.0) | 0 (0.0) | 1 (2.2) | 0 (0.0) | 1 (2.1) | 0 (0.0) | 0 (0.0) | 0 (0.0) | 1 (2.1) | 3 (6.7) |
| City-Data.com crime index | 73.9 | 75.5 | 86.2 | 55.4 | 68.1 | 63.9 | 53.7 | 49.8 | 50.2 | 52.2 | 48.0 | 64.5 | 58.7 | 63.6 |
The City-Data.com crime index weighs serious crimes and violent crimes more heavily. Higher means more crime, U.S. average is 246.1. It adjusts for the number of visitors and daily workers commuting into cities.
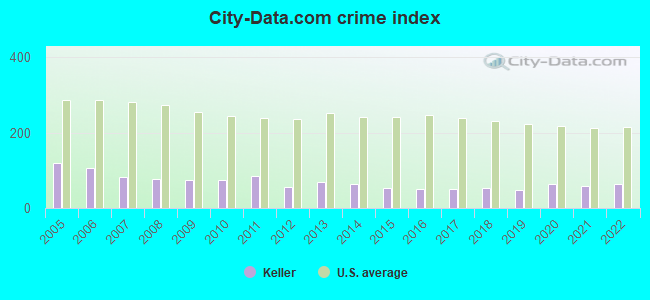
Crime rate in Keller detailed stats: murders, rapes, robberies, assaults, burglaries, thefts, arson
Full-time law enforcement employees in 2021, including police officers: 84 (47 officers - 40 male; 7 female).
| Officers per 1,000 residents here: | 0.98 |
| Texas average: | 2.07 |
 Recent articles from our blog. Our writers, many of them Ph.D. graduates or candidates, create easy-to-read articles on a wide variety of topics.

 | Southlake Carroll iSD/GCISD/NorthwestISD or Keller ISD? (50 replies) |
| Keller - West of 377? (7 replies) |
| Here looking for neighborhoods in Keller, Southlake, Flower Mound, Colleyville (20 replies) |
| Keller--> Fort Worth commute (12 replies) |
| High School and Middle Schools in FM, Keller & Coppell (12 replies) |
| Keller/Southlake Subdivisions: (30 replies) |
Latest news from Keller, TX collected exclusively by city-data.com from local newspapers, TV, and radio stations
Keller, TX City Guides:
Ancestries: American (12.4%), English (11.6%), German (9.1%), Irish (7.1%), Italian (3.3%), European (2.9%).
Current Local Time: CST time zone
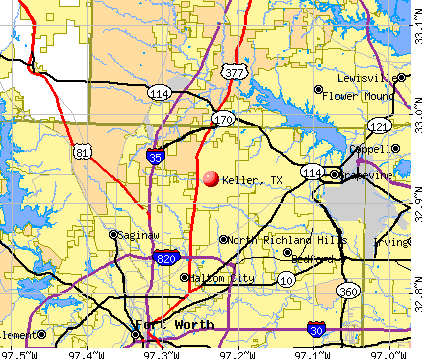
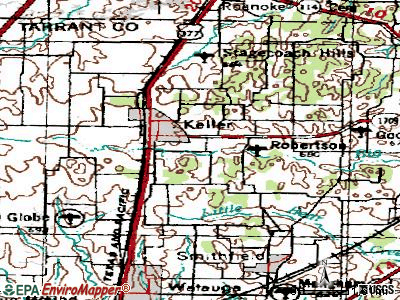
Land area: 18.4 square miles.
Population density: 2,454 people per square mile (low).
4,536 residents are foreign born (4.3% Asia, 3.3% Latin America).
| This city: | 9.8% |
| Texas: | 17.1% |
Median real estate property taxes paid for housing units with mortgages in 2022: $10,402 (1.8%)
Median real estate property taxes paid for housing units with no mortgage in 2022: $8,317 (1.6%)
Nearest city with pop. 50,000+: Northeast Tarrant, TX (4.7 miles  , pop. 402,130).
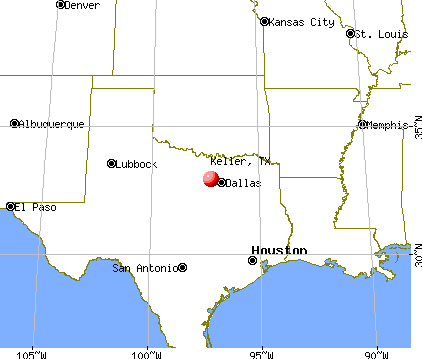
Nearest city with pop. 1,000,000+: Dallas, TX (27.5 miles , pop. 1,188,580).
Nearest cities:
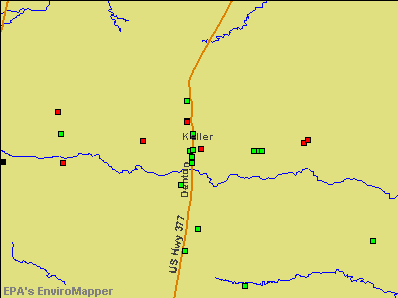
), ), Latitude: 32.93 N, Longitude: 97.24 W
Daytime population change due to commuting: -3,566 (-7.7%)
Workers who live and work in this city: 8,314 (35.7%)
Area code: 817
Property values in Keller, TX

Keller, Texas accommodation & food services, waste management - Economy and Business Data
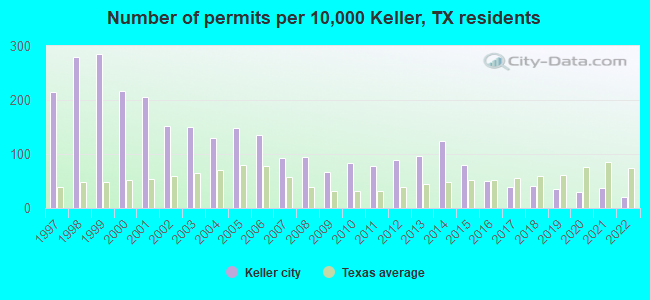
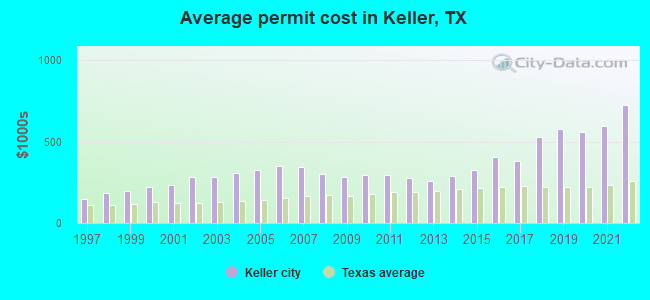
Single-family new house construction building permits:
- 2022: 57 buildings, average cost: $726,900
- 2021: 101 buildings, average cost: $598,500
- 2020: 79 buildings, average cost: $559,900
- 2019: 98 buildings, average cost: $579,300
- 2018: 109 buildings, average cost: $530,100
- 2017: 105 buildings, average cost: $382,300
- 2016: 138 buildings, average cost: $405,600
- 2015: 218 buildings, average cost: $327,200
- 2014: 339 buildings, average cost: $289,700
- 2013: 266 buildings, average cost: $259,600
- 2012: 241 buildings, average cost: $279,200
- 2011: 211 buildings, average cost: $296,300
- 2010: 228 buildings, average cost: $292,800
- 2009: 183 buildings, average cost: $282,500
- 2008: 260 buildings, average cost: $303,400
- 2007: 254 buildings, average cost: $346,900
- 2006: 369 buildings, average cost: $347,900
- 2005: 404 buildings, average cost: $325,900
- 2004: 352 buildings, average cost: $307,600
- 2003: 411 buildings, average cost: $282,400
- 2002: 413 buildings, average cost: $280,600
- 2001: 561 buildings, average cost: $232,900
- 2000: 591 buildings, average cost: $223,900
- 1999: 780 buildings, average cost: $198,900
- 1998: 764 buildings, average cost: $184,900
- 1997: 587 buildings, average cost: $146,500
| Here: | 2.9% |
| Texas: | 3.5% |
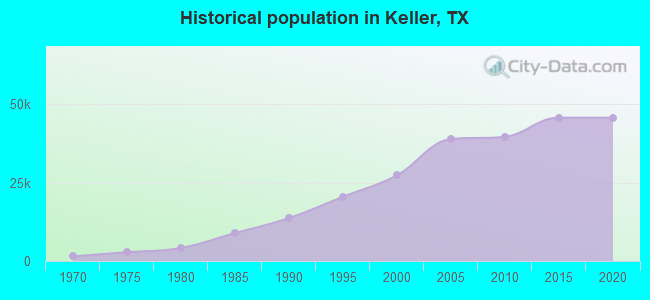
Population change in the 1990s: +13,604 (+99.0%).
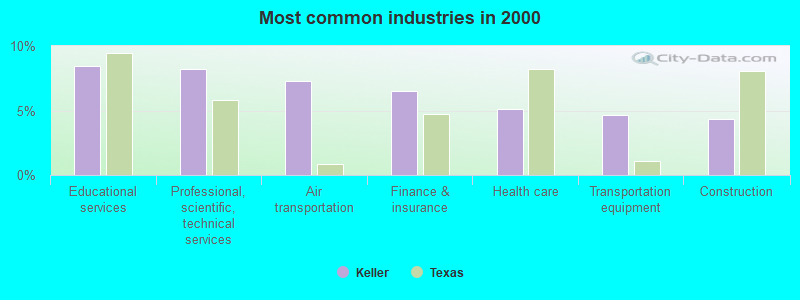
- Educational services (8.4%)
- Professional, scientific, technical services (8.2%)
- Air transportation (7.3%)
- Finance & insurance (6.5%)
- Health care (5.1%)
- Transportation equipment (4.6%)
- Construction (4.3%)
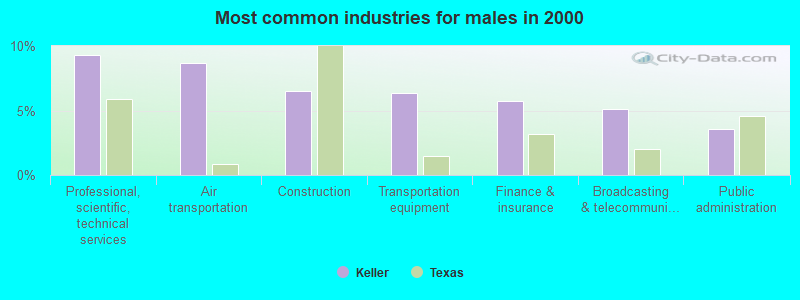
- Professional, scientific, technical services (9.3%)
- Air transportation (8.7%)
- Construction (6.5%)
- Transportation equipment (6.4%)
- Finance & insurance (5.8%)
- Broadcasting & telecommunications (5.1%)
- Public administration (3.6%)
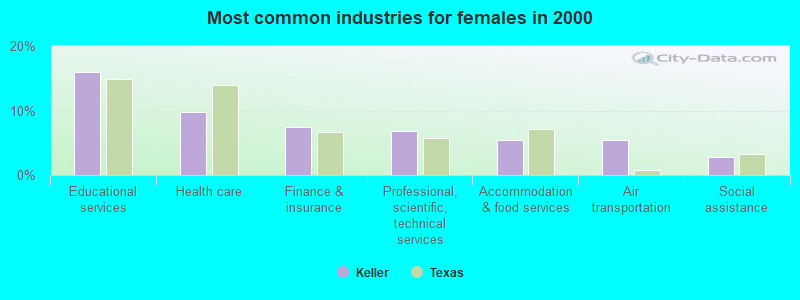
- Educational services (16.0%)
- Health care (9.8%)
- Finance & insurance (7.5%)
- Professional, scientific, technical services (6.8%)
- Accommodation & food services (5.5%)
- Air transportation (5.4%)
- Social assistance (2.8%)

- Other management occupations, except farmers and farm managers (6.5%)
- Computer specialists (5.8%)
- Other sales and related occupations, including supervisors (5.2%)
- Sales representatives, services, wholesale and manufacturing (4.2%)
- Engineers (3.9%)
- Top executives (3.7%)
- Preschool, kindergarten, elementary, and middle school teachers (3.6%)
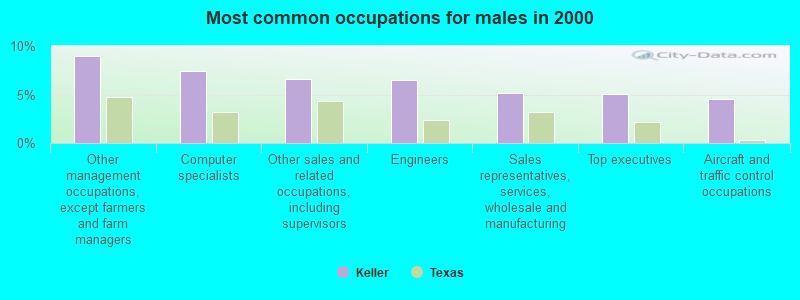
- Other management occupations, except farmers and farm managers (8.9%)
- Computer specialists (7.4%)
- Other sales and related occupations, including supervisors (6.6%)
- Engineers (6.5%)
- Sales representatives, services, wholesale and manufacturing (5.2%)
- Top executives (5.1%)
- Aircraft and traffic control occupations (4.5%)

- Preschool, kindergarten, elementary, and middle school teachers (7.8%)
- Secretaries and administrative assistants (7.3%)
- Other office and administrative support workers, including supervisors (5.5%)
- Information and record clerks, except customer service representatives (4.2%)
- Computer specialists (3.7%)
- Customer service representatives (3.6%)
- Registered nurses (3.5%)
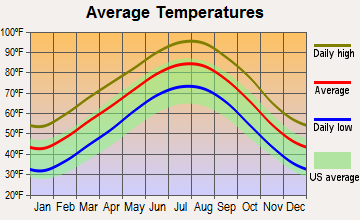
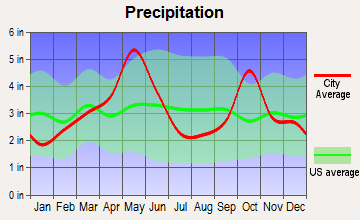
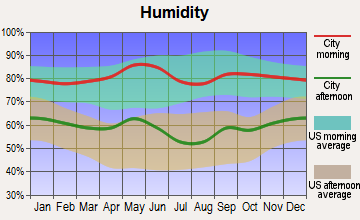
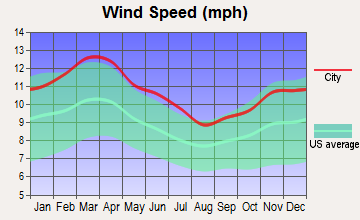
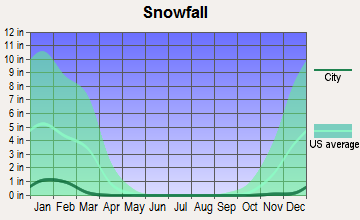
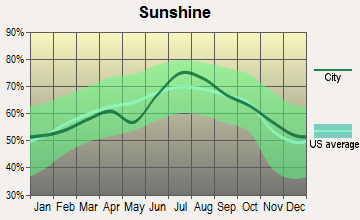
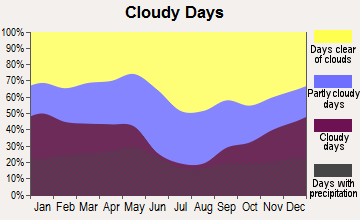
Average climate in Keller, Texas
Based on data reported by over 4,000 weather stations
|
|

(lower is better)
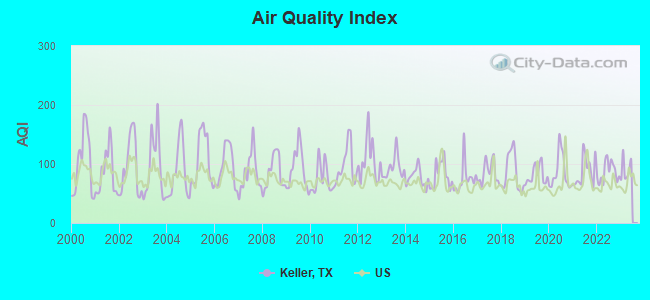
Air Quality Index (AQI) level in 2022 was 86.6. This is about average.
| City: | 86.6 |
| U.S.: | 72.6 |
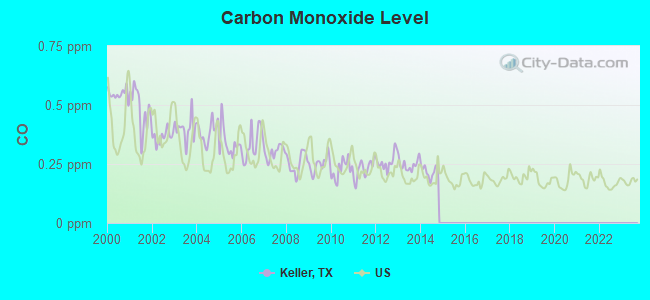
Carbon Monoxide (CO) [ppm] level in 2014 was 0.219. This is about average. Closest monitor was 11.0 miles away from the city center.
| City: | 0.219 |
| U.S.: | 0.251 |
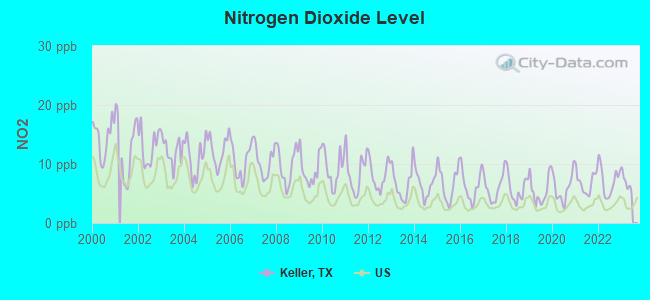
Nitrogen Dioxide (NO2) [ppb] level in 2022 was 7.13. This is worse than average. Closest monitor was 10.0 miles away from the city center.
| City: | 7.13 |
| U.S.: | 5.11 |
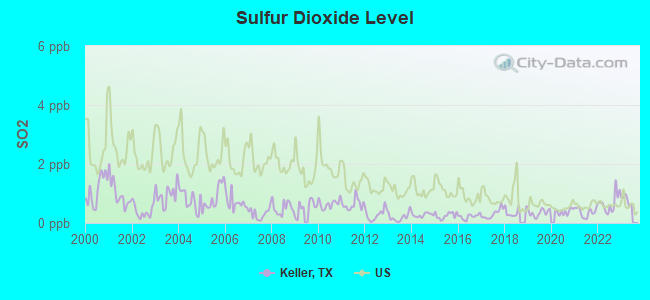
Sulfur Dioxide (SO2) [ppb] level in 2022 was 0.679. This is significantly better than average. Closest monitor was 10.0 miles away from the city center.
| City: | 0.679 |
| U.S.: | 1.515 |
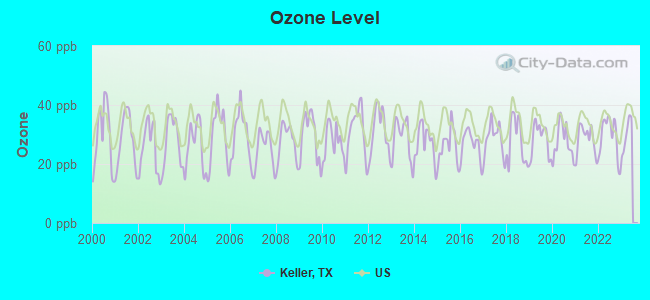
Ozone [ppb] level in 2022 was 29.4. This is about average. Closest monitor was 6.9 miles away from the city center.
| City: | 29.4 |
| U.S.: | 33.3 |
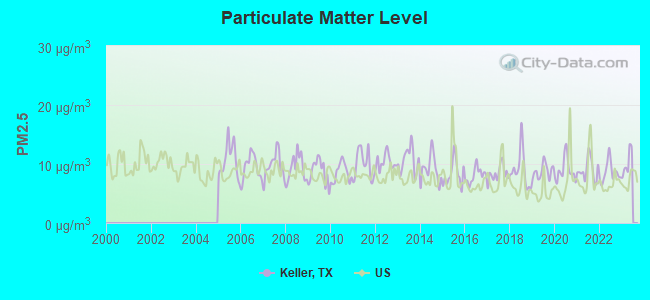
Particulate Matter (PM2.5) [µg/m3] level in 2022 was 8.62. This is about average. Closest monitor was 11.0 miles away from the city center.
| City: | 8.62 |
| U.S.: | 8.11 |
Tornado activity:
Keller-area historical tornado activity is above Texas state average. It is 151% greater than the overall U.S. average.
On 4/25/1990, a category F4 (max. wind speeds 207-260 mph) tornado 29.9 miles away from the Keller city center caused between $500,000 and $5,000,000 in damages.
On 5/4/1960, a category F3 (max. wind speeds 158-206 mph) tornado 6.8 miles away from the city center injured 12 people and caused between $50,000 and $500,000 in damages.
Earthquake activity:
Keller-area historical earthquake activity is significantly above Texas state average. It is 486% greater than the overall U.S. average.On 11/6/2011 at 03:53:10, a magnitude 5.7 (5.7 MW, Depth: 3.2 mi, Class: Moderate, Intensity: VI - VII) earthquake occurred 182.1 miles away from Keller center
On 9/3/2016 at 12:02:44, a magnitude 5.8 (5.8 MW, Depth: 3.5 mi) earthquake occurred 242.5 miles away from Keller center
On 6/16/1978 at 11:46:54, a magnitude 5.3 (4.4 MB, 4.6 UK, 5.3 ML) earthquake occurred 204.9 miles away from Keller center
On 11/7/2016 at 01:44:24, a magnitude 5.0 (5.0 MW, Depth: 2.8 mi) earthquake occurred 213.3 miles away from the city center
On 5/17/2012 at 08:12:00, a magnitude 4.8 (4.8 MW, Depth: 3.1 mi, Class: Light, Intensity: IV - V) earthquake occurred 181.1 miles away from Keller center
On 11/8/2011 at 02:46:57, a magnitude 4.8 (4.8 MW, Depth: 3.1 mi) earthquake occurred 181.9 miles away from the city center
Magnitude types: body-wave magnitude (MB), local magnitude (ML), moment magnitude (MW)
Natural disasters:
The number of natural disasters in Tarrant County (23) is greater than the US average (15).Major Disasters (Presidential) Declared: 10
Emergencies Declared: 10
Causes of natural disasters: Storms: 8, Floods: 7, Hurricanes: 7, Fires: 6, Tornadoes: 5, Wind: 1, Other: 2 (Note: some incidents may be assigned to more than one category).
Hospitals and medical centers in Keller:
Airports located in Keller:
- Hillcrest Airport (7TX4) (Runways: 1)
Amtrak station near Keller:
Colleges/universities with over 2000 students nearest to Keller:
- DeVry University-Texas (about 13 miles; Irving, TX; Full-time enrollment: 4,098)
- Tarrant County College District (about 14 miles; Fort Worth, TX; FT enrollment: 33,775)
- The University of Texas at Arlington (about 16 miles; Arlington, TX; FT enrollment: 27,453)
- North Lake College (about 17 miles; Irving, TX; FT enrollment: 6,191)
- Texas Christian University (about 17 miles; Fort Worth, TX; FT enrollment: 9,131)
- University of Dallas (about 20 miles; Irving, TX; FT enrollment: 2,192)
- University of North Texas (about 21 miles; Denton, TX; FT enrollment: 31,694)
Public high schools in Keller:
- CENTRAL H S (Students: 2,767, Location: 9450 RAY WHITE RD, Grades: 9-12)
- FOSSIL RIDGE H S (Students: 2,189, Location: 4101 THOMPSON RD, Grades: 9-12)
- KELLER H S (Students: 845, Location: 601 N PATE ORR RD, Grades: 9-12)
- NEW DIRECTION LRN CTR (Students: 62, Location: 250 COLLEGE ST, Grades: 9-12)
Biggest public elementary/middle schools in Keller:
- KELLER MIDDLE (Students: 2,805, Location: 300 N COLLEGE ST, Grades: 7-8)
- TRINITY MEADOWS INT (Students: 1,083, Location: 3500 KELLER HICKS RD, Grades: 5-6)
- TRINITY SPRINGS MIDDLE (Students: 993, Location: 3550 KELLER HICKS RD, Grades: 7-8)
- INDIAN SPRINGS MIDDLE (Students: 940, Location: 305 BURSEY RD, Grades: 7-8)
- SOUTH KELLER INT (Students: 869, Location: 201 BURSEY RD, Grades: 5-6)
- BEAR CREEK INT (Students: 847, Location: 801 BEAR CREEK PKWY, Grades: 5-6)
- LONE STAR EL (Students: 780, Location: 4647 SHIVER RD, Grades: KG-4)
- INDEPENDENCE EL (Students: 765, Location: 11773 BRAY BIRCH LN, Grades: KG-4)
- HIDDEN LAKES EL (Students: 720, Location: 900 PRESTON LN, Grades: KG-4)
- FRIENDSHIP EL (Students: 676, Location: 5400 SHIVER RD, Grades: KG-4)
Private elementary/middle school in Keller:
User-submitted facts and corrections:
- Central High School has been added to the Keller ISD.
Points of interest:
Notable locations in Keller: Keller Fire and Rescue (A), Keller Fire and Rescue Station 3 (B), Keller Fire and Rescue Station 2 (C). Display/hide their locations on the map
Churches in Keller include: Amazing Grace Fellowship Church (A), Town Oaks Baptist Church (B), Church of God (C), First United Methodist Church of Keller (D), Calvary United Pentecostal Church (E), Mount Gilead Church (F). Display/hide their locations on the map
Cemetery: Bourland Cemetery (1). Display/hide its location on the map
Parks in Keller include: Keller Independent School District Athletic Complex (1), KMS Stadium (2). Display/hide their locations on the map
Court: Keller City - Municipal Court (330 Rufe Snow Drive).
Birthplace of: Cody Page - College basketball player (Texas Arlington Mavericks), Skyler Albritton - College football player (Sam Houston St. Bearkats).
Drinking water stations with addresses in Keller and their reported violations in the past:
SAMANTHA SPRINGS (Population served: 25, Groundwater):Past monitoring violations:
- One routine major monitoring violation
- One minor monitoring violation
| This city: | 2.9 people |
| Texas: | 2.8 people |
| This city: | 82.8% |
| Whole state: | 69.9% |
| This city: | 2.7% |
| Whole state: | 6.0% |
Likely homosexual households (counted as self-reported same-sex unmarried-partner households)
- Lesbian couples: 0.2% of all households
- Gay men: 0.3% of all households
28 people in nursing homes in 2000
Banks with most branches in Keller (2011 data):
- Bank of America, National Association: Keller Branch, Beach/Tarrant Banking Store Branch, Tarrant Parkway & Rufe Snow Branch. Info updated 2009/11/18: Bank assets: $1,451,969.3 mil, Deposits: $1,077,176.8 mil, headquarters in Charlotte, NC, positive income, 5782 total offices, Holding Company: Bank Of America Corporation
- Woodforest National Bank: Beach Wal-Mart Branch at 8520 Beach Street, branch established on 2004/05/19; Keller Market Branch at 2130 Rufe Snow Dr., branch established on 2001/04/04. Info updated 2011/05/10: Bank assets: $3,488.9 mil, Deposits: $3,097.6 mil, headquarters in Houston, TX, positive income, Commercial Lending Specialization, 766 total offices, Holding Company: Woodforest Financial Group Employee Stock Ownership Plan (With 401(K) Provisions)
- Wells Fargo Bank, National Association: Keller Branch at 910 Keller Pkwy, branch established on 2008/11/18; North Tarrant And Beach Branch at 8620 North Beach Street, branch established on 2006/05/16. Info updated 2011/04/05: Bank assets: $1,161,490.0 mil, Deposits: $905,653.0 mil, headquarters in Sioux Falls, SD, positive income, 6395 total offices, Holding Company: Wells Fargo & Company
- Bank of the Ozarks: Keller Branch at 600 Keller Parkway, branch established on 2011/05/16. Info updated 2011/05/03: Bank assets: $3,828.0 mil, Deposits: $2,955.2 mil, headquarters in Little Rock, AR, positive income, Commercial Lending Specialization, 115 total offices, Holding Company: Bank Of The Ozarks Inc
- Prosperity Bank: Keller Branch at 217 North Main Street, branch established on 2002/02/28. Info updated 2012/01/05: Bank assets: $9,816.2 mil, Deposits: $8,064.8 mil, headquarters in El Campo, TX, positive income, Mortgage Lending Specialization, 187 total offices, Holding Company: Prosperity Bancshares, Inc.
- BOKF, National Association: Keller Kroger Branch at 976 Keller Pkwy., branch established on 2004/02/01. Info updated 2012/02/28: Bank assets: $25,360.0 mil, Deposits: $19,171.3 mil, headquarters in Tulsa, OK, positive income, Commercial Lending Specialization, 189 total offices, Holding Company: Bok Financial Corporation
- Regions Bank: Keller Branch at 521 Keller Parkway, branch established on 2001/11/09. Info updated 2011/02/24: Bank assets: $123,368.2 mil, Deposits: $98,301.3 mil, headquarters in Birmingham, AL, positive income, Commercial Lending Specialization, 1778 total offices, Holding Company: Regions Financial Corporation
- JPMorgan Chase Bank, National Association: Keller Branch at 980 Keller Parkway, branch established on 2001/11/05. Info updated 2011/11/10: Bank assets: $1,811,678.0 mil, Deposits: $1,190,738.0 mil, headquarters in Columbus, OH, positive income, International Specialization, 5577 total offices, Holding Company: Jpmorgan Chase & Co.
- The Frost National Bank: Keller Branch at 1240 Keller Parkway, branch established on 2001/10/29. Info updated 2006/12/21: Bank assets: $20,372.1 mil, Deposits: $16,846.8 mil, headquarters in San Antonio, TX, positive income, Commercial Lending Specialization, 133 total offices, Holding Company: Cullen/Frost Bankers, Inc.
- 4 other banks with 4 local branches
For population 15 years and over in Keller:
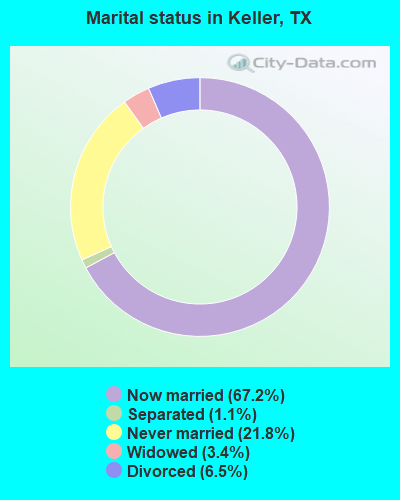
- Never married: 21.8%
- Now married: 67.2%
- Separated: 1.1%
- Widowed: 3.4%
- Divorced: 6.5%
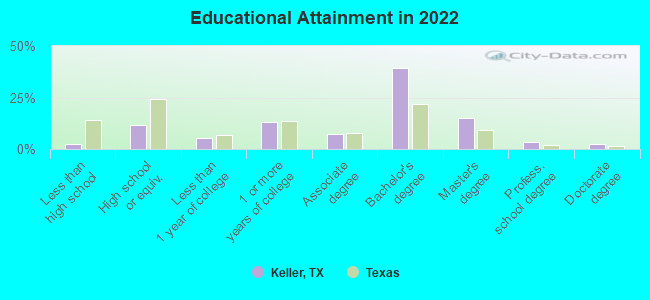
For population 25 years and over in Keller:
- High school or higher: 97.6%
- Bachelor's degree or higher: 59.5%
- Graduate or professional degree: 20.3%
- Unemployed: 2.0%
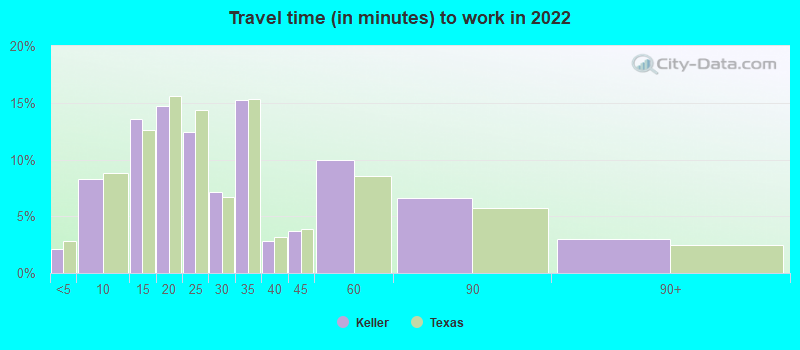
- Mean travel time to work (commute): 20.8 minutes
| Here: | 8.8 |
| Texas average: | 14.0 |
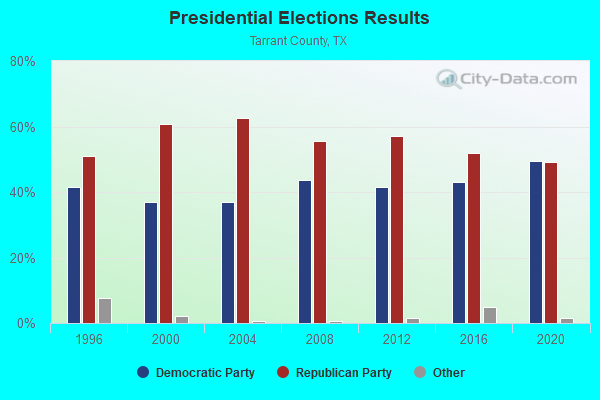
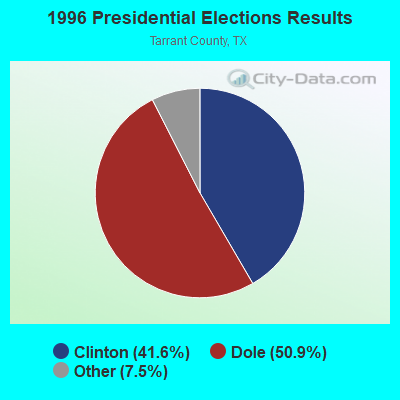
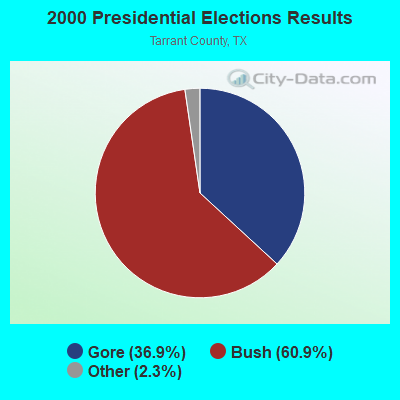
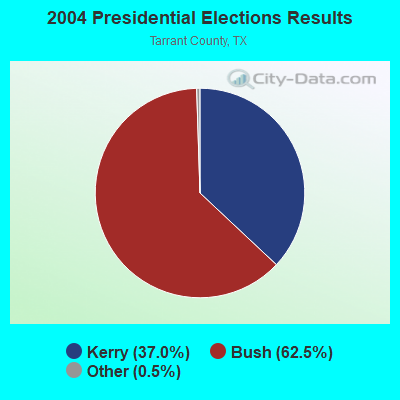
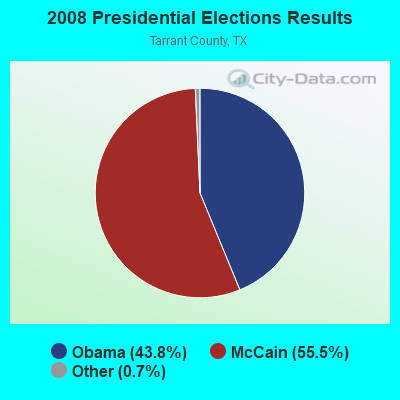
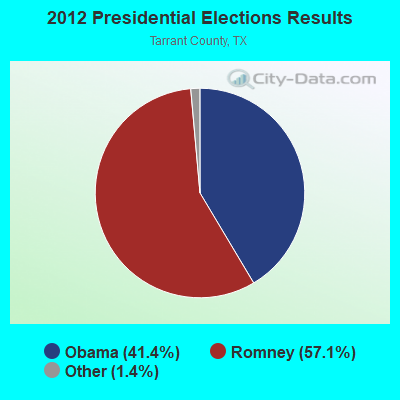
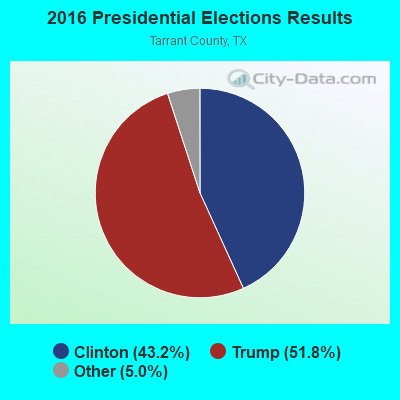
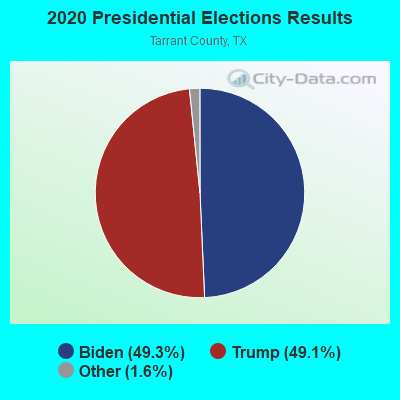
Graphs represent county-level data. Detailed 2008 Election Results
Neighborhoods in Keller:
(Keller, Texas Neighborhood Map)Religion statistics for Keller, TX (based on Tarrant County data)
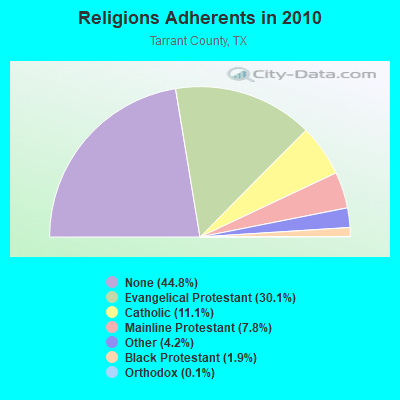
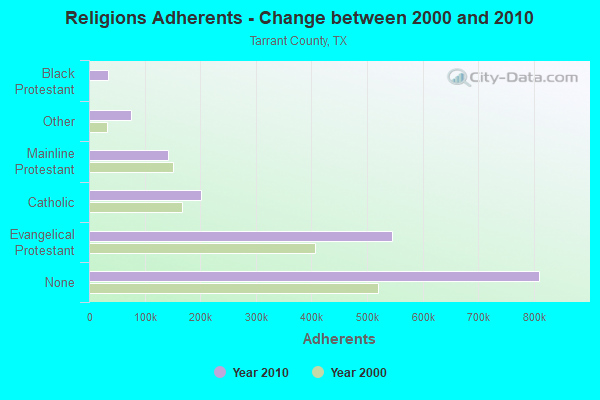
| Religion | Adherents | Congregations |
|---|---|---|
| Evangelical Protestant | 544,670 | 1,272 |
| Catholic | 200,645 | 33 |
| Mainline Protestant | 141,938 | 158 |
| Other | 75,335 | 122 |
| Black Protestant | 33,665 | 103 |
| Orthodox | 2,596 | 7 |
| None | 810,185 | - |
Food Environment Statistics:
| This county: | 1.24 / 10,000 pop. |
| Texas: | 1.47 / 10,000 pop. |
| This county: | 0.15 / 10,000 pop. |
| Texas: | 0.14 / 10,000 pop. |
| Here: | 1.14 / 10,000 pop. |
| Texas: | 1.11 / 10,000 pop. |
| This county: | 3.56 / 10,000 pop. |
| State: | 3.95 / 10,000 pop. |
| Tarrant County: | 5.68 / 10,000 pop. |
| Texas: | 6.13 / 10,000 pop. |
| Tarrant County: | 8.1% |
| State: | 8.9% |
| Tarrant County: | 26.1% |
| Texas: | 26.6% |
| Here: | 14.5% |
| State: | 15.7% |
Health and Nutrition:
| This city: | 53.8% |
| Texas: | 48.6% |
| This city: | 54.6% |
| Texas: | 47.4% |
| Keller: | 28.4 |
| State: | 28.5 |
| This city: | 20.9% |
| State: | 20.6% |
| Keller: | 7.6% |
| State: | 10.3% |
| Here: | 6.8 |
| Texas: | 6.8 |
| This city: | 35.5% |
| State: | 33.1% |
| Keller: | 61.3% |
| Texas: | 56.2% |
| Keller: | 82.2% |
| Texas: | 80.7% |
More about Health and Nutrition of Keller, TX Residents
| Local government employment and payroll (March 2022) | |||||
| Function | Full-time employees | Monthly full-time payroll | Average yearly full-time wage | Part-time employees | Monthly part-time payroll |
|---|---|---|---|---|---|
| Police Protection - Officers | 59 | $369,122 | $75,076 | 1 | $3,705 |
| Firefighters | 50 | $389,576 | $93,498 | 0 | $0 |
| Police - Other | 32 | $183,646 | $68,867 | 0 | $0 |
| Parks and Recreation | 29 | $132,483 | $54,821 | 41 | $22,008 |
| Water Supply | 26 | $119,591 | $55,196 | 0 | $0 |
| Streets and Highways | 19 | $111,754 | $70,581 | 0 | $0 |
| Other and Unallocable | 18 | $94,145 | $62,763 | 3 | $3,972 |
| Financial Administration | 15 | $92,059 | $73,647 | 0 | $0 |
| Local Libraries | 11 | $51,149 | $55,799 | 7 | $9,636 |
| Other Government Administration | 8 | $64,768 | $97,152 | 1 | $1,849 |
| Housing and Community Development (Local) | 5 | $31,098 | $74,635 | 0 | $0 |
| Sewerage | 5 | $23,385 | $56,124 | 0 | $0 |
| Fire - Other | 3 | $31,718 | $126,872 | 0 | $0 |
| Totals for Government | 280 | $1,694,493 | $72,621 | 53 | $41,171 |
Keller government finances - Expenditure in 2021 (per resident):
- Construction - Water Utilities: $5,361,000 ($118.47)
Regular Highways: $3,157,000 ($69.76)
Parks and Recreation: $1,831,000 ($40.46)
General Public Buildings: $1,599,000 ($35.34)
Protective Inspection and Regulation - Other: $1,306,000 ($28.86)
Sewerage: $1,290,000 ($28.51)
- Current Operations - Water Utilities: $20,132,000 ($444.89)
Police Protection: $9,219,000 ($203.73)
Local Fire Protection: $8,779,000 ($194.00)
Sewerage: $4,140,000 ($91.49)
Parks and Recreation: $3,483,000 ($76.97)
Regular Highways: $3,329,000 ($73.57)
Libraries: $1,540,000 ($34.03)
Central Staff Services: $1,396,000 ($30.85)
Financial Administration: $1,275,000 ($28.18)
General Public Buildings: $528,000 ($11.67)
Judicial and Legal Services: $493,000 ($10.89)
- General - Interest on Debt: $1,169,000 ($25.83)
- Total Salaries and Wages: $19,911,000 ($440.00)
- Water Utilities - Interest on Debt: $646,000 ($14.28)
Keller government finances - Revenue in 2021 (per resident):
- Charges - Sewerage: $7,831,000 ($173.05)
Parks and Recreation: $5,747,000 ($127.00)
- Local Intergovernmental - Other: $3,467,000 ($76.62)
- Miscellaneous - General Revenue - Other: $5,847,000 ($129.21)
Interest Earnings: $1,207,000 ($26.67)
Fines and Forfeits: $675,000 ($14.92)
Special Assessments: $482,000 ($10.65)
Sale of Property: $128,000 ($2.83)
- Revenue - Water Utilities: $18,776,000 ($414.92)
- State Intergovernmental - Public Welfare: $3,402,000 ($75.18)
General Local Government Support: $115,000 ($2.54)
- Tax - Property: $24,084,000 ($532.22)
General Sales and Gross Receipts: $14,359,000 ($317.31)
Other License: $1,061,000 ($23.45)
Keller government finances - Debt in 2021 (per resident):
- Long Term Debt - Outstanding Unspecified Public Purpose: $60,884,000 ($1345.44)
Beginning Outstanding - Unspecified Public Purpose: $60,647,000 ($1340.21)
Issue, Unspecified Public Purpose: $14,489,000 ($320.18)
Retired Unspecified Public Purpose: $14,252,000 ($314.95)
Beginning Outstanding - Public Debt for Private Purpose: $953,000 ($21.06)
Outstanding Nonguaranteed - Industrial Revenue: $942,000 ($20.82)
Retired Nonguaranteed - Public Debt for Private Purpose: $11,000 ($0.24)
Keller government finances - Cash and Securities in 2021 (per resident):
- Bond Funds - Cash and Securities: $11,787,000 ($260.47)
- Other Funds - Cash and Securities: $102,661,000 ($2268.65)
- Sinking Funds - Cash and Securities: $3,254,000 ($71.91)
7.43% of this county's 2021 resident taxpayers lived in other counties in 2020 ($70,478 average adjusted gross income)
| Here: | 7.43% |
| Texas average: | 8.12% |
0.03% of residents moved from foreign countries ($213 average AGI)
Tarrant County: 0.03% Texas average: 0.04%
Top counties from which taxpayers relocated into this county between 2020 and 2021:
| from Dallas County, TX | |
| from Denton County, TX | |
| from Johnson County, TX |
7.19% of this county's 2020 resident taxpayers moved to other counties in 2021 ($70,939 average adjusted gross income)
| Here: | 7.19% |
| Texas average: | 7.40% |
0.03% of residents moved to foreign countries ($199 average AGI)
Tarrant County: 0.03% Texas average: 0.03%
Top counties to which taxpayers relocated from this county between 2020 and 2021:
| to Dallas County, TX | |
| to Denton County, TX | |
| to Johnson County, TX |
| Businesses in Keller, TX | ||||
| Name | Count | Name | Count | |
|---|---|---|---|---|
| 7-Eleven | 2 | Lowe's | 1 | |
| AT&T | 1 | McDonald's | 2 | |
| Ace Hardware | 1 | Nike | 2 | |
| Arby's | 1 | Papa John's Pizza | 1 | |
| AutoZone | 2 | Popeyes | 1 | |
| CVS | 3 | Quiznos | 1 | |
| DHL | 2 | RadioShack | 1 | |
| Discount Tire | 1 | SONIC Drive-In | 4 | |
| Domino's Pizza | 1 | Safeway | 1 | |
| FedEx | 6 | Sephora | 1 | |
| GNC | 1 | Starbucks | 2 | |
| GameStop | 1 | Subway | 6 | |
| H&R Block | 1 | T-Mobile | 1 | |
| Home Depot | 1 | T.G.I. Driday's | 1 | |
| Jack In The Box | 1 | Taco Bell | 2 | |
| KFC | 1 | U-Haul | 3 | |
| Kohl's | 1 | UPS | 4 | |
| Kroger | 2 | Vons | 1 | |
| LA Fitness | 1 | Walgreens | 2 | |
| Little Caesars Pizza | 2 | Walmart | 1 | |
Strongest AM radio stations in Keller:
- KESS (1270 AM; 50 kW; FORT WORTH, TX; Owner: KESS-AM LICENSE CORP.)
- KAHZ (1360 AM; 50 kW; HURST, TX)
- KZMP (1540 AM; 50 kW; UNIVERSITY PARK, TX; Owner: ENTRAVISION HOLDINGS, LLC)
- WBAP (820 AM; 50 kW; FORT WORTH, TX; Owner: WBAP-KSCS OPERATING, LTD.)
- KHVN (970 AM; 10 kW; FORT WORTH, TX; Owner: MORTENSON BROADCASTING COMPANY)
- KBIS (1150 AM; 25 kW; HIGHLAND PARK, TX; Owner: DALLAS AM RADIO PARTNERS, L.P.)
- KNAX (1630 AM; 10 kW; FT. WORTH, TX; Owner: MORTENSON BROADCASTING COMPANY)
- KLIF (570 AM; 5 kW; DALLAS, TX; Owner: KLIF LICO, INC.)
- KRLD (1080 AM; 50 kW; DALLAS, TX; Owner: TEXAS INFINITY BROADCASTING L.P.)
- KTNO (1440 AM; 12 kW; DENTON, TX; Owner: MORTENSON BROADCASTING COMPANY)
- KSKY (660 AM; 20 kW; BALCH SPRINGS, TX; Owner: BISON MEDIA, INC.)
- KTCK (1310 AM; 9 kW; DALLAS, TX; Owner: KRBE LICO, INC.)
- KFXR (1190 AM; 50 kW; DALLAS, TX; Owner: CLEAR CHANNEL BROADCASTING LICENSES, INC.)
Strongest FM radio stations in Keller:
- KPLX (99.5 FM; FORT WORTH, TX; Owner: KPLX LICO, INC.)
- KLUV-FM (98.7 FM; DALLAS, TX; Owner: INFINITY BROADCASTING CORPORATION OF DALLAS)
- KLLI (105.3 FM; DALLAS, TX; Owner: INFINITY BROADCASTING CORPORATION OF DALLAS)
- KKDA-FM (104.5 FM; DALLAS, TX; Owner: SERVICE BROADCASTING I, LTD.)
- KZPS (92.5 FM; DALLAS, TX; Owner: AMFM TEXAS LICENSES LIMITED PARTNERSHIP)
- KHKS (106.1 FM; DENTON, TX; Owner: AMFM TEXAS LICENSES LIMITED PARTNERSHIP)
- KVIL-FM (103.7 FM; HIGHLAND PARK-DALLAS, TX; Owner: INFINITY BROADCASTING CORPORATION OF TEXAS)
- KOAI (107.5 FM; FORT WORTH, TX; Owner: INFINITY KOAI-FM, INC.)
- KBFB (97.9 FM; DALLAS, TX; Owner: RADIO ONE LICENSES, LLC)
- KSCS (96.3 FM; FORT WORTH, TX; Owner: WBAP-KSCS OPERATING, LTD.)
- KLNO (94.1 FM; FORT WORTH, TX; Owner: HBC LICENSE CORPORATION)
- KRBV (100.3 FM; DALLAS, TX; Owner: INFINITY BROADCASTING CORP. OF FORT WORTH)
- KEGL (97.1 FM; FORT WORTH, TX; Owner: CITICASTERS LICENSES, L.P.)
- WRR (101.1 FM; DALLAS, TX; Owner: CITY OF DALLAS, TEXAS)
- KCBI (90.9 FM; DALLAS, TX; Owner: CRISWELL CENTER FOR BIBLICAL STUDIES)
- KDGE (102.1 FM; FORT WORTH-DALLAS, TX; Owner: CAPSTAR TX LIMITED PARTNERSHIP)
- KDMX (102.9 FM; DALLAS, TX; Owner: CITICASTERS LICENSES, L.P.)
- KMEO (96.7 FM; FLOWER MOUND, TX; Owner: ABC, INC.)
- KKDL (106.7 FM; MUENSTER, TX; Owner: ENTRAVISION HOLDINGS, LLC)
- KZMP-FM (101.7 FM; AZLE, TX; Owner: ENTRAVISION HOLDINGS, LLC)
TV broadcast stations around Keller:
- KLDT (Channel 55; LAKE DALLAS, TX; Owner: JOHNSON BROADCASTING OF DALLAS, INC.)
- KXAS-TV (Channel 5; FORT WORTH, TX; Owner: STATION VENTURE OPERATIONS, LP)
- KDTN (Channel 2; DENTON, TX; Owner: NORTH TEXAS PUBLIC BROADCASTING, INC.)
- KTVT (Channel 11; FORT WORTH, TX; Owner: CBS STATIONS GROUP OF TEXAS L.P.)
- KSTR-TV (Channel 49; IRVING, TX; Owner: TELEFUTURA DALLAS LLC)
- KPXD (Channel 68; ARLINGTON, TX; Owner: PAXSON DALLAS LICENSE, INC.)
- KUVN (Channel 23; GARLAND, TX; Owner: KUVN LICENSE PARTNERSHIP, L.P.)
- KTXA (Channel 21; FORT WORTH, TX; Owner: VIACOM TELEVISION STATIONS GROUP OF DALLAS/FORT WORTH L.P.)
- KMPX (Channel 29; DECATUR, TX; Owner: WORD OF GOD FELLOWSHIP, INC.)
- KFWD (Channel 52; FORT WORTH, TX; Owner: HIC BROADCAST, INC.)
- WFAA-TV (Channel 8; DALLAS, TX; Owner: WFAA-TV, L.P.)
- KDFW (Channel 4; DALLAS, TX; Owner: KDFW LICENSE, INC.)
- KDTX-TV (Channel 58; DALLAS, TX; Owner: TRINITY BROADCASTING OF TEXAS, INC.)
- KXTX-TV (Channel 39; DALLAS, TX; Owner: TELEMUNDO OF TEXAS PARTNERSHIP, LP)
- KERA-TV (Channel 13; DALLAS, TX; Owner: NORTH TEXAS PUBLIC BROADCASTING, INC.)
- KDAF (Channel 33; DALLAS, TX; Owner: TRIBUNE TELEVISION COMPANY)
- KDFI (Channel 27; DALLAS, TX; Owner: NEW DMIC, INC.)
- KUVN-CA (Channel 31; FORT WORTH, TX; Owner: KUVN LICENSE PARTNERSHIP, L.P.)
- K26HF (Channel 26; BRITTON, TX; Owner: MAKO COMMUNICATIONS, LLC)
- KHPK-LP (Channel 28; DE SOTO, TX; Owner: MAKO COMMUNICATIONS, LLC)
- KLEG-LP (Channel 44; DALLAS, TX; Owner: DILIP VISWANATH)
- K25FW (Channel 25; CORSICANA, TX; Owner: VENTANA TELEVISION, INC.)
- KATA-LP (Channel 60; MESQUITE, TX; Owner: JANE McGINNIS)
- KVFW-LP (Channel 65; FORT WORTH, TX; Owner: GERALD BENAVIDES)
- KJJM-LP (Channel 46; DALLAS/MESQUITE, TX; Owner: JANE McGINNIS)
- National Bridge Inventory (NBI) Statistics
- 43Number of bridges
- 348ft / 106mTotal length
- $216,000Total costs
- 433,312Total average daily traffic
- 6,793Total average daily truck traffic
- 578,355Total future (year 2029) average daily traffic
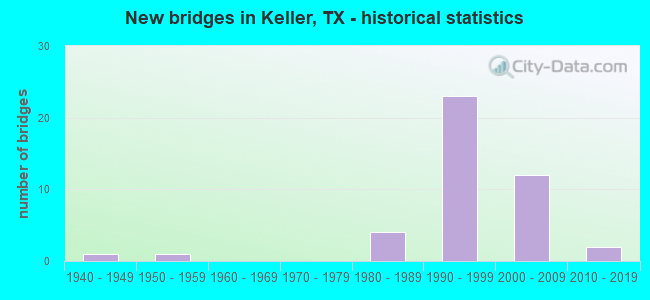
- New bridges - historical statistics
- 11940-1949
- 11950-1959
- 41980-1989
- 231990-1999
- 122000-2009
- 22010-2019
FCC Registered Private Land Mobile Towers: 1 (See the full list of FCC Registered Private Land Mobile Towers in Keller, TX)
FCC Registered Broadcast Land Mobile Towers: 14 (See the full list of FCC Registered Broadcast Land Mobile Towers)
FCC Registered Microwave Towers: 30 (See the full list of FCC Registered Microwave Towers in this town)
FCC Registered Paging Towers: 2 (See the full list of FCC Registered Paging Towers)
FCC Registered Amateur Radio Licenses: 442 (See the full list of FCC Registered Amateur Radio Licenses in Keller)
FAA Registered Aircraft Manufacturers and Dealers: 2 (See the full list of FAA Registered Manufacturers and Dealers in Keller)
FAA Registered Aircraft: 106 (See the full list of FAA Registered Aircraft)
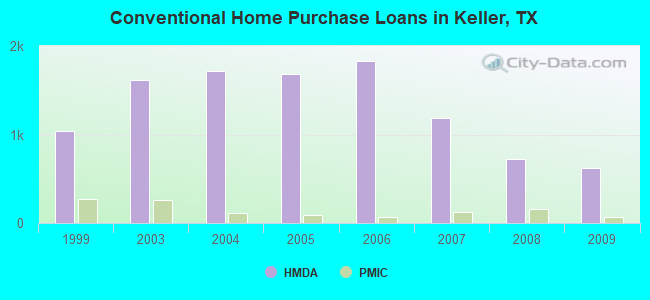
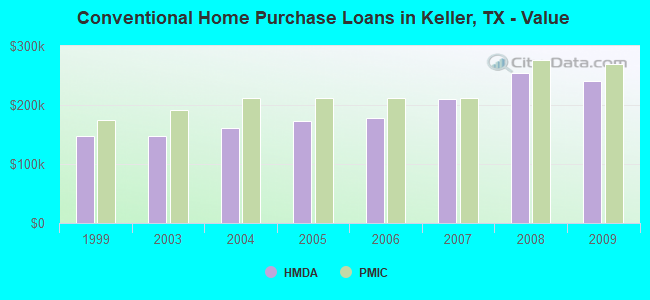
| Home Mortgage Disclosure Act Aggregated Statistics For Year 2009 (Based on 3 full and 2 partial tracts) | ||||||||||||
| A) FHA, FSA/RHS & VA Home Purchase Loans | B) Conventional Home Purchase Loans | C) Refinancings | D) Home Improvement Loans | F) Non-occupant Loans on < 5 Family Dwellings (A B C & D) | G) Loans On Manufactured Home Dwelling (A B C & D) | |||||||
|---|---|---|---|---|---|---|---|---|---|---|---|---|
| Number | Average Value | Number | Average Value | Number | Average Value | Number | Average Value | Number | Average Value | Number | Average Value | |
| LOANS ORIGINATED | 266 | $190,514 | 618 | $240,668 | 1,340 | $235,799 | 73 | $88,947 | 41 | $172,492 | 1 | $48,980 |
| APPLICATIONS APPROVED, NOT ACCEPTED | 9 | $191,749 | 44 | $217,885 | 95 | $242,056 | 16 | $78,306 | 1 | $242,530 | 1 | $36,000 |
| APPLICATIONS DENIED | 52 | $179,091 | 76 | $245,775 | 266 | $240,674 | 52 | $52,763 | 10 | $177,897 | 2 | $43,635 |
| APPLICATIONS WITHDRAWN | 39 | $177,334 | 66 | $269,125 | 250 | $251,710 | 12 | $178,138 | 7 | $183,253 | 0 | $0 |
| FILES CLOSED FOR INCOMPLETENESS | 5 | $107,800 | 12 | $372,925 | 63 | $259,741 | 2 | $56,045 | 1 | $280,000 | 0 | $0 |
Detailed HMDA statistics for the following Tracts: 1138.06 , 1138.07, 1139.10, 1139.11, 1139.12
| Private Mortgage Insurance Companies Aggregated Statistics For Year 2009 (Based on 3 full and 2 partial tracts) | ||||
| A) Conventional Home Purchase Loans | B) Refinancings | |||
|---|---|---|---|---|
| Number | Average Value | Number | Average Value | |
| LOANS ORIGINATED | 72 | $269,843 | 34 | $282,857 |
| APPLICATIONS APPROVED, NOT ACCEPTED | 19 | $294,828 | 10 | $277,151 |
| APPLICATIONS DENIED | 9 | $261,967 | 6 | $286,002 |
| APPLICATIONS WITHDRAWN | 4 | $349,552 | 1 | $254,820 |
| FILES CLOSED FOR INCOMPLETENESS | 2 | $201,855 | 0 | $0 |
Detailed PMIC statistics for the following Tracts: 1138.06 , 1138.07, 1139.10, 1139.11, 1139.12
2002 - 2018 National Fire Incident Reporting System (NFIRS) incidents
- Fire incident types reported to NFIRS in Keller, TX
- 96350.2%Structure Fires
- 73238.1%Outside Fires
- 1789.3%Mobile Property/Vehicle Fires
- 472.4%Other
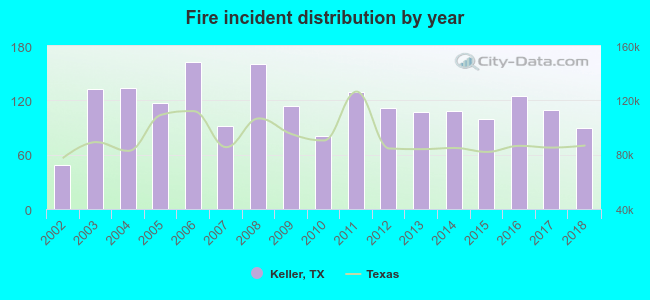 According to the data from the years 2002 - 2018 the average number of fires per year is 113. The highest number of fires - 162 took place in 2006, and the least - 49 in 2002. The data has an increasing trend.
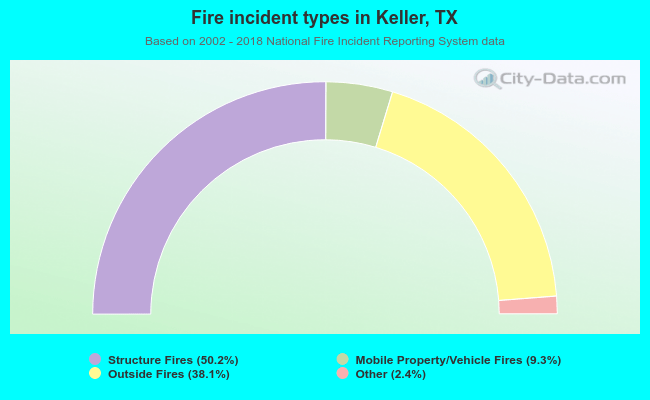 When looking into fire subcategories, the most reports belonged to: Structure Fires (50.2%), and Outside Fires (38.1%).
| Most common first names in Keller, TX among deceased individuals | ||
| Name | Count | Lived (average) |
|---|---|---|
| John | 56 | 74.2 years |
| Mary | 49 | 80.5 years |
| William | 46 | 75.3 years |
| James | 46 | 70.6 years |
| Robert | 46 | 69.5 years |
| Charles | 40 | 75.8 years |
| Dorothy | 31 | 77.6 years |
| Helen | 19 | 82.6 years |
| George | 17 | 78.5 years |
| Roy | 17 | 72.8 years |
| Most common last names in Keller, TX among deceased individuals | ||
| Last name | Count | Lived (average) |
|---|---|---|
| Smith | 21 | 77.1 years |
| Davis | 14 | 73.7 years |
| Johnson | 13 | 68.4 years |
| Brown | 13 | 77.1 years |
| Blevins | 12 | 77.3 years |
| Williams | 11 | 79.7 years |
| Jones | 11 | 80.1 years |
| Jackson | 11 | 74.8 years |
| Martin | 10 | 74.3 years |
| Thompson | 9 | 72.3 years |
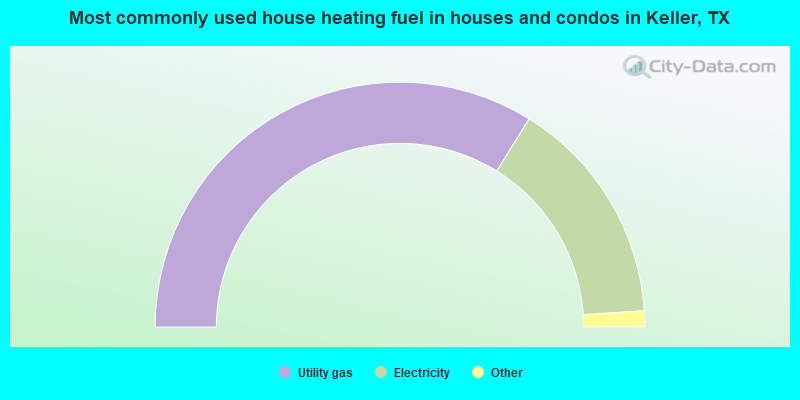
- 67.7%Utility gas
- 30.2%Electricity
- 1.9%Bottled, tank, or LP gas
- 0.1%No fuel used
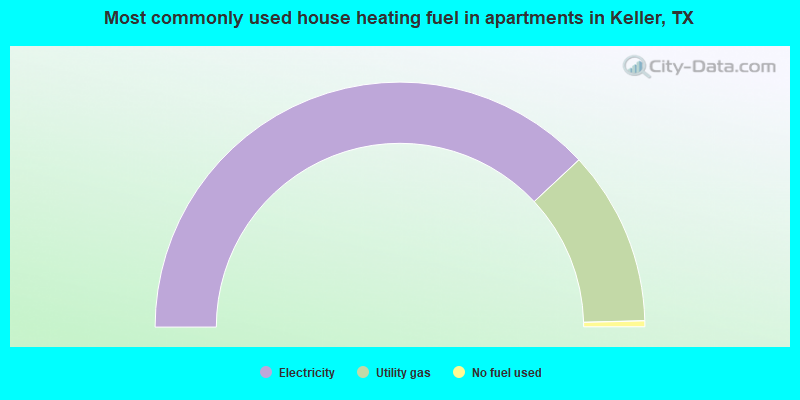
- 76.1%Electricity
- 23.1%Utility gas
- 0.8%No fuel used
Keller compared to Texas state average:
- Median household income above state average.
- Median house value above state average.
- Unemployed percentage significantly below state average.
- Black race population percentage below state average.
- Hispanic race population percentage below state average.
- Median age significantly above state average.
- Renting percentage significantly below state average.
- Length of stay since moving in above state average.
- Number of rooms per house significantly above state average.
- House age below state average.
- Percentage of population with a bachelor's degree or higher significantly above state average.

|
|
Total of 925 patent applications in 2008-2024.