Estimated zip code population in 2022: 14,001 Zip code population in 2010: 13,043 Zip code population in 2000: 13,594
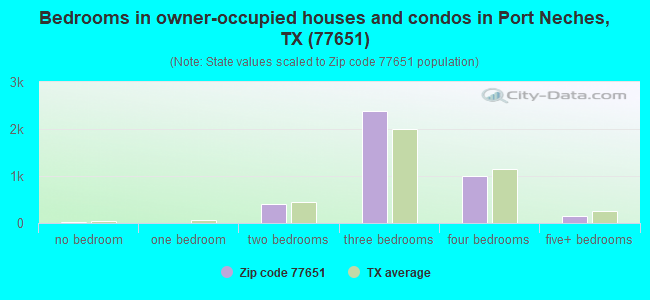
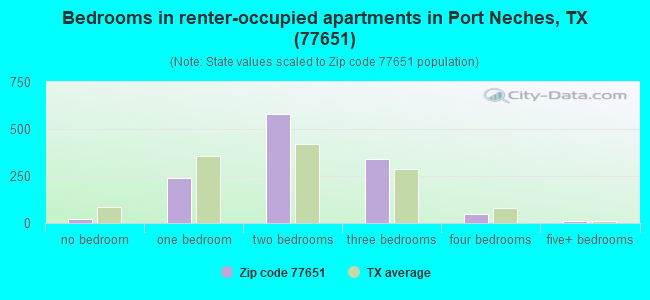
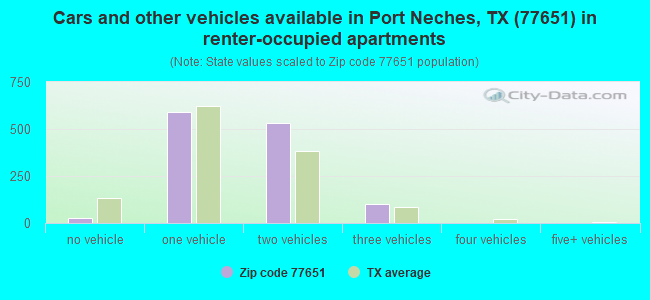
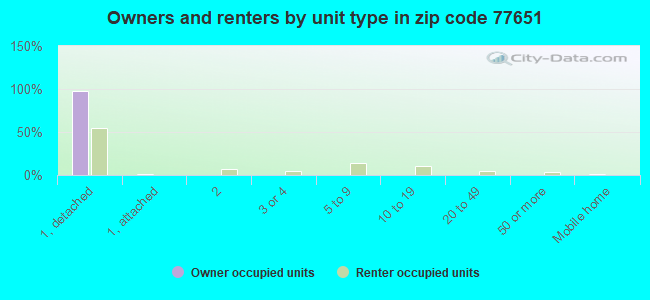
Houses and condos: 5,857 Renter-occupied apartments: 1,258
% of renters here:
24%
State:
38%
March 2022 cost of living index in zip code 77651: 82.4 (low, U.S. average is 100)
Land area: 12.4 sq. mi. Water area: 1.8 sq. mi.
Population density: 1,131 people per square mile
(low).
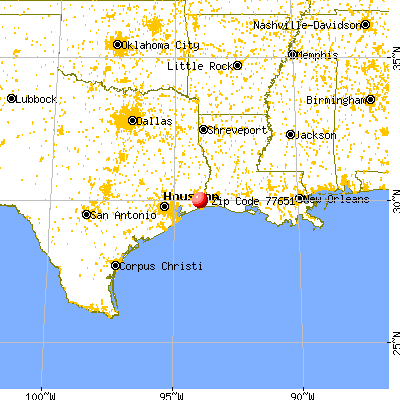
OSM Map
General Map
Google Map
MSN Map
OSM Map
General Map
Google Map
MSN Map
OSM Map
General Map
Google Map
MSN Map
OSM Map
General Map
Google Map
MSN Map
Please wait while loading the map...
Real estate property taxes paid for housing units in 2022:
This zip code:
1.3% ($3,447)
Texas:
1.5% ($4,050)
Median real estate property taxes paid for housing units with mortgages in 2022: $4,250 (1.5%) Median real estate property taxes paid for housing units with no mortgage in 2022: $3,132 (1.3%)
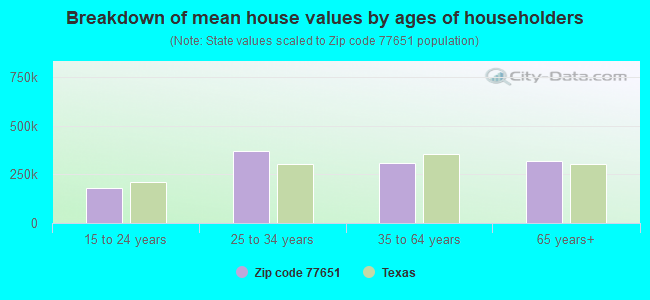
Estimated median house/condo value in 2022: $258,621
77651:
$258,621
Texas:
$275,400
According to our research of Texas and other state lists, there were 11 registered sex offenders living in 77651 zip code as of April 27, 2024. The ratio of all residents to sex offenders in zip code 77651 is 1,180 to 1. The ratio of registered sex offenders to all residents in this zip code is much lower than the state average.
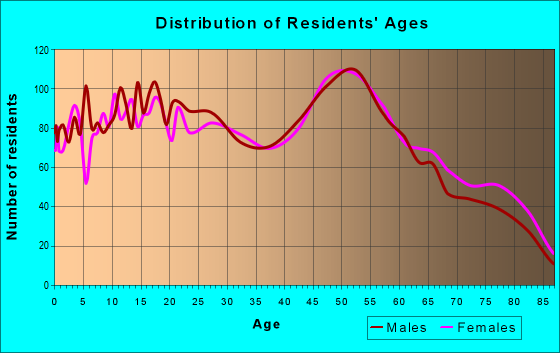
Median resident age:
This zip code:
39.4 years
Texas median age:
35.6 years
Average household size:
This zip code:
2.7 people
Texas:
2.6 people
Averages for the 2020 tax year for zip code 77651, filed in 2021:
Average Adjusted Gross Income (AGI) in 2020: $80,840 (Individual Income Tax Returns)
Here:
$80,840
State:
$77,054
Salary/wage: $70,854 (reported on 80.0% of returns)
Here:
$70,854
State:
$62,766
(% of AGI for various income ranges: 1029.7% for AGIs below $25k, 3209.8% for AGIs $25k-50k, 5669.1% for AGIs $50k-75k, 8572.8% for AGIs $75k-100k, 15533.3% for AGIs $100k-200k, 52595.3% for AGIs over 200k)
Taxable interest for individuals: $1,634 (reported on 42.2% of returns)
This zip code:
$1,634
Texas:
$2,665
(% of AGI for various income ranges: 18.1% for AGIs below $25k, 33.4% for AGIs $25k-50k, 41.5% for AGIs $50k-75k, 73.0% for AGIs $75k-100k, 111.1% for AGIs $100k-200k, 1335.3% for AGIs over 200k)
Ordinary dividends: $7,314 (reported on 21.0% of returns)
Here:
$7,314
State:
$10,044
(% of AGI for various income ranges: 31.4% for AGIs below $25k, 67.2% for AGIs $25k-50k, 123.8% for AGIs $50k-75k, 190.2% for AGIs $75k-100k, 275.3% for AGIs $100k-200k, 2709.3% for AGIs over 200k)
Net capital gain/loss in AGI: +$11,588 (reported on 18.4% of returns)
Here:
+$11,588
State:
+$39,590
(% of AGI for various income ranges: 9.9% for AGIs below $25k, 32.6% for AGIs $25k-50k, 79.5% for AGIs $50k-75k, 87.6% for AGIs $75k-100k, 299.7% for AGIs $100k-200k, 5918.0% for AGIs over 200k)
Profit/loss from business: +$8,180 (reported on 14.7% of returns)
Here:
+$8,180
State:
+$10,888
(% of AGI for various income ranges: 60.4% for AGIs below $25k, 24.4% for AGIs $25k-50k, 40.5% for AGIs $50k-75k, 34.8% for AGIs $75k-100k, 177.8% for AGIs $100k-200k, 2805.3% for AGIs over 200k)
Taxable individual retirement arrangement distribution: $28,964 (reported on 14.8% of returns)
77651:
$28,964
Texas:
$24,740
(% of AGI for various income ranges: 87.7% for AGIs below $25k, 217.9% for AGIs $25k-50k, 430.6% for AGIs $50k-75k, 810.9% for AGIs $75k-100k, 1128.3% for AGIs $100k-200k, 3871.3% for AGIs over 200k)
Total itemized deductions: $38,717 (reported on 8.6% of returns)
Here:
$38,717
State:
$40,428
(% of AGI for various income ranges: 48.1% for AGIs below $25k, 130.3% for AGIs $25k-50k, 366.5% for AGIs $50k-75k, 574.6% for AGIs $75k-100k, 734.3% for AGIs $100k-200k, 4401.3% for AGIs over 200k)
Charity contributions: $13,358 (reported on 5.9% of returns)
Here:
$13,358
State:
$18,201
(% of AGI for various income ranges: 27.7% for AGIs $25k-50k, 61.4% for AGIs $50k-75k, 110.9% for AGIs $75k-100k, 158.3% for AGIs $100k-200k, 1416.7% for AGIs over 200k)
Taxes paid: $6,945 (reported on 6.8% of returns)
77651:
$6,945
State:
$7,821
(% of AGI for various income ranges: 5.1% for AGIs below $25k, 14.1% for AGIs $25k-50k, 44.0% for AGIs $50k-75k, 81.3% for AGIs $75k-100k, 113.7% for AGIs $100k-200k, 647.3% for AGIs over 200k)
Earned income credit: $2,280 (reported on 13.2% of returns)
Here:
$2,280
State:
$2,584
(% of AGI for various income ranges: 92.4% for AGIs below $25k, 63.1% for AGIs $25k-50k)
Percentage of individuals using paid preparers for their 2020 taxes: 89.4%
Here:
89%
State:
92%
(% for various income ranges: 87.8% for AGIs below $25k, 90.8% for AGIs $25k-50k, 91.7% for AGIs $50k-75k, 89.1% for AGIs $75k-100k, 89.0% for AGIs $100k-200k, 89.5% for AGIs over 200k)
Averages for the 2012 tax year for zip code 77651, filed in 2013:
Average Adjusted Gross Income (AGI) in 2012: $68,075 (Individual Income Tax Returns)
Here:
$68,075
State:
$65,384
Salary/wage: $58,379 (reported on 81.2% of returns)
Here:
$58,379
State:
$52,524
(% of AGI for various income ranges: 67.0% for AGIs below $25k, 73.2% for AGIs $25k-50k, 72.0% for AGIs $50k-75k, 76.3% for AGIs $75k-100k, 80.9% for AGIs $100k-200k, 41.4% for AGIs over 200k)
Taxable interest for individuals: $1,546 (reported on 43.0% of returns)
This zip code:
$1,546
Texas:
$2,372
(% of AGI for various income ranges: 2.1% for AGIs below $25k, 1.1% for AGIs $25k-50k, 0.8% for AGIs $50k-75k, 0.8% for AGIs $75k-100k, 0.6% for AGIs $100k-200k, 1.6% for AGIs over 200k)
Ordinary dividends: $5,191 (reported on 22.1% of returns)
Here:
$5,191
State:
$9,721
(% of AGI for various income ranges: 2.1% for AGIs below $25k, 1.2% for AGIs $25k-50k, 1.5% for AGIs $50k-75k, 1.3% for AGIs $75k-100k, 1.2% for AGIs $100k-200k, 3.1% for AGIs over 200k)
Net capital gain/loss in AGI: +$6,782 (reported on 17.0% of returns)
Here:
+$6,782
State:
+$35,319
(% of AGI for various income ranges: 0.2% for AGIs $50k-75k, 0.5% for AGIs $75k-100k, 0.4% for AGIs $100k-200k, 7.5% for AGIs over 200k)
Profit/loss from business: +$19,828 (reported on 14.0% of returns)
Here:
+$19,828
State:
+$13,732
(% of AGI for various income ranges: 6.7% for AGIs below $25k, 1.9% for AGIs $25k-50k, 1.9% for AGIs $50k-75k, 1.4% for AGIs $75k-100k, 1.9% for AGIs $100k-200k, 12.0% for AGIs over 200k)
Taxable individual retirement arrangement distribution: $22,015 (reported on 16.9% of returns)
77651:
$22,015
Texas:
$19,511
(% of AGI for various income ranges: 7.3% for AGIs below $25k, 6.5% for AGIs $25k-50k, 6.6% for AGIs $50k-75k, 6.1% for AGIs $75k-100k, 4.9% for AGIs $100k-200k, 4.0% for AGIs over 200k)
Self-employment retirement plans: $26,633 (reported on 0.5% of returns)
77651:
$26,633
Texas:
$23,938
Total itemized deductions: $21,050 (17% of AGI, reported on 26.0% of returns)
Here:
$21,050
State:
$24,724
Here:
17.2% of AGI
State:
15.9% of AGI
(% of AGI for various income ranges: 7.0% for AGIs below $25k, 7.3% for AGIs $25k-50k, 8.2% for AGIs $50k-75k, 8.9% for AGIs $75k-100k, 8.2% for AGIs $100k-200k, 7.8% for AGIs over 200k)
Charity contributions: $5,632 (reported on 20.7% of returns)
Here:
$5,632
State:
$6,808
(% of AGI for various income ranges: 0.9% for AGIs below $25k, 1.1% for AGIs $25k-50k, 1.5% for AGIs $50k-75k, 1.7% for AGIs $75k-100k, 1.9% for AGIs $100k-200k, 2.0% for AGIs over 200k)
Taxes paid: $5,756 (reported on 25.5% of returns)
77651:
$5,756
State:
$6,921
(% of AGI for various income ranges: 1.4% for AGIs below $25k, 1.6% for AGIs $25k-50k, 1.9% for AGIs $50k-75k, 2.1% for AGIs $75k-100k, 2.6% for AGIs $100k-200k, 2.2% for AGIs over 200k)
Earned income credit: $2,062 (reported on 12.9% of returns)
Here:
$2,062
State:
$2,570
(% of AGI for various income ranges: 5.0% for AGIs below $25k, 1.0% for AGIs $25k-50k)
Percentage of individuals using paid preparers for their 2012 taxes: 51.7%
Here:
52%
State:
51%
(% for various income ranges: 45.0% for AGIs below $25k, 50.4% for AGIs $25k-50k, 53.9% for AGIs $50k-75k, 54.4% for AGIs $75k-100k, 57.3% for AGIs $100k-200k, 75.0% for AGIs over 200k)
Averages for the 2004 tax year for zip code 77651, filed in 2005:
Average Adjusted Gross Income (AGI) in 2004: $50,713 (Individual Income Tax Returns)
Here:
$50,713
State:
$47,881
Salary/wage: $44,398 (reported on 80.3% of returns)
Here:
$44,398
State:
$41,947
(% of AGI for various income ranges: 95.6% for AGIs below $10k, 70.2% for AGIs $10k-25k, 69.9% for AGIs $25k-50k, 75.5% for AGIs $50k-75k, 77.4% for AGIs $75k-100k, 63.8% for AGIs over 100k)
Taxable interest for individuals: $1,676 (reported on 55.6% of returns)
This zip code:
$1,676
Texas:
$2,255
(% of AGI for various income ranges: 5.6% for AGIs below $10k, 3.8% for AGIs $10k-25k, 2.6% for AGIs $25k-50k, 1.9% for AGIs $50k-75k, 1.4% for AGIs $75k-100k, 1.2% for AGIs over 100k)
Taxable dividends: $2,631 (reported on 26.3% of returns)
Here:
$2,631
State:
$4,261
(% of AGI for various income ranges: 3.5% for AGIs below $10k, 1.6% for AGIs $10k-25k, 1.4% for AGIs $25k-50k, 1.0% for AGIs $50k-75k, 1.0% for AGIs $75k-100k, 1.5% for AGIs over 100k)
Net capital gain/loss: +$2,220 (reported on 20.1% of returns)
Here:
+$2,220
State:
+$16,110
(% of AGI for various income ranges: -2.4% for AGIs below $10k, -0.6% for AGIs $10k-25k, 0.5% for AGIs $25k-50k, 0.1% for AGIs $50k-75k, 0.8% for AGIs $75k-100k, 1.8% for AGIs over 100k)
Profit/loss from business: +$16,385 (reported on 14.9% of returns)
Here:
+$16,385
State:
+$11,013
(% of AGI for various income ranges: 3.7% for AGIs below $10k, 3.5% for AGIs $10k-25k, 1.9% for AGIs $25k-50k, 1.6% for AGIs $50k-75k, 1.9% for AGIs $75k-100k, 9.1% for AGIs over 100k)
IRA payment deduction: $3,306 (reported on 2.0% of returns)
77651:
$3,306
Texas:
$3,120
(% of AGI for various income ranges: 0.3% for AGIs $10k-25k, 0.2% for AGIs $25k-50k, 0.1% for AGIs $50k-75k, 0.1% for AGIs $75k-100k, 0.1% for AGIs over 100k)
Self-employed pension: $28,644 (reported on 0.8% of returns)
Here:
$28,644
Texas:
$16,401
Total itemized deductions: $16,807 (16% of AGI, reported on 23.3% of returns)
Here:
$16,807
State:
$19,631
Here:
16.3% of AGI
State:
18.9% of AGI
(% of AGI for various income ranges: 4.4% for AGIs below $10k, 6.5% for AGIs $10k-25k, 8.0% for AGIs $25k-50k, 8.8% for AGIs $50k-75k, 8.5% for AGIs $75k-100k, 7.2% for AGIs over 100k)
Charity contributions deductions: $4,482 (4% of AGI, reported on 20.5% of returns)
Here:
$4,482
State:
$4,753
Here:
4.1% of AGI
State:
4.2% of AGI
(% of AGI for various income ranges: 0.3% for AGIs below $10k, 1.1% for AGIs $10k-25k, 1.5% for AGIs $25k-50k, 1.9% for AGIs $50k-75k, 2.1% for AGIs $75k-100k, 2.0% for AGIs over 100k)
Total tax: $8,605 (reported on 77.6% of returns)
77651:
$8,605
State:
$9,058
(% of AGI for various income ranges: 2.6% for AGIs below $10k, 3.9% for AGIs $10k-25k, 6.3% for AGIs $25k-50k, 8.7% for AGIs $50k-75k, 11.1% for AGIs $75k-100k, 21.1% for AGIs over 100k)
Earned income credit: $1,647 (reported on 12.4% of returns)
Here:
$1,647
State:
$2,024
Percentage of individuals using paid preparers for their 2004 taxes: 53.5%
Here:
54%
State:
57%
(% for various income ranges: 45.7% for AGIs below $10k, 53.6% for AGIs $10k-25k, 55.6% for AGIs $25k-50k, 57.5% for AGIs $50k-75k, 52.1% for AGIs $75k-100k, 59.2% for AGIs over 100k)
Likely homosexual households (counted as self-reported same-sex unmarried-partner households)
Lesbian couples: 0.0% of all households
Gay men: 0.1% of all households
Household received Food Stamps/SNAP in the past 12 months: 352 Household did not receive Food Stamps/SNAP in the past 12 months: 4,851
Women who had a birth in the past 12 months: 422 (371 now married, 55 unmarried) Women who did not have a birth in the past 12 months: 2,848 (1,475 now married, 1,365 unmarried)
Housing units in zip code 77651 with a mortgage: 1,895 (116 second mortgage, 108 both second mortgage and home equity loan) Houses without a mortgage: 37
Median monthly owner costs for units with a mortgage: $1,950 Median monthly owner costs for units without a mortgage: $677
Residents with income below the poverty level in 2022:
This zip code:
8.6%
Whole state:
14.0%
Residents with income below 50% of the poverty level in 2022:
This zip code:
3.7%
Whole state:
7.4%
Median number of rooms in houses and condos:
Here:
6.3
State:
6.3
Median number of rooms in apartments:
Here:
4.6
State:
4.0
Notable locations in this zip code not listed on our city pages
Churches in zip code 77651 include: Landmark United Pentecostal Church (A), Bethel African Methodist Episcopal Church (B), Holy Trinity Episcopal Church (C), Bethel Missionary Baptist Church (D), Magnolia Assembly of God Church (E), First Assembly of God Church - Port Neches (F), Golden Triangle Baptist Temple Church (G), Paradise Primitive Baptist Church (H), United Baptist Church (I). Display/hide their locations on the map
Parks in zip code 77651 include: Meadowgreen Park (1), Central Park (2), Port Neches Park (3), Oak Bluff Memorial Park (4), Port Neches - Grove High School Football and Track Stadium (5), Sunset Park (6). Display/hide their locations on the map
2,631 married couples with children.
594 single-parent households (330 men, 264 women).
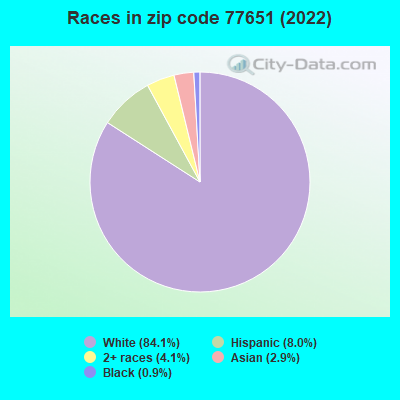
92.0% of residents of 77651 zip code speak English at home.
4.1% of residents speak Spanish at home (79% very well, 13% well, 8% not well).
1.6% of residents speak other Indo-European language at home (92% very well, 8% well).
2.4% of residents speak Asian or Pacific Island language at home (96% very well, 2% well, 2% not at all).
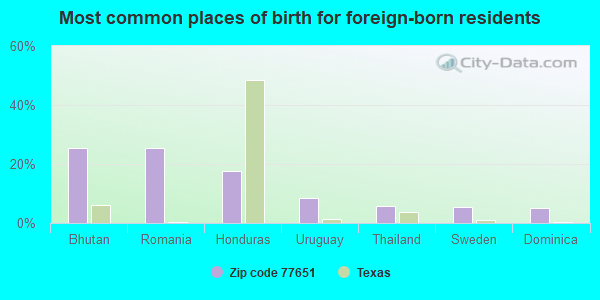
Foreign born population: 634 (4.5%) (38.6% of them are naturalized citizens)
This zip code:
4.5%
Whole state:
17.2%
25%Bhutan
25%Romania
18%Honduras
9%Uruguay
6%Thailand
5%Sweden
5%Dominica
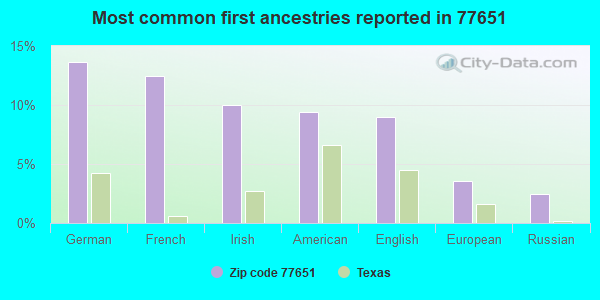
14%German
12%French
10%Irish
9%American
9%English
4%European
2%Russian
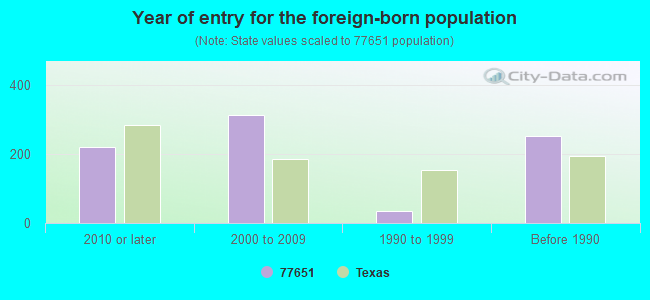
Year of entry for the foreign-born population
2192010 or later
3132000 to 2009
341990 to 1999
251Before 1990
Facilities with environmental interests located in this zip code:
AIR LIQUIDE NEDERLAND TEXAS AIR SEPARATION UNIT (2121 PARK STREET in PORT NECHES, TX)
AIR MAJOR (AIRS/AFS) AIR PROGRAM (Clean Air Markets Division Business System) (Integrated Compliance Information System) - ICIS-06-2003-4528, FORMAL ENFORCEMENT ACTION CRITERIA AND HAZARDOUS AIR POLLUTANT INVENTORY (Inventory of air pollution sources) (Resource Conservation and Recovery Act (tracking hazardous waste)) TRI REPORTER (Tracking of toxic chemicals releasing facilities) Business SIC classification: INDUSTRIAL GASES; COMBINATION UTILITIES Organizations: AIR LIQUIDE AMERICA LP (CONTACT/OPERATOR)
, AIR LIQUIDE AMERICA CORPORATION (OWNER/OPERATOR)
Alternative names: AIR LIQUIDE OF AMERICA, AIR LIQUIDE Port NECHES PLANT, AIR LIQUIDE PT NECHES PLANT, PORT NECHES
AMERIPOL SYNPOL CORP. (1215 MAIN ST. in PORT NECHES, TX)
(Integrated Compliance Information System) - ICIS-06-1998-0414, FORMAL ENFORCEMENT ACTION, ICIS-06-1992-0106, CRITERIA AND HAZARDOUS AIR POLLUTANT INVENTORY (Inventory of air pollution sources) National Pollutant Discharge Elimination System MAJOR (Tracking pollutant discharge elimination systems) - permit TRI REPORTER (Tracking of toxic chemicals releasing facilities) Business SIC classification: SYNTHETIC RUBBER (VULCANIZABLE ELASTOMERS) Business NAICS classification: SYNTHETIC RUBBER MANUFACTURING. Organizations: ISP SYNTHETIC ELASTOMERS LP (CONTACT/OWNER)
Alternative names: AMERIPOL SYNPOL CO-PORT NECHES
ACME BUILDING PRODUCTS (1600 MAIN ST in PORT NECHES, TX)
(Resource Conservation and Recovery Act (tracking hazardous waste)) Business NAICS classification: CONCRETE BLOCK AND BRICK MANUFACTURING. Organizations: FEATHERLITE BUILDING PRODUCTS CORPORATIO (CONTACT/OPERATOR)
Alternative names: FEATHERLITE BUILDING PRODUCTS
AMERIPOL SYNPOL CORPORATION (1615 MAIN ST in PORT NECHES, TX)
(Resource Conservation and Recovery Act (tracking hazardous waste)) Alternative names: B F GOODRICH COMMON SOLID WSTE DSPSL
728 NECHES RIVER TIE-IN VALVE SITE (S BANK OF NECHES RIVER; 800' W in PORT NECHES, TX)
HAZARDOUS WASTE BIENNIAL REPORTER (Resource Conservation and Recovery Act (tracking hazardous waste)) Large Quantity Generators, more that 1000 kg of hazardous waste/month (Resource Conservation and Recovery Act (tracking hazardous waste)) Business NAICS classification: SUPPORT ACTIVITIES FOR OIL AND GAS OPERATIONS.
ALAC PORT NECHES ASU (FM 366 & PARK ST. in PORT NECHES, TX)
TRI REPORTER (Tracking of toxic chemicals releasing facilities) Business SIC classification: INDUSTRIAL GASES
AMERIPOL SYNPOL (121 S MAIN ST in PORT NECHES, TX)
COMPLIANCE ACTIVITY (Tracking inspections of insecticide, fungicide, and rodenticide, and toxic substances) Business SIC classification: SYNTHETIC RUBBER (VULCANIZABLE ELASTOMERS)
Housing units lacking complete kitchen facilities: 3.8%
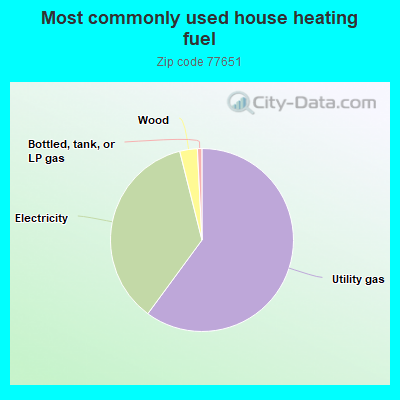
60.1%Utility gas
36.0%Electricity
3.1%Wood
0.8%Bottled, tank, or LP gas
Population in 1990: 13,009. Population change in the 1990s: +585 (+4.5%).
Place of birth for U.S.-born residents:
This state: 10,938
Northeast: 105
Midwest: 631
South: 975
West: 414
64% of the 77651 zip code residents lived in the same house 5 years ago. Out of people who lived in different houses, 73% lived in this county. Out of people who lived in different counties, 50% lived in Texas.
91% of the 77651 zip code residents lived in the same house 1 year ago. Out of people who lived in different houses, 59% moved from this county. Out of people who lived in different houses, 36% moved from different county within same state. Out of people who lived in different houses, 4% moved from different state.
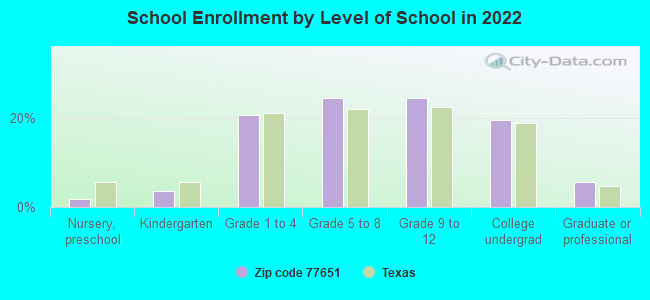
Private vs. public school enrollment:
Students in private schools in grades 1 to 8 (elementary and middle school): 83
Here:
5.7%
Texas:
8.8%
Students in private schools in grades 9 to 12 (high school): 78
Here:
9.9%
Texas:
8.0%
Students in private undergraduate colleges: 43
Here:
6.8%
Texas:
16.2%
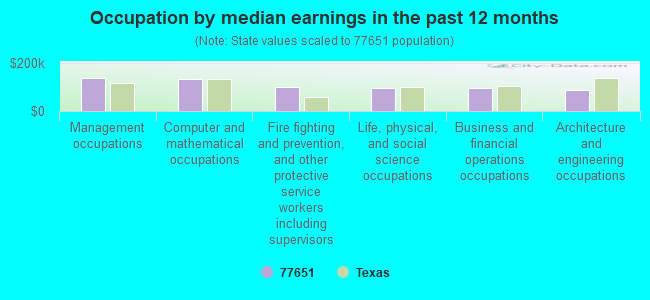
Occupation by median earnings in the past 12 months ($)
137,488Management occupations
134,938Computer and mathematical occupations
100,233Fire fighting and prevention, and other protective service workers including supervisors
97,446Life, physical, and social science occupations
96,834Business and financial operations occupations
88,000Architecture and engineering occupations
Companies with federal contracts located in this zip code (PORT NECHES, TX):
CROCHET & BOREL SERVICES INC (346 TWIN CITY HWY; small business)
$249,233 with Army for Hazardous Substance Removal, Cleanup, and Disposal Services and Operational Support. Signed on 2002-07-02. Completion date: 2002-08-16.
ENGLISH LAWN SERVICE INC (230 E 2ND ST) : $48,755 in 7 contractsfrom 2002 to 2004
Contracts for Landscaping/Groundskeeping Services by U.S. Army Corps of Engineers - civil program financing only, Army Signed by year:2000: $0; 2001: $0; 2002: $8,935; 2003: $17,966; 2004: $21,854; 2005: $0; 2006: $0.
Biggest contracts:
$10,927 with U.S. Army Corps of Engineers - civil program financing only for Landscaping/Groundskeeping Services. Signed on 2004-10-21. Completion date: 2003-07-29.
$10,927 with Army for Landscaping/Groundskeeping Services. Signed on 2004-10-21. Completion date: 2003-07-29.
$8,935 with U.S. Army Corps of Engineers - civil program financing only for Landscaping/Groundskeeping Services. Signed on 2003-09-27. Completion date: 2003-07-29.
$8,935, same as above.Signed on 2002-10-22. Completion date: 2003-09-18.
AMERICAN STEAM AWAY (P.O. BOX 1082; small business)
$6,100 with Bureau of Prisoners/Federal Prison System for . Signed on 2005-12-01. Completion date: 2005-12-31.
PATRIOT ALARM SYSTEMS (1228 PORT NECHES AVENUE; small business)
$3,584 with Army for Miscellaneous Alarm, Signal and Security Detection Systems. Signed on 2003-09-19. Completion date: 2003-10-03.
Top industries in this zip code by the number of employees in 2005:
2002 - 2018 National Fire Incident Reporting System (NFIRS) incidents
Based on the data from the years 2002 - 2018 the average number of fires per year is 63. The highest number of fires - 121 took place in 2005, and the least - 33 in 2012. The data has a decreasing trend.
When looking into fire subcategories, the most incidents belonged to: Structure Fires (40.7%), and Outside Fires (40.7%).
Fire incident types reported to NFIRS in Zip Code 77651


 Nearest zip codes: 77619, 77627, 77642, 77640, 77630, 77611.
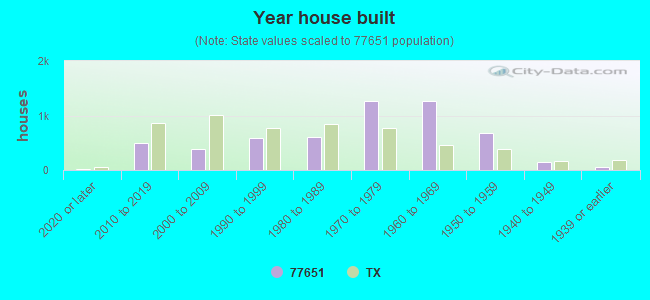


 Based on the data from the years 2002 - 2018 the average number of fires per year is 63. The highest number of fires - 121 took place in 2005, and the least - 33 in 2012. The data has a decreasing trend.
 When looking into fire subcategories, the most incidents belonged to: Structure Fires (40.7%), and Outside Fires (40.7%).