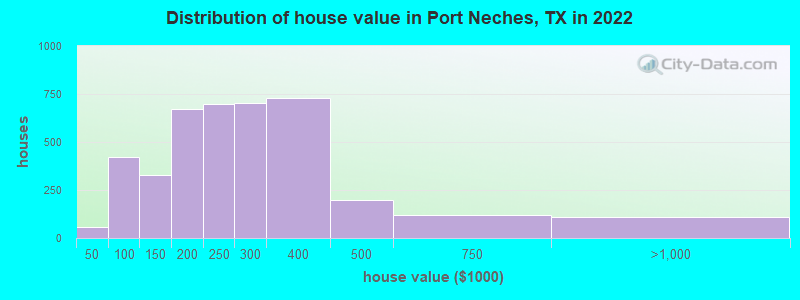
Estimated median house or condo value in 2022: $237,220 (it was $77,600 in 2000)
Port Neches:
$237,220
TX:
$275,400
Mean prices in 2022:all housing units: $206,783; detached houses: $208,820; townhouses or other attached units: $377,564; in 2-unit structures: $143,384; in 3-to-4-unit structures: $112,152; in 5-or-more-unit structures: $161,492; mobile homes: $70,930; occupied boats, rvs, vans, etc.: $26,759
Median gross rent in 2022: $1,039.
March 2022 cost of living index in Port Neches: 82.4 (low, U.S. average is 100)
Percentage of residents living in poverty in 2022: 8.6%
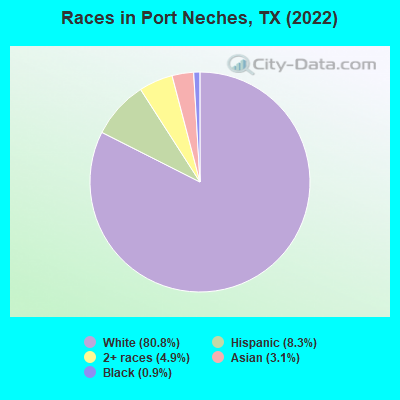
(9.0% for White Non-Hispanic residents, 5.6% for Hispanic or Latino residents, 11.4% for other race residents, 6.3% for two or more races residents)
According to our research of Texas and other state lists, there were 10 registered sex offenders living in Port Neches, Texas as of April 27, 2024. The ratio of all residents to sex offenders in Port Neches is 1,288 to 1. The ratio of registered sex offenders to all residents in this city is much lower than the state average.
Crime rates in Port Neches by year
Type
2009
2010
2011
2012
2013
2014
2015
2016
2017
2018
2019
2020
2021
2022
Murders (per 100,000)
0 (0.0)
1 (7.7)
0 (0.0)
0 (0.0)
0 (0.0)
0 (0.0)
0 (0.0)
0 (0.0)
1 (7.8)
0 (0.0)
0 (0.0)
1 (7.9)
0 (0.0)
1 (7.5)
Rapes (per 100,000)
0 (0.0)
3 (23.0)
2 (15.0)
2 (15.1)
1 (7.8)
13 (102.2)
1 (7.9)
6 (47.1)
9 (70.5)
13 (100.9)
7 (54.7)
4 (31.7)
8 (63.7)
5 (37.6)
Robberies (per 100,000)
3 (24.0)
3 (23.0)
1 (7.5)
2 (15.1)
2 (15.7)
1 (7.9)
2 (15.8)
4 (31.4)
2 (15.7)
2 (15.5)
1 (7.8)
2 (15.9)
1 (8.0)
0 (0.0)
Assaults (per 100,000)
13 (104.0)
27 (207.1)
46 (345.5)
29 (218.6)
34 (266.2)
42 (330.0)
42 (331.0)
42 (329.6)
39 (305.3)
42 (326.1)
29 (226.4)
22 (174.4)
17 (135.4)
32 (240.7)
Burglaries (per 100,000)
75 (600.0)
102 (782.2)
87 (653.4)
81 (610.6)
69 (540.2)
61 (479.3)
49 (386.1)
34 (266.9)
42 (328.8)
49 (380.4)
35 (273.3)
28 (221.9)
21 (167.3)
24 (180.5)
Thefts (per 100,000)
257 (2,056)
227 (1,741)
225 (1,690)
176 (1,327)
150 (1,174)
165 (1,297)
157 (1,237)
123 (965.4)
144 (1,127)
115 (892.8)
146 (1,140)
95 (753.0)
98 (780.6)
81 (609.3)
Auto thefts (per 100,000)
8 (64.0)
16 (122.7)
14 (105.2)
10 (75.4)
20 (156.6)
12 (94.3)
11 (86.7)
19 (149.1)
27 (211.4)
16 (124.2)
18 (140.5)
12 (95.1)
16 (127.4)
24 (180.5)
Arson (per 100,000)
0 (0.0)
1 (7.7)
0 (0.0)
3 (22.6)
1 (7.8)
0 (0.0)
1 (7.9)
2 (15.7)
0 (0.0)
0 (0.0)
0 (0.0)
0 (0.0)
1 (8.0)
0 (0.0)
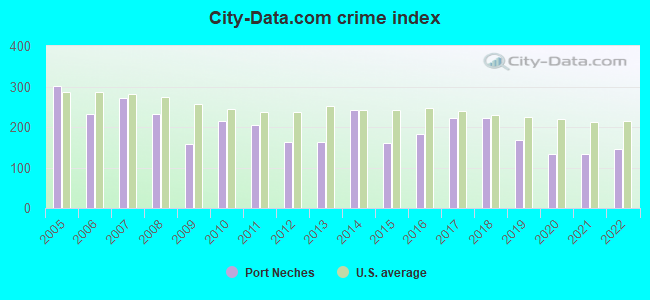
City-Data.com crime index
157.3
216.3
205.1
162.1
161.5
243.0
160.7
182.2
222.8
222.9
167.3
134.1
133.6
144.7
The City-Data.com crime index weighs serious crimes and violent crimes more heavily. Higher means more crime, U.S. average is 246.1. It adjusts for the number of visitors and daily workers commuting into cities.
Latest news from Port Neches, TX collected exclusively by city-data.com from local newspapers, TV, and radio stations
Ancestries: French (12.7%), German (12.6%), American (10.0%), Irish (9.4%), English (6.9%), European (4.3%).
Current Local Time: CST time zone
Land area: 9.13 square miles.
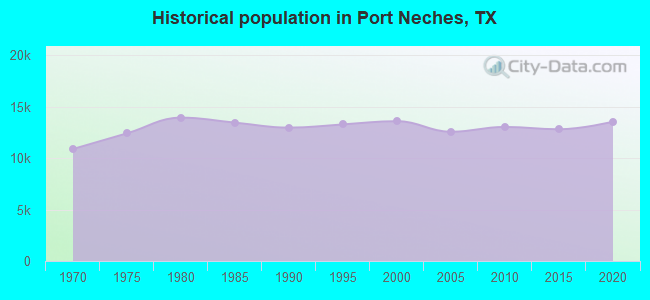
Population density: 1,492 people per square mile (low).
637 residents are foreign born (1.5% Asia, 1.5% Latin America, 1.5% Europe).
This city:
4.7%
Texas:
17.1%
Median real estate property taxes paid for housing units with mortgages in 2022: $4,535 (1.6%) Median real estate property taxes paid for housing units with no mortgage in 2022: $3,161 (1.5%)
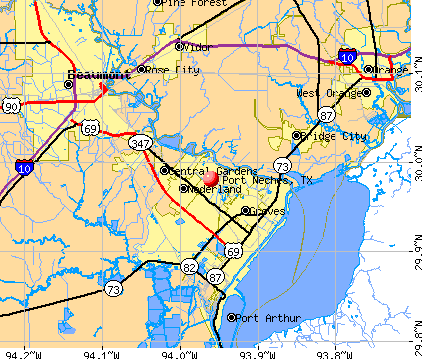
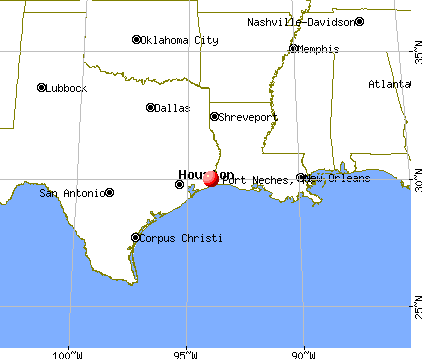
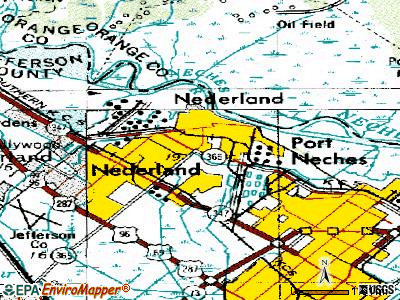
Nearest city with pop. 50,000+: East Jefferson, TX (3.1 miles , pop. 116,060).
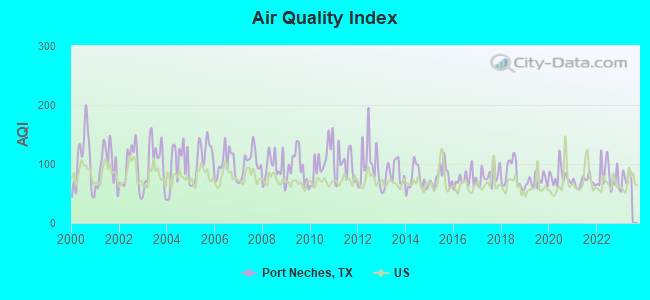
Air Quality Index (AQI) level in 2022 was 80.6. This is about average.
City:
80.6
U.S.:
72.6
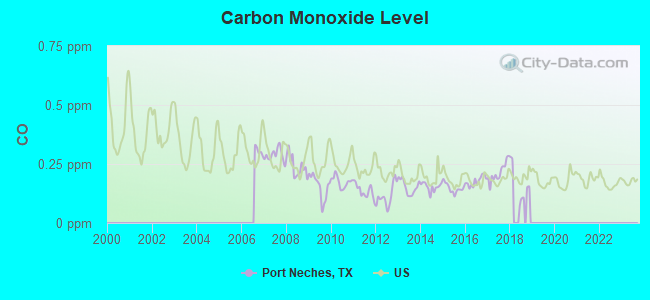
Carbon Monoxide (CO) [ppm] level in 2018 was 0.164. This is significantly better than average.Closest monitor was 2.7 miles away from the city center.
City:
0.164
U.S.:
0.251
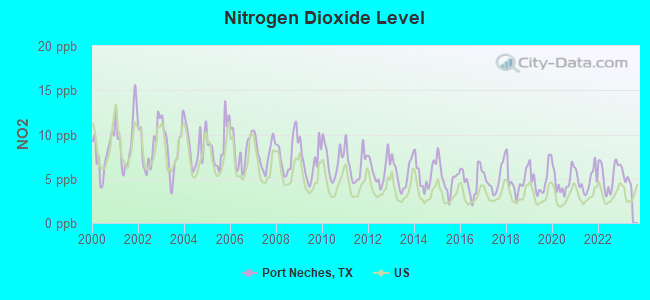
Nitrogen Dioxide (NO2) [ppb] level in 2022 was 5.42. This is about average.Closest monitor was 1.1 miles away from the city center.
City:
5.42
U.S.:
5.11
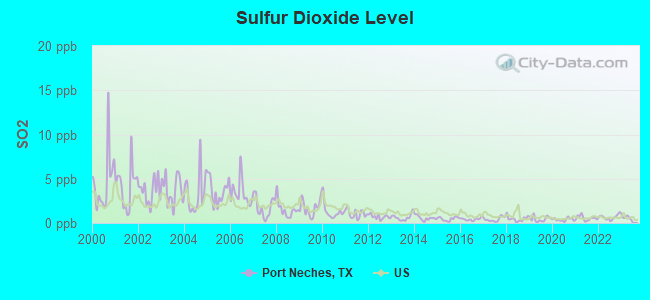
Sulfur Dioxide (SO2) [ppb] level in 2022 was 0.665. This is significantly better than average.Closest monitor was 1.1 miles away from the city center.
City:
0.665
U.S.:
1.515
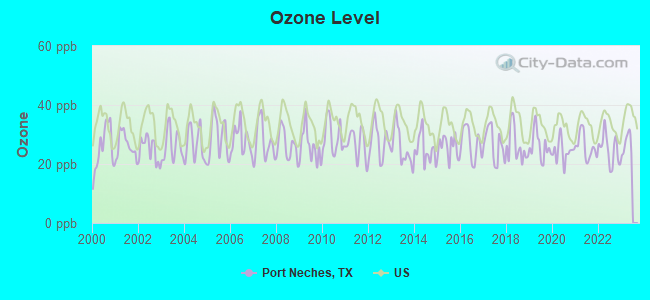
Ozone [ppb] level in 2022 was 25.0. This is better than average.Closest monitor was 3.6 miles away from the city center.
City:
25.0
U.S.:
33.3
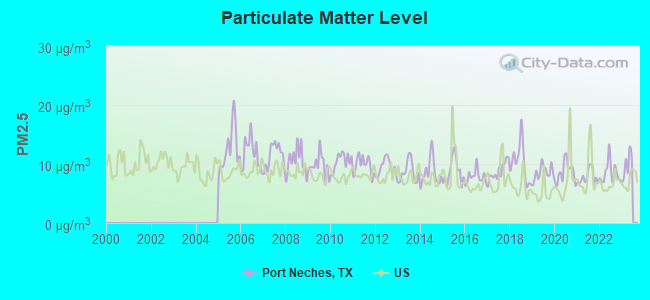
Particulate Matter (PM2.5) [µg/m3] level in 2022 was 8.50. This is about average.Closest monitor was 5.1 miles away from the city center.
City:
8.50
U.S.:
8.11
Tornado activity:
Port Neches-area historical tornado activity is slightly above Texas state average. It is 53% greater than the overall U.S. average.
On 11/7/1957, a category F4 (max. wind speeds 207-260 mph) tornado 4.9 miles away from the Port Neches city center killed one personand injured 81 peopleand causedbetween $500,000 and $5,000,000 in damages.
On 11/7/1957, a category F3 (max. wind speeds 158-206 mph) tornado 2.8 miles away from the city center killed 2 peopleand injured 59 peopleand causedbetween $500,000 and $5,000,000 in damages.
Earthquake activity:
Port Neches-area historical earthquake activity is significantly above Texas state average. It is 40% smaller than the overall U.S. average.
On 5/17/2012 at 08:12:00, a magnitude 4.8 (4.8 MW, Depth: 3.1 mi, Class: Light, Intensity: IV - V) earthquake occurred 136.7 miles away from the city center On 9/2/2013 at 23:51:15, a magnitude 4.3 (4.3 MW, Depth: 2.9 mi) earthquake occurred 136.3 miles away from the city center On 9/2/2013 at 21:52:38, a magnitude 4.2 (4.2 MW, Depth: 3.0 mi) earthquake occurred 141.3 miles away from Port Neches center On 10/20/2011 at 12:24:41, a magnitude 4.8 (4.8 MW, Depth: 3.1 mi) earthquake occurred 259.8 miles away from Port Neches center On 1/25/2013 at 07:01:19, a magnitude 4.1 (4.1 MB, Depth: 3.1 mi) earthquake occurred 130.4 miles away from the city center On 5/10/2012 at 15:15:38, a magnitude 3.9 (3.9 MW, Depth: 4.3 mi, Class: Light, Intensity: II - III) earthquake occurred 140.4 miles away from the city center Magnitude types: body-wave magnitude (MB), moment magnitude (MW)
Natural disasters:
The number of natural disasters in Jefferson County (23) is greater than the US average (15). Major Disasters (Presidential) Declared: 14 Emergencies Declared: 6
Causes of natural disasters: Hurricanes: 8, Storms: 8, Floods: 7, Tornadoes: 4, Tropical Storms: 4, Fire: 1, Flash Flood: 1, Other: 2 (Note: some incidents may be assigned to more than one category).
Hospitals and medical centers near Port Neches:
ALLEGIANCE HOME HEALTH OF SOUTHEAST TEXAS (Home Health Center, about 2 miles away; NEDERLAND, TX)
SENIOR REHABILITATION AND SKILLED NURSING CENTER (Nursing Home, about 3 miles away; PORT ARTHUR, TX)
RENAL CENTER OF NEDERLAND, LLC (Dialysis Facility, about 3 miles away; PORT ARTHUR, TX)
A MED HOME HEALTH (Home Health Center, about 3 miles away; NEDERLAND, TX)
HOME CARE ELITE LLC (Home Health Center, about 3 miles away; NEDERLAND, TX)
ULTIMATE HOSPICE CARE (Hospital, about 3 miles away; NEDERLAND, TX)
OMNIBUS HOME HEALTH CARE (Home Health Center, about 3 miles away; NEDERLAND, TX)
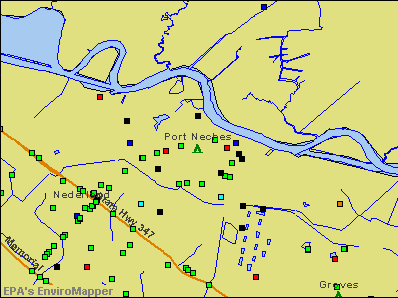
Churches in Port Neches include: Landmark United Pentecostal Church (A), Bethel African Methodist Episcopal Church (B), Holy Trinity Episcopal Church (C), Bethel Missionary Baptist Church (D), Magnolia Assembly of God Church (E), First Assembly of God Church - Port Neches (F), Golden Triangle Baptist Temple Church (G), Paradise Primitive Baptist Church (H), Church of Christ (I). Display/hide their locations on the map
Parks in Port Neches include: Meadowgreen Park (1), Central Park (2), Port Neches Park (3), Oak Bluff Memorial Park (4), Port Neches - Grove High School Football and Track Stadium (5), Sunset Park (6). Display/hide their locations on the map
Court: Port Neches City - Humane Officer- Police Dept- Municipal Court (1201 Merriman Street).
Birthplace of: Bin Ramke - Poet, Lew Ford - 2005 Major League Baseball player (Minnesota Twins, born: Aug 12, 1976).
Jefferson County has a predicted average indoor radon screening level less than 2 pCi/L (pico curies per liter) - Low Potential
Average household size:
This city:
2.5 people
Texas:
2.8 people
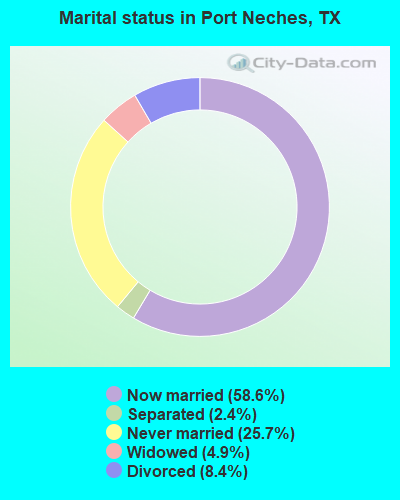
Percentage of family households:
This city:
71.8%
Whole state:
69.9%
Percentage of households with unmarried partners:
This city:
4.4%
Whole state:
6.0%
Likely homosexual households (counted as self-reported same-sex unmarried-partner households)
Lesbian couples: 0.2% of all households
Gay men: 0.2% of all households
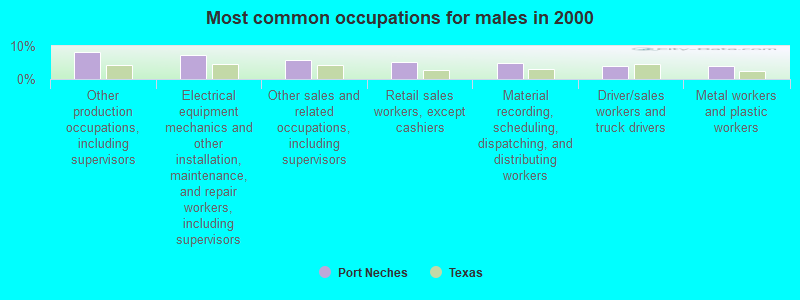
7 people in crews of maritime vessels in 2000
Banks with branches in Port Neches (2011 data):
Wells Fargo Bank, National Association: Port Neches Branch at 2905 Nall St, branch established on 1926/01/01. Info updated 2011/04/05: Bank assets: $1,161,490.0 mil, Deposits: $905,653.0 mil, headquarters in Sioux Falls, SD, positive income, 6395 total offices, Holding Company: Wells Fargo & Company
Compass Bank: Port Neches Branch at 2927 Nall Street, branch established on 1920/08/02. Info updated 2011/02/24: Bank assets: $63,107.0 mil, Deposits: $46,232.4 mil, headquarters in Birmingham, AL, negative income in the last year, Commercial Lending Specialization, 720 total offices, Holding Company: Banco Bilbao Vizcaya Argentaria, S.A.
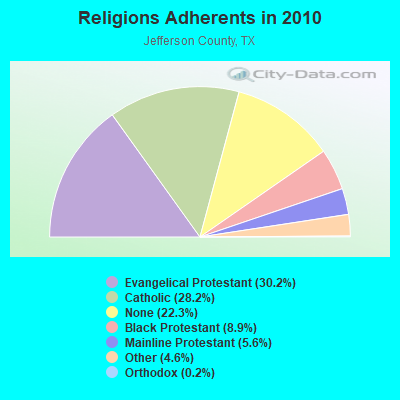
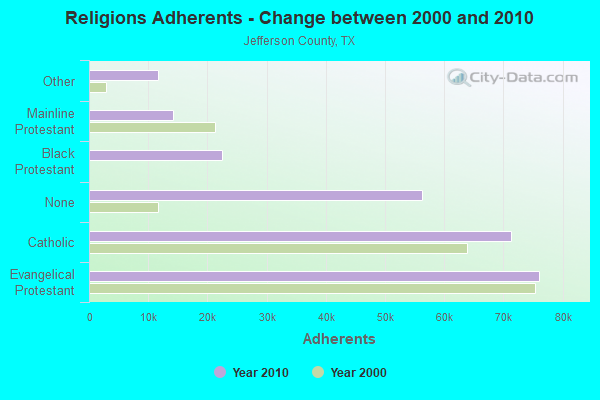
Religion statistics for Port Neches, TX (based on Jefferson County data)
Religion
Adherents
Congregations
Evangelical Protestant
76,088
240
Catholic
71,211
25
Black Protestant
22,468
59
Mainline Protestant
14,187
39
Other
11,594
23
Orthodox
415
2
None
56,310
-
Source: Clifford Grammich, Kirk Hadaway, Richard Houseal, Dale E.Jones, Alexei Krindatch, Richie Stanley and Richard H.Taylor. 2012. 2010 U.S.Religion Census: Religious Congregations & Membership Study. Association of Statisticians of American Religious Bodies. Jones, Dale E., et al. 2002. Congregations and Membership in the United States 2000. Nashville, TN: Glenmary Research Center. Graphs represent county-level data
Aircraft: NAVION NAVION A (Category: Land, Seats: 4, Weight: Up to 12,499 Pounds, Speed: 120 mph), Engine: CONT MOTOR E225 SERIES (225 HP) (Reciprocating) N-Number: 134WB, N134WB, N-134WB, Serial Number: NAV-4-2034, Certificate Issue Date: 05/24/2017 Registrant (Individual): Frederick Meaux, 2631 River Oaks Dr, Port Neches, TX 77651
Aircraft: BORTH JOHN D RV-4 (Category: Land, Seats: 2, Weight: Up to 12,499 Pounds), Engine: LYCOMING O&VO-360 SER (180 HP) (Reciprocating) N-Number: 27918, N27918, N-27918, Serial Number: 2974, Year manufactured: 2001, Airworthiness Date: 07/18/2001, Certificate Issue Date: 04/02/2020 Registrant (Individual): Nick H Jr Ruysenaars, 3135 Nall St, Port Neches, TX 77651
Aircraft: CESSNA 525 (Category: Land, Engines: 2, Seats: 8, Weight: Up to 12,499 Pounds), Engine: WILLIAMS FJ44-1AP (1965 Pounds of Thrust) (Turbo-fan) N-Number: 575TM, N575TM, N-575TM, Serial Number: 525-0838, Year manufactured: 2014, Airworthiness Date: 08/25/2014, Certificate Issue Date: 05/13/2016 Registrant (Co-Owned): Enterprises Ltd Hauck, 342 Twin City Hwy, Port Neches, TX 77651, Other Owners: LLC Jgj&j
Aircraft: BELL CONTINENTAL COPTERS 47G (Category: Land, Seats: 3, Weight: Up to 12,499 Pounds, Speed: 78 mph), Engine: FRANKLIN 6A&6V335 SER (210 HP) (Reciprocating) N-Number: 6214, N6214, N-6214, Serial Number: 1023, Year manufactured: 1952, Airworthiness Date: 07/25/1972, Certificate Issue Date: 09/16/1993 Registrant (Individual): David K Domingue, 1007 E Port Neches Ave, Port Neches, TX 77651
Aircraft: PIPER PA-24-260 (Category: Land, Seats: 4, Weight: Up to 12,499 Pounds, Speed: 135 mph), Engine: LYCOMING TI0-540 SER (310 HP) (Reciprocating) N-Number: 8741P, N8741P, N-8741P, Serial Number: 24-4192, Year manufactured: 1965, Airworthiness Date: 03/08/1965, Certificate Issue Date: 08/02/2013 Registrant (LLC): P2 Enterprises LLC, 1618 Port Neches Ave, Port Neches, TX 77651
Aircraft: CESSNA 210G (Category: Land, Seats: 4, Weight: Up to 12,499 Pounds, Speed: 141 mph), Engine: CONT MOTOR IO 520 SERIES (285 HP) (Reciprocating) N-Number: 5891F, N5891F, N-5891F, Serial Number: 21058891, Year manufactured: 1967, Airworthiness Date: 03/17/1967 Registrant (Individual): Reported Sale, 823 Oak Bnd, Port Neches, TX 77651 Deregistered:Cancel Date: 03/02/2019
Aircraft: CESSNA 310E (Category: Land, Engines: 2, Seats: 5, Weight: Up to 12,499 Pounds, Speed: 167 mph), Engine: CONT MOTOR I0-470 SERIES (260 HP) (Reciprocating) N-Number: 4522Q, N4522Q, N-4522Q, Serial Number: 310M-0001, Year manufactured: 1960, Airworthiness Date: 12/12/1960, Certificate Issue Date: 09/18/1985 Registrant (Corporation): Mcneel Investment Corp, 312 Ave D, Port Neches, TX 77651 Deregistered:Cancel Date: 02/14/2018
Home Mortgage Disclosure Act Aggregated Statistics For Year 2009 (Based on 1 full and 2 partial tracts)
A) FHA, FSA/RHS & VA Home Purchase Loans
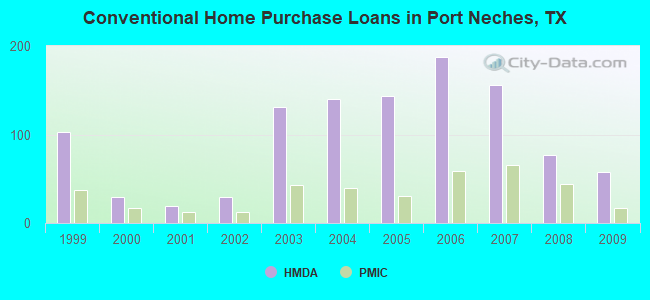
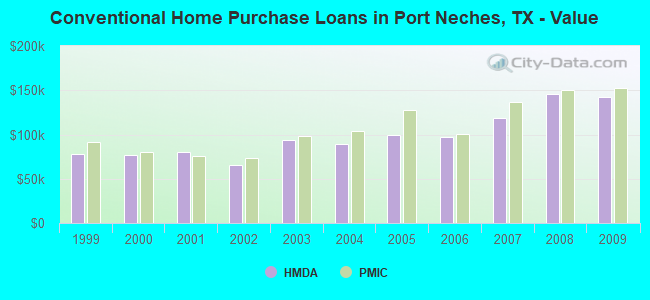
B) Conventional Home Purchase Loans
C) Refinancings
D) Home Improvement Loans
F) Non-occupant Loans on < 5 Family Dwellings (A B C & D)
Number
Average Value
Number
Average Value
Number
Average Value
Number
Average Value
Number
Average Value
LOANS ORIGINATED
54
$130,301
58
$141,886
112
$116,160
36
$48,974
10
$76,251
APPLICATIONS APPROVED, NOT ACCEPTED
2
$177,030
3
$186,410
10
$128,238
3
$40,773
0
$0
APPLICATIONS DENIED
10
$116,112
14
$169,654
29
$101,963
11
$30,141
1
$39,090
APPLICATIONS WITHDRAWN
5
$110,210
8
$140,218
24
$109,521
1
$161,350
1
$103,040
FILES CLOSED FOR INCOMPLETENESS
0
$0
1
$158,300
7
$90,081
0
$0
0
$0
Aggregated Statistics For Year 2008 (Based on 1 full and 2 partial tracts)
A) FHA, FSA/RHS & VA Home Purchase Loans
B) Conventional Home Purchase Loans
C) Refinancings
D) Home Improvement Loans
E) Loans on Dwellings For 5+ Families
F) Non-occupant Loans on < 5 Family Dwellings (A B C & D)
G) Loans On Manufactured Home Dwelling (A B C & D)
Number
Average Value
Number
Average Value
Number
Average Value
Number
Average Value
Number
Average Value
Number
Average Value
Number
Average Value
LOANS ORIGINATED
25
$106,423
77
$146,023
89
$106,294
34
$51,370
2
$1,526,345
15
$80,968
1
$12,080
APPLICATIONS APPROVED, NOT ACCEPTED
4
$138,385
8
$104,761
14
$131,761
7
$52,491
0
$0
1
$133,820
5
$39,460
APPLICATIONS DENIED
3
$129,490
13
$131,008
38
$125,735
24
$32,078
0
$0
5
$82,212
3
$46,667
APPLICATIONS WITHDRAWN
2
$175,195
7
$186,794
12
$133,478
5
$46,962
0
$0
1
$327,050
0
$0
FILES CLOSED FOR INCOMPLETENESS
0
$0
2
$163,295
4
$282,625
1
$74,630
0
$0
0
$0
0
$0
Aggregated Statistics For Year 2007 (Based on 1 full and 2 partial tracts)
A) FHA, FSA/RHS & VA Home Purchase Loans
B) Conventional Home Purchase Loans
C) Refinancings
D) Home Improvement Loans
E) Loans on Dwellings For 5+ Families
F) Non-occupant Loans on < 5 Family Dwellings (A B C & D)
G) Loans On Manufactured Home Dwelling (A B C & D)
Number
Average Value
Number
Average Value
Number
Average Value
Number
Average Value
Number
Average Value
Number
Average Value
Number
Average Value
LOANS ORIGINATED
11
$98,771
156
$118,256
92
$107,770
48
$48,925
1
$500,000
31
$100,323
4
$42,535
APPLICATIONS APPROVED, NOT ACCEPTED
1
$164,190
15
$82,592
11
$110,192
10
$31,492
0
$0
2
$55,480
0
$0
APPLICATIONS DENIED
3
$107,330
26
$99,648
44
$127,132
30
$41,449
0
$0
4
$78,655
2
$57,815
APPLICATIONS WITHDRAWN
3
$101,543
13
$91,900
19
$113,347
4
$62,085
0
$0
1
$63,970
0
$0
FILES CLOSED FOR INCOMPLETENESS
0
$0
5
$131,336
3
$134,943
3
$113,620
0
$0
0
$0
0
$0
Aggregated Statistics For Year 2006 (Based on 1 full and 2 partial tracts)
A) FHA, FSA/RHS & VA Home Purchase Loans
B) Conventional Home Purchase Loans
C) Refinancings
D) Home Improvement Loans
E) Loans on Dwellings For 5+ Families
F) Non-occupant Loans on < 5 Family Dwellings (A B C & D)
G) Loans On Manufactured Home Dwelling (A B C & D)
Number
Average Value
Number
Average Value
Number
Average Value
Number
Average Value
Number
Average Value
Number
Average Value
Number
Average Value
LOANS ORIGINATED
16
$96,837
188
$97,659
47
$96,551
37
$50,215
2
$888,120
24
$58,716
1
$71,080
APPLICATIONS APPROVED, NOT ACCEPTED
3
$80,777
18
$101,267
13
$132,965
4
$102,232
0
$0
2
$111,950
4
$30,302
APPLICATIONS DENIED
1
$94,000
27
$68,139
50
$78,496
14
$29,739
0
$0
6
$53,783
2
$24,915
APPLICATIONS WITHDRAWN
1
$92,580
13
$112,765
33
$88,758
1
$119,470
0
$0
2
$64,945
0
$0
FILES CLOSED FOR INCOMPLETENESS
0
$0
8
$80,110
7
$129,393
1
$44,800
0
$0
1
$78,900
0
$0
Aggregated Statistics For Year 2005 (Based on 1 full and 2 partial tracts)
A) FHA, FSA/RHS & VA Home Purchase Loans
B) Conventional Home Purchase Loans
C) Refinancings
D) Home Improvement Loans
F) Non-occupant Loans on < 5 Family Dwellings (A B C & D)
G) Loans On Manufactured Home Dwelling (A B C & D)
Number
Average Value
Number
Average Value
Number
Average Value
Number
Average Value
Number
Average Value
Number
Average Value
LOANS ORIGINATED
20
$91,104
143
$99,854
102
$83,393
36
$48,227
14
$59,749
1
$26,300
APPLICATIONS APPROVED, NOT ACCEPTED
1
$66,460
22
$62,849
15
$71,870
9
$37,741
6
$66,627
8
$45,410
APPLICATIONS DENIED
2
$34,945
33
$74,300
81
$70,946
30
$42,490
5
$68,298
12
$53,128
APPLICATIONS WITHDRAWN
4
$85,805
15
$72,745
44
$94,545
17
$144,700
2
$128,090
1
$68,950
FILES CLOSED FOR INCOMPLETENESS
0
$0
4
$70,435
16
$91,095
1
$78,210
1
$49,760
0
$0
Aggregated Statistics For Year 2004 (Based on 1 full and 2 partial tracts)
A) FHA, FSA/RHS & VA Home Purchase Loans
B) Conventional Home Purchase Loans
C) Refinancings
D) Home Improvement Loans
E) Loans on Dwellings For 5+ Families
F) Non-occupant Loans on < 5 Family Dwellings (A B C & D)
G) Loans On Manufactured Home Dwelling (A B C & D)
Number
Average Value
Number
Average Value
Number
Average Value
Number
Average Value
Number
Average Value
Number
Average Value
Number
Average Value
LOANS ORIGINATED
22
$86,561
140
$89,332
144
$86,768
35
$44,305
1
$124,390
18
$45,886
4
$43,938
APPLICATIONS APPROVED, NOT ACCEPTED
3
$53,830
20
$85,546
26
$83,706
5
$61,056
0
$0
4
$61,855
0
$0
APPLICATIONS DENIED
0
$0
16
$80,334
83
$72,568
26
$45,012
0
$0
1
$61,840
6
$22,820
APPLICATIONS WITHDRAWN
4
$74,878
6
$95,305
53
$86,336
3
$44,380
0
$0
1
$64,680
0
$0
FILES CLOSED FOR INCOMPLETENESS
0
$0
5
$74,918
18
$89,395
0
$0
0
$0
1
$78,920
0
$0
Aggregated Statistics For Year 2003 (Based on 1 full and 2 partial tracts)
A) FHA, FSA/RHS & VA Home Purchase Loans
B) Conventional Home Purchase Loans
C) Refinancings
D) Home Improvement Loans
E) Loans on Dwellings For 5+ Families
F) Non-occupant Loans on < 5 Family Dwellings (A B C & D)
Number
Average Value
Number
Average Value
Number
Average Value
Number
Average Value
Number
Average Value
Number
Average Value
LOANS ORIGINATED
25
$94,864
131
$93,876
271
$85,547
25
$45,938
1
$35,540
32
$52,721
APPLICATIONS APPROVED, NOT ACCEPTED
0
$0
7
$72,813
30
$82,305
4
$53,552
0
$0
2
$129,850
APPLICATIONS DENIED
3
$72,057
24
$72,968
108
$74,799
30
$24,364
0
$0
9
$36,917
APPLICATIONS WITHDRAWN
2
$97,120
16
$63,041
47
$78,448
0
$0
0
$0
3
$60,717
FILES CLOSED FOR INCOMPLETENESS
1
$56,150
4
$81,535
5
$101,112
1
$50,000
0
$0
1
$7,470
Aggregated Statistics For Year 2002 (Based on 1 partial tract)
A) FHA, FSA/RHS & VA Home Purchase Loans
B) Conventional Home Purchase Loans
C) Refinancings
D) Home Improvement Loans
F) Non-occupant Loans on < 5 Family Dwellings (A B C & D)
Number
Average Value
Number
Average Value
Number
Average Value
Number
Average Value
Number
Average Value
LOANS ORIGINATED
8
$61,395
29
$65,198
29
$72,330
6
$31,038
7
$33,814
APPLICATIONS APPROVED, NOT ACCEPTED
0
$0
3
$45,967
6
$70,725
1
$10,660
0
$0
APPLICATIONS DENIED
1
$52,600
9
$60,181
15
$42,980
10
$17,130
1
$14,930
APPLICATIONS WITHDRAWN
0
$0
3
$80,793
15
$53,357
0
$0
1
$55,440
FILES CLOSED FOR INCOMPLETENESS
0
$0
0
$0
5
$73,070
0
$0
0
$0
Aggregated Statistics For Year 2001 (Based on 1 partial tract)
A) FHA, FSA/RHS & VA Home Purchase Loans
B) Conventional Home Purchase Loans
C) Refinancings
D) Home Improvement Loans
E) Loans on Dwellings For 5+ Families
F) Non-occupant Loans on < 5 Family Dwellings (A B C & D)
Number
Average Value
Number
Average Value
Number
Average Value
Number
Average Value
Number
Average Value
Number
Average Value
LOANS ORIGINATED
11
$56,088
19
$79,834
26
$67,827
3
$17,297
1
$39,800
2
$44,780
APPLICATIONS APPROVED, NOT ACCEPTED
1
$54,020
3
$51,890
6
$105,080
1
$41,940
0
$0
0
$0
APPLICATIONS DENIED
1
$45,490
5
$57,290
16
$43,759
8
$11,818
0
$0
1
$85,300
APPLICATIONS WITHDRAWN
0
$0
3
$64,920
18
$38,778
1
$20,610
0
$0
1
$29,850
FILES CLOSED FOR INCOMPLETENESS
1
$48,330
3
$59,707
2
$32,695
0
$0
0
$0
1
$31,990
Aggregated Statistics For Year 2000 (Based on 1 partial tract)
A) FHA, FSA/RHS & VA Home Purchase Loans
B) Conventional Home Purchase Loans
C) Refinancings
D) Home Improvement Loans
F) Non-occupant Loans on < 5 Family Dwellings (A B C & D)
Number
Average Value
Number
Average Value
Number
Average Value
Number
Average Value
Number
Average Value
LOANS ORIGINATED
8
$62,639
29
$77,036
11
$47,171
6
$15,993
6
$40,753
APPLICATIONS APPROVED, NOT ACCEPTED
1
$49,760
6
$73,332
4
$17,948
1
$11,370
0
$0
APPLICATIONS DENIED
1
$70,370
10
$43,856
8
$43,625
5
$8,246
1
$34,830
APPLICATIONS WITHDRAWN
1
$84,590
1
$169,170
6
$36,370
1
$20,610
1
$36,960
FILES CLOSED FOR INCOMPLETENESS
0
$0
1
$54,020
2
$55,440
0
$0
1
$36,960
Aggregated Statistics For Year 1999 (Based on 2 partial tracts)
A) FHA, FSA/RHS & VA Home Purchase Loans
B) Conventional Home Purchase Loans
C) Refinancings
D) Home Improvement Loans
E) Loans on Dwellings For 5+ Families
F) Non-occupant Loans on < 5 Family Dwellings (A B C & D)
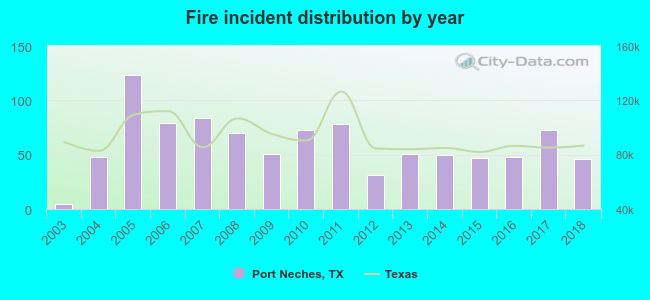
2003 - 2018 National Fire Incident Reporting System (NFIRS) incidents
Based on the data from the years 2003 - 2018 the average number of fires per year is 60. The highest number of reported fire incidents - 123 took place in 2005, and the least - 5 in 2003. The data has an increasing trend.
When looking into fire subcategories, the most reports belonged to: Structure Fires (43.4%), and Outside Fires (40.5%).
Fire incident types reported to NFIRS in Port Neches, TX


 Recent articles from our blog. Our writers, many of them Ph.D. graduates or candidates, create easy-to-read articles on a wide variety of topics.

 (3.1 miles
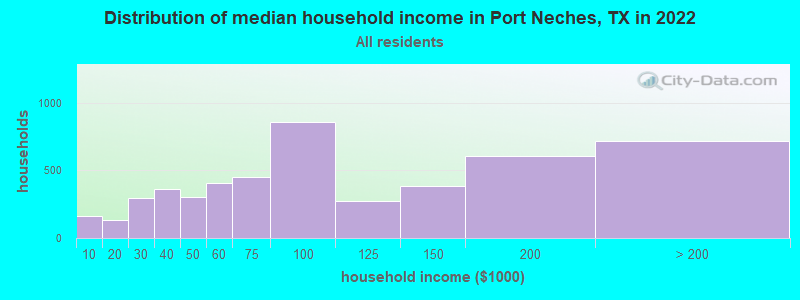


 Based on the data from the years 2003 - 2018 the average number of fires per year is 60. The highest number of reported fire incidents - 123 took place in 2005, and the least - 5 in 2003. The data has an increasing trend.
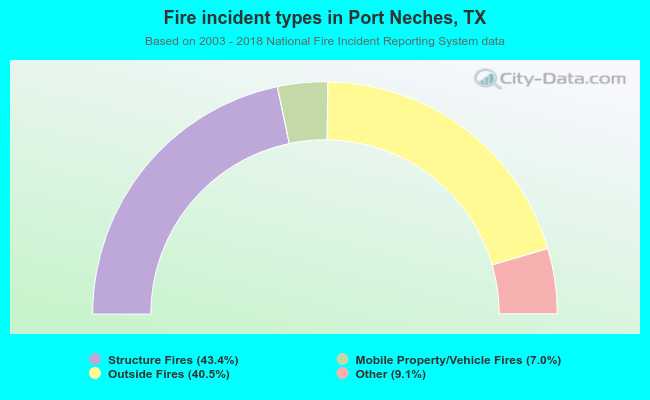 When looking into fire subcategories, the most reports belonged to: Structure Fires (43.4%), and Outside Fires (40.5%).