Groves, Texas Submit your own pictures of this city and show them to the world
OSM Map
General Map
Google Map
MSN Map
OSM Map
General Map
Google Map
MSN Map
OSM Map
General Map
Google Map
MSN Map
OSM Map
General Map
Google Map
MSN Map
Please wait while loading the map...
Population in 2022: 16,798 (100% urban, 0% rural). Population change since 2000: +6.8%Males: 8,532 Females: 8,266
March 2022 cost of living index in Groves: 82.7 (low, U.S. average is 100) Percentage of residents living in poverty in 2022: 10.7%for White Non-Hispanic residents , 7.0% for Black residents , 21.2% for Hispanic or Latino residents , 17.5% for other race residents , 10.9% for two or more races residents )Business Search - 14 Million verified businesses
Data:
Median household income ($)
Median household income (% change since 2000)
Household income diversity
Ratio of average income to average house value (%)
Ratio of average income to average rent
Median household income ($) - White
Median household income ($) - Black or African American
Median household income ($) - Asian
Median household income ($) - Hispanic or Latino
Median household income ($) - American Indian and Alaska Native
Median household income ($) - Multirace
Median household income ($) - Other Race
Median household income for houses/condos with a mortgage ($)
Median household income for apartments without a mortgage ($)
Races - White alone (%)
Races - White alone (% change since 2000)
Races - Black alone (%)
Races - Black alone (% change since 2000)
Races - American Indian alone (%)
Races - American Indian alone (% change since 2000)
Races - Asian alone (%)
Races - Asian alone (% change since 2000)
Races - Hispanic (%)
Races - Hispanic (% change since 2000)
Races - Native Hawaiian and Other Pacific Islander alone (%)
Races - Native Hawaiian and Other Pacific Islander alone (% change since 2000)
Races - Two or more races (%)
Races - Two or more races (% change since 2000)
Races - Other race alone (%)
Races - Other race alone (% change since 2000)
Racial diversity
Unemployment (%)
Unemployment (% change since 2000)
Unemployment (%) - White
Unemployment (%) - Black or African American
Unemployment (%) - Asian
Unemployment (%) - Hispanic or Latino
Unemployment (%) - American Indian and Alaska Native
Unemployment (%) - Multirace
Unemployment (%) - Other Race
Population density (people per square mile)
Population - Males (%)
Population - Females (%)
Population - Males (%) - White
Population - Males (%) - Black or African American
Population - Males (%) - Asian
Population - Males (%) - Hispanic or Latino
Population - Males (%) - American Indian and Alaska Native
Population - Males (%) - Multirace
Population - Males (%) - Other Race
Population - Females (%) - White
Population - Females (%) - Black or African American
Population - Females (%) - Asian
Population - Females (%) - Hispanic or Latino
Population - Females (%) - American Indian and Alaska Native
Population - Females (%) - Multirace
Population - Females (%) - Other Race
Coronavirus confirmed cases (Apr 27, 2024)
Deaths caused by coronavirus (Apr 27, 2024)
Coronavirus confirmed cases (per 100k population) (Apr 27, 2024)
Deaths caused by coronavirus (per 100k population) (Apr 27, 2024)
Daily increase in number of cases (Apr 27, 2024)
Weekly increase in number of cases (Apr 27, 2024)
Cases doubled (in days) (Apr 27, 2024)
Hospitalized patients (Apr 18, 2022)
Negative test results (Apr 18, 2022)
Total test results (Apr 18, 2022)
COVID Vaccine doses distributed (per 100k population) (Sep 19, 2023)
COVID Vaccine doses administered (per 100k population) (Sep 19, 2023)
COVID Vaccine doses distributed (Sep 19, 2023)
COVID Vaccine doses administered (Sep 19, 2023)
Likely homosexual households (%)
Likely homosexual households (% change since 2000)
Likely homosexual households - Lesbian couples (%)
Likely homosexual households - Lesbian couples (% change since 2000)
Likely homosexual households - Gay men (%)
Likely homosexual households - Gay men (% change since 2000)
Cost of living index
Median gross rent ($)
Median contract rent ($)
Median monthly housing costs ($)
Median house or condo value ($)
Median house or condo value ($ change since 2000)
Mean house or condo value by units in structure - 1, detached ($)
Mean house or condo value by units in structure - 1, attached ($)
Mean house or condo value by units in structure - 2 ($)
Mean house or condo value by units in structure by units in structure - 3 or 4 ($)
Mean house or condo value by units in structure - 5 or more ($)
Mean house or condo value by units in structure - Boat, RV, van, etc. ($)
Mean house or condo value by units in structure - Mobile home ($)
Median house or condo value ($) - White
Median house or condo value ($) - Black or African American
Median house or condo value ($) - Asian
Median house or condo value ($) - Hispanic or Latino
Median house or condo value ($) - American Indian and Alaska Native
Median house or condo value ($) - Multirace
Median house or condo value ($) - Other Race
Median resident age
Resident age diversity
Median resident age - Males
Median resident age - Females
Median resident age - White
Median resident age - Black or African American
Median resident age - Asian
Median resident age - Hispanic or Latino
Median resident age - American Indian and Alaska Native
Median resident age - Multirace
Median resident age - Other Race
Median resident age - Males - White
Median resident age - Males - Black or African American
Median resident age - Males - Asian
Median resident age - Males - Hispanic or Latino
Median resident age - Males - American Indian and Alaska Native
Median resident age - Males - Multirace
Median resident age - Males - Other Race
Median resident age - Females - White
Median resident age - Females - Black or African American
Median resident age - Females - Asian
Median resident age - Females - Hispanic or Latino
Median resident age - Females - American Indian and Alaska Native
Median resident age - Females - Multirace
Median resident age - Females - Other Race
Commute - mean travel time to work (minutes)
Travel time to work - Less than 5 minutes (%)
Travel time to work - Less than 5 minutes (% change since 2000)
Travel time to work - 5 to 9 minutes (%)
Travel time to work - 5 to 9 minutes (% change since 2000)
Travel time to work - 10 to 19 minutes (%)
Travel time to work - 10 to 19 minutes (% change since 2000)
Travel time to work - 20 to 29 minutes (%)
Travel time to work - 20 to 29 minutes (% change since 2000)
Travel time to work - 30 to 39 minutes (%)
Travel time to work - 30 to 39 minutes (% change since 2000)
Travel time to work - 40 to 59 minutes (%)
Travel time to work - 40 to 59 minutes (% change since 2000)
Travel time to work - 60 to 89 minutes (%)
Travel time to work - 60 to 89 minutes (% change since 2000)
Travel time to work - 90 or more minutes (%)
Travel time to work - 90 or more minutes (% change since 2000)
Marital status - Never married (%)
Marital status - Now married (%)
Marital status - Separated (%)
Marital status - Widowed (%)
Marital status - Divorced (%)
Median family income ($)
Median family income (% change since 2000)
Median non-family income ($)
Median non-family income (% change since 2000)
Median per capita income ($)
Median per capita income (% change since 2000)
Median family income ($) - White
Median family income ($) - Black or African American
Median family income ($) - Asian
Median family income ($) - Hispanic or Latino
Median family income ($) - American Indian and Alaska Native
Median family income ($) - Multirace
Median family income ($) - Other Race
Median year house/condo built
Median year apartment built
Year house built - Built 2005 or later (%)
Year house built - Built 2000 to 2004 (%)
Year house built - Built 1990 to 1999 (%)
Year house built - Built 1980 to 1989 (%)
Year house built - Built 1970 to 1979 (%)
Year house built - Built 1960 to 1969 (%)
Year house built - Built 1950 to 1959 (%)
Year house built - Built 1940 to 1949 (%)
Year house built - Built 1939 or earlier (%)
Average household size
Household density (households per square mile)
Average household size - White
Average household size - Black or African American
Average household size - Asian
Average household size - Hispanic or Latino
Average household size - American Indian and Alaska Native
Average household size - Multirace
Average household size - Other Race
Occupied housing units (%)
Vacant housing units (%)
Owner occupied housing units (%)
Renter occupied housing units (%)
Vacancy status - For rent (%)
Vacancy status - For sale only (%)
Vacancy status - Rented or sold, not occupied (%)
Vacancy status - For seasonal, recreational, or occasional use (%)
Vacancy status - For migrant workers (%)
Vacancy status - Other vacant (%)
Residents with income below the poverty level (%)
Residents with income below 50% of the poverty level (%)
Children below poverty level (%)
Poor families by family type - Married-couple family (%)
Poor families by family type - Male, no wife present (%)
Poor families by family type - Female, no husband present (%)
Poverty status for native-born residents (%)
Poverty status for foreign-born residents (%)
Poverty among high school graduates not in families (%)
Poverty among people who did not graduate high school not in families (%)
Residents with income below the poverty level (%) - White
Residents with income below the poverty level (%) - Black or African American
Residents with income below the poverty level (%) - Asian
Residents with income below the poverty level (%) - Hispanic or Latino
Residents with income below the poverty level (%) - American Indian and Alaska Native
Residents with income below the poverty level (%) - Multirace
Residents with income below the poverty level (%) - Other Race
Air pollution - Air Quality Index (AQI)
Air pollution - CO
Air pollution - NO2
Air pollution - SO2
Air pollution - Ozone
Air pollution - PM10
Air pollution - PM25
Air pollution - Pb
Crime - Murders per 100,000 population
Crime - Rapes per 100,000 population
Crime - Robberies per 100,000 population
Crime - Assaults per 100,000 population
Crime - Burglaries per 100,000 population
Crime - Thefts per 100,000 population
Crime - Auto thefts per 100,000 population
Crime - Arson per 100,000 population
Crime - City-data.com crime index
Crime - Violent crime index
Crime - Property crime index
Crime - Murders per 100,000 population (5 year average)
Crime - Rapes per 100,000 population (5 year average)
Crime - Robberies per 100,000 population (5 year average)
Crime - Assaults per 100,000 population (5 year average)
Crime - Burglaries per 100,000 population (5 year average)
Crime - Thefts per 100,000 population (5 year average)
Crime - Auto thefts per 100,000 population (5 year average)
Crime - Arson per 100,000 population (5 year average)
Crime - City-data.com crime index (5 year average)
Crime - Violent crime index (5 year average)
Crime - Property crime index (5 year average)
1996 Presidential Elections Results (%) - Democratic Party (Clinton)
1996 Presidential Elections Results (%) - Republican Party (Dole)
1996 Presidential Elections Results (%) - Other
2000 Presidential Elections Results (%) - Democratic Party (Gore)
2000 Presidential Elections Results (%) - Republican Party (Bush)
2000 Presidential Elections Results (%) - Other
2004 Presidential Elections Results (%) - Democratic Party (Kerry)
2004 Presidential Elections Results (%) - Republican Party (Bush)
2004 Presidential Elections Results (%) - Other
2008 Presidential Elections Results (%) - Democratic Party (Obama)
2008 Presidential Elections Results (%) - Republican Party (McCain)
2008 Presidential Elections Results (%) - Other
2012 Presidential Elections Results (%) - Democratic Party (Obama)
2012 Presidential Elections Results (%) - Republican Party (Romney)
2012 Presidential Elections Results (%) - Other
2016 Presidential Elections Results (%) - Democratic Party (Clinton)
2016 Presidential Elections Results (%) - Republican Party (Trump)
2016 Presidential Elections Results (%) - Other
2020 Presidential Elections Results (%) - Democratic Party (Biden)
2020 Presidential Elections Results (%) - Republican Party (Trump)
2020 Presidential Elections Results (%) - Other
Ancestries Reported - Arab (%)
Ancestries Reported - Czech (%)
Ancestries Reported - Danish (%)
Ancestries Reported - Dutch (%)
Ancestries Reported - English (%)
Ancestries Reported - French (%)
Ancestries Reported - French Canadian (%)
Ancestries Reported - German (%)
Ancestries Reported - Greek (%)
Ancestries Reported - Hungarian (%)
Ancestries Reported - Irish (%)
Ancestries Reported - Italian (%)
Ancestries Reported - Lithuanian (%)
Ancestries Reported - Norwegian (%)
Ancestries Reported - Polish (%)
Ancestries Reported - Portuguese (%)
Ancestries Reported - Russian (%)
Ancestries Reported - Scotch-Irish (%)
Ancestries Reported - Scottish (%)
Ancestries Reported - Slovak (%)
Ancestries Reported - Subsaharan African (%)
Ancestries Reported - Swedish (%)
Ancestries Reported - Swiss (%)
Ancestries Reported - Ukrainian (%)
Ancestries Reported - United States (%)
Ancestries Reported - Welsh (%)
Ancestries Reported - West Indian (%)
Ancestries Reported - Other (%)
Educational Attainment - No schooling completed (%)
Educational Attainment - Less than high school (%)
Educational Attainment - High school or equivalent (%)
Educational Attainment - Less than 1 year of college (%)
Educational Attainment - 1 or more years of college (%)
Educational Attainment - Associate degree (%)
Educational Attainment - Bachelor's degree (%)
Educational Attainment - Master's degree (%)
Educational Attainment - Professional school degree (%)
Educational Attainment - Doctorate degree (%)
School Enrollment - Nursery, preschool (%)
School Enrollment - Kindergarten (%)
School Enrollment - Grade 1 to 4 (%)
School Enrollment - Grade 5 to 8 (%)
School Enrollment - Grade 9 to 12 (%)
School Enrollment - College undergrad (%)
School Enrollment - Graduate or professional (%)
School Enrollment - Not enrolled in school (%)
School enrollment - Public schools (%)
School enrollment - Private schools (%)
School enrollment - Not enrolled (%)
Median number of rooms in houses and condos
Median number of rooms in apartments
Housing units lacking complete plumbing facilities (%)
Housing units lacking complete kitchen facilities (%)
Density of houses
Urban houses (%)
Rural houses (%)
Households with people 60 years and over (%)
Households with people 65 years and over (%)
Households with people 75 years and over (%)
Households with one or more nonrelatives (%)
Households with no nonrelatives (%)
Population in households (%)
Family households (%)
Nonfamily households (%)
Population in families (%)
Family households with own children (%)
Median number of bedrooms in owner occupied houses
Mean number of bedrooms in owner occupied houses
Median number of bedrooms in renter occupied houses
Mean number of bedrooms in renter occupied houses
Median number of vehichles in owner occupied houses
Mean number of vehichles in owner occupied houses
Median number of vehichles in renter occupied houses
Mean number of vehichles in renter occupied houses
Mortgage status - with mortgage (%)
Mortgage status - with second mortgage (%)
Mortgage status - with home equity loan (%)
Mortgage status - with both second mortgage and home equity loan (%)
Mortgage status - without a mortgage (%)
Average family size
Average family size - White
Average family size - Black or African American
Average family size - Asian
Average family size - Hispanic or Latino
Average family size - American Indian and Alaska Native
Average family size - Multirace
Average family size - Other Race
Geographical mobility - Same house 1 year ago (%)
Geographical mobility - Moved within same county (%)
Geographical mobility - Moved from different county within same state (%)
Geographical mobility - Moved from different state (%)
Geographical mobility - Moved from abroad (%)
Place of birth - Born in state of residence (%)
Place of birth - Born in other state (%)
Place of birth - Native, outside of US (%)
Place of birth - Foreign born (%)
Housing units in structures - 1, detached (%)
Housing units in structures - 1, attached (%)
Housing units in structures - 2 (%)
Housing units in structures - 3 or 4 (%)
Housing units in structures - 5 to 9 (%)
Housing units in structures - 10 to 19 (%)
Housing units in structures - 20 to 49 (%)
Housing units in structures - 50 or more (%)
Housing units in structures - Mobile home (%)
Housing units in structures - Boat, RV, van, etc. (%)
House/condo owner moved in on average (years ago)
Renter moved in on average (years ago)
Year householder moved into unit - Moved in 1999 to March 2000 (%)
Year householder moved into unit - Moved in 1995 to 1998 (%)
Year householder moved into unit - Moved in 1990 to 1994 (%)
Year householder moved into unit - Moved in 1980 to 1989 (%)
Year householder moved into unit - Moved in 1970 to 1979 (%)
Year householder moved into unit - Moved in 1969 or earlier (%)
Means of transportation to work - Drove car alone (%)
Means of transportation to work - Carpooled (%)
Means of transportation to work - Public transportation (%)
Means of transportation to work - Bus or trolley bus (%)
Means of transportation to work - Streetcar or trolley car (%)
Means of transportation to work - Subway or elevated (%)
Means of transportation to work - Railroad (%)
Means of transportation to work - Ferryboat (%)
Means of transportation to work - Taxicab (%)
Means of transportation to work - Motorcycle (%)
Means of transportation to work - Bicycle (%)
Means of transportation to work - Walked (%)
Means of transportation to work - Other means (%)
Working at home (%)
Industry diversity
Most Common Industries - Agriculture, forestry, fishing and hunting, and mining (%)
Most Common Industries - Agriculture, forestry, fishing and hunting (%)
Most Common Industries - Mining, quarrying, and oil and gas extraction (%)
Most Common Industries - Construction (%)
Most Common Industries - Manufacturing (%)
Most Common Industries - Wholesale trade (%)
Most Common Industries - Retail trade (%)
Most Common Industries - Transportation and warehousing, and utilities (%)
Most Common Industries - Transportation and warehousing (%)
Most Common Industries - Utilities (%)
Most Common Industries - Information (%)
Most Common Industries - Finance and insurance, and real estate and rental and leasing (%)
Most Common Industries - Finance and insurance (%)
Most Common Industries - Real estate and rental and leasing (%)
Most Common Industries - Professional, scientific, and management, and administrative and waste management services (%)
Most Common Industries - Professional, scientific, and technical services (%)
Most Common Industries - Management of companies and enterprises (%)
Most Common Industries - Administrative and support and waste management services (%)
Most Common Industries - Educational services, and health care and social assistance (%)
Most Common Industries - Educational services (%)
Most Common Industries - Health care and social assistance (%)
Most Common Industries - Arts, entertainment, and recreation, and accommodation and food services (%)
Most Common Industries - Arts, entertainment, and recreation (%)
Most Common Industries - Accommodation and food services (%)
Most Common Industries - Other services, except public administration (%)
Most Common Industries - Public administration (%)
Occupation diversity
Most Common Occupations - Management, business, science, and arts occupations (%)
Most Common Occupations - Management, business, and financial occupations (%)
Most Common Occupations - Management occupations (%)
Most Common Occupations - Business and financial operations occupations (%)
Most Common Occupations - Computer, engineering, and science occupations (%)
Most Common Occupations - Computer and mathematical occupations (%)
Most Common Occupations - Architecture and engineering occupations (%)
Most Common Occupations - Life, physical, and social science occupations (%)
Most Common Occupations - Education, legal, community service, arts, and media occupations (%)
Most Common Occupations - Community and social service occupations (%)
Most Common Occupations - Legal occupations (%)
Most Common Occupations - Education, training, and library occupations (%)
Most Common Occupations - Arts, design, entertainment, sports, and media occupations (%)
Most Common Occupations - Healthcare practitioners and technical occupations (%)
Most Common Occupations - Health diagnosing and treating practitioners and other technical occupations (%)
Most Common Occupations - Health technologists and technicians (%)
Most Common Occupations - Service occupations (%)
Most Common Occupations - Healthcare support occupations (%)
Most Common Occupations - Protective service occupations (%)
Most Common Occupations - Fire fighting and prevention, and other protective service workers including supervisors (%)
Most Common Occupations - Law enforcement workers including supervisors (%)
Most Common Occupations - Food preparation and serving related occupations (%)
Most Common Occupations - Building and grounds cleaning and maintenance occupations (%)
Most Common Occupations - Personal care and service occupations (%)
Most Common Occupations - Sales and office occupations (%)
Most Common Occupations - Sales and related occupations (%)
Most Common Occupations - Office and administrative support occupations (%)
Most Common Occupations - Natural resources, construction, and maintenance occupations (%)
Most Common Occupations - Farming, fishing, and forestry occupations (%)
Most Common Occupations - Construction and extraction occupations (%)
Most Common Occupations - Installation, maintenance, and repair occupations (%)
Most Common Occupations - Production, transportation, and material moving occupations (%)
Most Common Occupations - Production occupations (%)
Most Common Occupations - Transportation occupations (%)
Most Common Occupations - Material moving occupations (%)
People in Group quarters - Institutionalized population (%)
People in Group quarters - Correctional institutions (%)
People in Group quarters - Federal prisons and detention centers (%)
People in Group quarters - Halfway houses (%)
People in Group quarters - Local jails and other confinement facilities (including police lockups) (%)
People in Group quarters - Military disciplinary barracks (%)
People in Group quarters - State prisons (%)
People in Group quarters - Other types of correctional institutions (%)
People in Group quarters - Nursing homes (%)
People in Group quarters - Hospitals/wards, hospices, and schools for the handicapped (%)
People in Group quarters - Hospitals/wards and hospices for chronically ill (%)
People in Group quarters - Hospices or homes for chronically ill (%)
People in Group quarters - Military hospitals or wards for chronically ill (%)
People in Group quarters - Other hospitals or wards for chronically ill (%)
People in Group quarters - Hospitals or wards for drug/alcohol abuse (%)
People in Group quarters - Mental (Psychiatric) hospitals or wards (%)
People in Group quarters - Schools, hospitals, or wards for the mentally retarded (%)
People in Group quarters - Schools, hospitals, or wards for the physically handicapped (%)
People in Group quarters - Institutions for the deaf (%)
People in Group quarters - Institutions for the blind (%)
People in Group quarters - Orthopedic wards and institutions for the physically handicapped (%)
People in Group quarters - Wards in general hospitals for patients who have no usual home elsewhere (%)
People in Group quarters - Wards in military hospitals for patients who have no usual home elsewhere (%)
People in Group quarters - Juvenile institutions (%)
People in Group quarters - Long-term care (%)
People in Group quarters - Homes for abused, dependent, and neglected children (%)
People in Group quarters - Residential treatment centers for emotionally disturbed children (%)
People in Group quarters - Training schools for juvenile delinquents (%)
People in Group quarters - Short-term care, detention or diagnostic centers for delinquent children (%)
People in Group quarters - Type of juvenile institution unknown (%)
People in Group quarters - Noninstitutionalized population (%)
People in Group quarters - College dormitories (includes college quarters off campus) (%)
People in Group quarters - Military quarters (%)
People in Group quarters - On base (%)
People in Group quarters - Barracks, unaccompanied personnel housing (UPH), (Enlisted/Officer), ;and similar group living quarters for military personnel (%)
People in Group quarters - Transient quarters for temporary residents (%)
People in Group quarters - Military ships (%)
People in Group quarters - Group homes (%)
People in Group quarters - Homes or halfway houses for drug/alcohol abuse (%)
People in Group quarters - Homes for the mentally ill (%)
People in Group quarters - Homes for the mentally retarded (%)
People in Group quarters - Homes for the physically handicapped (%)
People in Group quarters - Other group homes (%)
People in Group quarters - Religious group quarters (%)
People in Group quarters - Dormitories (%)
People in Group quarters - Agriculture workers' dormitories on farms (%)
People in Group quarters - Job Corps and vocational training facilities (%)
People in Group quarters - Other workers' dormitories (%)
People in Group quarters - Crews of maritime vessels (%)
People in Group quarters - Other nonhousehold living situations (%)
People in Group quarters - Other noninstitutional group quarters (%)
Residents speaking English at home (%)
Residents speaking English at home - Born in the United States (%)
Residents speaking English at home - Native, born elsewhere (%)
Residents speaking English at home - Foreign born (%)
Residents speaking Spanish at home (%)
Residents speaking Spanish at home - Born in the United States (%)
Residents speaking Spanish at home - Native, born elsewhere (%)
Residents speaking Spanish at home - Foreign born (%)
Residents speaking other language at home (%)
Residents speaking other language at home - Born in the United States (%)
Residents speaking other language at home - Native, born elsewhere (%)
Residents speaking other language at home - Foreign born (%)
Class of Workers - Employee of private company (%)
Class of Workers - Self-employed in own incorporated business (%)
Class of Workers - Private not-for-profit wage and salary workers (%)
Class of Workers - Local government workers (%)
Class of Workers - State government workers (%)
Class of Workers - Federal government workers (%)
Class of Workers - Self-employed workers in own not incorporated business and Unpaid family workers (%)
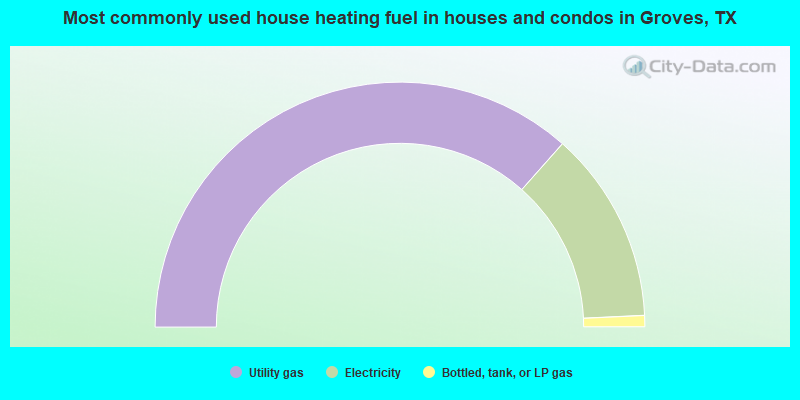
House heating fuel used in houses and condos - Utility gas (%)
House heating fuel used in houses and condos - Bottled, tank, or LP gas (%)
House heating fuel used in houses and condos - Electricity (%)
House heating fuel used in houses and condos - Fuel oil, kerosene, etc. (%)
House heating fuel used in houses and condos - Coal or coke (%)
House heating fuel used in houses and condos - Wood (%)
House heating fuel used in houses and condos - Solar energy (%)
House heating fuel used in houses and condos - Other fuel (%)
House heating fuel used in houses and condos - No fuel used (%)
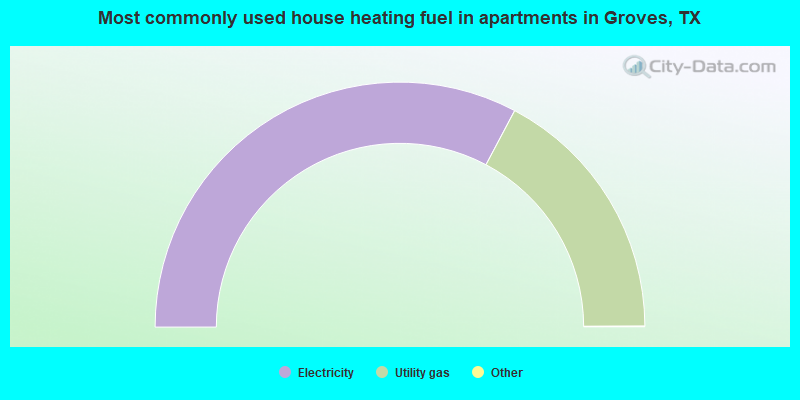
House heating fuel used in apartments - Utility gas (%)
House heating fuel used in apartments - Bottled, tank, or LP gas (%)
House heating fuel used in apartments - Electricity (%)
House heating fuel used in apartments - Fuel oil, kerosene, etc. (%)
House heating fuel used in apartments - Coal or coke (%)
House heating fuel used in apartments - Wood (%)
House heating fuel used in apartments - Solar energy (%)
House heating fuel used in apartments - Other fuel (%)
House heating fuel used in apartments - No fuel used (%)
Armed forces status - In Armed Forces (%)
Armed forces status - Civilian (%)
Armed forces status - Civilian - Veteran (%)
Armed forces status - Civilian - Nonveteran (%)
Fatal accidents locations in years 2005-2021
Fatal accidents locations in 2005
Fatal accidents locations in 2006
Fatal accidents locations in 2007
Fatal accidents locations in 2008
Fatal accidents locations in 2009
Fatal accidents locations in 2010
Fatal accidents locations in 2011
Fatal accidents locations in 2012
Fatal accidents locations in 2013
Fatal accidents locations in 2014
Fatal accidents locations in 2015
Fatal accidents locations in 2016
Fatal accidents locations in 2017
Fatal accidents locations in 2018
Fatal accidents locations in 2019
Fatal accidents locations in 2020
Fatal accidents locations in 2021
Alcohol use - People drinking some alcohol every month (%)
Alcohol use - People not drinking at all (%)
Alcohol use - Average days/month drinking alcohol
Alcohol use - Average drinks/week
Alcohol use - Average days/year people drink much
Audiometry - Average condition of hearing (%)
Audiometry - People that can hear a whisper from across a quiet room (%)
Audiometry - People that can hear normal voice from across a quiet room (%)
Audiometry - Ears ringing, roaring, buzzing (%)
Audiometry - Had a job exposure to loud noise (%)
Audiometry - Had off-work exposure to loud noise (%)
Blood Pressure & Cholesterol - Has high blood pressure (%)
Blood Pressure & Cholesterol - Checking blood pressure at home (%)
Blood Pressure & Cholesterol - Frequently checking blood cholesterol (%)
Blood Pressure & Cholesterol - Has high cholesterol level (%)
Consumer Behavior - Money monthly spent on food at supermarket/grocery store
Consumer Behavior - Money monthly spent on food at other stores
Consumer Behavior - Money monthly spent on eating out
Consumer Behavior - Money monthly spent on carryout/delivered foods
Consumer Behavior - Income spent on food at supermarket/grocery store (%)
Consumer Behavior - Income spent on food at other stores (%)
Consumer Behavior - Income spent on eating out (%)
Consumer Behavior - Income spent on carryout/delivered foods (%)
Current Health Status - General health condition (%)
Current Health Status - Blood donors (%)
Current Health Status - Has blood ever tested for HIV virus (%)
Current Health Status - Left-handed people (%)
Dermatology - People using sunscreen (%)
Diabetes - Diabetics (%)
Diabetes - Had a blood test for high blood sugar (%)
Diabetes - People taking insulin (%)
Diet Behavior & Nutrition - Diet health (%)
Diet Behavior & Nutrition - Milk product consumption (# of products/month)
Diet Behavior & Nutrition - Meals not home prepared (#/week)
Diet Behavior & Nutrition - Meals from fast food or pizza place (#/week)
Diet Behavior & Nutrition - Ready-to-eat foods (#/month)
Diet Behavior & Nutrition - Frozen meals/pizza (#/month)
Drug Use - People that ever used marijuana or hashish (%)
Drug Use - Ever used hard drugs (%)
Drug Use - Ever used any form of cocaine (%)
Drug Use - Ever used heroin (%)
Drug Use - Ever used methamphetamine (%)
Health Insurance - People covered by health insurance (%)
Kidney Conditions-Urology - Avg. # of times urinating at night
Medical Conditions - People with asthma (%)
Medical Conditions - People with anemia (%)
Medical Conditions - People with psoriasis (%)
Medical Conditions - People with overweight (%)
Medical Conditions - Elderly people having difficulties in thinking or remembering (%)
Medical Conditions - People who ever received blood transfusion (%)
Medical Conditions - People having trouble seeing even with glass/contacts (%)
Medical Conditions - People with arthritis (%)
Medical Conditions - People with gout (%)
Medical Conditions - People with congestive heart failure (%)
Medical Conditions - People with coronary heart disease (%)
Medical Conditions - People with angina pectoris (%)
Medical Conditions - People who ever had heart attack (%)
Medical Conditions - People who ever had stroke (%)
Medical Conditions - People with emphysema (%)
Medical Conditions - People with thyroid problem (%)
Medical Conditions - People with chronic bronchitis (%)
Medical Conditions - People with any liver condition (%)
Medical Conditions - People who ever had cancer or malignancy (%)
Mental Health - People who have little interest in doing things (%)
Mental Health - People feeling down, depressed, or hopeless (%)
Mental Health - People who have trouble sleeping or sleeping too much (%)
Mental Health - People feeling tired or having little energy (%)
Mental Health - People with poor appetite or overeating (%)
Mental Health - People feeling bad about themself (%)
Mental Health - People who have trouble concentrating on things (%)
Mental Health - People moving or speaking slowly or too fast (%)
Mental Health - People having thoughts they would be better off dead (%)
Oral Health - Average years since last visit a dentist
Oral Health - People embarrassed because of mouth (%)
Oral Health - People with gum disease (%)
Oral Health - General health of teeth and gums (%)
Oral Health - Average days a week using dental floss/device
Oral Health - Average days a week using mouthwash for dental problem
Oral Health - Average number of teeth
Pesticide Use - Households using pesticides to control insects (%)
Pesticide Use - Households using pesticides to kill weeds (%)
Physical Activity - People doing vigorous-intensity work activities (%)
Physical Activity - People doing moderate-intensity work activities (%)
Physical Activity - People walking or bicycling (%)
Physical Activity - People doing vigorous-intensity recreational activities (%)
Physical Activity - People doing moderate-intensity recreational activities (%)
Physical Activity - Average hours a day doing sedentary activities
Physical Activity - Average hours a day watching TV or videos
Physical Activity - Average hours a day using computer
Physical Functioning - People having limitations keeping them from working (%)
Physical Functioning - People limited in amount of work they can do (%)
Physical Functioning - People that need special equipment to walk (%)
Physical Functioning - People experiencing confusion/memory problems (%)
Physical Functioning - People requiring special healthcare equipment (%)
Prescription Medications - Average number of prescription medicines taking
Preventive Aspirin Use - Adults 40+ taking low-dose aspirin (%)
Reproductive Health - Vaginal deliveries (%)
Reproductive Health - Cesarean deliveries (%)
Reproductive Health - Deliveries resulted in a live birth (%)
Reproductive Health - Pregnancies resulted in a delivery (%)
Reproductive Health - Women breastfeeding newborns (%)
Reproductive Health - Women that had a hysterectomy (%)
Reproductive Health - Women that had both ovaries removed (%)
Reproductive Health - Women that have ever taken birth control pills (%)
Reproductive Health - Women taking birth control pills (%)
Reproductive Health - Women that have ever used Depo-Provera or injectables (%)
Reproductive Health - Women that have ever used female hormones (%)
Sexual Behavior - People 18+ that ever had sex (vaginal, anal, or oral) (%)
Sexual Behavior - Males 18+ that ever had vaginal sex with a woman (%)
Sexual Behavior - Males 18+ that ever performed oral sex on a woman (%)
Sexual Behavior - Males 18+ that ever had anal sex with a woman (%)
Sexual Behavior - Males 18+ that ever had any sex with a man (%)
Sexual Behavior - Females 18+ that ever had vaginal sex with a man (%)
Sexual Behavior - Females 18+ that ever performed oral sex on a man (%)
Sexual Behavior - Females 18+ that ever had anal sex with a man (%)
Sexual Behavior - Females 18+ that ever had any kind of sex with a woman (%)
Sexual Behavior - Average age people first had sex
Sexual Behavior - Average number of female sex partners in lifetime (males 18+)
Sexual Behavior - Average number of female vaginal sex partners in lifetime (males 18+)
Sexual Behavior - Average age people first performed oral sex on a woman (18+)
Sexual Behavior - Average number of woman performed oral sex on in lifetime (18+)
Sexual Behavior - Average number of male sex partners in lifetime (males 18+)
Sexual Behavior - Average number of male anal sex partners in lifetime (males 18+)
Sexual Behavior - Average age people first performed oral sex on a man (18+)
Sexual Behavior - Average number of male oral sex partners in lifetime (18+)
Sexual Behavior - People using protection when performing oral sex (%)
Sexual Behavior - Average number of times people have vaginal or anal sex a year
Sexual Behavior - People having sex without condom (%)
Sexual Behavior - Average number of male sex partners in lifetime (females 18+)
Sexual Behavior - Average number of male vaginal sex partners in lifetime (females 18+)
Sexual Behavior - Average number of female sex partners in lifetime (females 18+)
Sexual Behavior - Circumcised males 18+ (%)
Sleep Disorders - Average hours sleeping at night
Sleep Disorders - People that has trouble sleeping (%)
Smoking-Cigarette Use - People smoking cigarettes (%)
Taste & Smell - People 40+ having problems with smell (%)
Taste & Smell - People 40+ having problems with taste (%)
Taste & Smell - People 40+ that ever had wisdom teeth removed (%)
Taste & Smell - People 40+ that ever had tonsils teeth removed (%)
Taste & Smell - People 40+ that ever had a loss of consciousness because of a head injury (%)
Taste & Smell - People 40+ that ever had a broken nose or other serious injury to face or skull (%)
Taste & Smell - People 40+ that ever had two or more sinus infections (%)
Weight - Average height (inches)
Weight - Average weight (pounds)
Weight - Average BMI
Weight - People that are obese (%)
Weight - People that ever were obese (%)
Weight - People trying to lose weight (%)
According to our research of Texas and other state lists, there were 35 registered sex offenders living in Groves, Texas as of April 27, 2024 . The ratio of all residents to sex offenders in Groves is 454 to 1.The ratio of registered sex offenders to all residents in this city is near the state average.
Officers per 1,000 residents here:
1.38Texas average:
2.07
Latest news from Groves, TX collected exclusively by city-data.com from local newspapers, TV, and radio stations
Ancestries: German (8.0%), French (6.2%), American (6.0%), Italian (4.5%), English (4.3%), Irish (3.4%).
Current Local Time:
Land area: 5.18 square miles.
Population density: 3,242 people per square mile (average).
2,471 residents are foreign born (9.3% Latin America , 4.6% Asia ).
This city:
14.7%Texas:
17.1%
Median real estate property taxes paid for housing units with mortgages in 2022: $3,482 (1.8%)Median real estate property taxes paid for housing units with no mortgage in 2022: $2,252 (1.7%)
Nearest city with pop. 50,000+: East Jefferson, TX
Nearest city with pop. 200,000+: Houston, TX
Nearest cities:
Latitude: 29.95 N, Longitude: 93.92 W
Daytime population change due to commuting: -3,551 (-21.1%)Workers who live and work in this city: 1,265 (16.7%)
Area code commonly used in this area: 409
Single-family new house construction building permits:
2022: 32 buildings , average cost: $182,9002021: 36 buildings , average cost: $212,6002020: 34 buildings , average cost: $198,6002019: 30 buildings , average cost: $201,7002018: 52 buildings , average cost: $207,2002017: 26 buildings , average cost: $230,7002016: 33 buildings , average cost: $226,9002015: 19 buildings , average cost: $225,1002014: 11 buildings , average cost: $215,6002013: 9 buildings , average cost: $201,3002012: 13 buildings , average cost: $191,8002011: 7 buildings , average cost: $275,0002010: 22 buildings , average cost: $121,8002009: 20 buildings , average cost: $137,0002008: 40 buildings , average cost: $119,8002007: 32 buildings , average cost: $107,1002006: 21 buildings , average cost: $127,9002005: 5 buildings , average cost: $138,3002004: 15 buildings , average cost: $130,0002003: 17 buildings , average cost: $125,0002002: 16 buildings , average cost: $103,1002001: 19 buildings , average cost: $125,3002000: 33 buildings , average cost: $114,7001999: 40 buildings , average cost: $107,1001998: 39 buildings , average cost: $107,1001997: 25 buildings , average cost: $101,100Unemployment in December 2023:
Most common occupations in Groves, TX (%)
Both Males Females
Other production occupations, including supervisors (5.9%)
Preschool, kindergarten, elementary, and middle school teachers (4.3%)
Secretaries and administrative assistants (4.0%)
Other office and administrative support workers, including supervisors (3.7%)
Electrical equipment mechanics and other installation, maintenance, and repair workers, including supervisors (3.3%)
Sales representatives, services, wholesale and manufacturing (3.2%)
Driver/sales workers and truck drivers (3.0%)
Other production occupations, including supervisors (9.8%)
Electrical equipment mechanics and other installation, maintenance, and repair workers, including supervisors (6.0%)
Driver/sales workers and truck drivers (4.9%)
Carpenters (4.5%)
Laborers and material movers, hand (4.2%)
Sales representatives, services, wholesale and manufacturing (3.8%)
Law enforcement workers, including supervisors (3.4%)
Preschool, kindergarten, elementary, and middle school teachers (9.0%)
Secretaries and administrative assistants (8.9%)
Other office and administrative support workers, including supervisors (6.7%)
Registered nurses (6.3%)
Health technologists and technicians (5.0%)
Information and record clerks, except customer service representatives (5.0%)
Bookkeeping, accounting, and auditing clerks (4.1%)
Tornado activity:
Groves-area historical tornado activity is slightly above Texas state average. It is 49% greater than the overall U.S. average.
On 11/7/1957, a category F4 (max. wind speeds 207-260 mph) tornado 2.7 miles away from the Groves city center killed one person and injured 81 people and caused between $500,000 and $5,000,000 in damages.
On 11/7/1957, a category F3 (max. wind speeds 158-206 mph) tornado 0.9 miles away from the city center killed 2 people and injured 59 people and caused between $500,000 and $5,000,000 in damages.
Earthquake activity:
Groves-area historical earthquake activity is significantly above Texas state average. It is 41% smaller than the overall U.S. average. On 5/17/2012 at 08:12:00, a magnitude 4.8 (4.8 MW, Depth: 3.1 mi, Class: Light, Intensity: IV - V) earthquake occurred 139.5 miles away from the city center On 9/2/2013 at 23:51:15, a magnitude 4.3 (4.3 MW, Depth: 2.9 mi) earthquake occurred 139.1 miles away from the city center On 9/2/2013 at 21:52:38, a magnitude 4.2 (4.2 MW, Depth: 3.0 mi) earthquake occurred 144.2 miles away from the city center On 10/20/2011 at 12:24:41, a magnitude 4.8 (4.8 MW, Depth: 3.1 mi) earthquake occurred 261.8 miles away from Groves center On 1/25/2013 at 07:01:19, a magnitude 4.1 (4.1 MB, Depth: 3.1 mi) earthquake occurred 133.2 miles away from Groves center On 5/10/2012 at 15:15:38, a magnitude 3.9 (3.9 MW, Depth: 4.3 mi, Class: Light, Intensity: II - III) earthquake occurred 143.3 miles away from the city center Magnitude types: body-wave magnitude (MB), moment magnitude (MW) Natural disasters: The number of natural disasters in Jefferson County (23) is greater than the US average (15).Major Disasters (Presidential) Declared: 14Emergencies Declared: 6Hurricanes: 8, Storms: 8, Floods: 7, Tornadoes: 4, Tropical Storms: 4, Fire: 1, Flash Flood: 1, Other: 2 (Note: some incidents may be assigned to more than one category). Hospitals and medical centers in Groves: RENAISSANCE HOSPITAL GROVES (provides emergency services, 5500 39TH ST) DOCTORS HOSPITAL SNF UNIT (5500 - 39TH STREET)
MAGNOLIA MANOR (4400 GULF ST)
OAK GROVE NURSING HOME (6230 WARREN ST)
Amtrak station near Groves: 16 miles: BEAUMONT (2555 W. CEDAR ST.) Services: partially wheelchair accessible, enclosed waiting area, public restrooms, public payphones, free short-term parking, free long-term parking, call for taxi service.
Colleges/universities with over 2000 students nearest to Groves:
Lamar University (about 12 miles; Beaumont, TX ; Full-time enrollment: 13,658)
Lamar Institute of Technology (about 12 miles; Beaumont, TX ; FT enrollment: 2,023)
McNeese State University (about 45 miles; Lake Charles, LA ; FT enrollment: 7,444)
SOWELA Technical Community College (about 49 miles; Lake Charles, LA ; FT enrollment: 2,160)
Lee College (about 66 miles; Baytown, TX ; FT enrollment: 4,278)
The University of Texas Medical Branch (about 68 miles; Galveston, TX ; FT enrollment: 2,314)
San Jacinto Community College (about 75 miles; Pasadena, TX ; FT enrollment: 13,517)
Public elementary/middle schools in Groves: GROVES MIDDLE Students: 495, Location: 5201 WILSON ST, Grades: 6-8)GROVES EL Students: 340, Location: 3901 CLEVELAND AVE, Grades: 4-5)VAN BUREN EL Students: 322, Location: 6400 VAN BUREN, Grades: PK-3)Private elementary/middle school in Groves: TRIANGLE ADVENTIST CHRISTIAN SCHOOL Students: 13, Location: DRAWER H, Grades: KG-8)
See full list of schools located in Groves Library in Groves: GROVES PUBLIC LIBRARY Operating income: $250,526; Location: 5600 W WASHINGTON ST; 33,901 books ; 1,163 audio materials ; 2,253 video materials ; 50 state licensed databases ; 43 print serial subscriptions )
User-submitted facts and corrections:
Park Place Medical Center and Mid-Jefferson Hospital were merged into a new medical facility called the Medical Center of Southeast Texas, located at 2555 Jimmy Johnson Blvd., Port Arthur, Texas 77642 in April, 2005. (409) 724-7389.
You may now sell mixed drinks in Groves. And we have a public swimming pool.Also pecan festival. Little league parks and a dance place for children. added by proud
LAMAR STATE COLLEGE-PORT ARTHUR (3 miles,total enrollment: 3010; Location: 1500 PROCTOR ST; Public; Website: www.pa.lamar.edu)
Birthplace of: Greg Davis (American football) - Football player and coach, Mary Karr - Memoirist, Jim Bob Helduser - Football player and coach.
Jefferson County has a predicted average indoor radon screening level less than 2 pCi/L (pico curies per liter) - Low Potential Average household size: This city:
2.5 peopleTexas:
2.8 people
Percentage of family households: This city:
69.0%Whole state:
69.9%
Percentage of households with unmarried partners: This city:
4.6%Whole state:
6.0%
Likely homosexual households (counted as self-reported same-sex unmarried-partner households)
Lesbian couples: 0.3% of all households Gay men: 0.3% of all households
147 people in nursing facilities/skilled-nursing facilities in 2010people in nursing homes in 2000
Banks with branches in Groves (2011 data):
Prosperity Bank: Groves Branch at 3434 Twin City Highway, branch established on 1889/01/01. Info updated 2012/01/05: Bank assets: $9,816.2 mil, Deposits: $8,064.8 mil, headquarters in El Campo, TX, positive income , Mortgage Lending Specialization, 187 total offices , Holding Company: Prosperity Bancshares, Inc.
Wells Fargo Bank, National Association: Main Office at 4000 Twin City Highway, Bldg B, branch established on 1974/03/18. Info updated 2011/04/05: Bank assets: $1,161,490.0 mil, Deposits: $905,653.0 mil, headquarters in Sioux Falls, SD, positive income , 6395 total offices , Holding Company: Wells Fargo & Company
For population 15 years and over in Groves:
Never married: 23.5%Now married: 55.7%Separated: 2.7%Widowed: 6.9%Divorced: 11.2% For population 25 years and over in Groves:
High school or higher: 86.7%Bachelor's degree or higher: 13.8%Graduate or professional degree: 4.1%Unemployed: 5.4%Mean travel time to work (commute): 22.3 minutes
Education Gini index (Inequality in education) Here:
13.8Texas average:
14.0
Religion statistics for Groves, TX (based on Jefferson County data)
Religion Adherents Congregations Evangelical Protestant 76,088 240 Catholic 71,211 25 Black Protestant 22,468 59 Mainline Protestant 14,187 39 Other 11,594 23 Orthodox 415 2 None 56,310 -
Source: Clifford Grammich, Kirk Hadaway, Richard Houseal, Dale E.Jones, Alexei Krindatch, Richie Stanley and Richard H.Taylor. 2012. 2010 U.S.Religion Census: Religious Congregations & Membership Study. Association of Statisticians of American Religious Bodies. Jones, Dale E., et al. 2002. Congregations and Membership in the United States 2000. Nashville, TN: Glenmary Research Center. Graphs represent county-level data
Food Environment Statistics: Number of grocery stores : 47Here :
1.94 / 10,000 pop.State :
1.47 / 10,000 pop.
Number of supercenters and club stores : 4This county :
0.17 / 10,000 pop.Texas :
0.14 / 10,000 pop.
Number of convenience stores (no gas) : 38This county :
1.57 / 10,000 pop.Texas :
1.11 / 10,000 pop.
Number of convenience stores (with gas) : 137Jefferson County :
5.65 / 10,000 pop.Texas :
3.95 / 10,000 pop.
Number of full-service restaurants : 133Here :
5.49 / 10,000 pop.Texas :
6.13 / 10,000 pop.
Adult diabetes rate : Jefferson County :
12.3%Texas :
8.9%
Adult obesity rate : This county :
30.3%State :
26.6%
Low-income preschool obesity rate : Health and Nutrition: Healthy diet rate : This city:
49.3%State:
48.6%
Average overall health of teeth and gums : This city:
45.4%Texas:
47.4%
People feeling badly about themselves : This city:
21.2%Texas:
20.6%
People not drinking alcohol at all : Average hours sleeping at night : General health condition : This city:
54.7%Texas:
56.2%
Average condition of hearing : More about Health and Nutrition of Groves, TX Residents
Local government employment and payroll (March 2022)
Function
Full-time employees
Monthly full-time payroll
Average yearly full-time wage
Part-time employees
Monthly part-time payroll
Police Protection - Officers
25 $184,609 $88,612 0 $0 Water Supply
19 $106,141 $67,036 1 $1,318 Firefighters
17 $122,477 $86,454 0 $0 Streets and Highways
14 $61,379 $52,611 0 $0 Other and Unallocable
12 $61,927 $61,927 4 $1,418 Sewerage
12 $55,641 $55,641 0 $0 Solid Waste Management
6 $29,357 $58,714 0 $0 Other Government Administration
5 $42,427 $101,825 8 $4,403 Parks and Recreation
5 $18,377 $44,105 5 $7,999 Local Libraries
3 $19,370 $77,480 1 $2,507 Financial Administration
2 $17,876 $107,256 0 $0 Police - Other
1 $5,839 $70,068 8 $7,688 Judicial and Legal
1 $6,885 $82,620 4 $5,135
Totals for Government
122 $732,305 $72,030 31 $30,468
Groves government finances - Expenditure in 2017 (per resident):
Current Operations - Police Protection: $2,916,000 ($173.59)
Water Utilities: $2,376,000 ($141.45)Sewerage: $2,300,000 ($136.92)General - Other: $2,202,000 ($131.09)Local Fire Protection: $1,581,000 ($94.12)Solid Waste Management: $1,346,000 ($80.13)Central Staff Services: $596,000 ($35.48)Financial Administration: $420,000 ($25.00)Libraries: $320,000 ($19.05)General Public Buildings: $304,000 ($18.10)Parks and Recreation: $192,000 ($11.43)Protective Inspection and Regulation - Other: $134,000 ($7.98)Judicial and Legal Services: $119,000 ($7.08)Intergovernmental to Local - Other - General - Other: $442,000 ($26.31)
Total Salaries and Wages: $1,527,000 ($90.90)
Water Utilities - Interest on Debt: $447,000 ($26.61)
Groves government finances - Revenue in 2017 (per resident):
Charges - Sewerage: $2,252,000 ($134.06)
Solid Waste Management: $1,316,000 ($78.34)Other: $475,000 ($28.28)Miscellaneous - Fines and Forfeits: $193,000 ($11.49)
General Revenue - Other: $25,000 ($1.49)Sale of Property: $11,000 ($0.65)Donations From Private Sources: $2,000 ($0.12)Interest Earnings: $1,000 ($0.06)Revenue - Water Utilities: $1,636,000 ($97.39)
State Intergovernmental - Other: $272,000 ($16.19)
General Local Government Support: $3,000 ($0.18)Tax - Property: $4,817,000 ($286.76)
General Sales and Gross Receipts: $1,039,000 ($61.85)Public Utilities Sales: $916,000 ($54.53)Occupation and Business License - Other: $11,000 ($0.65)
Groves government finances - Debt in 2017 (per resident):
Long Term Debt - Beginning Outstanding - Unspecified Public Purpose: $11,165,000 ($664.66)
Outstanding Unspecified Public Purpose: $9,725,000 ($578.94)Retired Unspecified Public Purpose: $1,440,000 ($85.72)
Groves government finances - Cash and Securities in 2017 (per resident):
Other Funds - Cash and Securities: $916,000 ($54.53)
Businesses in Groves, TX
Name Count Name Count
Dairy Queen 1 Taco Bell 1 Domino's Pizza 1 U-Haul 2 Firestone Complete Auto Care 1 UPS 1 McDonald's 1 Walgreens 1 Popeyes 1 Wendy's 1 Subway 1
Strongest AM radio stations in Groves:
KDEI (1250 AM; 5 kW; PORT ARTHUR, TX; Owner: RADIO MARIA, INC.)
KLVI (560 AM; 5 kW; BEAUMONT, TX; Owner: CAPSTAR TX LIMITED PARTNERSHIP)
KOLE (1340 AM; 1 kW; PORT ARTHUR, TX; Owner: CITYGATE MEDIA, INC.)
KQHN (1510 AM; daytime; 5 kW; NEDERLAND, TX; Owner: CUMULUS LICENSING CORP.)
KTRH (740 AM; 50 kW; HOUSTON, TX; Owner: AMFM TEXAS LICENSES LIMITED PARTNERSHIP)
KGOL (1180 AM; 50 kW; HUMBLE, TX; Owner: ENTRAVISION HOLDINGS, LLC)
KUHD (1150 AM; 0 kW; PORT NECHES, TX; Owner: VISION LATINABROADCASTING, INC.)
KIKR (1450 AM; 1 kW; BEAUMONT, TX; Owner: CUMULUS LICENSING CORP.)
KRCM (1380 AM; 1 kW; BEAUMONT, TX; Owner: VOICE BROADCASTING, INC.)
KILE (1560 AM; 50 kW; BELLAIRE, TX; Owner: THE RAFTT CORPORATION)
KZZB (990 AM; 1 kW; BEAUMONT, TX; Owner: MARTIN BROADCASTING, INC.)
KOGT (1600 AM; 1 kW; ORANGE, TX; Owner: G-CAP COMMUNICATIONS, INC.)
KSEV (700 AM; 15 kW; TOMBALL, TX; Owner: LIBERMAN BROADCASTING OF HOUSTON LICENSE CORP.)
Strongest FM radio stations in Groves:
KRWP (97.5 FM; BEAUMONT, TX; Owner: CUMULUS LICENSING CORP.)
KYKR (95.1 FM; BEAUMONT, TX; Owner: CAPSTAR TX LIMITED PARTNERSHIP)
KCOL-FM (92.5 FM; GROVES, TX; Owner: VOICE IN THE WILDERNESS BROADCASTING, INC.)
KIOC (106.1 FM; ORANGE, TX; Owner: CAPSTAR TX LIMITED PARTNERSHIP)
KQXY-FM (94.1 FM; BEAUMONT, TX; Owner: CUMULUS LICENSING CORP.)
KKMY (104.5 FM; ORANGE, TX; Owner: CAPSTAR TX LIMITED PARTNERSHIP)
KOBT (100.7 FM; WINNIE, TX; Owner: TICHENOR LICENSE CORPORATION ("TLC"))
KQBU-FM (93.3 FM; PORT ARTHUR, TX; Owner: TICHENOR LICENSE CORPORATION ("TLC"))
KQQK (107.9 FM; BEAUMONT, TX; Owner: LIBERMAN BROADCASTING OF HOUSTON LICENSE CORP.)
KTJM (98.5 FM; PORT ARTHUR, TX; Owner: LIBERMAN BROADCASTING OF HOUSTON LICENSE CORP.)
KTXB (89.7 FM; BEAUMONT, TX; Owner: FAMILY STATIONS, INC.)
KVLU (91.3 FM; BEAUMONT, TX; Owner: LAMAR UNIVERSITY)
KTCX (102.5 FM; BEAUMONT, TX; Owner: CUMULUS LICENSING CORP.)
KYKZ (96.1 FM; LAKE CHARLES, LA; Owner: CUMULUS LICENSING CORP.)
KBIU (103.7 FM; LAKE CHARLES, LA; Owner: CUMULUS LICENSING CORP.)
K277AG (103.3 FM; BEAUMONT, TX; Owner: CAPSTAR TX LIMITED PARTNERSHIP)
KZWA (104.9 FM; MOSS BLUFF, LA; Owner: B & C BROADCASTING, LTD.)
TV broadcast stations around Groves:
K09VO (Channel 9; BEAUMONT, TX; Owner: BEAUMONT BROADCASTING CORPORATION)
KBTV-TV (Channel 4; PORT ARTHUR, TX; Owner: NEXSTAR BROADCASTING OF BEAUMONT/PORT ARTHUR, L.L.C.)
KFDM-TV (Channel 6; BEAUMONT, TX; Owner: FREEDOM BROADCASTING OF TEXAS, INC.)
KITU (Channel 34; BEAUMONT, TX; Owner: COMMUNITY EDUCATIONAL TELEVISION INC)
KBMT (Channel 12; BEAUMONT, TX; Owner: CHANNEL 12 OF BEAUMONT, INC.)
KJDF-LP (Channel 46; BEAUMONT, TX; Owner: ARACELIS ORTIZ, EXECUTRIX OF THE ESTATE OF CARLOS ORTIZ)
KUIL-LP (Channel 64; BEAUMONT, TX; Owner: BLUE BONNET COMMUNICATIONS, INC.)
KVHP (Channel 29; LAKE CHARLES, LA; Owner: NATIONAL COMMUNICATIONS, INC.)
KEBQ-LP (Channel 22; BEAUMONT-ORANGE, TX; Owner: WELLSPRINGS BEAUMONT TELEVISION, INC.)
National Bridge Inventory (NBI) Statistics 23 Number of bridges249ft / 76.3m Total length $224,000 Total costs201,632 Total average daily traffic11,283 Total average daily truck traffic
New bridges - historical statistics
17 1960-1969 3 1970-1979 3 2010-2019
See full National Bridge Inventory statistics for Groves, TX
FCC Registered Antenna Towers: 37 (
See the full list of FCC Registered Antenna Towers in Groves )
FCC Registered Broadcast Land Mobile Towers: 6
6150 Short St (Lat: 29.944944 Lon: -93.918222), Call Sign: KKS631, Assigned Frequencies: 154.250 MHz, 154.280 MHz, Grant Date: 05/26/2012, Expiration Date: 08/04/2022, Cancellation Date: 10/08/2022, Registrant: City Of Groves Fire Department, Groves, TX 77619, Phone: (409) 960-5761, Fax: (409) 960-5766, Email:
5500 39th St (Lat: 29.956889 Lon: -93.932667), Call Sign: KNDK538, Licensee ID: L00114426, Assigned Frequencies: 155.280 MHz, 155.340 MHz, 463.000 MHz, 463.025 MHz, 463.050 MHz, 463.075 MHz, 463.100 MHz, 463.125 MHz, 463.150 MHz, 463.175 MHz, Grant Date: 10/17/2002, Expiration Date: 08/17/2012, Cancellation Date: 10/20/2012, Registrant: Doctors Hospital Inc, 5500 39th St, Groves, TX 77619, Phone: (409) 962-5733 Lat: 29.965500 Lon: -93.925167, Call Sign: WPAX348, Assigned Frequencies: 461.287 MHz, 466.287 MHz, Grant Date: 08/23/2012, Expiration Date: 10/21/2022, Cancellation Date: 08/26/2022, Registrant: Blooston, Mordkofsky, Dickens, Duffy & Prendergast, LLP, 2120 L Street, N.W. Suite 300, Washington, DC 20037, Phone: (202) 828-5565, Fax: (202) 828-5568, Email:
Hwy 66 And Hogaboom Rd (Lat: 29.962500 Lon: -93.925000), Type: Tower, Structure height: 66 m, Call Sign: KKW303, Assigned Frequencies: 451.575 MHz, 451.575 MHz, Grant Date: 01/19/2023, Expiration Date: 02/22/2033, Registrant: Keller And Heckman LLP, 1001 G Street, N.W., Suite 500 W, Washington, DC 20001, Phone: (202) 434-4100, Fax: (202) 434-4646, Email:
415 M Se Of Fm 366 And 32nd St (Lat: 29.955694 Lon: -93.893806), Type: Gtower, Structure height: 43 m, Call Sign: WNXZ979, Assigned Frequencies: 854.087 MHz, 854.487 MHz, 854.837 MHz, 855.387 MHz, 856.187 MHz, 856.512 MHz, 856.837 MHz, 857.187 MHz, 858.837 MHz, 859.837 MHz, Grant Date: 09/28/2021, Expiration Date: 12/19/2031, Certifier: Roland J Mendoza, Registrant: Keller And Heckman LLP, 1001 G Street, Nw, Suite 500 West, Washington, DC 20001-4545, Phone: (202) 434-4100, Fax: (202) 434-4646, Email:
GROVES MIDDLE SCHOOL, Lat: 29.944528 Lon: -93.924556, Call Sign: WQWF450, Assigned Frequencies: 467.212 MHz, Grant Date: 08/06/2015, Expiration Date: 08/06/2025, Certifier: Dale Fontenot, Registrant: Innovation Wireless, 11869 Teale Street, Culver City, CA 90230, Phone: (888) 559-5565, Fax: (310) 482-3480, Email:
FCC Registered Microwave Towers: 8 (
See the full list of FCC Registered Microwave Towers in this town )
FCC Registered Maritime Coast & Aviation Ground Towers: 1 (
See the full list of FCC Registered Maritime Coast & Aviation Ground Towers )
FCC Registered Amateur Radio Licenses: 101 (
See the full list of FCC Registered Amateur Radio Licenses in Groves )
FAA Registered Aircraft: 6
Aircraft: CESSNA T182T (Category: Land, Seats: 4, Weight: Up to 12,499 Pounds), Engine: LYCOMING TIO-540-AK1A (235 HP) (Reciprocating)N-Number: 1744L, N1744L, N-1744L, Serial Number: T18208815, Year manufactured: 2008, Airworthiness Date: 02/07/2008, Certificate Issue Date: 12/18/2017Registrant (Individual): James W Moore, 4500 Main Ave, Groves, TX 77619Aircraft: BEECH 95-B55 (T42A) (Category: Land, Engines: 2, Seats: 6, Weight: Up to 12,499 Pounds, Speed: 165 mph), Engine: CONT MOTOR I0-470 SERIES (260 HP) (Reciprocating)N-Number: 220V, N220V, N-220V, Serial Number: TC-1235, Year manufactured: 1969, Airworthiness Date: 03/28/1969, Certificate Issue Date: 02/27/2017Registrant (Individual): John D Startz, 5100 Sue Ave, Groves, TX 77619Aircraft: AERO COMMANDER 100 (Category: Land, Seats: 4, Weight: Up to 12,499 Pounds, Speed: 75 mph), Engine: LYCOMING 0-320 SERIES (180 HP) (Reciprocating)N-Number: 2944T, N2944T, N-2944T, Serial Number: 060, Year manufactured: 1967, Airworthiness Date: 03/10/1967, Certificate Issue Date: 01/28/2020Registrant (Individual): Felix E Kneuper, 6961 Terrell St, Groves, TX 77619Aircraft: BEECH 35 (Category: Land, Seats: 4, Weight: Up to 12,499 Pounds, Speed: 120 mph), Engine: CONT MOTOR E185 SERIES (205 HP) (Reciprocating)N-Number: 3088V, N3088V, N-3088V, Serial Number: D-504, Year manufactured: 1947, Airworthiness Date: 01/27/1956, Certificate Issue Date: 06/12/2006Registrant (Individual): John D Startz, 5100 Sue Ave, Groves, TX 77619Aircraft: CESSNA 172F (Category: Land, Seats: 4, Weight: Up to 12,499 Pounds, Speed: 105 mph), Engine: CONT MOTOR 0-300 SER (145 HP) (Reciprocating)N-Number: 8143U, N8143U, N-8143U, Serial Number: 17252043, Year manufactured: 1964, Airworthiness Date: 09/29/1964, Certificate Issue Date: 05/22/2018Registrant (Individual): David Joel Smith, 6421 Verde St, Groves, TX 77619Aircraft: CESSNA 175 (Category: Land, Seats: 4, Weight: Up to 12,499 Pounds, Speed: 105 mph), Engine: CONT MOTOR GO-300 SERIES (175 HP) (Reciprocating)N-Number: 9407B, N9407B, N-9407B, Serial Number: 55207, Year manufactured: 1958, Airworthiness Date: 04/12/1958, Certificate Issue Date: 06/04/1997Registrant (Individual): Kerry P Lagleur, 6699 Jefferson St, Groves, TX 77619Deregistered: Cancel Date: 05/15/2017
Home Mortgage Disclosure Act Aggregated Statistics For Year 2009(Based on 2 full and 2 partial tracts) A) FHA, FSA/RHS & VA B) Conventional C) Refinancings D) Home Improvement Loans F) Non-occupant Loans on Number Average Value Number Average Value Number Average Value Number Average Value Number Average Value
LOANS ORIGINATED 82 $100,336 47 $86,391 118 $87,431 35 $42,899 10 $66,587 APPLICATIONS APPROVED, NOT ACCEPTED 5 $119,016 3 $192,627 6 $105,163 5 $28,750 1 $442,310 APPLICATIONS DENIED 15 $112,027 12 $84,021 38 $88,292 32 $48,142 7 $56,171 APPLICATIONS WITHDRAWN 3 $131,193 5 $98,280 22 $86,034 4 $43,912 0 $0 FILES CLOSED FOR INCOMPLETENESS 3 $87,973 3 $133,520 8 $70,986 1 $9,830 1 $89,450
Aggregated Statistics For Year 2008(Based on 2 full and 2 partial tracts) A) FHA, FSA/RHS & VA B) Conventional C) Refinancings D) Home Improvement Loans F) Non-occupant Loans on G) Loans On Manufactured Number Average Value Number Average Value Number Average Value Number Average Value Number Average Value Number Average Value
LOANS ORIGINATED 80 $102,286 96 $97,881 91 $76,346 33 $36,494 28 $74,844 1 $77,560 APPLICATIONS APPROVED, NOT ACCEPTED 5 $121,156 14 $84,793 14 $62,558 8 $39,111 5 $63,158 2 $64,495 APPLICATIONS DENIED 15 $106,230 29 $69,399 69 $74,096 45 $35,196 10 $57,574 7 $31,649 APPLICATIONS WITHDRAWN 8 $102,080 10 $88,327 21 $93,288 4 $53,928 2 $77,605 0 $0 FILES CLOSED FOR INCOMPLETENESS 2 $105,425 1 $34,480 5 $61,194 1 $14,920 1 $70,770 0 $0
Aggregated Statistics For Year 2007(Based on 2 full and 2 partial tracts) A) FHA, FSA/RHS & VA B) Conventional C) Refinancings D) Home Improvement Loans E) Loans on Dwellings For 5+ Families F) Non-occupant Loans on G) Loans On Manufactured Number Average Value Number Average Value Number Average Value Number Average Value Number Average Value Number Average Value Number Average Value
LOANS ORIGINATED 25 $76,973 183 $83,723 112 $74,001 57 $54,236 1 $1,869,470 47 $85,573 4 $48,868 APPLICATIONS APPROVED, NOT ACCEPTED 2 $65,695 26 $66,485 16 $70,852 11 $27,408 0 $0 7 $37,040 7 $43,954 APPLICATIONS DENIED 8 $78,286 29 $86,654 88 $77,295 53 $35,479 1 $270,300 13 $72,410 2 $68,735 APPLICATIONS WITHDRAWN 5 $67,096 14 $92,783 51 $92,998 4 $43,370 0 $0 5 $115,560 1 $62,910 FILES CLOSED FOR INCOMPLETENESS 1 $70,780 10 $77,812 7 $77,333 1 $9,940 0 $0 2 $50,620 0 $0
Aggregated Statistics For Year 2006(Based on 2 full and 2 partial tracts) A) FHA, FSA/RHS & VA B) Conventional C) Refinancings D) Home Improvement Loans E) Loans on Dwellings For 5+ Families F) Non-occupant Loans on G) Loans On Manufactured Number Average Value Number Average Value Number Average Value Number Average Value Number Average Value Number Average Value Number Average Value
LOANS ORIGINATED 34 $78,406 243 $70,630 109 $67,814 35 $39,084 3 $684,810 52 $59,695 1 $17,690 APPLICATIONS APPROVED, NOT ACCEPTED 2 $89,165 37 $74,703 31 $51,189 6 $24,418 1 $2,155,310 14 $47,254 2 $78,630 APPLICATIONS DENIED 3 $68,597 75 $64,010 93 $71,345 32 $35,778 0 $0 12 $41,147 5 $61,124 APPLICATIONS WITHDRAWN 2 $74,065 30 $81,874 61 $86,106 4 $58,488 0 $0 3 $51,290 0 $0 FILES CLOSED FOR INCOMPLETENESS 1 $44,470 5 $61,578 9 $73,477 1 $63,890 0 $0 2 $39,120 0 $0
Aggregated Statistics For Year 2005(Based on 2 full and 2 partial tracts) A) FHA, FSA/RHS & VA B) Conventional C) Refinancings D) Home Improvement Loans F) Non-occupant Loans on G) Loans On Manufactured Number Average Value Number Average Value Number Average Value Number Average Value Number Average Value Number Average Value
LOANS ORIGINATED 29 $70,067 178 $67,820 115 $69,862 26 $45,306 33 $66,525 0 $0 APPLICATIONS APPROVED, NOT ACCEPTED 1 $48,160 34 $61,699 24 $59,599 9 $27,597 10 $66,614 6 $47,862 APPLICATIONS DENIED 2 $76,740 53 $64,802 105 $61,911 60 $33,945 16 $49,884 6 $40,387 APPLICATIONS WITHDRAWN 3 $76,973 18 $68,823 87 $82,927 22 $150,881 1 $47,190 1 $46,200 FILES CLOSED FOR INCOMPLETENESS 2 $49,005 2 $69,940 12 $94,665 1 $37,660 1 $63,520 0 $0
Aggregated Statistics For Year 2004(Based on 2 full and 2 partial tracts) A) FHA, FSA/RHS & VA B) Conventional C) Refinancings D) Home Improvement Loans E) Loans on Dwellings For 5+ Families F) Non-occupant Loans on G) Loans On Manufactured Number Average Value Number Average Value Number Average Value Number Average Value Number Average Value Number Average Value Number Average Value
LOANS ORIGINATED 46 $73,620 166 $67,350 175 $56,586 43 $35,115 5 $962,152 26 $47,159 1 $23,590 APPLICATIONS APPROVED, NOT ACCEPTED 1 $57,170 18 $54,513 28 $54,211 7 $65,723 0 $0 3 $60,427 2 $37,015 APPLICATIONS DENIED 6 $75,740 30 $57,671 133 $65,539 51 $24,125 0 $0 3 $106,583 5 $41,164 APPLICATIONS WITHDRAWN 5 $58,336 20 $59,532 75 $63,892 5 $42,970 0 $0 1 $25,410 0 $0 FILES CLOSED FOR INCOMPLETENESS 1 $117,340 2 $85,935 16 $72,427 2 $19,390 0 $0 1 $54,450 0 $0
Aggregated Statistics For Year 2003(Based on 2 full and 2 partial tracts) A) FHA, FSA/RHS & VA B) Conventional C) Refinancings D) Home Improvement Loans E) Loans on Dwellings For 5+ Families F) Non-occupant Loans on Number Average Value Number Average Value Number Average Value Number Average Value Number Average Value Number Average Value
LOANS ORIGINATED 40 $65,298 135 $60,571 266 $68,164 25 $26,544 1 $244,740 38 $55,229 APPLICATIONS APPROVED, NOT ACCEPTED 4 $92,148 12 $49,077 30 $62,023 5 $21,262 0 $0 3 $26,063 APPLICATIONS DENIED 5 $79,210 53 $46,086 185 $64,867 30 $23,328 1 $589,740 18 $51,876 APPLICATIONS WITHDRAWN 4 $54,898 10 $71,041 74 $69,252 2 $26,415 0 $0 2 $94,360 FILES CLOSED FOR INCOMPLETENESS 0 $0 9 $73,702 8 $61,980 0 $0 0 $0 0 $0
Aggregated Statistics For Year 2002(Based on 2 full and 2 partial tracts) A) FHA, FSA/RHS & VA B) Conventional C) Refinancings D) Home Improvement Loans E) Loans on Dwellings For 5+ Families F) Non-occupant Loans on Number Average Value Number Average Value Number Average Value Number Average Value Number Average Value Number Average Value
LOANS ORIGINATED 57 $65,109 121 $61,044 144 $64,362 31 $31,087 1 $994,400 20 $42,184 APPLICATIONS APPROVED, NOT ACCEPTED 4 $45,458 17 $66,786 28 $60,906 2 $44,005 1 $715,970 2 $62,785 APPLICATIONS DENIED 5 $71,098 34 $52,112 71 $55,471 18 $20,544 1 $1,970 7 $37,160 APPLICATIONS WITHDRAWN 7 $77,773 23 $54,822 47 $59,033 0 $0 0 $0 3 $38,580 FILES CLOSED FOR INCOMPLETENESS 1 $52,090 8 $53,022 18 $59,432 0 $0 0 $0 0 $0
Aggregated Statistics For Year 2001(Based on 2 full and 2 partial tracts) A) FHA, FSA/RHS & VA B) Conventional C) Refinancings D) Home Improvement Loans E) Loans on Dwellings For 5+ Families F) Non-occupant Loans on Number Average Value Number Average Value Number Average Value Number Average Value Number Average Value Number Average Value
LOANS ORIGINATED 72 $69,981 98 $63,349 109 $59,294 23 $23,304 2 $139,175 12 $44,143 APPLICATIONS APPROVED, NOT ACCEPTED 2 $53,075 20 $52,143 11 $59,480 4 $7,758 0 $0 3 $37,480 APPLICATIONS DENIED 2 $58,265 37 $44,288 48 $53,205 12 $14,112 0 $0 4 $50,488 APPLICATIONS WITHDRAWN 6 $60,643 11 $47,646 42 $50,718 1 $63,090 0 $0 2 $56,115 FILES CLOSED FOR INCOMPLETENESS 0 $0 7 $43,451 13 $39,225 0 $0 0 $0 0 $0
Aggregated Statistics For Year 2000(Based on 2 full and 2 partial tracts) A) FHA, FSA/RHS & VA B) Conventional C) Refinancings D) Home Improvement Loans E) Loans on Dwellings For 5+ Families F) Non-occupant Loans on Number Average Value Number Average Value Number Average Value Number Average Value Number Average Value Number Average Value
LOANS ORIGINATED 34 $57,914 134 $62,834 57 $57,412 28 $21,077 1 $318,210 14 $65,936 APPLICATIONS APPROVED, NOT ACCEPTED 3 $63,473 17 $49,679 24 $34,701 5 $19,306 0 $0 2 $45,260 APPLICATIONS DENIED 5 $49,360 39 $49,319 36 $48,711 16 $21,941 0 $0 1 $66,620 APPLICATIONS WITHDRAWN 3 $41,820 21 $60,992 30 $42,020 2 $19,530 0 $0 1 $24,500 FILES CLOSED FOR INCOMPLETENESS 4 $57,785 4 $33,442 3 $31,187 0 $0 0 $0 2 $34,985
Aggregated Statistics For Year 1999(Based on 3 full and 1 partial tracts) A) FHA, FSA/RHS & VA B) Conventional C) Refinancings D) Home Improvement Loans E) Loans on Dwellings For 5+ Families F) Non-occupant Loans on Number Average Value Number Average Value Number Average Value Number Average Value Number Average Value Number Average Value
LOANS ORIGINATED 50 $56,405 138 $57,847 74 $59,774 40 $20,972 0 $0 19 $64,311 APPLICATIONS APPROVED, NOT ACCEPTED 0 $0 11 $53,589 21 $48,399 2 $14,835 0 $0 2 $72,550 APPLICATIONS DENIED 1 $57,070 46 $63,205 22 $43,038 24 $18,135 0 $0 8 $38,306 APPLICATIONS WITHDRAWN 5 $59,990 22 $53,196 30 $40,658 2 $29,245 2 $57,070 3 $36,770 FILES CLOSED FOR INCOMPLETENESS 2 $68,915 6 $54,035 7 $60,236 1 $39,390 0 $0 2 $62,645
Detailed HMDA statistics for the following Tracts:
0104.00
, 0105.00 , 0106.00 , 0107.00
Private Mortgage Insurance Companies Aggregated Statistics For Year 2009(Based on 2 full and 2 partial tracts) A) Conventional B) Refinancings Number Average Value Number Average Value
LOANS ORIGINATED 17 $119,259 2 $101,175 APPLICATIONS APPROVED, NOT ACCEPTED 6 $171,262 1 $129,770 APPLICATIONS DENIED 2 $81,920 0 $0 APPLICATIONS WITHDRAWN 0 $0 2 $163,370 FILES CLOSED FOR INCOMPLETENESS 0 $0 0 $0
Aggregated Statistics For Year 2008(Based on 2 full and 2 partial tracts) A) Conventional B) Refinancings C) Non-occupant Loans on Number Average Value Number Average Value Number Average Value
LOANS ORIGINATED 45 $98,914 4 $161,590 7 $59,524 APPLICATIONS APPROVED, NOT ACCEPTED 8 $94,619 0 $0 0 $0 APPLICATIONS DENIED 6 $93,228 0 $0 0 $0 APPLICATIONS WITHDRAWN 6 $80,595 0 $0 1 $81,580 FILES CLOSED FOR INCOMPLETENESS 2 $73,645 0 $0 0 $0
Aggregated Statistics For Year 2007(Based on 2 full and 2 partial tracts) A) Conventional B) Refinancings C) Non-occupant Loans on Number Average Value Number Average Value Number Average Value
LOANS ORIGINATED 124 $90,785 7 $92,159 11 $52,368 APPLICATIONS APPROVED, NOT ACCEPTED 13 $87,801 1 $106,150 0 $0 APPLICATIONS DENIED 1 $57,170 0 $0 0 $0 APPLICATIONS WITHDRAWN 2 $91,545 0 $0 0 $0 FILES CLOSED FOR INCOMPLETENESS 1 $75,570 0 $0 0 $0
Aggregated Statistics For Year 2006(Based on 2 full and 2 partial tracts) A) Conventional B) Refinancings C) Non-occupant Loans on Number Average Value Number Average Value Number Average Value
LOANS ORIGINATED 96 $79,259 5 $79,396 9 $36,194 APPLICATIONS APPROVED, NOT ACCEPTED 10 $67,659 2 $85,510 0 $0 APPLICATIONS DENIED 1 $77,140 0 $0 0 $0 APPLICATIONS WITHDRAWN 3 $76,543 1 $42,260 1 $42,260 FILES CLOSED FOR INCOMPLETENESS 0 $0 0 $0 0 $0
Aggregated Statistics For Year 2005(Based on 2 full and 2 partial tracts) A) Conventional B) Refinancings C) Non-occupant Loans on Number Average Value Number Average Value Number Average Value
LOANS ORIGINATED 63 $83,382 8 $97,154 7 $115,294 APPLICATIONS APPROVED, NOT ACCEPTED 7 $81,586 3 $66,333 1 $64,030 APPLICATIONS DENIED 0 $0 0 $0 0 $0 APPLICATIONS WITHDRAWN 1 $84,530 1 $82,560 0 $0 FILES CLOSED FOR INCOMPLETENESS 0 $0 0 $0 0 $0
Aggregated Statistics For Year 2004(Based on 2 full and 2 partial tracts) A) Conventional B) Refinancings C) Non-occupant Loans on Number Average Value Number Average Value Number Average Value
LOANS ORIGINATED 61 $77,600 7 $62,531 2 $51,720 APPLICATIONS APPROVED, NOT ACCEPTED 9 $63,429 3 $64,220 2 $50,620 APPLICATIONS DENIED 1 $214,790 0 $0 0 $0 APPLICATIONS WITHDRAWN 0 $0 0 $0 0 $0 FILES CLOSED FOR INCOMPLETENESS 0 $0 0 $0 0 $0
Aggregated Statistics For Year 2003(Based on 2 full and 2 partial tracts) A) Conventional B) Refinancings C) Non-occupant Loans on Number Average Value Number Average Value Number Average Value
LOANS ORIGINATED 57 $65,607 25 $106,668 4 $29,978 APPLICATIONS APPROVED, NOT ACCEPTED 8 $78,359 5 $86,866 0 $0 APPLICATIONS DENIED 2 $53,730 1 $82,560 0 $0 APPLICATIONS WITHDRAWN 2 $79,780 0 $0 0 $0 FILES CLOSED FOR INCOMPLETENESS 0 $0 0 $0 0 $0
Aggregated Statistics For Year 2002(Based on 2 full and 2 partial tracts) A) Conventional B) Refinancings C) Non-occupant Loans on Number Average Value Number Average Value Number Average Value
LOANS ORIGINATED 54 $72,549 15 $95,716 3 $69,270 APPLICATIONS APPROVED, NOT ACCEPTED 7 $90,973 6 $103,153 1 $83,490 APPLICATIONS DENIED 0 $0 0 $0 0 $0 APPLICATIONS WITHDRAWN 4 $51,202 2 $82,245 1 $57,010 FILES CLOSED FOR INCOMPLETENESS 0 $0 0 $0 0 $0
Aggregated Statistics For Year 2001(Based on 2 full and 2 partial tracts) A) Conventional B) Refinancings C) Non-occupant Loans on Number Average Value Number Average Value Number Average Value
LOANS ORIGINATED 43 $77,051 9 $105,679 1 $68,800 APPLICATIONS APPROVED, NOT ACCEPTED 6 $105,427 3 $78,750 2 $55,810 APPLICATIONS DENIED 0 $0 0 $0 0 $0 APPLICATIONS WITHDRAWN 1 $102,630 0 $0 0 $0 FILES CLOSED FOR INCOMPLETENESS 0 $0 1 $66,840 0 $0
Aggregated Statistics For Year 2000(Based on 2 full and 2 partial tracts) A) Conventional B) Refinancings C) Non-occupant Loans on Number Average Value Number Average Value Number Average Value
LOANS ORIGINATED 82 $66,187 7 $140,491 1 $47,190 APPLICATIONS APPROVED, NOT ACCEPTED 5 $44,400 2 $88,735 0 $0 APPLICATIONS DENIED 1 $66,250 1 $42,650 0 $0 APPLICATIONS WITHDRAWN 0 $0 0 $0 0 $0 FILES CLOSED FOR INCOMPLETENESS 2 $74,625 0 $0 0 $0
Aggregated Statistics For Year 1999(Based on 3 full and 1 partial tracts) A) Conventional B) Refinancings C) Non-occupant Loans on Number Average Value Number Average Value Number Average Value
LOANS ORIGINATED 62 $61,526 14 $89,444 5 $34,696 APPLICATIONS APPROVED, NOT ACCEPTED 5 $74,024 4 $60,798 0 $0 APPLICATIONS DENIED 6 $49,618 0 $0 0 $0 APPLICATIONS WITHDRAWN 1 $47,480 1 $91,890 1 $47,480 FILES CLOSED FOR INCOMPLETENESS 2 $111,330 0 $0 0 $0
Detailed PMIC statistics for the following Tracts:
0104.00
, 0105.00 , 0106.00 , 0107.00 Fire-safe hotels and motels in Groves, Texas:
Americas Best Value Inn, 5201 E Parkway St, Groves, Texas 77619 Phone: (409) 962-6611, Fax: (409) 962-8439
Executive Inn Motel, 5131 E Parkway St, Groves, Texas 77619 Phone: (409) 962-5000, Fax: (409) 962-3714
Jonathon's Inn, 6259 Gulfway Dr, Groves, Texas 77619 Phone: (409) 962-5499, Fax: (409) 962-3714
All 3 fire-safe hotels and motels in Groves, Texas
Most common first names in Groves, TX among deceased individuals Name Count Lived (average)
Mary 120 78.7 years James 118 69.8 years John 117 72.9 years William 84 73.7 years Robert 81 70.6 years Charles 63 73.2 years Joseph 58 71.3 years George 41 75.3 years Henry 35 76.0 years Frank 33 76.2 years
Most common last names in Groves, TX among deceased individuals Last name Count Lived (average)
Smith 61 77.5 years Landry 38 78.6 years Hebert 36 75.3 years Brown 33 76.5 years Jones 31 71.5 years Broussard 31 74.4 years Morgan 30 71.7 years Johnson 28 75.8 years Williams 25 75.1 years Davis 24 73.3 years
Groves compared to Texas state average:
Median house value below state average. Unemployed percentage below state average. Median age above state average. Length of stay since moving in significantly above state average. House age above state average. Number of college students below state average. Percentage of population with a bachelor's degree or higher below state average.
#66 on the list of "Top 101 cities with the lowest percentage of workers working at home, population 5,000+"
#85 on the list of "Top 101 cities with the most residents born in Bangladesh (population 500+)"
#89 (77619) on the list of "Top 101 zip codes with the largest percentage of French first ancestries (pop 5,000+)"
#27 on the list of "Top 101 counties with the largest increase in the number of births per 1000 residents 2000-2006 to 2007-2013 (pop 50,000+)"
#41 on the list of "Top 101 counties with the most Black Protestant adherents"
#43 on the list of "Top 101 counties with the most Black Protestant congregations"
#49 on the list of "Top 101 counties with the highest number of infant deaths per 1000 residents 2007-2013 (pop. 50,000+)"
#76 on the list of "Top 101 counties with the lowest Nitrogen Dioxide air pollution readings in 2012 (ppm)"
Top Patent Applicants
Carmell Hergert (1)
Kurtice Smith (1)
Thomas Matthew Stevens (1)
Total of 3 patent applications in 2008-2024.
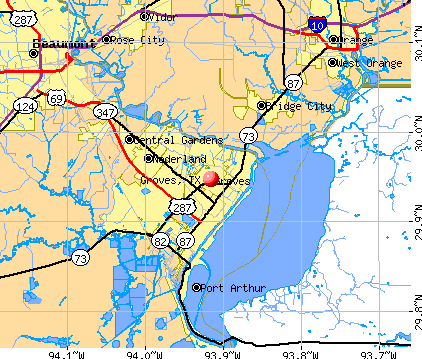


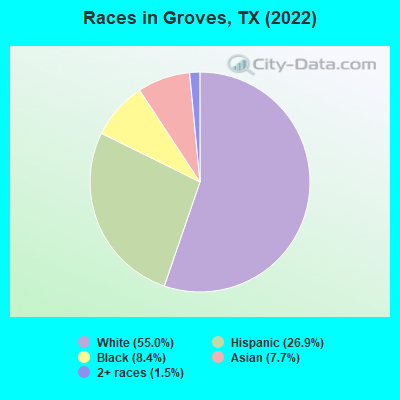
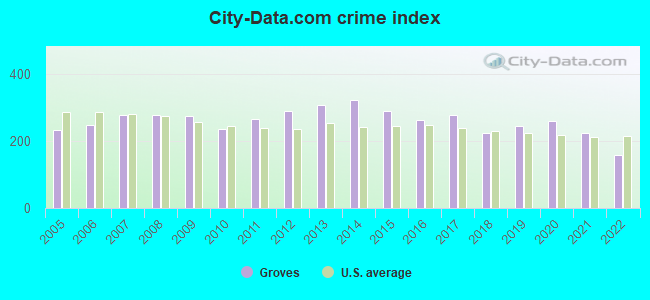
 Recent articles from our blog. Our writers, many of them Ph.D. graduates or candidates, create easy-to-read articles on a wide variety of topics.

 (2.5 miles
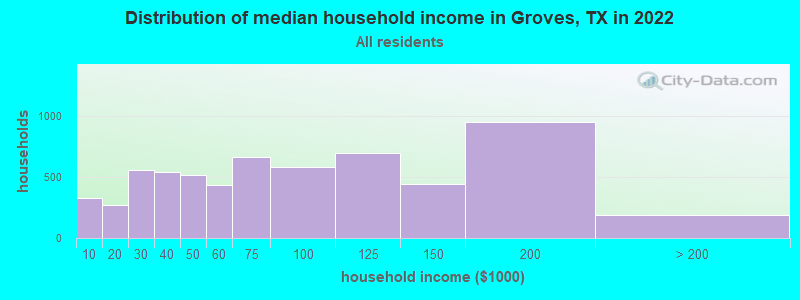
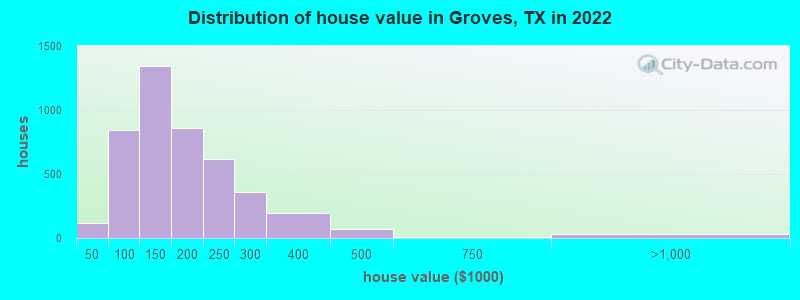

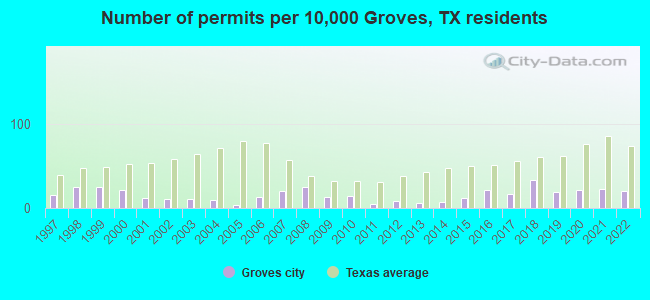
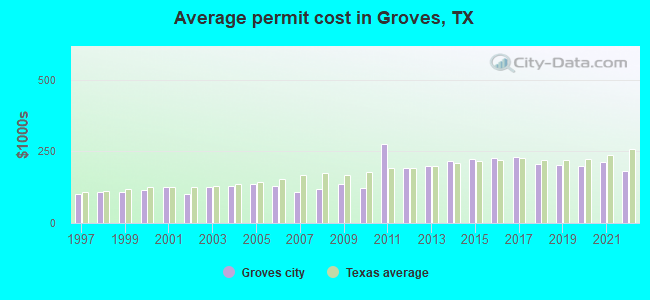
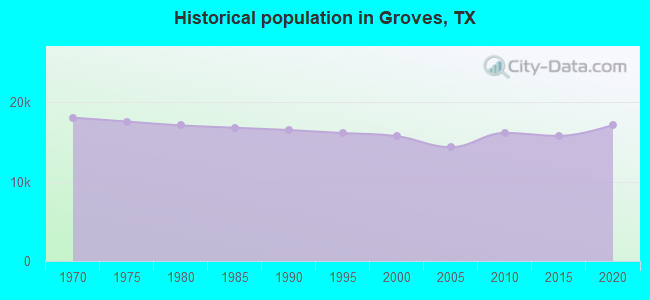
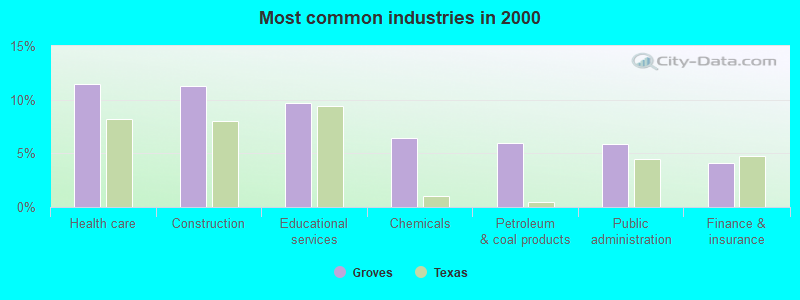
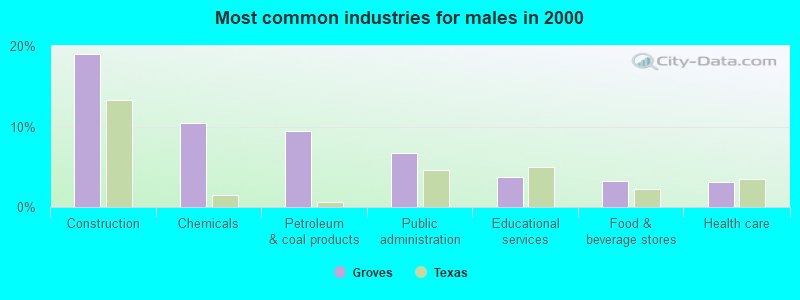
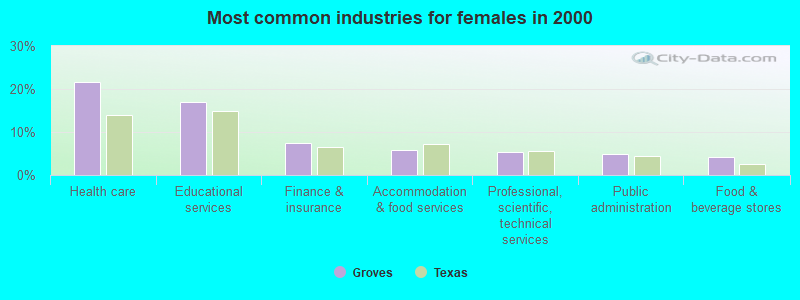
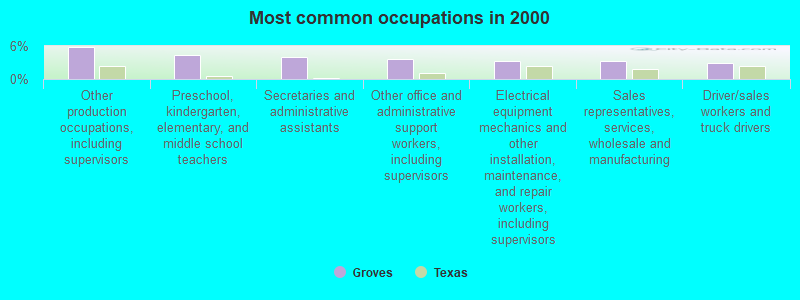
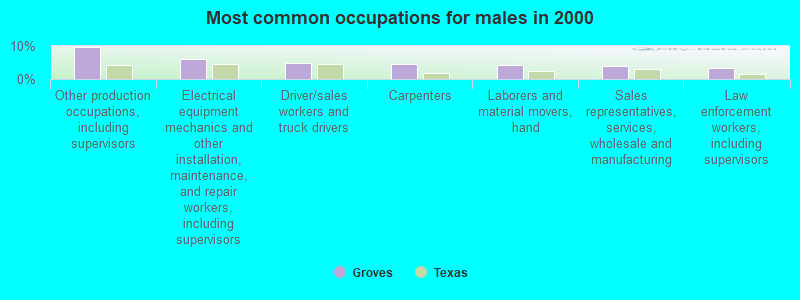
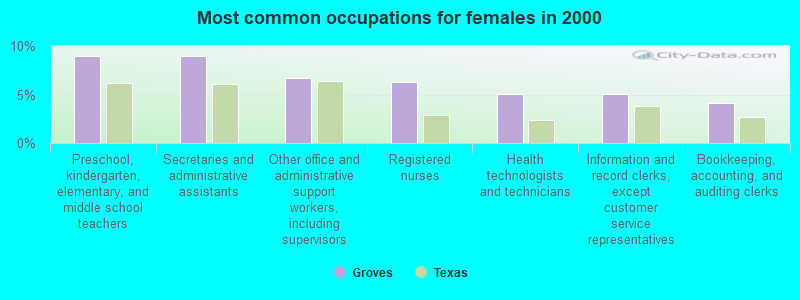
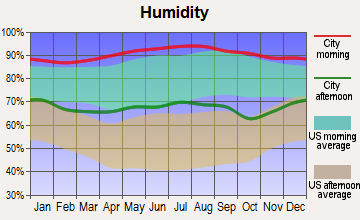
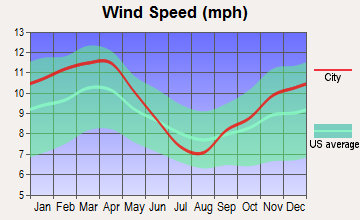
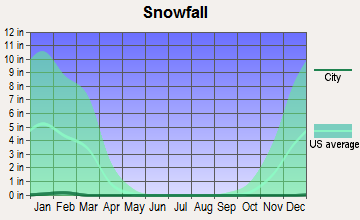
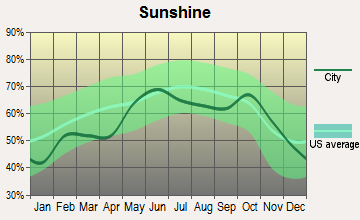
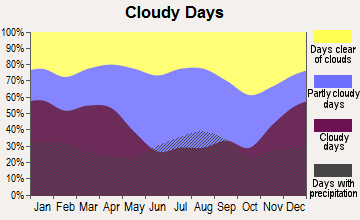


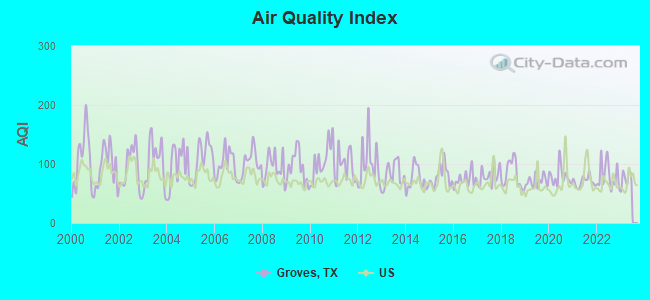
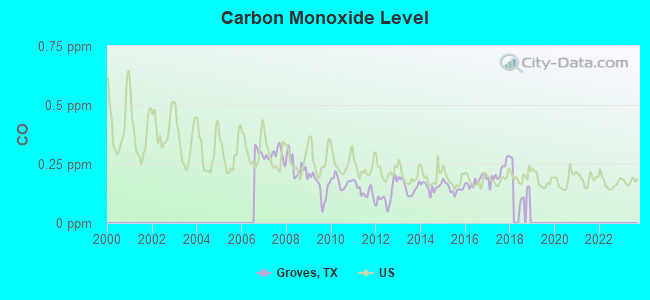
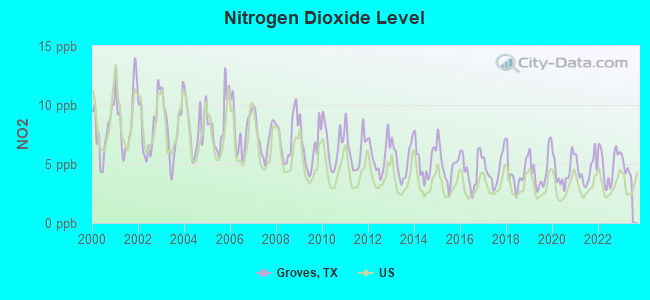
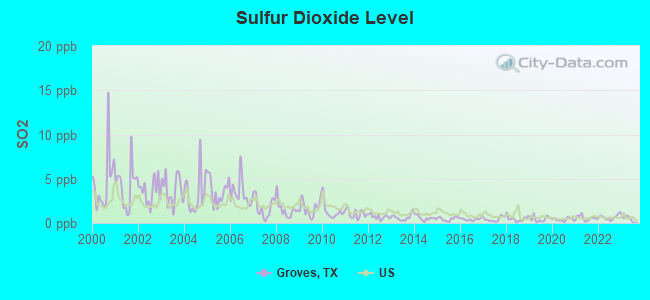
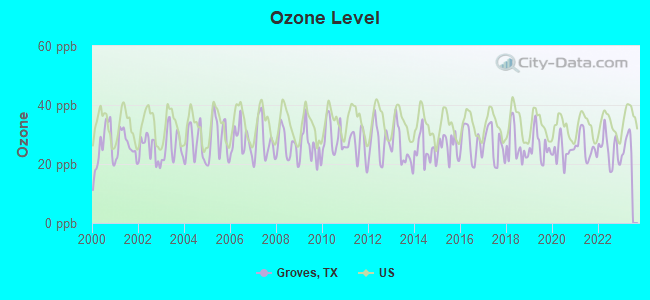
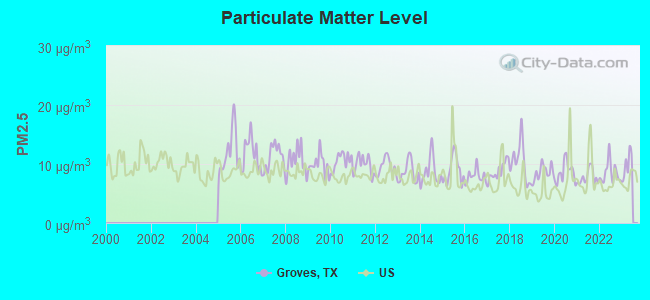

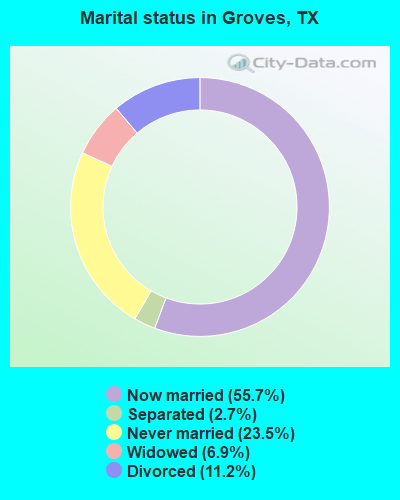
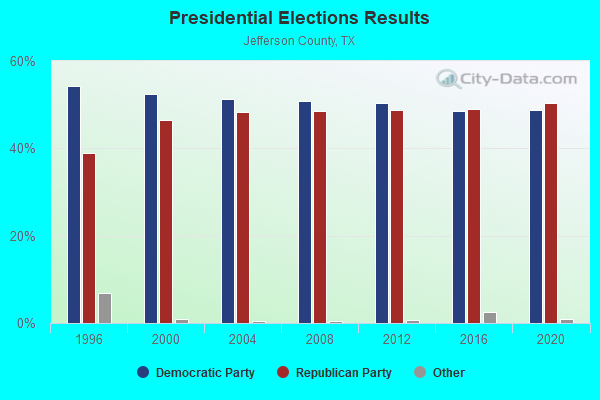
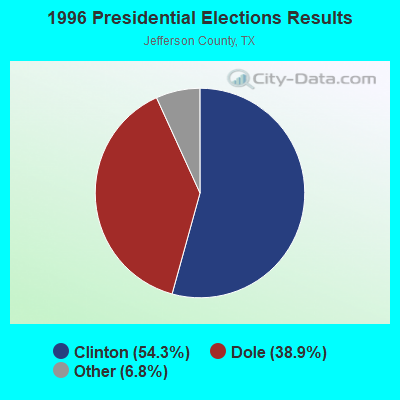
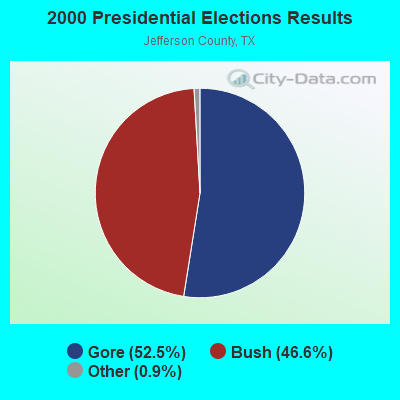
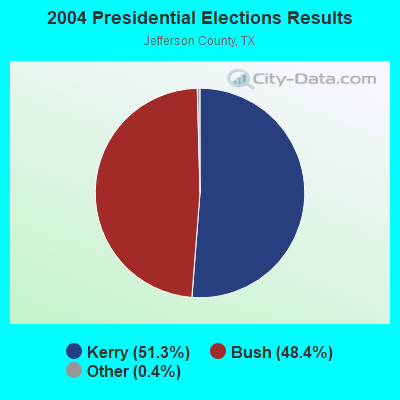
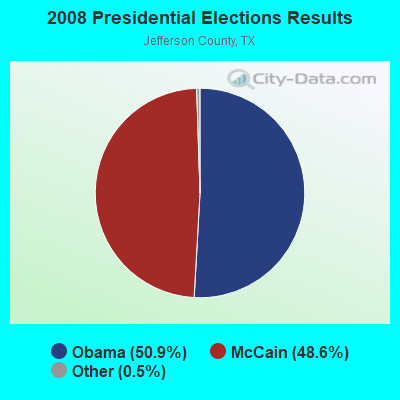
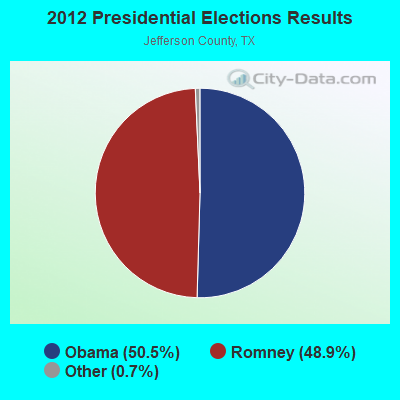
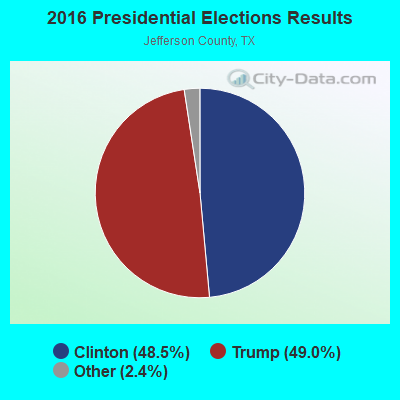
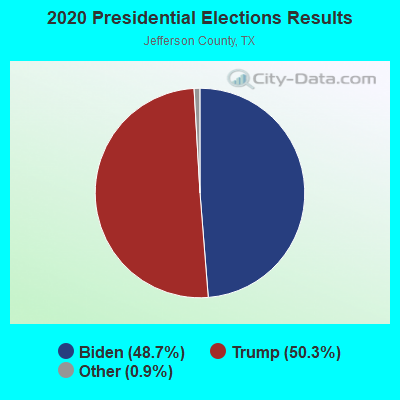
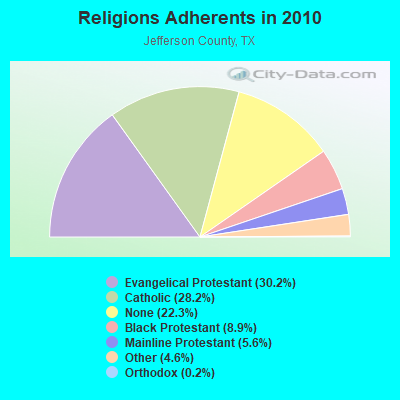
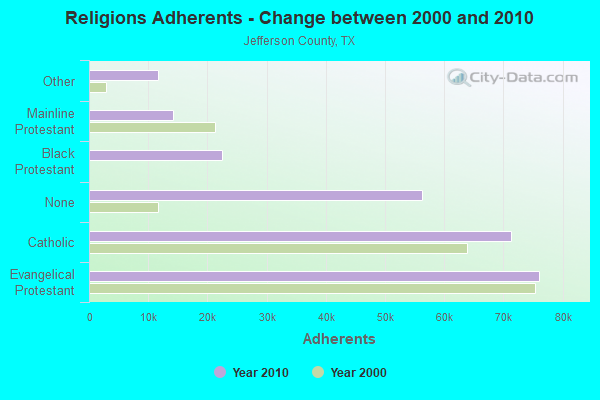
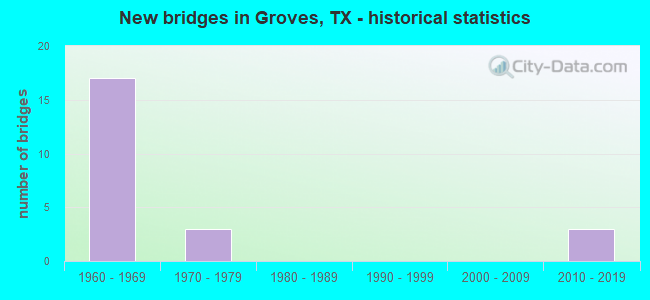
 Based on the data from the years 2004 - 2018 the average number of fire incidents per year is 102. The highest number of reported fire incidents - 132 took place in 2005, and the least - 79 in 2004. The data has a growing trend.
 When looking into fire subcategories, the most incidents belonged to: Structure Fires (47.2%), and Outside Fires (37.5%).