Estimated zip code population in 2022: 37,352 Zip code population in 2010: 46,781 Zip code population in 2000: 42,603
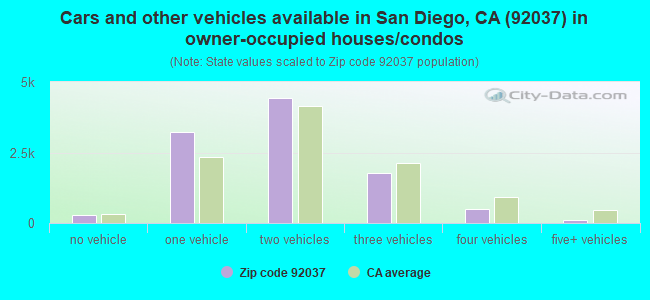
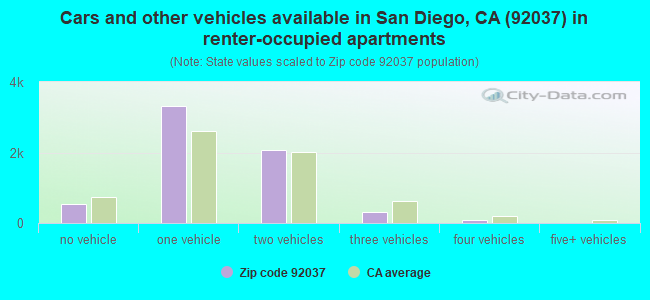
Houses and condos: 19,622 Renter-occupied apartments: 6,290
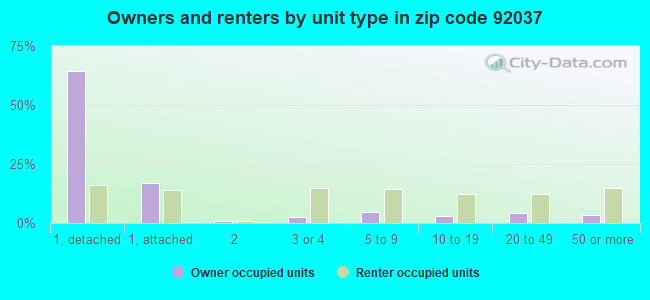
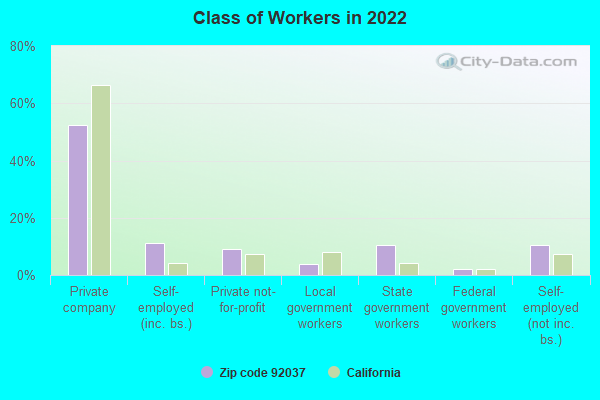
% of renters here:
38%
State:
44%
March 2022 cost of living index in zip code 92037: 131.6 (high, U.S. average is 100)
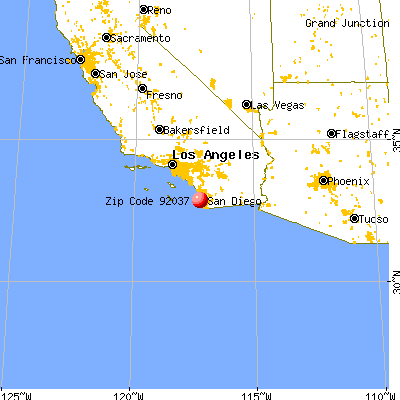
Land area: 13.1 sq. mi. Water area: 2.0 sq. mi.
Population density: 2,859 people per square mile
(average).
OSM Map
General Map
Google Map
MSN Map
OSM Map
General Map
Google Map
MSN Map
OSM Map
General Map
Google Map
MSN Map
OSM Map
General Map
Google Map
MSN Map
Please wait while loading the map...
Real estate property taxes paid for housing units in 2022:
This zip code:
0.5% ($10,292)
California:
0.7% ($4,831)
Median real estate property taxes paid for housing units with mortgages in 2022: $10,330 (0.5%) Median real estate property taxes paid for housing units with no mortgage in 2022: $10,572 (0.5%)
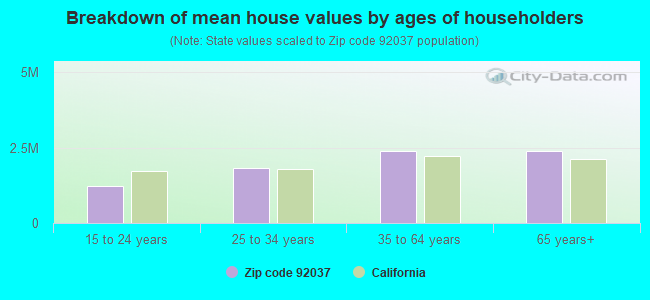
Estimated median house/condo value in 2022: $1,997,853
92037:
$1,997,853
California:
$715,900
According to our research of California and other state lists, there were 6 registered sex offenders living in 92037 zip code as of April 27, 2024. The ratio of all residents to sex offenders in zip code 92037 is 6,536 to 1. The ratio of registered sex offenders to all residents in this zip code is much lower than the state average.
Median resident age:
This zip code:
47.0 years
California median age:
37.9 years
Average household size:
This zip code:
2.2 people
California:
2.8 people
Averages for the 2020 tax year for zip code 92037, filed in 2021:
Average Adjusted Gross Income (AGI) in 2020: $279,540 (Individual Income Tax Returns)
Here:
$279,540
State:
$95,910
Salary/wage: $164,586 (reported on 67.9% of returns)
Here:
$164,586
State:
$77,331
(% of AGI for various income ranges: 1236.4% for AGIs below $25k, 4137.8% for AGIs $25k-50k, 7069.8% for AGIs $50k-75k, 10886.4% for AGIs $75k-100k, 18495.8% for AGIs $100k-200k, 156405.1% for AGIs over 200k)
Taxable interest for individuals: $10,322 (reported on 57.9% of returns)
This zip code:
$10,322
California:
$2,294
(% of AGI for various income ranges: 58.7% for AGIs below $25k, 135.9% for AGIs $25k-50k, 173.0% for AGIs $50k-75k, 400.0% for AGIs $75k-100k, 621.8% for AGIs $100k-200k, 9357.6% for AGIs over 200k)
Ordinary dividends: $37,753 (reported on 52.5% of returns)
Here:
$37,753
State:
$10,949
(% of AGI for various income ranges: 186.0% for AGIs below $25k, 322.0% for AGIs $25k-50k, 524.6% for AGIs $50k-75k, 1064.3% for AGIs $75k-100k, 2567.7% for AGIs $100k-200k, 30807.9% for AGIs over 200k)
Net capital gain/loss in AGI: +$125,901 (reported on 52.1% of returns)
Here:
+$125,901
State:
+$49,306
(% of AGI for various income ranges: 65.9% for AGIs below $25k, 241.2% for AGIs $25k-50k, 465.0% for AGIs $50k-75k, 803.8% for AGIs $75k-100k, 2397.3% for AGIs $100k-200k, 115868.3% for AGIs over 200k)
Profit/loss from business: +$43,197 (reported on 22.6% of returns)
Here:
+$43,197
State:
+$15,671
(% of AGI for various income ranges: 198.4% for AGIs below $25k, 443.0% for AGIs $25k-50k, 363.4% for AGIs $50k-75k, 641.8% for AGIs $75k-100k, 1385.4% for AGIs $100k-200k, 14145.8% for AGIs over 200k)
Taxable individual retirement arrangement distribution: $43,572 (reported on 13.7% of returns)
92037:
$43,572
California:
$23,505
(% of AGI for various income ranges: 77.2% for AGIs below $25k, 190.3% for AGIs $25k-50k, 357.2% for AGIs $50k-75k, 995.5% for AGIs $75k-100k, 1995.8% for AGIs $100k-200k, 6763.6% for AGIs over 200k)
Self-employed (Keogh) retirement plans: $39,573 (reported on 3.7% of returns)
92037:
$39,573
California:
$30,163
(% of AGI for various income ranges: 16.3% for AGIs below $25k, 20.1% for AGIs $50k-75k, 42.5% for AGIs $75k-100k, 129.6% for AGIs $100k-200k, 2436.2% for AGIs over 200k)
Total itemized deductions: $76,752 (reported on 30.5% of returns)
Here:
$76,752
State:
$39,517
(% of AGI for various income ranges: 306.4% for AGIs below $25k, 553.8% for AGIs $25k-50k, 1019.5% for AGIs $50k-75k, 1921.7% for AGIs $75k-100k, 3659.5% for AGIs $100k-200k, 34154.8% for AGIs over 200k)
Charity contributions: $40,775 (reported on 26.5% of returns)
Here:
$40,775
State:
$12,598
(% of AGI for various income ranges: 14.6% for AGIs below $25k, 45.6% for AGIs $25k-50k, 102.2% for AGIs $50k-75k, 225.0% for AGIs $75k-100k, 610.3% for AGIs $100k-200k, 18687.7% for AGIs over 200k)
Taxes paid: $9,200 (reported on 30.4% of returns)
92037:
$9,200
State:
$8,807
(% of AGI for various income ranges: 59.8% for AGIs below $25k, 99.0% for AGIs $25k-50k, 211.3% for AGIs $50k-75k, 453.6% for AGIs $75k-100k, 881.8% for AGIs $100k-200k, 3126.1% for AGIs over 200k)
Earned income credit: $1,124 (reported on 4.5% of returns)
Here:
$1,124
State:
$2,074
(% of AGI for various income ranges: 31.5% for AGIs below $25k, 18.7% for AGIs $25k-50k)
Percentage of individuals using paid preparers for their 2020 taxes: 93.0%
Here:
93%
State:
92%
(% for various income ranges: 91.1% for AGIs below $25k, 92.4% for AGIs $25k-50k, 92.9% for AGIs $50k-75k, 93.2% for AGIs $75k-100k, 93.8% for AGIs $100k-200k, 94.4% for AGIs over 200k)
Averages for the 2012 tax year for zip code 92037, filed in 2013:
Average Adjusted Gross Income (AGI) in 2012: $235,256 (Individual Income Tax Returns)
Here:
$235,256
State:
$72,726
Salary/wage: $147,813 (reported on 66.8% of returns)
Here:
$147,813
State:
$59,079
(% of AGI for various income ranges: 60.6% for AGIs below $25k, 65.0% for AGIs $25k-50k, 58.0% for AGIs $50k-75k, 58.8% for AGIs $75k-100k, 52.9% for AGIs $100k-200k, 38.1% for AGIs over 200k)
Taxable interest for individuals: $8,898 (reported on 60.4% of returns)
This zip code:
$8,898
California:
$2,146
(% of AGI for various income ranges: 3.6% for AGIs below $25k, 2.4% for AGIs $25k-50k, 2.4% for AGIs $50k-75k, 2.7% for AGIs $75k-100k, 2.3% for AGIs $100k-200k, 2.2% for AGIs over 200k)
Ordinary dividends: $36,332 (reported on 51.0% of returns)
Here:
$36,332
State:
$9,308
(% of AGI for various income ranges: 9.0% for AGIs below $25k, 5.8% for AGIs $25k-50k, 5.9% for AGIs $50k-75k, 6.0% for AGIs $75k-100k, 6.2% for AGIs $100k-200k, 8.3% for AGIs over 200k)
Net capital gain/loss in AGI: +$101,464 (reported on 49.0% of returns)
Here:
+$101,464
State:
+$30,460
(% of AGI for various income ranges: 3.0% for AGIs below $25k, 1.7% for AGIs $25k-50k, 2.1% for AGIs $50k-75k, 2.2% for AGIs $75k-100k, 3.2% for AGIs $100k-200k, 26.1% for AGIs over 200k)
Profit/loss from business: +$36,788 (reported on 23.5% of returns)
Here:
+$36,788
State:
+$17,064
(% of AGI for various income ranges: 14.9% for AGIs below $25k, 7.2% for AGIs $25k-50k, 6.4% for AGIs $50k-75k, 4.8% for AGIs $75k-100k, 5.9% for AGIs $100k-200k, 2.9% for AGIs over 200k)
Taxable individual retirement arrangement distribution: $45,777 (reported on 18.0% of returns)
92037:
$45,777
California:
$19,557
(% of AGI for various income ranges: 5.4% for AGIs below $25k, 3.7% for AGIs $25k-50k, 4.6% for AGIs $50k-75k, 5.9% for AGIs $75k-100k, 6.7% for AGIs $100k-200k, 2.8% for AGIs over 200k)
Self-employment retirement plans: $33,858 (reported on 4.1% of returns)
92037:
$33,858
California:
$24,530
(% of AGI for various income ranges: 0.3% for AGIs $25k-50k, 0.3% for AGIs $50k-75k, 0.4% for AGIs $75k-100k, 0.7% for AGIs $100k-200k, 0.6% for AGIs over 200k)
Total itemized deductions: $84,360 (22% of AGI, reported on 56.6% of returns)
Here:
$84,360
State:
$34,004
Here:
21.9% of AGI
State:
22.7% of AGI
(% of AGI for various income ranges: 32.1% for AGIs below $25k, 18.5% for AGIs $25k-50k, 21.0% for AGIs $50k-75k, 22.4% for AGIs $75k-100k, 22.5% for AGIs $100k-200k, 19.8% for AGIs over 200k)
Charity contributions: $13,764 (reported on 48.7% of returns)
Here:
$13,764
State:
$4,659
(% of AGI for various income ranges: 1.4% for AGIs below $25k, 1.5% for AGIs $25k-50k, 1.8% for AGIs $50k-75k, 2.4% for AGIs $75k-100k, 2.5% for AGIs $100k-200k, 3.0% for AGIs over 200k)
Taxes paid: $39,910 (reported on 56.4% of returns)
92037:
$39,910
State:
$14,448
(% of AGI for various income ranges: 7.0% for AGIs below $25k, 4.3% for AGIs $25k-50k, 5.9% for AGIs $50k-75k, 7.2% for AGIs $75k-100k, 8.9% for AGIs $100k-200k, 10.1% for AGIs over 200k)
Earned income credit: $1,186 (reported on 5.1% of returns)
Here:
$1,186
State:
$2,286
(% of AGI for various income ranges: 1.8% for AGIs below $25k, 0.2% for AGIs $25k-50k)
Percentage of individuals using paid preparers for their 2012 taxes: 64.2%
Here:
64%
State:
64%
(% for various income ranges: 53.7% for AGIs below $25k, 51.7% for AGIs $25k-50k, 58.7% for AGIs $50k-75k, 61.9% for AGIs $75k-100k, 69.9% for AGIs $100k-200k, 84.7% for AGIs over 200k)
Averages for the 2004 tax year for zip code 92037, filed in 2005:
Average Adjusted Gross Income (AGI) in 2004: $170,997 (Individual Income Tax Returns)
Here:
$170,997
State:
$58,600
Salary/wage: $105,852 (reported on 65.6% of returns)
Here:
$105,852
State:
$49,455
(% of AGI for various income ranges: 64.6% for AGIs $10k-25k, 63.8% for AGIs $25k-50k, 59.6% for AGIs $50k-75k, 53.3% for AGIs $75k-100k, 36.0% for AGIs over 100k)
Taxable interest for individuals: $13,346 (reported on 67.9% of returns)
This zip code:
$13,346
California:
$2,365
(% of AGI for various income ranges: 5.6% for AGIs $10k-25k, 4.5% for AGIs $25k-50k, 4.5% for AGIs $50k-75k, 4.0% for AGIs $75k-100k, 4.9% for AGIs over 100k)
Taxable dividends: $18,158 (reported on 55.3% of returns)
Here:
$18,158
State:
$4,746
(% of AGI for various income ranges: 6.4% for AGIs $10k-25k, 5.5% for AGIs $25k-50k, 5.6% for AGIs $50k-75k, 5.5% for AGIs $75k-100k, 5.6% for AGIs over 100k)
Net capital gain/loss: +$93,228 (reported on 52.7% of returns)
Here:
+$93,228
State:
+$23,418
(% of AGI for various income ranges: 3.3% for AGIs $10k-25k, 1.7% for AGIs $25k-50k, 2.4% for AGIs $50k-75k, 3.4% for AGIs $75k-100k, 31.4% for AGIs over 100k)
Profit/loss from business: +$33,709 (reported on 23.2% of returns)
Here:
+$33,709
State:
+$16,826
(% of AGI for various income ranges: 8.7% for AGIs $10k-25k, 7.8% for AGIs $25k-50k, 6.4% for AGIs $50k-75k, 7.5% for AGIs $75k-100k, 4.2% for AGIs over 100k)
IRA payment deduction: $3,661 (reported on 3.6% of returns)
92037:
$3,661
California:
$3,192
(% of AGI for various income ranges: 0.3% for AGIs $10k-25k, 0.3% for AGIs $25k-50k, 0.2% for AGIs $50k-75k, 0.2% for AGIs $75k-100k, 0.0% for AGIs over 100k)
Self-employed pension: $24,862 (reported on 5.0% of returns)
Here:
$24,862
California:
$17,688
(% of AGI for various income ranges: 0.2% for AGIs $10k-25k, 0.4% for AGIs $25k-50k, 0.7% for AGIs $50k-75k, 0.8% for AGIs $75k-100k, 0.7% for AGIs over 100k)
Total itemized deductions: $73,469 (25% of AGI, reported on 55.5% of returns)
Here:
$73,469
State:
$28,113
Here:
25.2% of AGI
State:
25.3% of AGI
(% of AGI for various income ranges: 25.1% for AGIs $10k-25k, 22.5% for AGIs $25k-50k, 23.6% for AGIs $50k-75k, 25.6% for AGIs $75k-100k, 22.9% for AGIs over 100k)
Charity contributions deductions: $22,214 (7% of AGI, reported on 48.7% of returns)
Here:
$22,214
State:
$3,923
Here:
7.1% of AGI
State:
3.3% of AGI
(% of AGI for various income ranges: 1.9% for AGIs $10k-25k, 2.0% for AGIs $25k-50k, 2.6% for AGIs $50k-75k, 2.8% for AGIs $75k-100k, 6.7% for AGIs over 100k)
Total tax: $38,541 (reported on 83.7% of returns)
92037:
$38,541
State:
$10,761
(% of AGI for various income ranges: 5.9% for AGIs $10k-25k, 9.0% for AGIs $25k-50k, 11.2% for AGIs $50k-75k, 11.9% for AGIs $75k-100k, 19.5% for AGIs over 100k)
Earned income credit: $810 (reported on 3.9% of returns)
Here:
$810
State:
$1,763
Percentage of individuals using paid preparers for their 2004 taxes: 65.8%
Here:
66%
State:
66%
(% for various income ranges: 60.4% for AGIs below $10k, 50.6% for AGIs $10k-25k, 56.5% for AGIs $25k-50k, 64.8% for AGIs $50k-75k, 69.4% for AGIs $75k-100k, 80.8% for AGIs over 100k)
Likely homosexual households (counted as self-reported same-sex unmarried-partner households)
Lesbian couples: 0.1% of all households
Gay men: 0.0% of all households
Household received Food Stamps/SNAP in the past 12 months: 407 Household did not receive Food Stamps/SNAP in the past 12 months: 15,791
Women who had a birth in the past 12 months: 243 (241 now married, 0 unmarried) Women who did not have a birth in the past 12 months: 7,456 (2,964 now married, 4,491 unmarried)
Housing units in zip code 92037 with a mortgage: 6,003 (797 second mortgage, 70 home equity loan, 683 both second mortgage and home equity loan) Houses without a mortgage: 21
Median monthly owner costs for units with a mortgage: $3,876 Median monthly owner costs for units without a mortgage: $1,556
Residents with income below the poverty level in 2022:
This zip code:
8.8%
Whole state:
12.2%
Residents with income below 50% of the poverty level in 2022:
This zip code:
3.9%
Whole state:
6.2%
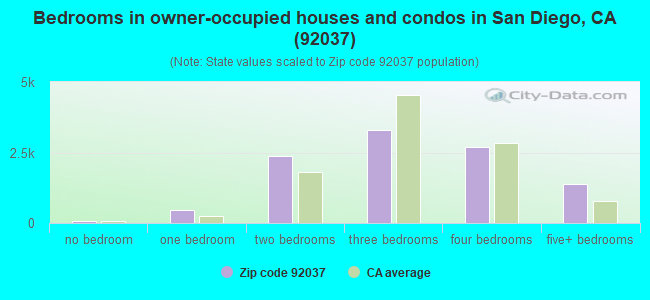
Median number of rooms in houses and condos:
Here:
6.3
State:
6.0
Median number of rooms in apartments:
Here:
3.7
State:
3.9
Notable locations in this zip code not listed on our city pages
Notable locations in zip code 92037: Stephen Birch Aquarium (A), Spindrift Golf Course (B), Scripps Pier (C), La Jolla Beach and Tennis Club (D), Torrey Pines Municipal Golf Course (E), United States Fishery Oceanography Center (F), La Jolla Country Club (G), La Jolla Museum of Contemporary Art (H), Institute for World Understanding of Peoples, Cultures and Languages Library (I), Helen Palmer Geisel Library (J), Athenaeum Music and Arts Library (K), Childrens Museum of San Diego (L), La Jolla Branch San Diego Public Library (M), Geisel University Library (N), Salk Institute Library (O), San Diego Fire - Rescue Department Station 35 (P), York Hall (Q), Warren Lecture Hall (R), Wagner Dance Building (S), Urey Hall Addition (T). Display/hide their locations on the map
Shopping Centers: The Wall Street Plaza Shopping Center (1), La Jolla Village Square Shopping Center (2), Sandpiper Plaza Shopping Center (3), Coast Walk Shopping Center (4). Display/hide their locations on the map
Churches in zip code 92037 include: Assembly of God Church (A), First Baptist Church (B), Fourth Church of Christ Scientist (C), La Jolla Lutheran Church (D), La Jolla Presbyterian Church (E), Mary Star of the Sea Roman Catholic Church (F), Methodist Church of La Jolla (G), Prince Chapel African Methodist Episcopal Church (H), Saint James Church by the Sea (I). Display/hide their locations on the map
Parks in zip code 92037 include: Marshall College Field (1), Matthews Quadrangle (2), Muir Field (3), Revelle Plaza (4), Warren Mall (5), Cliffridge Park (6), Coast Boulevard Park (7), Hermosa Terrace Park (8), Kellogg Park (9). Display/hide their locations on the map
Beaches: Windansea Beach (A), Torrey Pines City Beach (B), Marine Street Beach (C), Childrens Pool Beach (D), Wipeout Beach (E), Blacks Beach (F), La Jolla Shores Beach (G), Boomer Beach (H). Display/hide their locations on the map
4,734 married couples with children.
1,060 single-parent households (532 men, 528 women).
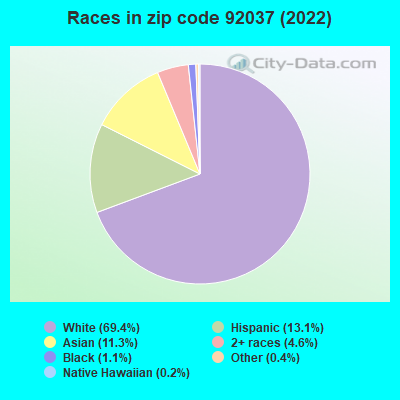
74.7% of residents of 92037 zip code speak English at home.
7.9% of residents speak Spanish at home (79% very well, 19% well, 2% not well).
10.4% of residents speak other Indo-European language at home (83% very well, 15% well, 3% not well).
6.6% of residents speak Asian or Pacific Island language at home (62% very well, 31% well, 5% not well, 2% not at all).
1.1% of residents speak other language at home (71% very well, 12% well, 17% not well).
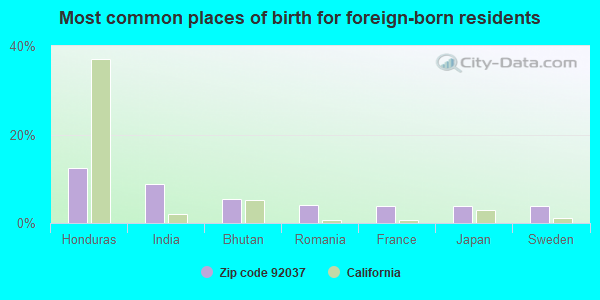
Foreign born population: 8,257 (22.1%) (58.9% of them are naturalized citizens)
This zip code:
22.1%
Whole state:
26.7%
12%Honduras
9%India
5%Bhutan
4%Romania
4%France
4%Japan
4%Sweden
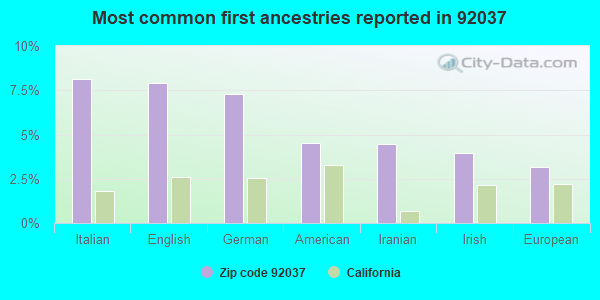
8%Italian
8%English
7%German
5%American
4%Iranian
4%Irish
3%European
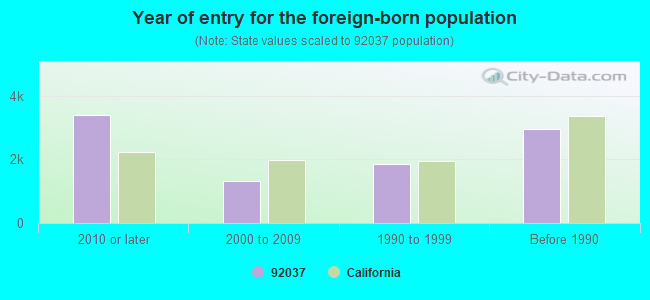
Year of entry for the foreign-born population
3,4012010 or later
1,3172000 to 2009
1,8471990 to 1999
2,969Before 1990
Major facilities with environmental interests located in this zip code:
LA JOLLA SENIOR HIGH (750 NAUTILUS ST. in LA JOLLA, CA)
(National Center for Education Statistics) - STATE ID-3733508 Small Quantity Generators, between 100 kg and 1000 kg of hazardous waste/month (Resource Conservation and Recovery Act (tracking hazardous waste)) - notification Organizations: SAN DIEGO USD (CONTACT/OWNER)
, SAN DIEGO UNIFIED (SCHOOL DISTRICT)
Alternative names: SAN DIEGO USD LA JOLLA HS
ANSATA THERAPEUTICS, INC (505 COAST BLVD SOUTH in LA JOLLA, CA)
STATE MASTER (California - Hazardous Waste Tracking) - HAZARDOU WASTE PROGRAM Small Quantity Generators, between 100 kg and 1000 kg of hazardous waste/month (Resource Conservation and Recovery Act (tracking hazardous waste))
MARGARETS DRY CLEANING INC (7519 LA JOLLA BLVD in LA JOLLA, CA)
STATE MASTER (California - Hazardous Waste Tracking) - HAZARDOU WASTE PROGRAM CRITERIA AND HAZARDOUS AIR POLLUTANT INVENTORY (Inventory of air pollution sources) Small Quantity Generators, between 100 kg and 1000 kg of hazardous waste/month (Resource Conservation and Recovery Act (tracking hazardous waste)) Business SIC classification: DRYCLEANING PLANTS, EXCEPT RUG CLEANING
CHEVRON STATION 90827 (7475 LA JOLLA BLVD in LA JOLLA, CA)
STATE MASTER (California - Hazardous Waste Tracking) - HAZARDOU WASTE PROGRAM CRITERIA AND HAZARDOUS AIR POLLUTANT INVENTORY (Inventory of air pollution sources) Small Quantity Generators, between 100 kg and 1000 kg of hazardous waste/month (Resource Conservation and Recovery Act (tracking hazardous waste)) - notification Business SIC classification: GASOLINE SERVICE STATIONS Organizations: CHEVRON PRODUCTS CO (CONTACT/OWNER)
HEINZ GIETZ AUTOHAUS INC (1027 VIRGINIA WAY in LA JOLLA, CA)
STATE MASTER (California - Hazardous Waste Tracking) - HAZARDOU WASTE PROGRAM Small Quantity Generators, between 100 kg and 1000 kg of hazardous waste/month (Resource Conservation and Recovery Act (tracking hazardous waste))
EXPLORER ELEMENTARY CHARTER (8660 GILMAN DR. in LA JOLLA, CA)
(National Center for Education Statistics) - STATE ID-6117683 Organizations: SAN DIEGO UNIFIED (SCHOOL DISTRICT)
LA JOLLA ELEMENTARY (1111 MARINE ST. in LA JOLLA, CA)
(National Center for Education Statistics) - STATE ID-6039846 Organizations: SAN DIEGO UNIFIED (SCHOOL DISTRICT)
MUIRLANDS MIDDLE (1056 NAUTILUS ST. in LA JOLLA, CA)
(National Center for Education Statistics) - STATE ID-6059687 Organizations: SAN DIEGO UNIFIED (SCHOOL DISTRICT)
EXXONMOBIL OIL CORPORATION (3233 LA JOLLA VILLAGE ROAD in LA JOLLA, CA)
CRITERIA AND HAZARDOUS AIR POLLUTANT INVENTORY (Inventory of air pollution sources) HAZARDOUS WASTE BIENNIAL REPORTER (Resource Conservation and Recovery Act (tracking hazardous waste)) Large Quantity Generators, more that 1000 kg of hazardous waste/month (Resource Conservation and Recovery Act (tracking hazardous waste)) Business SIC classification: GASOLINE SERVICE STATIONS Alternative names: MOBIL / LA JOLLA VILLAGE DR
CALBIOCHEM CORP (10933 N. TORREY PINES RD. in LA JOLLA, CA)
COMPLIANCE ACTIVITY (Tracking inspections of insecticide, fungicide, and rodenticide, and toxic substances) Small Quantity Generators, between 100 kg and 1000 kg of hazardous waste/month (Resource Conservation and Recovery Act (tracking hazardous waste)) TRI REPORTER (Tracking of toxic chemicals releasing facilities) Business SIC classification: BIOLOGICAL PRODUCTS, EXCEPT DIAGNOSTIC SUBSTANCES; CHEMICALS AND ALLIED PRODUCTS Business NAICS classification: MEDICINAL AND BOTANICAL MANUFACTURING.; BIOLOGICAL PRODUCT (EXCEPT DIAGNOSTIC) MANUFACTURING. Organizations: CAL BIOCHEM-BEHRING CORP (CONTACT/OPERATOR)
Alternative names: CALBIOCHEM NOVABIOCHEM CORP
KALYPSYS, INC (11099 N TORREY PINES RD in LA JOLLA, CA)
(Resource Conservation and Recovery Act (tracking hazardous waste)) Organizations: ARE-11099 N TORREY PINES, LLC (CONTACT/OWNER)
LA JOLLA INSTITUTE FOR ALLERGY (111049 N TORREY PINES RD in LA JOLLA, CA)
MEDICAL BIOLOGY INSTITUTE (11077 N TORREY PINES RD in LA JOLLA, CA)
(Resource Conservation and Recovery Act (tracking hazardous waste))
Housing units lacking complete plumbing facilities: 0.6% Housing units lacking complete kitchen facilities: 1.0%
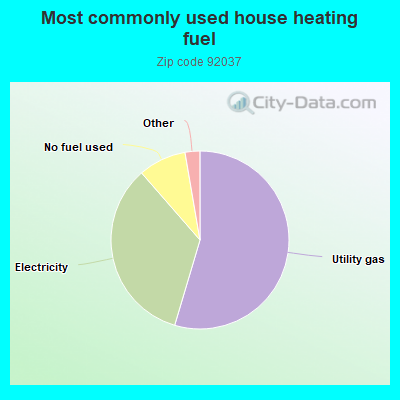
54.6%Utility gas
34.0%Electricity
8.7%No fuel used
0.9%Bottled, tank, or LP gas
0.8%Solar energy
0.6%Other fuel
Population in 1990: 40,399. Population change in the 1990s: +2,204 (+5.5%).
Place of birth for U.S.-born residents:
This state: 14,066
Northeast: 4,760
Midwest: 4,093
South: 2,758
West: 2,057
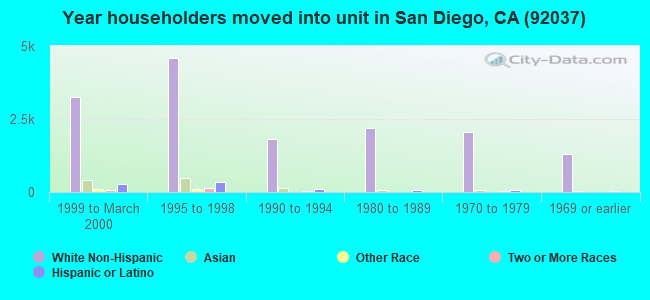
44% of the 92037 zip code residents lived in the same house 5 years ago. Out of people who lived in different houses, 45% lived in this county. Out of people who lived in different counties, 50% lived in California.
86% of the 92037 zip code residents lived in the same house 1 year ago. Out of people who lived in different houses, 51% moved from this county. Out of people who lived in different houses, 10% moved from different county within same state. Out of people who lived in different houses, 25% moved from different state. Out of people who lived in different houses, 14% moved from abroad.
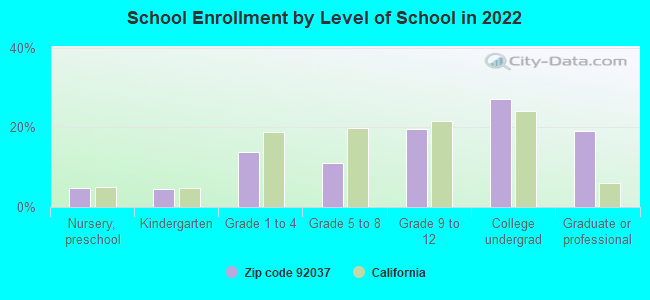
Private vs. public school enrollment:
Students in private schools in grades 1 to 8 (elementary and middle school): 1,305
Here:
51.9%
California:
10.5%
Students in private schools in grades 9 to 12 (high school): 735
Here:
38.7%
California:
8.5%
Students in private undergraduate colleges: 442
Here:
16.8%
California:
15.9%
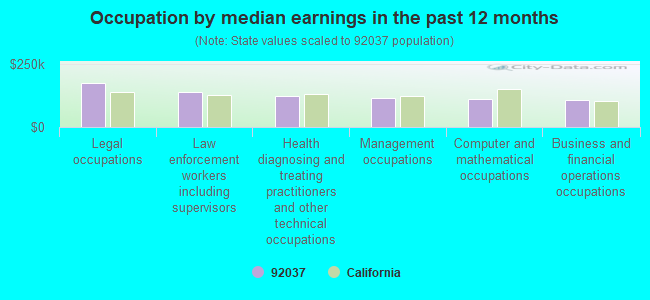
Occupation by median earnings in the past 12 months ($)
175,376Legal occupations
140,527Law enforcement workers including supervisors
124,678Health diagnosing and treating practitioners and other technical occupations
117,020Management occupations
110,237Computer and mathematical occupations
105,637Business and financial operations occupations
Companies with biggest federal contracts located in this zip code (LA JOLLA, CA):
DUPONT AEROSPACE CO INC (7946 IVANHOE AVE STE 316; small business) : $34,227,581 in 27 contractsfrom 2000 to 2006
Contracts for Other Defense -- Advanced Development (R&D), Hazardous Substance Removal, Cleanup, and Disposal Services and Operational Support, Construction of Structures and Facilities -- Miscellaneous Buildings by Navy, Agricultural Research Service Signed by year:2000: $7,243,944; 2001: $1,873,529; 2002: $5,138,573; 2003: $2,915,949; 2004: $13,452,240; 2005: $0; 2006: $3,603,346.
Biggest contracts:
$6,566,925 with Navy for Other Defense -- Advanced Development (R&D). Signed on 2004-12-10. Completion date: 2005-11-30.
$3,600,022, same as above.Signed on 2004-03-02. Completion date: 2005-03-31.
$3,596,346, same as above.Signed on 2006-04-13. Completion date: 2006-12-31.
$3,378,573 with Navy for Hazardous Substance Removal, Cleanup, and Disposal Services and Operational Support. Taking place in VA. Signed on 2000-12-06. Completion date: 2002-03-31.
NATURAL SELECTION, INCORPORATE (3333 N TORREY PINES CT STE; small business) : $4,090,642 in 23 contractsfrom 1999 to 2006
Contracts for Other Defense -- Applied Research and Exploratory Development (R&D), Defense Electronics and Communication Equipment -- Applied Research and Exploratory Development (R&D), Other Defense -- Management and Support (R&D), Services -- Advanced Development (R&D), and moreby Air Force, Navy, Army Signed by year:2000: $766,210; 2001: $690,261; 2002: $295,442; 2003: $716,251; 2004: $199,826; 2005: $604,942; 2006: $343,807.
Biggest contracts:
$375,000 with Air Force for Other Defense -- Applied Research and Exploratory Development (R&D). Signed on 2003-05-01. Completion date: 2005-08-01.
$375,000 with Navy for Defense Electronics and Communication Equipment -- Applied Research and Exploratory Development (R&D). Signed on 1999-12-14. Completion date: 2001-12-13.
$374,292 with Army for Other Defense -- Applied Research and Exploratory Development (R&D). Taking place in NY. Signed on 2001-03-12. Completion date: 2002-09-30.
$373,712 with Army for Other Defense -- Applied Research and Exploratory Development (R&D). Signed on 2000-09-27. Completion date: 2001-09-21.
SEASHELL TECHNOLOGY LLC (3252 HOLIDAY COURT STE 115; small business) : $1,939,996 in 9 contractsfrom 2002 to 2005
Contracts for Other Research and Development -- Basic Research (R&D), Other Defense -- Basic Research (R&D), Other Defense -- Applied Research and Exploratory Development (R&D), Physical Sciences -- Management and Support (R&D), and moreby Army, Air Force Signed by year:2000: $0; 2001: $0; 2002: $70,000; 2003: $200,000; 2004: $790,096; 2005: $879,900; 2006: $0.
Biggest contracts:
$398,012 with Army for Other Research and Development -- Basic Research (R&D). Signed on 2004-09-08. Completion date: 2006-11-08.
$392,084, same as above.Signed on 2004-09-21. Completion date: 2006-10-31.
$357,915, same as above.Signed on 2005-08-19. Completion date: 2006-10-31.
$351,986, same as above.Signed on 2005-08-19. Completion date: 2006-11-08.
CHIRP CORPORATION (8248 SUGARMAN DRIVE; small business) : $1,646,192 in 14 contractsfrom 2000 to 2005
Contracts for Other Defense -- Applied Research and Exploratory Development (R&D), Other Defense -- Basic Research (R&D), Other Defense -- Operational Systems Development (R&D), Defense Ships -- Basic Research (R&D) by Army, Navy Signed by year:2000: $839,950; 2001: $125,090; 2002: $241,459; 2003: $199,914; 2004: $139,992; 2005: $99,787; 2006: $0.
Biggest contracts:
$749,950 with Army for Other Defense -- Applied Research and Exploratory Development (R&D). Signed on 2000-06-05. Completion date: 2002-09-30.
$200,000 with Navy for Other Defense -- Basic Research (R&D). Signed on 2002-02-13. Completion date: 2003-05-03.
$99,914 with Navy for Other Defense -- Applied Research and Exploratory Development (R&D). Signed on 2003-12-18. Completion date: 2005-05-31.
$90,000 with Navy for Other Defense -- Basic Research (R&D). Signed on 2000-02-25. Completion date: 2001-03-31.
MS TECHNOLOGY (7922 AVENIDA KIRJAH; small business) : $904,763 in 7 contractsfrom 2000 to 2005
Contracts for Defense Missile and Space Systems -- Advanced Development (R&D), Defense Missile and Space Systems -- Operational Systems Development (R&D), Ammunition -- Basic Research (R&D), Other Defense -- Management and Support (R&D), and moreby Army, Air Force, Navy Signed by year:2000: $465,000; 2001: $100,000; 2002: $239,763; 2003: $0; 2004: $0; 2005: $100,000; 2006: $0.
Biggest contracts:
$400,000 with Army for Defense Missile and Space Systems -- Advanced Development (R&D). Signed on 2000-01-25. Completion date: 2002-01-24.
$100,000 with Air Force for Defense Missile and Space Systems -- Operational Systems Development (R&D). Signed on 2005-04-14. Completion date: 2006-04-14.
$100,000 with Army for Defense Missile and Space Systems -- Advanced Development (R&D). Signed on 2001-05-01. Completion date: 2002-01-24.
$99,763 with Air Force for Ammunition -- Basic Research (R&D). Signed on 2002-04-25. Completion date: 2003-01-25.
EBOOK TECHNOLOGIES INC (7745 HERSCHEL AVE; small business) : $802,131 in 5 contractsfrom 2004 to 2006
Contracts for ADP Support Equipment, ADPE System Configuration, ADP Supplies, Training Aids by Air Force, Army Signed by year:2000: $0; 2001: $0; 2002: $0; 2003: $0; 2004: $336,365; 2005: $443,067; 2006: $22,699.
Biggest contracts:
$435,019 with Air Force for ADP Support Equipment. Signed on 2005-09-28. Completion date: 2005-10-28.
$317,825 with Air Force for ADPE System Configuration. Signed on 2004-09-29. Completion date: 2004-11-30.
$22,699 with Air Force for ADP Supplies. Taking place in AL. Signed on 2006-02-07. Completion date: 2006-03-09.
$18,540 with Army for Training Aids. Signed on 2004-07-27. Completion date: 2004-08-27.
MIRO TECHNOLOGIES, INC (4250 EXECUTIVE SQUARE, SUI; small business) : $801,788 in 17 contractsfrom 2000 to 2005
Contracts for ADP Software, ADP Support Equipment, Miscellaneous Communication Equipment, ADP Input/Output and Storage Devices, and moreby Navy, Air Force Signed by year:2000: $25,486; 2001: $138,000; 2002: $68,122; 2003: $274,525; 2004: $120,558; 2005: $175,097; 2006: $0.
Biggest contracts:
$98,401 with Navy for ADP Software. Signed on 2005-02-01. Completion date: 2005-09-30.
$92,000 with Navy for ADP Support Equipment. Signed on 2001-05-29. Completion date: 2001-06-25.
$78,721 with Navy for ADP Software. Taking place in NJ. Signed on 2004-11-30. Completion date: 2005-09-30.
$73,571 with Navy for Miscellaneous Communication Equipment. Signed on 2003-11-17. Completion date: 2004-09-30.
HBP OF SAN DIEGO, INC (4225 EXECUTIVE SQ STE 100; small business) : $731,427 in 19 contractsfrom 1999 to 2005
Contracts for Other Photographic, Mapping, Printing, and Publication Services, ADP Facility Operation and Maintenance Services, ADP Support Equipment, ADP Systems Analysis Services, and moreby Navy, Federal Technology Service, Internal Revenue Service Signed by year:2000: $37,000; 2001: $220,771; 2002: $48,802; 2003: $244,168; 2004: $12,375; 2005: $97,361; 2006: $0.
Biggest contracts:
$199,539 with Navy for Other Photographic, Mapping, Printing, and Publication Services. Signed on 2003-09-15. Completion date: 2003-09-30.
$145,771, same as above.Signed on 2001-10-25. Completion date: 2002-09-30.
$70,950 with Navy for ADP Facility Operation and Maintenance Services. Signed on 1999-10-01. Completion date: 2000-09-30.
$39,000 with Federal Technology Service for ADP Support Equipment. Signed on 2001-08-15. Completion date: 2001-09-15.
BULL, DALE H (8445 AVENDA DE LOS ONDAS; small business) : $682,865 in 5 contractsfrom 2004 to 2005
Contracts for Other Medical Services by Navy Signed by year:2000: $0; 2001: $0; 2002: $0; 2003: $0; 2004: $346,468; 2005: $336,397; 2006: $0.
Biggest contracts:
$308,475 with Navy for Other Medical Services. Signed on 2005-10-20. Completion date: 2005-09-30.
$279,232, same as above.Signed on 2004-10-14. Completion date: 2005-09-30.
$67,236, same as above.Signed on 2004-05-18. Completion date: 2004-09-30.
$17,361, same as above.Signed on 2005-01-13. Completion date: 2005-09-30.
MAUREEN HATCH HARRINGTON (8288 GILMAN DR #44; small business) : $548,466 in 7 contractsfrom 1999 to 2005
Contracts for Other Medical Services, Physical Medicine and Rehabilitation Services by Navy Signed by year:2000: $71,989; 2001: $75,147; 2002: $78,154; 2003: $81,597; 2004: $84,522; 2005: $87,568; 2006: $0.
Biggest contracts:
$87,568 with Navy for Other Medical Services. Signed on 2005-10-19. Completion date: 2005-09-30.
$84,522, same as above.Signed on 2004-10-21. Completion date: 2005-09-30.
$81,597, same as above.Signed on 2003-10-01. Completion date: 2004-09-30.
$78,154 with Navy for Physical Medicine and Rehabilitation Services. Signed on 2002-10-01. Completion date: 2003-09-30.
Top industries in this zip code by the number of employees in 2005:
Professional, Scientific, and Technical Services: Research and Development in the Physical, Engineering, and Life Sciences (500-999 employees: 2 establishments, 250-499 employees: 4 establishments, 100-249 employees: 5 establishments, 50-99 employees: 2 establishments, 20-49 employees: 11 establishments, 10-19 employees: 7 establishments, 5-9 employees: 9 establishments, 1-4 employees: 20 establishments)
Health Care and Social Assistance: General Medical and Surgical Hospitals (over 1000: 2, 20-49: 1)
Management of Companies and Enterprises: Corporate, Subsidiary, and Regional Managing Offices (over 1000: 1, 250-499: 1, 100-249: 3, 20-49: 2, 10-19: 2, 5-9: 1, 1-4: 1)
Health Care and Social Assistance: Offices of Physicians (except Mental Health Specialists) (250-499: 1, 50-99: 1, 20-49: 10, 10-19: 21, 5-9: 27, 1-4: 126)
Health Care and Social Assistance: All Other Outpatient Care Centers (500-999: 1, 20-49: 1, 5-9: 2, 1-4: 5)
Administrative and Support and Waste Management and Remediation Services: Temporary Help Services (250-499: 1, 100-249: 1, 50-99: 2, 20-49: 1, 10-19: 2, 5-9: 1)
2005 - 2018 National Fire Incident Reporting System (NFIRS) incidents
According to the data from the years 2005 - 2018 the average number of fire incidents per year is 40. The highest number of reported fires - 73 took place in 2011, and the least - 0 in 2006. The data has a declining trend.
When looking into fire subcategories, the most incidents belonged to: Structure Fires (48.3%), and Outside Fires (29.1%).
Fire incident types reported to NFIRS in Zip Code 92037


 Nearest zip codes: 92117, 92121, 92109, 92122, 92111, 92130.


 According to the data from the years 2005 - 2018 the average number of fire incidents per year is 40. The highest number of reported fires - 73 took place in 2011, and the least - 0 in 2006. The data has a declining trend.
 When looking into fire subcategories, the most incidents belonged to: Structure Fires (48.3%), and Outside Fires (29.1%).