Estimated zip code population in 2022: 47,313 Zip code population in 2010: 45,096 Zip code population in 2000: 46,821
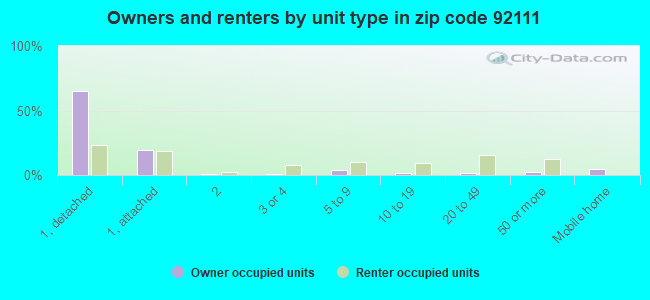
Houses and condos: 17,755 Renter-occupied apartments: 8,070
% of renters here:
47%
State:
44%
March 2022 cost of living index in zip code 92111: 122.3 (high, U.S. average is 100)
Land area: 8.5 sq. mi. Water area: 0.0 sq. mi.
Population density: 5,598 people per square mile
(average).
OSM Map
General Map
Google Map
MSN Map
OSM Map
General Map
Google Map
MSN Map
OSM Map
General Map
Google Map
MSN Map
OSM Map
General Map
Google Map
MSN Map
Please wait while loading the map...
Real estate property taxes paid for housing units in 2022:
This zip code:
0.5% ($3,845)
California:
0.7% ($4,831)
Median real estate property taxes paid for housing units with mortgages in 2022: $4,898 (0.6%) Median real estate property taxes paid for housing units with no mortgage in 2022: $2,529 (0.4%)
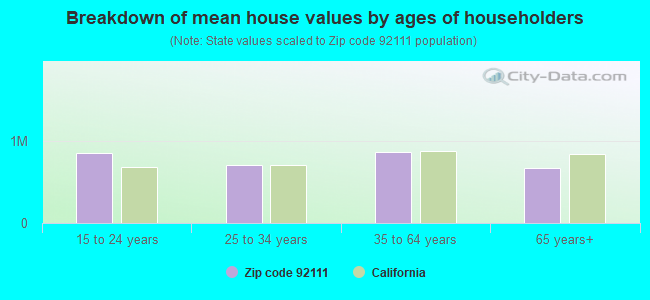
Estimated median house/condo value in 2022: $739,680
92111:
$739,680
California:
$715,900
According to our research of California and other state lists, there were 24 registered sex offenders living in 92111 zip code as of April 27, 2024. The ratio of all residents to sex offenders in zip code 92111 is 2,045 to 1. The ratio of registered sex offenders to all residents in this zip code is much lower than the state average.
Median resident age:
This zip code:
37.4 years
California median age:
37.9 years
Average household size:
This zip code:
2.6 people
California:
2.8 people
Averages for the 2020 tax year for zip code 92111, filed in 2021:
Average Adjusted Gross Income (AGI) in 2020: $67,067 (Individual Income Tax Returns)
Here:
$67,067
State:
$95,910
Salary/wage: $60,072 (reported on 80.7% of returns)
Here:
$60,072
State:
$77,331
(% of AGI for various income ranges: 1196.4% for AGIs below $25k, 3912.7% for AGIs $25k-50k, 6959.6% for AGIs $50k-75k, 10172.4% for AGIs $75k-100k, 19690.2% for AGIs $100k-200k, 71150.9% for AGIs over 200k)
Taxable interest for individuals: $1,033 (reported on 33.6% of returns)
This zip code:
$1,033
California:
$2,294
(% of AGI for various income ranges: 17.2% for AGIs below $25k, 22.4% for AGIs $25k-50k, 38.5% for AGIs $50k-75k, 75.4% for AGIs $75k-100k, 121.3% for AGIs $100k-200k, 650.9% for AGIs over 200k)
Ordinary dividends: $5,125 (reported on 20.5% of returns)
Here:
$5,125
State:
$10,949
(% of AGI for various income ranges: 26.6% for AGIs below $25k, 41.3% for AGIs $25k-50k, 82.2% for AGIs $50k-75k, 201.4% for AGIs $75k-100k, 339.5% for AGIs $100k-200k, 3154.2% for AGIs over 200k)
Net capital gain/loss in AGI: +$13,689 (reported on 19.9% of returns)
Here:
+$13,689
State:
+$49,306
(% of AGI for various income ranges: 12.2% for AGIs below $25k, 35.6% for AGIs $25k-50k, 66.6% for AGIs $50k-75k, 227.0% for AGIs $75k-100k, 606.2% for AGIs $100k-200k, 13802.1% for AGIs over 200k)
Profit/loss from business: +$11,480 (reported on 17.1% of returns)
Here:
+$11,480
State:
+$15,671
(% of AGI for various income ranges: 192.4% for AGIs below $25k, 174.8% for AGIs $25k-50k, 237.1% for AGIs $50k-75k, 288.2% for AGIs $75k-100k, 470.9% for AGIs $100k-200k, 3407.0% for AGIs over 200k)
Taxable individual retirement arrangement distribution: $18,003 (reported on 6.9% of returns)
92111:
$18,003
California:
$23,505
(% of AGI for various income ranges: 45.2% for AGIs below $25k, 67.6% for AGIs $25k-50k, 150.0% for AGIs $50k-75k, 246.2% for AGIs $75k-100k, 594.1% for AGIs $100k-200k, 1808.5% for AGIs over 200k)
Self-employed (Keogh) retirement plans: $16,782 (reported on 0.5% of returns)
92111:
$16,782
California:
$30,163
(% of AGI for various income ranges: 15.7% for AGIs $50k-75k, 31.9% for AGIs $100k-200k, 260.0% for AGIs over 200k)
Total itemized deductions: $30,746 (reported on 13.1% of returns)
Here:
$30,746
State:
$39,517
(% of AGI for various income ranges: 67.7% for AGIs below $25k, 159.3% for AGIs $25k-50k, 374.8% for AGIs $50k-75k, 891.8% for AGIs $75k-100k, 1924.0% for AGIs $100k-200k, 8087.3% for AGIs over 200k)
Charity contributions: $6,000 (reported on 10.4% of returns)
Here:
$6,000
State:
$12,598
(% of AGI for various income ranges: 3.8% for AGIs below $25k, 16.3% for AGIs $25k-50k, 35.2% for AGIs $50k-75k, 93.9% for AGIs $75k-100k, 250.6% for AGIs $100k-200k, 2069.4% for AGIs over 200k)
Taxes paid: $8,346 (reported on 13.0% of returns)
92111:
$8,346
State:
$8,807
(% of AGI for various income ranges: 14.9% for AGIs below $25k, 31.5% for AGIs $25k-50k, 99.8% for AGIs $50k-75k, 290.0% for AGIs $75k-100k, 615.5% for AGIs $100k-200k, 1653.3% for AGIs over 200k)
Earned income credit: $1,824 (reported on 13.3% of returns)
Here:
$1,824
State:
$2,074
(% of AGI for various income ranges: 76.0% for AGIs below $25k, 54.7% for AGIs $25k-50k, 1.0% for AGIs $50k-75k)
Percentage of individuals using paid preparers for their 2020 taxes: 92.9%
Here:
93%
State:
92%
(% for various income ranges: 91.2% for AGIs below $25k, 92.9% for AGIs $25k-50k, 94.0% for AGIs $50k-75k, 93.4% for AGIs $75k-100k, 94.3% for AGIs $100k-200k, 95.5% for AGIs over 200k)
Averages for the 2012 tax year for zip code 92111, filed in 2013:
Average Adjusted Gross Income (AGI) in 2012: $50,788 (Individual Income Tax Returns)
Here:
$50,788
State:
$72,726
Salary/wage: $46,677 (reported on 82.2% of returns)
Here:
$46,677
State:
$59,079
(% of AGI for various income ranges: 74.2% for AGIs below $25k, 81.0% for AGIs $25k-50k, 77.2% for AGIs $50k-75k, 75.6% for AGIs $75k-100k, 78.2% for AGIs $100k-200k, 58.9% for AGIs over 200k)
Taxable interest for individuals: $949 (reported on 34.5% of returns)
This zip code:
$949
California:
$2,146
(% of AGI for various income ranges: 0.7% for AGIs below $25k, 0.6% for AGIs $25k-50k, 0.6% for AGIs $50k-75k, 0.7% for AGIs $75k-100k, 0.4% for AGIs $100k-200k, 1.1% for AGIs over 200k)
Ordinary dividends: $3,833 (reported on 17.7% of returns)
Here:
$3,833
State:
$9,308
(% of AGI for various income ranges: 1.3% for AGIs below $25k, 0.9% for AGIs $25k-50k, 1.1% for AGIs $50k-75k, 1.2% for AGIs $75k-100k, 1.2% for AGIs $100k-200k, 2.9% for AGIs over 200k)
Net capital gain/loss in AGI: +$4,520 (reported on 15.0% of returns)
Here:
+$4,520
State:
+$30,460
(% of AGI for various income ranges: 0.2% for AGIs $50k-75k, 0.7% for AGIs $75k-100k, 1.0% for AGIs $100k-200k, 8.1% for AGIs over 200k)
Profit/loss from business: +$12,619 (reported on 16.1% of returns)
Here:
+$12,619
State:
+$17,064
(% of AGI for various income ranges: 10.9% for AGIs below $25k, 3.8% for AGIs $25k-50k, 2.7% for AGIs $50k-75k, 2.9% for AGIs $75k-100k, 2.7% for AGIs $100k-200k, 5.0% for AGIs over 200k)
Taxable individual retirement arrangement distribution: $13,738 (reported on 8.6% of returns)
92111:
$13,738
California:
$19,557
(% of AGI for various income ranges: 1.9% for AGIs below $25k, 1.9% for AGIs $25k-50k, 2.5% for AGIs $50k-75k, 2.7% for AGIs $75k-100k, 2.3% for AGIs $100k-200k, 2.7% for AGIs over 200k)
Self-employment retirement plans: $16,973 (reported on 0.5% of returns)
92111:
$16,973
California:
$24,530
(% of AGI for various income ranges: 0.2% for AGIs $50k-75k, 0.2% for AGIs $100k-200k, 0.7% for AGIs over 200k)
Total itemized deductions: $24,151 (26% of AGI, reported on 30.9% of returns)
Here:
$24,151
State:
$34,004
Here:
25.6% of AGI
State:
22.7% of AGI
(% of AGI for various income ranges: 8.8% for AGIs below $25k, 9.0% for AGIs $25k-50k, 13.8% for AGIs $50k-75k, 17.8% for AGIs $75k-100k, 17.7% for AGIs $100k-200k, 18.6% for AGIs over 200k)
Charity contributions: $2,819 (reported on 25.0% of returns)
Here:
$2,819
State:
$4,659
(% of AGI for various income ranges: 0.5% for AGIs below $25k, 0.8% for AGIs $25k-50k, 1.2% for AGIs $50k-75k, 1.6% for AGIs $75k-100k, 1.7% for AGIs $100k-200k, 2.1% for AGIs over 200k)
Taxes paid: $7,938 (reported on 30.8% of returns)
92111:
$7,938
State:
$14,448
(% of AGI for various income ranges: 1.9% for AGIs below $25k, 1.9% for AGIs $25k-50k, 3.6% for AGIs $50k-75k, 5.2% for AGIs $75k-100k, 7.0% for AGIs $100k-200k, 8.1% for AGIs over 200k)
Earned income credit: $2,045 (reported on 17.6% of returns)
Here:
$2,045
State:
$2,286
(% of AGI for various income ranges: 5.5% for AGIs below $25k, 0.9% for AGIs $25k-50k)
Percentage of individuals using paid preparers for their 2012 taxes: 57.4%
Here:
57%
State:
64%
(% for various income ranges: 56.8% for AGIs below $25k, 56.4% for AGIs $25k-50k, 57.0% for AGIs $50k-75k, 56.8% for AGIs $75k-100k, 61.4% for AGIs $100k-200k, 68.6% for AGIs over 200k)
Averages for the 2004 tax year for zip code 92111, filed in 2005:
Average Adjusted Gross Income (AGI) in 2004: $43,186 (Individual Income Tax Returns)
Here:
$43,186
State:
$58,600
Salary/wage: $39,659 (reported on 82.4% of returns)
Here:
$39,659
State:
$49,455
(% of AGI for various income ranges: 125.1% for AGIs below $10k, 75.7% for AGIs $10k-25k, 80.7% for AGIs $25k-50k, 79.0% for AGIs $50k-75k, 79.5% for AGIs $75k-100k, 65.1% for AGIs over 100k)
Taxable interest for individuals: $1,218 (reported on 46.3% of returns)
This zip code:
$1,218
California:
$2,365
(% of AGI for various income ranges: 5.3% for AGIs below $10k, 1.6% for AGIs $10k-25k, 1.2% for AGIs $25k-50k, 1.1% for AGIs $50k-75k, 1.3% for AGIs $75k-100k, 1.3% for AGIs over 100k)
Taxable dividends: $2,098 (reported on 22.2% of returns)
Here:
$2,098
State:
$4,746
(% of AGI for various income ranges: 4.0% for AGIs below $10k, 1.2% for AGIs $10k-25k, 1.0% for AGIs $25k-50k, 0.9% for AGIs $50k-75k, 1.0% for AGIs $75k-100k, 1.2% for AGIs over 100k)
Net capital gain/loss: +$7,578 (reported on 18.6% of returns)
Here:
+$7,578
State:
+$23,418
(% of AGI for various income ranges: -2.8% for AGIs below $10k, -0.1% for AGIs $10k-25k, 0.3% for AGIs $25k-50k, 0.7% for AGIs $50k-75k, 1.2% for AGIs $75k-100k, 10.0% for AGIs over 100k)
Profit/loss from business: +$13,115 (reported on 15.8% of returns)
Here:
+$13,115
State:
+$16,826
(% of AGI for various income ranges: 14.0% for AGIs below $10k, 7.7% for AGIs $10k-25k, 3.9% for AGIs $25k-50k, 2.9% for AGIs $50k-75k, 3.7% for AGIs $75k-100k, 5.9% for AGIs over 100k)
IRA payment deduction: $2,704 (reported on 2.5% of returns)
92111:
$2,704
California:
$3,192
(% of AGI for various income ranges: 0.4% for AGIs below $10k, 0.2% for AGIs $10k-25k, 0.2% for AGIs $25k-50k, 0.2% for AGIs $50k-75k, 0.1% for AGIs $75k-100k, 0.1% for AGIs over 100k)
Self-employed pension: $12,587 (reported on 0.9% of returns)
Here:
$12,587
California:
$17,688
(% of AGI for various income ranges: 0.3% for AGIs below $10k, 0.2% for AGIs $25k-50k, 0.1% for AGIs $50k-75k, 0.3% for AGIs $75k-100k, 0.5% for AGIs over 100k)
Total itemized deductions: $20,727 (27% of AGI, reported on 34.2% of returns)
Here:
$20,727
State:
$28,113
Here:
27.0% of AGI
State:
25.3% of AGI
(% of AGI for various income ranges: 19.7% for AGIs below $10k, 10.9% for AGIs $10k-25k, 13.1% for AGIs $25k-50k, 17.9% for AGIs $50k-75k, 19.8% for AGIs $75k-100k, 18.0% for AGIs over 100k)
Charity contributions deductions: $2,580 (3% of AGI, reported on 30.1% of returns)
Here:
$2,580
State:
$3,923
Here:
3.2% of AGI
State:
3.3% of AGI
(% of AGI for various income ranges: 1.0% for AGIs below $10k, 1.1% for AGIs $10k-25k, 1.3% for AGIs $25k-50k, 1.8% for AGIs $50k-75k, 2.1% for AGIs $75k-100k, 2.4% for AGIs over 100k)
Total tax: $6,071 (reported on 77.2% of returns)
92111:
$6,071
State:
$10,761
(% of AGI for various income ranges: 5.2% for AGIs below $10k, 4.5% for AGIs $10k-25k, 7.2% for AGIs $25k-50k, 9.7% for AGIs $50k-75k, 11.0% for AGIs $75k-100k, 17.0% for AGIs over 100k)
Earned income credit: $1,678 (reported on 14.3% of returns)
Here:
$1,678
State:
$1,763
Percentage of individuals using paid preparers for their 2004 taxes: 60.8%
Here:
61%
State:
66%
(% for various income ranges: 53.9% for AGIs below $10k, 63.4% for AGIs $10k-25k, 59.3% for AGIs $25k-50k, 63.6% for AGIs $50k-75k, 61.6% for AGIs $75k-100k, 66.5% for AGIs over 100k)
Likely homosexual households (counted as self-reported same-sex unmarried-partner households)
Lesbian couples: 0.0% of all households
Gay men: 0.2% of all households
Household received Food Stamps/SNAP in the past 12 months: 1,818 Household did not receive Food Stamps/SNAP in the past 12 months: 15,310
Women who had a birth in the past 12 months: 412 (304 now married, 107 unmarried) Women who did not have a birth in the past 12 months: 12,660 (4,302 now married, 8,388 unmarried)
Housing units in zip code 92111 with a mortgage: 5,697 (415 second mortgage, 3 home equity loan, 301 both second mortgage and home equity loan) Houses without a mortgage: 65
Median monthly owner costs for units with a mortgage: $2,574 Median monthly owner costs for units without a mortgage: $633
Residents with income below the poverty level in 2022:
This zip code:
12.3%
Whole state:
12.2%
Residents with income below 50% of the poverty level in 2022:
This zip code:
5.7%
Whole state:
6.2%
Median number of rooms in houses and condos:
Here:
5.7
State:
6.0
Median number of rooms in apartments:
Here:
4.1
State:
3.9
Notable locations in this zip code not listed on our city pages
Notable locations in zip code 92111: Linda Vista Branch San Diego Public Library (A), San Diego Office of Education (B), San Diego Fire - Rescue Department Station 23 (C). Display/hide their locations on the map
Shopping Centers: Kearney Village Shopping Center (1), Independence Square Shopping Center (2), Convoy Village Shopping Center (3), Linda Vista Plaza Shopping Center (4), Kearny Mesa Shopping Center (5), Balboa Mesa Shopping Center (6), Star Center Shopping Center (7), Mercury Village Shopping Center (8), Magnolia Square Shopping Center (9). Display/hide their locations on the map
Churches in zip code 92111 include: American Holistic Church (A), Apostolic Church (B), Atonement Lutheran Church (C), Baha'i Faith Church (D), Balboa Avenue Alliance Church (E), Calvary Southern Baptist Church (F), The Church of Jesus Christ of Latter Day Saints (G), Church of the Nazarene (H), Clairemont Bible Baptist Church (I). Display/hide their locations on the map
Parks in zip code 92111 include: Kearny Mesa Park (1), Linda Vista Park (2), Mount Acadia Park (3), Mount Brundage Park (4), East Clairmont Athletic Area (5), Mission Heights Park (6), Kearny Mesa Recreation Center (7), Lindberg Park (8). Display/hide their locations on the map
Tourist attraction (not listed on the city page) : Boomers (Amusement & Theme Parks; 6999 Clairemont Mesa Boulevard).
4,976 married couples with children.
1,822 single-parent households (359 men, 1,463 women).
63.7% of residents of 92111 zip code speak English at home.
18.3% of residents speak Spanish at home (67% very well, 18% well, 11% not well, 4% not at all).
3.1% of residents speak other Indo-European language at home (83% very well, 13% well, 3% not well, 1% not at all).
12.6% of residents speak Asian or Pacific Island language at home (43% very well, 27% well, 27% not well, 3% not at all).
1.9% of residents speak other language at home (48% very well, 20% well, 15% not well, 18% not at all).
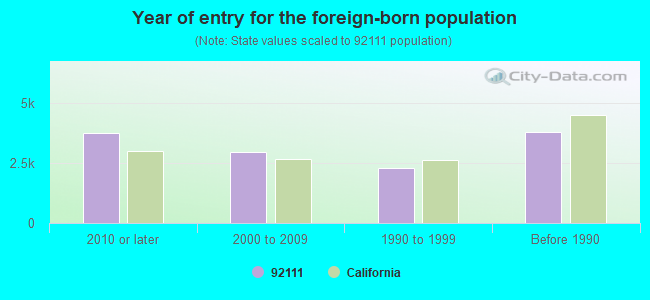
Foreign born population: 11,405 (24.1%) (52.0% of them are naturalized citizens)
Major facilities with environmental interests located in this zip code:
KEARNY MESA FORD (7303 CLAIREMONT MESA BLVD in SAN DIEGO, CA)
STATE MASTER (California - Hazardous Waste Tracking) - HAZARDOU WASTE PROGRAM CRITERIA AND HAZARDOUS AIR POLLUTANT INVENTORY (Inventory of air pollution sources) Small Quantity Generators, between 100 kg and 1000 kg of hazardous waste/month (Resource Conservation and Recovery Act (tracking hazardous waste)) - notification STATE MASTER (California - Used Oil Recycling System ) - USED OIL RECYCLING Business SIC classification: TOP, BODY, AND UPHOLSTERY REPAIR SHOPS AND PAINT SHOPS Organizations: ARON FELDMAN (CONTACT/OWNER)
C & M CHEVROLET (7978 BALBOA in SAN DIEGO, CA)
STATE MASTER (California - Hazardous Waste Tracking) - HAZARDOU WASTE PROGRAM CRITERIA AND HAZARDOUS AIR POLLUTANT INVENTORY (Inventory of air pollution sources) Small Quantity Generators, between 100 kg and 1000 kg of hazardous waste/month (Resource Conservation and Recovery Act (tracking hazardous waste)) - notification Large Quantity Generators, more that 1000 kg of hazardous waste/month (Resource Conservation and Recovery Act (tracking hazardous waste)) Business SIC classification: TOP, BODY, AND UPHOLSTERY REPAIR SHOPS AND PAINT SHOPS Organizations: KEN BECKER (CONTACT/OPERATOR)
, CHARLES MENOTTI (CONTACT/OWNER)
, KEARNY MESA AUTOMOTIVE CO (CONTACT/OWNER)
HERITAGE CLEANERS (2147 COMSTOCK ST in SAN DIEGO, CA)
STATE MASTER (California - Hazardous Waste Tracking) - HAZARDOU WASTE PROGRAM CRITERIA AND HAZARDOUS AIR POLLUTANT INVENTORY (Inventory of air pollution sources) Small Quantity Generators, between 100 kg and 1000 kg of hazardous waste/month (Resource Conservation and Recovery Act (tracking hazardous waste)) Small Quantity Generators, between 100 kg and 1000 kg of hazardous waste/month (Resource Conservation and Recovery Act (tracking hazardous waste)) - notification Business SIC classification: DRYCLEANING PLANTS, EXCEPT RUG CLEANING Organizations: BITALEEINC (CONTACT/OWNER)
Alternative names: ANJA INC DBA HERITAGE CLEANERS, HERITAGE DRY CLEANERS BITALEEINC
EUROPA AUTO IMPORTS INC DBA MERCEDES (4750 KEARNY MESA RD in SAN DIEGO, CA)
STATE MASTER (California - Hazardous Waste Tracking) - HAZARDOU WASTE PROGRAM Large Quantity Generators, more that 1000 kg of hazardous waste/month (Resource Conservation and Recovery Act (tracking hazardous waste)) Business NAICS classification: GENERAL AUTOMOTIVE REPAIR. Organizations: ARNOLD AND ESTHER BELINSKY (CONTACT/OWNER)
EXXON MOBIL OIL CORPORATION (6066 BALBOA AVENUE in SAN DIEGO, CA)
CRITERIA AND HAZARDOUS AIR POLLUTANT INVENTORY (Inventory of air pollution sources) HAZARDOUS WASTE BIENNIAL REPORTER (Resource Conservation and Recovery Act (tracking hazardous waste)) Large Quantity Generators, more that 1000 kg of hazardous waste/month (Resource Conservation and Recovery Act (tracking hazardous waste)) Large Quantity Generators, more that 1000 kg of hazardous waste/month (Resource Conservation and Recovery Act (tracking hazardous waste)) Business SIC classification: GASOLINE SERVICE STATIONS Organizations: EXXONMOBIL OIL CORPORATION (CONTACT/OPERATOR)
Alternative names: EXXONMOBIL OIL CORPORATION 10988, MOBIL / BALBOA AVE
CALTRANS KEARNY MESA (7177 OPPORTUNITY RD in SAN DIEGO, CA)
STATE MASTER (California - Hazardous Waste Tracking) - HAZARDOU WASTE PROGRAM (Resource Conservation and Recovery Act (tracking hazardous waste)) Business NAICS classification: AIR TRAFFIC CONTROL. Organizations: STATE OF CALIFORNIA (CONTACT/OWNER)
Alternative names: CALTRANS LAB, LANNY CHRONERT, MS57
NESTLE WATERS NORTH AMERICA (8025 ENGINEER ROAD in SAN DIEGO, CA)
STATE MASTER (California - Hazardous Waste Tracking) - HAZARDOU WASTE PROGRAM (Resource Conservation and Recovery Act (tracking hazardous waste)) Organizations: PERRIER G B OF AMERICA (CONTACT/OWNER)
Alternative names: ARROWHEAD DRINKING WATER
HAWTHORNE ENGINE SYSTEMS (8050 OTHELLO in SAN DIEGO, CA)
STATE MASTER (California - Hazardous Waste Tracking) - HAZARDOU WASTE PROGRAM CRITERIA AND HAZARDOUS AIR POLLUTANT INVENTORY (Inventory of air pollution sources) Large Quantity Generators, more that 1000 kg of hazardous waste/month (Resource Conservation and Recovery Act (tracking hazardous waste)) Business SIC classification: MISCELLANEOUS BUSINESS CREDIT INSTITUTIONS Business NAICS classification: CONSTRUCTION, MINING, AND FORESTRY MACHINERY AND EQUIPMENT RENTAL AND LEASING. Alternative names: HAWTHORNE POWER SYS
BALBOA AUTO BODY (7827 BALBOA AVE in SAN DIEGO, CA)
STATE MASTER (California - Hazardous Waste Tracking) - HAZARDOU WASTE PROGRAM CRITERIA AND HAZARDOUS AIR POLLUTANT INVENTORY (Inventory of air pollution sources) Small Quantity Generators, between 100 kg and 1000 kg of hazardous waste/month (Resource Conservation and Recovery Act (tracking hazardous waste)) - notification Business SIC classification: TOP, BODY, AND UPHOLSTERY REPAIR SHOPS AND PAINT SHOPS Business NAICS classification: AUTOMOTIVE BODY, PAINT, AND INTERIOR REPAIR AND MAINTENANCE. Organizations: EDWARD F BRILL (CONTACT/OWNER)
Alternative names: DBA, BALBOA AUTO BODY
KEARNY SENIOR HIGH (7651 WELLINGTON ST. in SAN DIEGO, CA)
(National Center for Education Statistics) - STATE ID-3733326 Small Quantity Generators, between 100 kg and 1000 kg of hazardous waste/month (Resource Conservation and Recovery Act (tracking hazardous waste)) - notification Organizations: SAN DIEGO USD (CONTACT/OWNER)
, SAN DIEGO UNIFIED (SCHOOL DISTRICT)
Alternative names: SAN DIEGO USD KEARNY HS
JOHN H HARLAND CO (6911 CONVOY CT in SAN DIEGO, CA)
STATE MASTER (California - Hazardous Waste Tracking) - HAZARDOU WASTE PROGRAM Small Quantity Generators, between 100 kg and 1000 kg of hazardous waste/month (Resource Conservation and Recovery Act (tracking hazardous waste)) - notification TRI REPORTER (Tracking of toxic chemicals releasing facilities) Business SIC classification: COMMERCIAL PRINTING, LITHOGRAPHIC Business NAICS classification: BLANKBOOK, LOOSELEAF BINDERS, AND DEVICES MANUFACTURING. Alternative names: JOHN H HARLAND CO PLANT NUMBER 12
HAMILTON-HUNT ENTERPRISES (8380 VICKERS ST STE 1 in SAN DIEGO, CA)
(Resource Conservation and Recovery Act (tracking hazardous waste)) Organizations: BLAS VINCE (CONTACT/OWNER)
, PARTNERSHIP (CONTACT/OWNER)
Alternative names: PANTEK INTERNATIONAL
MOSSY NISSAN KEARNY MESA (4797 CONVOY ST in SAN DIEGO, CA)
STATE MASTER (California - Hazardous Waste Tracking) - HAZARDOU WASTE PROGRAM Small Quantity Generators, between 100 kg and 1000 kg of hazardous waste/month (Resource Conservation and Recovery Act (tracking hazardous waste)) - notification Organizations: PHILLIP AND PETER MOSSY (CONTACT/OWNER)
Housing units lacking complete plumbing facilities: 0.1% Housing units lacking complete kitchen facilities: 0.5%
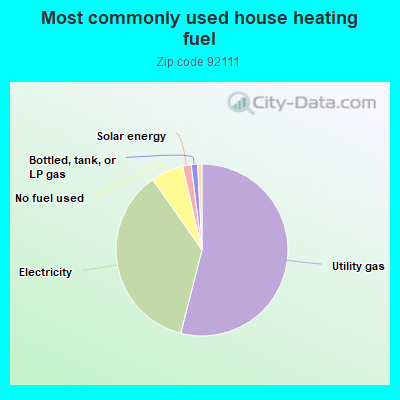
54.0%Utility gas
36.3%Electricity
6.1%No fuel used
1.6%Solar energy
1.2%Bottled, tank, or LP gas
Population in 1990: 45,487. Population change in the 1990s: +1,334 (+2.9%).
Place of birth for U.S.-born residents:
This state: 22,830
Northeast: 2,939
Midwest: 2,899
South: 2,950
West: 2,934
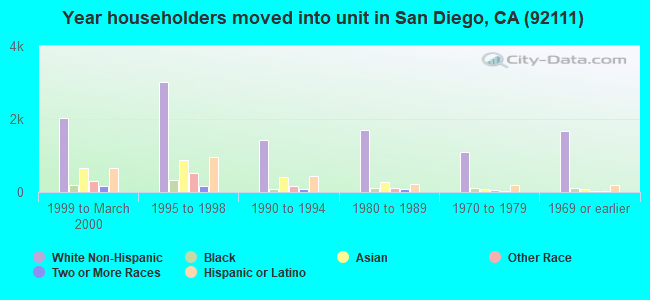
50% of the 92111 zip code residents lived in the same house 5 years ago. Out of people who lived in different houses, 75% lived in this county. Out of people who lived in different counties, 50% lived in California.
88% of the 92111 zip code residents lived in the same house 1 year ago. Out of people who lived in different houses, 53% moved from this county. Out of people who lived in different houses, 15% moved from different county within same state. Out of people who lived in different houses, 26% moved from different state. Out of people who lived in different houses, 6% moved from abroad.
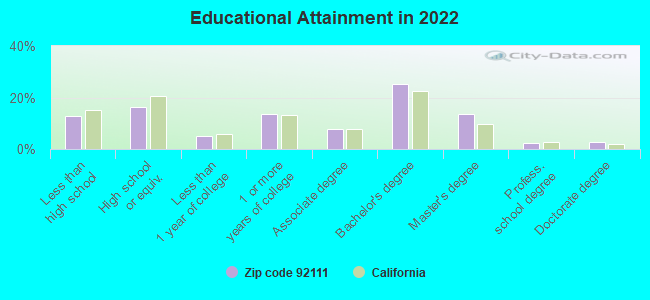
Private vs. public school enrollment:
Students in private schools in grades 1 to 8 (elementary and middle school): 467
Here:
13.7%
California:
10.5%
Students in private schools in grades 9 to 12 (high school): 202
Here:
9.6%
California:
8.5%
Students in private undergraduate colleges: 2,216
Here:
44.1%
California:
15.9%
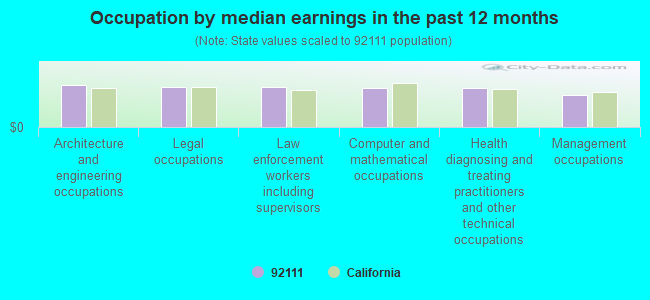
Occupation by median earnings in the past 12 months ($)
102,319Architecture and engineering occupations
97,637Legal occupations
96,528Law enforcement workers including supervisors
94,633Computer and mathematical occupations
94,437Health diagnosing and treating practitioners and other technical occupations
77,780Management occupations
Companies with biggest federal contracts located in this zip code (SAN DIEGO, CA):
PROJECT RESOURCES INC (3760 CONVOY STREET, SUITE; small business) : $124,562,228 in 407 contractsfrom 1999 to 2006
Contracts for Program Management/Support Services, Maintenance, Repair or Alteration of Real Property -- Restoration of real property, Other Environmental Services, Studies, and Analytical Support, Construction of Structures and Facilities -- Restoration of real property, and moreby Federal Emergency Management Agency, Army, U.S. Army Corps of Engineers - civil program financing only, EPA, and others Signed by year:2000: $595,000; 2001: $4,639,152; 2002: $11,446,312; 2003: $6,939,641; 2004: $21,450,690; 2005: $17,612,003; 2006: $61,127,430.
Biggest contracts:
$28,003,738 with Federal Emergency Management Agency for Program Management/Support Services. Signed on 2006-06-01. Completion date: 2011-06-01.
$20,211,991, same as above.Signed on 2006-06-01. Completion date: 2011-06-01.
$3,134,738 with Army for Maintenance, Repair or Alteration of Real Property -- Restoration of real property. Taking place in CO. Signed on 2005-04-29. Completion date: 2006-08-31.
$3,134,738 with U.S. Army Corps of Engineers - civil program financing only for Maintenance, Repair or Alteration of Real Property -- Restoration of real property. Taking place in CO. Signed on 2005-04-29. Completion date: 2006-08-31.
PROJECT RESOURCES/DEL JEN, A J (3760 CONVOY STREET, SUITE; small business) : $87,559,150 in 845 contractsfrom 2001 to 2006
Contracts for Facilities Operations Support Services, Maintenance, Repair or Alteration of Real Property -- Miscellaneous Buildings, Construction of Structures and Facilities -- Miscellaneous Buildings, Construction of Structures and Facilities -- Air Traffic Control Towers, and moreby Navy, Army, Air Force, U.S. Army Corps of Engineers - civil program financing only, and others Signed by year:2000: $0; 2001: $2,614,681; 2002: $17,240,071; 2003: $22,987,102; 2004: $24,989,984; 2005: $15,654,010; 2006: $4,073,302.
Biggest contracts:
$8,367,822 with Navy for Facilities Operations Support Services. Taking place in FL. Signed on 2005-09-30. Completion date: 2005-09-30.
$8,298,483, same as above.Signed on 2004-09-30. Completion date: 2005-09-30.
$7,504,940, same as above.Signed on 2002-11-04. Completion date: 2003-09-30.
$6,599,112, same as above.Signed on 2003-11-03. Completion date: 2004-09-30.
CDM FEDERAL PROGRAMS CORPORATI (3760 CONVOY STREET, SUITE) : $16,566,451 in 101 contractsfrom 2001 to 2006
Contracts for Other Architect and Engineering Services, Other Environmental Protection -- Advanced Development (R&D), Other Environmental Protection -- Basic Research (R&D), Other Environmental Services, Studies, and Analytical Support, and moreby Navy, Army, United States Coast Guard (disused code: now 7008) Signed by year:2000: $0; 2001: -$57,149; 2002: $4,058,216; 2003: $9,555,249; 2004: $1,823,306; 2005: $986,392; 2006: $200,437.
Biggest contracts:
$1,766,040 with Navy for Other Architect and Engineering Services. Signed on 2004-02-06. Completion date: 2005-05-06.
$1,758,000, same as above.Signed on 2003-03-17. Completion date: 2008-03-17.
$870,717, same as above.Signed on 2002-04-11. Completion date: 2004-04-09.
$867,549, same as above.Signed on 2003-03-11. Completion date: 2004-04-09.
PEPSI COLA BOTTLING OF SAN DIE (7995 ARMOUR ST) : $13,892,690 in 62 contractsfrom 1999 to 2006
Contracts for Food Items For Resale, Non-Food Items For Resale, Beverages, Nonalcoholic, Dairy Foods and Eggs, and moreby Defense Commissary Agency, Department of Defense, Defense Logistics Agency, Navy, and others Signed by year:2000: $110,065; 2001: $481,275; 2002: $1,657,899; 2003: $1,184,389; 2004: $3,029,335; 2005: $5,192,428; 2006: $2,142,364.
Biggest contracts:
$2,307,286 with Defense Commissary Agency for Food Items For Resale. Signed on 2005-04-01. Completion date: 2005-08-31.
$2,111,344 with Defense Commissary Agency for Non-Food Items For Resale. Signed on 2006-01-01. Completion date: 2006-03-31.
$1,564,923 with Defense Commissary Agency for Food Items For Resale. Signed on 2004-10-01. Completion date: 2005-02-28.
$1,287,739 with Defense Commissary Agency for Non-Food Items For Resale. Signed on 2005-10-01. Completion date: 2005-12-31.
DEL REY SYSTEMS & TECHNOLOGY, (7844 CONVOY CT; small business) : $9,142,537 in 65 contractsfrom 2001 to 2006
Contracts for Logistics Support Services, Systems Engineering Services, Technical Representation Services -- Communication, Detection, and Coherent Radiation Equipment, Engineering and Technical Services, and moreby Navy Signed by year:2000: $0; 2001: $433,475; 2002: $153,427; 2003: $137,006; 2004: $1,739,531; 2005: $3,304,130; 2006: $3,374,968.
Biggest contracts:
$1,233,978 with Navy for Logistics Support Services. Signed on 2005-04-01. Completion date: 2005-09-30.
$1,042,555, same as above.Signed on 2006-01-01. Completion date: 2006-06-30.
$819,016, same as above.Signed on 2005-04-01. Completion date: 2005-09-30.
$803,439 with Navy for Systems Engineering Services. Signed on 2006-01-01. Completion date: 2006-11-30.
INSTRUMENTS INCORPORATED (7263 ENGINEER RD STE G; small business) : $7,722,631 in 69 contractsfrom 1999 to 2006
Contracts for Miscellaneous Communication Equipment, Amplifiers, Specialized Semiconductor, Microcircuit, and Printed Circuit Board Manufacturing Machinery, Miscellaneous Electric Power and Distribution Equipment, and moreby Navy Signed by year:2000: $649,498; 2001: $897,098; 2002: $923,598; 2003: $1,819,096; 2004: $1,966,944; 2005: $1,115,790; 2006: $189,760.
Biggest contracts:
$639,072 with Navy for Miscellaneous Communication Equipment. Signed on 2004-02-26. Completion date: 2004-08-31.
$580,000 with Navy for Amplifiers. Signed on 2003-02-12. Completion date: 2003-06-26.
$367,080 with Navy for Specialized Semiconductor, Microcircuit, and Printed Circuit Board Manufacturing Machinery. Taking place in VA. Signed on 2003-11-18. Completion date: 2004-05-31.
$351,092 with Navy for Miscellaneous Electric Power and Distribution Equipment. Signed on 2005-03-07. Completion date: 2006-08-26.
ENGINEERING PARTNERS THE INC (7670 OPPORTUNITY RD STE 16; small business) : $3,780,610 in 35 contractsfrom 1999 to 2006
Contracts for Other Architect and Engineering Services, Administrative and Service Buildings, Architect - Engineer Services (including landscaping, interior layout, and designing), Highways, Roads, Streets, Bridges, and Railways, and moreby Navy, Department of Veterans Affairs Signed by year:2000: $0; 2001: $0; 2002: $55,000; 2003: $0; 2004: $0; 2005: $1,150,743; 2006: $1,786,835.
Biggest contracts:
$1,223,645 with Navy for Other Architect and Engineering Services. Signed on 2006-04-21. Completion date: 2007-01-11.
$788,032 with Navy for Administrative and Service Buildings. Signed on 1999-12-21. Completion date: 2000-09-22.
$360,162 with Navy for Architect - Engineer Services (including landscaping, interior layout, and designing). Signed on 2005-11-03. Completion date: 2006-05-31.
$228,427, same as above.Signed on 2006-03-31. Completion date: 2006-12-31.
WINZLER & KELLY CONSULTING ENG (7825 ENGINEER ROAD, SUITE) : $3,751,596 in 71 contractsfrom 2002 to 2006
Contracts for Architect - Engineer Services (including landscaping, interior layout, and designing), Other Buildings, Construction of Structures and Facilities -- Other Non-Building Facilities, Engineering -- Basic Research (R&D) by Navy Signed by year:2000: $0; 2001: $0; 2002: $1,552,885; 2003: $2,002,995; 2004: $112,645; 2005: $9,157; 2006: $73,914.
Biggest contracts:
$434,179 with Navy for Architect - Engineer Services (including landscaping, interior layout, and designing). Signed on 2002-01-24. Completion date: 2003-06-18.
$315,763, same as above.Signed on 2002-09-11. Completion date: 2003-09-10.
$239,347, same as above.Signed on 2003-05-28. Completion date: 2004-02-27.
$227,406, same as above.Signed on 2002-09-23. Completion date: 2003-05-31.
THE TITAN CORPORATION (4855 RUFFNER ST STE A) : $2,906,581 in 13 contractsfrom 2003 to 2006
Contracts for Other Defense -- Applied Research and Exploratory Development (R&D), Miscellaneous Electric Power and Distribution Equipment, Physical Properties Testing and Inspection, Electron Tubes and Associated Hardware, and moreby Army Signed by year:2000: $0; 2001: $0; 2002: $0; 2003: $123,963; 2004: $59,256; 2005: $2,181,561; 2006: $541,801.
Biggest contracts:
$1,012,048 with Army for Other Defense -- Applied Research and Exploratory Development (R&D). Signed on 2005-07-12. Completion date: 2006-05-25.
$992,723, same as above.Signed on 2005-05-19. Completion date: 2006-05-25.
$541,801, same as above.Signed on 2006-06-07. Completion date: 2007-05-25.
$150,240, same as above.Signed on 2005-05-25. Completion date: 2006-05-25.
SYSTEMS ANALYSIS & INTEGRATION (8080 DAGGET STREET; small business) : $2,575,269 in 16 contractsfrom 1999 to 2003
Contracts for Miscellaneous Electrical and Electronic Components, ADP Input/Output and Storage Devices, Other ADP and Telecommunications Services (includes data storage on tapes, compact disks, etc.), ADP Support Equipment, and moreby U.S. Army Corps of Engineers - civil program financing only, Army Signed by year:2000: $407,000; 2001: $416,415; 2002: $367,611; 2003: $264,243; 2004: $0; 2005: $0; 2006: $0.
Biggest contracts:
$1,120,000 with U.S. Army Corps of Engineers - civil program financing only for Miscellaneous Electrical and Electronic Components. Taking place in SD. Signed on 1999-12-20. Completion date: 1998-12-31.
$401,592 with Army for Miscellaneous Electrical and Electronic Components. Signed on 2001-01-02. Completion date: 2001-09-30.
$257,000 with U.S. Army Corps of Engineers - civil program financing only for Miscellaneous Electrical and Electronic Components. Taking place in SD. Signed on 2000-09-07. Completion date: 2001-09-30.
$211,923 with U.S. Army Corps of Engineers - civil program financing only for ADP Input/Output and Storage Devices. Taking place in NE. Signed on 2003-03-20. Completion date: 2003-04-20.
Top industries in this zip code by the number of employees in 2005:
Administrative and Support and Waste Management and Remediation Services: Security Guards and Patrol Services (500-999 employees: 1 establishment, 250-499 employees: 1 establishment, 100-249 employees: 5 establishments, 20-49 employees: 3 establishments)
Administrative and Support and Waste Management and Remediation Services: Janitorial Services (500-999: 1, 250-499: 2, 100-249: 1, 50-99: 2, 20-49: 1, 10-19: 1, 5-9: 3, 1-4: 14)
Professional, Scientific, and Technical Services: Administrative Management and General Management Consulting Services (over 1000: 1, 10-19: 2, 5-9: 2, 1-4: 5)
Administrative and Support and Waste Management and Remediation Services: Temporary Help Services (250-499: 2, 100-249: 2, 50-99: 3, 20-49: 4, 10-19: 1, 5-9: 2)
2005 - 2018 National Fire Incident Reporting System (NFIRS) incidents
Based on the data from the years 2005 - 2018 the average number of fires per year is 46. The highest number of reported fires - 94 took place in 2017, and the least - 0 in 2006. The data has a rising trend.
When looking into fire subcategories, the most reports belonged to: Structure Fires (35.9%), and Outside Fires (34.8%).
Fire incident types reported to NFIRS in Zip Code 92111

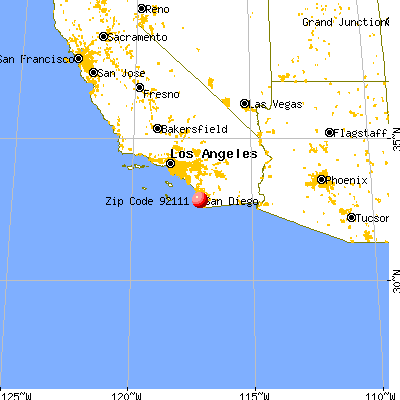


 Nearest zip codes: 92123, 92117, 92108, 92110, 92122, 92103.


 Based on the data from the years 2005 - 2018 the average number of fires per year is 46. The highest number of reported fires - 94 took place in 2017, and the least - 0 in 2006. The data has a rising trend.
 When looking into fire subcategories, the most reports belonged to: Structure Fires (35.9%), and Outside Fires (34.8%).