Estimated zip code population in 2022: 54,046 Zip code population in 2010: 51,332 Zip code population in 2000: 51,203
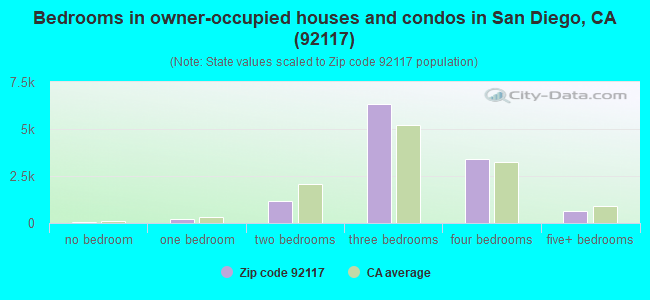
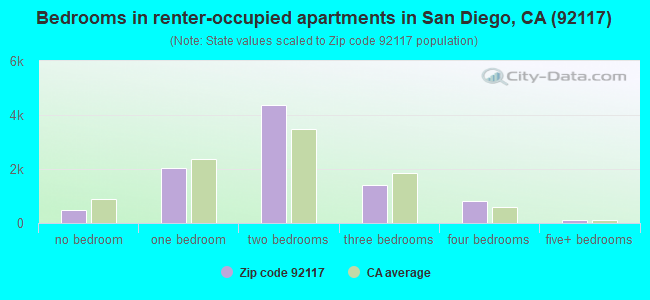
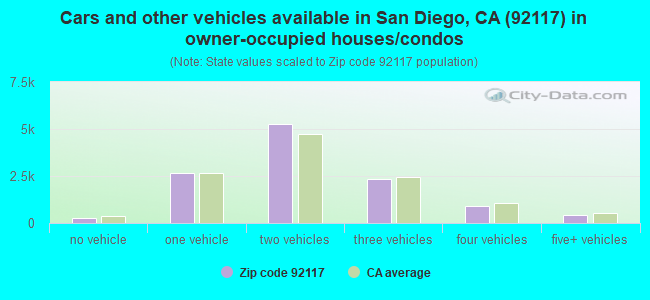
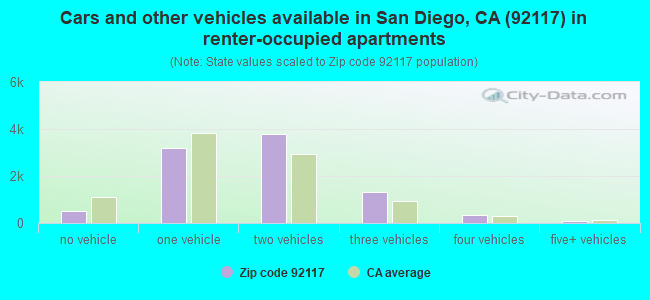
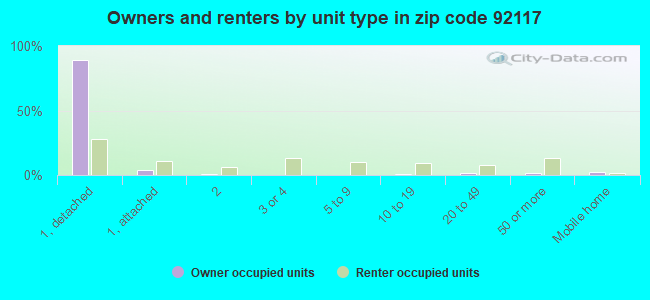
Houses and condos: 21,909 Renter-occupied apartments: 9,280
% of renters here:
44%
State:
44%
March 2022 cost of living index in zip code 92117: 123.8 (high, U.S. average is 100)
Land area: 8.8 sq. mi. Water area: 0.0 sq. mi.
Population density: 6,150 people per square mile
(high).
OSM Map
General Map
Google Map
MSN Map
OSM Map
General Map
Google Map
MSN Map
OSM Map
General Map
Google Map
MSN Map
OSM Map
General Map
Google Map
MSN Map
Please wait while loading the map...
Real estate property taxes paid for housing units in 2022:
This zip code:
0.5% ($4,165)
California:
0.7% ($4,831)
Median real estate property taxes paid for housing units with mortgages in 2022: $5,598 (0.6%) Median real estate property taxes paid for housing units with no mortgage in 2022: $2,362 (0.3%)
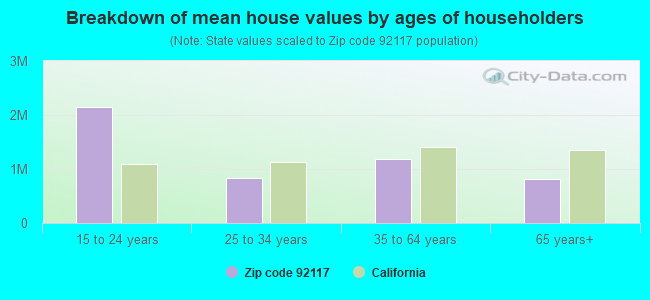
Estimated median house/condo value in 2022: $908,638
92117:
$908,638
California:
$715,900
According to our research of California and other state lists, there were 29 registered sex offenders living in 92117 zip code as of April 27, 2024. The ratio of all residents to sex offenders in zip code 92117 is 1,906 to 1. The ratio of registered sex offenders to all residents in this zip code is much lower than the state average.
Median resident age:
This zip code:
38.5 years
California median age:
37.9 years
Average household size:
This zip code:
2.6 people
California:
2.8 people
Averages for the 2020 tax year for zip code 92117, filed in 2021:
Average Adjusted Gross Income (AGI) in 2020: $81,970 (Individual Income Tax Returns)
Here:
$81,970
State:
$95,910
Salary/wage: $73,212 (reported on 78.5% of returns)
Here:
$73,212
State:
$77,331
(% of AGI for various income ranges: 1155.0% for AGIs below $25k, 3925.2% for AGIs $25k-50k, 6892.4% for AGIs $50k-75k, 10689.0% for AGIs $75k-100k, 20196.5% for AGIs $100k-200k, 81601.3% for AGIs over 200k)
Taxable interest for individuals: $1,200 (reported on 40.0% of returns)
This zip code:
$1,200
California:
$2,294
(% of AGI for various income ranges: 20.0% for AGIs below $25k, 32.1% for AGIs $25k-50k, 51.7% for AGIs $50k-75k, 85.8% for AGIs $75k-100k, 163.6% for AGIs $100k-200k, 666.5% for AGIs over 200k)
Ordinary dividends: $4,835 (reported on 26.2% of returns)
Here:
$4,835
State:
$10,949
(% of AGI for various income ranges: 36.8% for AGIs below $25k, 69.4% for AGIs $25k-50k, 118.6% for AGIs $50k-75k, 175.5% for AGIs $75k-100k, 451.4% for AGIs $100k-200k, 2106.2% for AGIs over 200k)
Net capital gain/loss in AGI: +$14,574 (reported on 24.8% of returns)
Here:
+$14,574
State:
+$49,306
(% of AGI for various income ranges: 17.8% for AGIs below $25k, 62.4% for AGIs $25k-50k, 141.2% for AGIs $50k-75k, 261.4% for AGIs $75k-100k, 722.8% for AGIs $100k-200k, 11271.3% for AGIs over 200k)
Profit/loss from business: +$14,183 (reported on 18.2% of returns)
Here:
+$14,183
State:
+$15,671
(% of AGI for various income ranges: 214.5% for AGIs below $25k, 214.6% for AGIs $25k-50k, 282.1% for AGIs $50k-75k, 431.8% for AGIs $75k-100k, 709.7% for AGIs $100k-200k, 3256.2% for AGIs over 200k)
Taxable individual retirement arrangement distribution: $18,524 (reported on 8.9% of returns)
92117:
$18,524
California:
$23,505
(% of AGI for various income ranges: 67.8% for AGIs below $25k, 104.2% for AGIs $25k-50k, 220.2% for AGIs $50k-75k, 347.7% for AGIs $75k-100k, 720.1% for AGIs $100k-200k, 1390.8% for AGIs over 200k)
Self-employed (Keogh) retirement plans: $22,057 (reported on 0.8% of returns)
92117:
$22,057
California:
$30,163
(% of AGI for various income ranges: 22.3% for AGIs $50k-75k, 50.9% for AGIs $100k-200k, 440.0% for AGIs over 200k)
Total itemized deductions: $31,929 (reported on 16.5% of returns)
Here:
$31,929
State:
$39,517
(% of AGI for various income ranges: 107.8% for AGIs below $25k, 205.3% for AGIs $25k-50k, 455.9% for AGIs $50k-75k, 931.6% for AGIs $75k-100k, 2214.6% for AGIs $100k-200k, 8035.4% for AGIs over 200k)
Charity contributions: $5,562 (reported on 13.0% of returns)
Here:
$5,562
State:
$12,598
(% of AGI for various income ranges: 3.9% for AGIs below $25k, 18.6% for AGIs $25k-50k, 38.5% for AGIs $50k-75k, 101.0% for AGIs $75k-100k, 272.9% for AGIs $100k-200k, 1537.0% for AGIs over 200k)
Taxes paid: $8,613 (reported on 16.4% of returns)
92117:
$8,613
State:
$8,807
(% of AGI for various income ranges: 20.2% for AGIs below $25k, 41.9% for AGIs $25k-50k, 115.6% for AGIs $50k-75k, 288.4% for AGIs $75k-100k, 686.7% for AGIs $100k-200k, 1870.0% for AGIs over 200k)
Earned income credit: $1,489 (reported on 9.4% of returns)
Here:
$1,489
State:
$2,074
(% of AGI for various income ranges: 51.4% for AGIs below $25k, 35.8% for AGIs $25k-50k, 0.5% for AGIs $50k-75k)
Percentage of individuals using paid preparers for their 2020 taxes: 92.6%
Here:
93%
State:
92%
(% for various income ranges: 90.4% for AGIs below $25k, 92.7% for AGIs $25k-50k, 92.8% for AGIs $50k-75k, 94.3% for AGIs $75k-100k, 93.6% for AGIs $100k-200k, 95.4% for AGIs over 200k)
Averages for the 2012 tax year for zip code 92117, filed in 2013:
Average Adjusted Gross Income (AGI) in 2012: $58,870 (Individual Income Tax Returns)
Here:
$58,870
State:
$72,726
Salary/wage: $53,354 (reported on 79.9% of returns)
Here:
$53,354
State:
$59,079
(% of AGI for various income ranges: 69.4% for AGIs below $25k, 77.1% for AGIs $25k-50k, 74.7% for AGIs $50k-75k, 75.4% for AGIs $75k-100k, 75.9% for AGIs $100k-200k, 58.3% for AGIs over 200k)
Taxable interest for individuals: $1,079 (reported on 40.3% of returns)
This zip code:
$1,079
California:
$2,146
(% of AGI for various income ranges: 1.1% for AGIs below $25k, 0.8% for AGIs $25k-50k, 0.8% for AGIs $50k-75k, 0.7% for AGIs $75k-100k, 0.6% for AGIs $100k-200k, 0.7% for AGIs over 200k)
Ordinary dividends: $3,922 (reported on 23.4% of returns)
Here:
$3,922
State:
$9,308
(% of AGI for various income ranges: 2.0% for AGIs below $25k, 1.3% for AGIs $25k-50k, 1.4% for AGIs $50k-75k, 1.4% for AGIs $75k-100k, 1.5% for AGIs $100k-200k, 2.1% for AGIs over 200k)
Net capital gain/loss in AGI: +$6,722 (reported on 19.4% of returns)
Here:
+$6,722
State:
+$30,460
(% of AGI for various income ranges: 0.1% for AGIs $25k-50k, 0.6% for AGIs $50k-75k, 0.6% for AGIs $75k-100k, 1.5% for AGIs $100k-200k, 9.4% for AGIs over 200k)
Profit/loss from business: +$13,306 (reported on 17.3% of returns)
Here:
+$13,306
State:
+$17,064
(% of AGI for various income ranges: 11.3% for AGIs below $25k, 4.8% for AGIs $25k-50k, 2.8% for AGIs $50k-75k, 3.2% for AGIs $75k-100k, 2.9% for AGIs $100k-200k, 3.3% for AGIs over 200k)
Taxable individual retirement arrangement distribution: $14,210 (reported on 10.4% of returns)
92117:
$14,210
California:
$19,557
(% of AGI for various income ranges: 3.2% for AGIs below $25k, 2.4% for AGIs $25k-50k, 2.5% for AGIs $50k-75k, 2.5% for AGIs $75k-100k, 2.6% for AGIs $100k-200k, 2.1% for AGIs over 200k)
Self-employment retirement plans: $16,995 (reported on 0.8% of returns)
92117:
$16,995
California:
$24,530
(% of AGI for various income ranges: 0.1% for AGIs $25k-50k, 0.1% for AGIs $75k-100k, 0.3% for AGIs $100k-200k, 0.6% for AGIs over 200k)
Total itemized deductions: $25,694 (24% of AGI, reported on 35.1% of returns)
Here:
$25,694
State:
$34,004
Here:
24.4% of AGI
State:
22.7% of AGI
(% of AGI for various income ranges: 10.6% for AGIs below $25k, 10.4% for AGIs $25k-50k, 14.2% for AGIs $50k-75k, 16.1% for AGIs $75k-100k, 17.9% for AGIs $100k-200k, 17.5% for AGIs over 200k)
Charity contributions: $2,742 (reported on 28.5% of returns)
Here:
$2,742
State:
$4,659
(% of AGI for various income ranges: 0.6% for AGIs below $25k, 0.9% for AGIs $25k-50k, 1.2% for AGIs $50k-75k, 1.4% for AGIs $75k-100k, 1.7% for AGIs $100k-200k, 1.4% for AGIs over 200k)
Taxes paid: $9,049 (reported on 34.9% of returns)
92117:
$9,049
State:
$14,448
(% of AGI for various income ranges: 1.8% for AGIs below $25k, 2.2% for AGIs $25k-50k, 3.7% for AGIs $50k-75k, 5.3% for AGIs $75k-100k, 7.0% for AGIs $100k-200k, 8.5% for AGIs over 200k)
Earned income credit: $1,672 (reported on 12.5% of returns)
Here:
$1,672
State:
$2,286
(% of AGI for various income ranges: 3.7% for AGIs below $25k, 0.5% for AGIs $25k-50k)
Percentage of individuals using paid preparers for their 2012 taxes: 54.1%
Here:
54%
State:
64%
(% for various income ranges: 50.6% for AGIs below $25k, 51.5% for AGIs $25k-50k, 55.4% for AGIs $50k-75k, 57.5% for AGIs $75k-100k, 60.2% for AGIs $100k-200k, 73.2% for AGIs over 200k)
Averages for the 2004 tax year for zip code 92117, filed in 2005:
Average Adjusted Gross Income (AGI) in 2004: $48,788 (Individual Income Tax Returns)
Here:
$48,788
State:
$58,600
Salary/wage: $44,076 (reported on 79.5% of returns)
Here:
$44,076
State:
$49,455
(% of AGI for various income ranges: 149.7% for AGIs below $10k, 70.6% for AGIs $10k-25k, 77.9% for AGIs $25k-50k, 75.9% for AGIs $50k-75k, 79.2% for AGIs $75k-100k, 61.8% for AGIs over 100k)
Taxable interest for individuals: $1,390 (reported on 52.0% of returns)
This zip code:
$1,390
California:
$2,365
(% of AGI for various income ranges: 7.8% for AGIs below $10k, 2.2% for AGIs $10k-25k, 1.3% for AGIs $25k-50k, 1.4% for AGIs $50k-75k, 1.0% for AGIs $75k-100k, 1.5% for AGIs over 100k)
Taxable dividends: $2,192 (reported on 27.0% of returns)
Here:
$2,192
State:
$4,746
(% of AGI for various income ranges: 7.0% for AGIs below $10k, 1.9% for AGIs $10k-25k, 1.0% for AGIs $25k-50k, 1.1% for AGIs $50k-75k, 1.1% for AGIs $75k-100k, 1.2% for AGIs over 100k)
Net capital gain/loss: +$14,658 (reported on 21.4% of returns)
Here:
+$14,658
State:
+$23,418
(% of AGI for various income ranges: 7.2% for AGIs below $10k, -0.3% for AGIs $10k-25k, 0.4% for AGIs $25k-50k, 0.8% for AGIs $50k-75k, 1.5% for AGIs $75k-100k, 16.2% for AGIs over 100k)
Profit/loss from business: +$14,200 (reported on 16.6% of returns)
Here:
+$14,200
State:
+$16,826
(% of AGI for various income ranges: 6.4% for AGIs below $10k, 8.0% for AGIs $10k-25k, 4.7% for AGIs $25k-50k, 4.1% for AGIs $50k-75k, 4.3% for AGIs $75k-100k, 4.6% for AGIs over 100k)
Profit/loss from farming: +$1,750 (reported on 0.1% of returns)
Here:
+$1,750
State:
-$7,562
IRA payment deduction: $2,986 (reported on 3.2% of returns)
92117:
$2,986
California:
$3,192
(% of AGI for various income ranges: 0.9% for AGIs below $10k, 0.3% for AGIs $10k-25k, 0.3% for AGIs $25k-50k, 0.2% for AGIs $50k-75k, 0.2% for AGIs $75k-100k, 0.1% for AGIs over 100k)
Self-employed pension: $12,787 (reported on 1.4% of returns)
Here:
$12,787
California:
$17,688
(% of AGI for various income ranges: 0.1% for AGIs $10k-25k, 0.2% for AGIs $25k-50k, 0.2% for AGIs $50k-75k, 0.5% for AGIs $75k-100k, 0.6% for AGIs over 100k)
Total itemized deductions: $21,983 (25% of AGI, reported on 36.0% of returns)
Here:
$21,983
State:
$28,113
Here:
25.4% of AGI
State:
25.3% of AGI
(% of AGI for various income ranges: 35.3% for AGIs below $10k, 11.9% for AGIs $10k-25k, 12.6% for AGIs $25k-50k, 17.7% for AGIs $50k-75k, 19.7% for AGIs $75k-100k, 16.7% for AGIs over 100k)
Charity contributions deductions: $2,524 (3% of AGI, reported on 31.6% of returns)
Here:
$2,524
State:
$3,923
Here:
2.8% of AGI
State:
3.3% of AGI
(% of AGI for various income ranges: 1.5% for AGIs below $10k, 0.9% for AGIs $10k-25k, 1.2% for AGIs $25k-50k, 1.8% for AGIs $50k-75k, 2.0% for AGIs $75k-100k, 1.8% for AGIs over 100k)
Total tax: $7,018 (reported on 81.7% of returns)
92117:
$7,018
State:
$10,761
(% of AGI for various income ranges: 6.0% for AGIs below $10k, 5.0% for AGIs $10k-25k, 8.0% for AGIs $25k-50k, 9.9% for AGIs $50k-75k, 11.0% for AGIs $75k-100k, 16.8% for AGIs over 100k)
Earned income credit: $1,351 (reported on 9.7% of returns)
Here:
$1,351
State:
$1,763
Percentage of individuals using paid preparers for their 2004 taxes: 56.2%
Here:
56%
State:
66%
(% for various income ranges: 48.9% for AGIs below $10k, 54.9% for AGIs $10k-25k, 54.9% for AGIs $25k-50k, 58.7% for AGIs $50k-75k, 60.5% for AGIs $75k-100k, 66.7% for AGIs over 100k)
Likely homosexual households (counted as self-reported same-sex unmarried-partner households)
Lesbian couples: 0.3% of all households
Gay men: 0.0% of all households
Household received Food Stamps/SNAP in the past 12 months: 2,124 Household did not receive Food Stamps/SNAP in the past 12 months: 18,870
Women who had a birth in the past 12 months: 378 (360 now married, 16 unmarried) Women who did not have a birth in the past 12 months: 12,573 (5,169 now married, 7,396 unmarried)
Housing units in zip code 92117 with a mortgage: 6,999 (665 second mortgage, 15 home equity loan, 499 both second mortgage and home equity loan) Median monthly owner costs for units with a mortgage: $2,893 Median monthly owner costs for units without a mortgage: $617
Residents with income below the poverty level in 2022:
This zip code:
9.5%
Whole state:
12.2%
Residents with income below 50% of the poverty level in 2022:
This zip code:
4.0%
Whole state:
6.2%
Median number of rooms in houses and condos:
Here:
5.7
State:
6.0
Median number of rooms in apartments:
Here:
4.1
State:
3.9
Notable locations in this zip code not listed on our city pages
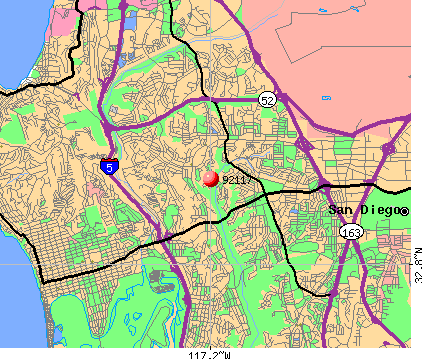
Notable locations in zip code 92117: Diane Center (A), Pacific Beach (B), North Clairemont Branch San Diego Public Library (C), Balboa Branch San Diego Public Library (D), Clairmont Branch San Diego Public Library (E), Schaefer Ambulance Service (F), San Diego Fire - Rescue Department Station 36 (G), San Diego Fire - Rescue Department Station 27 (H). Display/hide their locations on the map
Shopping Centers: Clairemont Town Square Shopping Center (1), Liberty Park Plaza Shopping Center (2), Madison Square Shopping Center (3), Clairemont Square Shopping Center (4), Genesee Plaza Shopping Center (5), Diane Village Shopping Center (6), Clairemont Village Shopping Center (7). Display/hide their locations on the map
Churches in zip code 92117 include: Church of Christ (A), The Church of Jesus Christ of Latter Day Saints (B), Church of the Nazarene (C), Clairemont Church of God (D), East Clairemont Southern Baptist Church (E), Eight Church of Christ Scientist (F), First Chinese Southern Baptist Church (G), First Southern Baptist Church (H), Full Gospel Temple (I). Display/hide their locations on the map
Parks in zip code 92117 include: Mount Etna Park (1), Olive Grove Park (2), San Clemente Park (3), Cadman Park and Recreation Center (4), Gershwin Park (5), Clairmont Park (6), Clairmont Park Recreation Center (7), Tecolate Canyon Natural Park (8). Display/hide their locations on the map
Tourist attraction (not listed on the city page) : AquaCessories International (Arcades & Amusements; 4141 Jutland Drive).
5,886 married couples with children.
2,582 single-parent households (768 men, 1,814 women).
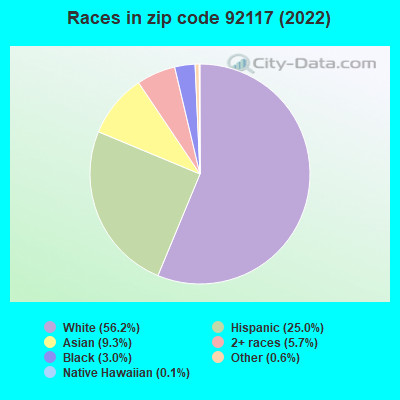
72.5% of residents of 92117 zip code speak English at home.
15.8% of residents speak Spanish at home (68% very well, 14% well, 14% not well, 4% not at all).
4.6% of residents speak other Indo-European language at home (66% very well, 27% well, 6% not well).
5.8% of residents speak Asian or Pacific Island language at home (51% very well, 27% well, 15% not well, 7% not at all).
1.0% of residents speak other language at home (73% very well, 24% well, 3% not well).
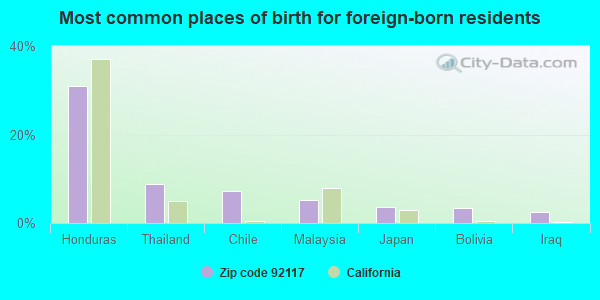
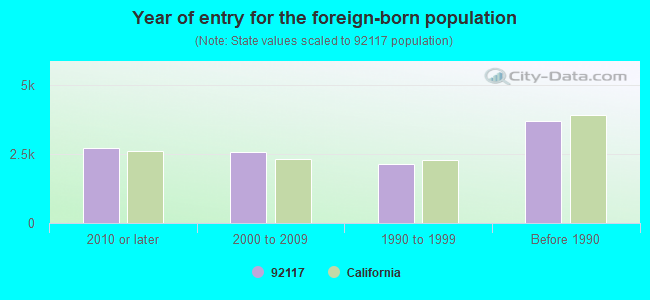
Foreign born population: 10,114 (18.7%) (55.7% of them are naturalized citizens)
Major facilities with environmental interests located in this zip code:
MR BEST CLEANERS (4415 GENESEE AVE in SAN DIEGO, CA)
STATE MASTER (California - Hazardous Waste Tracking) - HAZARDOU WASTE PROGRAM CRITERIA AND HAZARDOUS AIR POLLUTANT INVENTORY (Inventory of air pollution sources) Small Quantity Generators, between 100 kg and 1000 kg of hazardous waste/month (Resource Conservation and Recovery Act (tracking hazardous waste)) - notification Business SIC classification: DRYCLEANING PLANTS, EXCEPT RUG CLEANING Organizations: BRAD SAUCIER (CONTACT/OWNER)
ARCO #9576 (4202 CLAIREMONT MESA BOULEVARD in SAN DIEGO, CA)
STATE MASTER (California - Hazardous Waste Tracking) - HAZARDOU WASTE PROGRAM CRITERIA AND HAZARDOUS AIR POLLUTANT INVENTORY (Inventory of air pollution sources) Small Quantity Generators, between 100 kg and 1000 kg of hazardous waste/month (Resource Conservation and Recovery Act (tracking hazardous waste)) - notification Business SIC classification: GASOLINE SERVICE STATIONS Organizations: B P WEST COAST PRODUCTS L L C (CONTACT/OWNER)
Alternative names: ARCO FACILITY NO 09576, BP WEST COAST PRODUCTS LLC 09576, PRESTIGE STATIONS INC NO 9576
HOME DEPOT #680 THE (4255 GENESSEE in SAN DIEGO, CA)
STATE MASTER (California - Hazardous Waste Tracking) - HAZARDOU WASTE PROGRAM Small Quantity Generators, between 100 kg and 1000 kg of hazardous waste/month (Resource Conservation and Recovery Act (tracking hazardous waste)) - notification Organizations: HOME DEPOT USA (CONTACT/OPERATOR)
ANGEL PAINTING (4605 BANNOCK AVE in SAN DIEGO, CA)
STATE MASTER (California - Hazardous Waste Tracking) - HAZARDOU WASTE PROGRAM Small Quantity Generators, between 100 kg and 1000 kg of hazardous waste/month (Resource Conservation and Recovery Act (tracking hazardous waste)) - notification Organizations: GABRIEL W SLATTON (CONTACT/OWNER)
NORTH COUNTY TRANSIT DIST (755 NORLAK in SAN DIEGO, CA)
STATE MASTER (California - Hazardous Waste Tracking) - HAZARDOU WASTE PROGRAM Small Quantity Generators, between 100 kg and 1000 kg of hazardous waste/month (Resource Conservation and Recovery Act (tracking hazardous waste))
EXXONMOBIL OIL CORP. (4505 CLAIREMONT MESA BLVD in SAN DIEGO, CA)
CRITERIA AND HAZARDOUS AIR POLLUTANT INVENTORY (Inventory of air pollution sources) HAZARDOUS WASTE BIENNIAL REPORTER (Resource Conservation and Recovery Act (tracking hazardous waste)) Large Quantity Generators, more that 1000 kg of hazardous waste/month (Resource Conservation and Recovery Act (tracking hazardous waste)) Small Quantity Generators, between 100 kg and 1000 kg of hazardous waste/month (Resource Conservation and Recovery Act (tracking hazardous waste)) - notification Business SIC classification: GASOLINE SERVICE STATIONS Organizations: FAHED SWEIS (CONTACT/OWNER)
, EXXONMOBIL OIL CORPORATION (CONTACT/OWNER)
Alternative names: GENESEE MOBIL, MOBIL / 4505 CLAIREMONT MESA B
FIELD ELEMENTARY (4375 BANNOCK AVE. in SAN DIEGO, CA)
(National Center for Education Statistics) - STATE ID-6039556 Organizations: SAN DIEGO UNIFIED (SCHOOL DISTRICT)
HAWTHORNE ELEMENTARY (4750 LEHRER DR. in SAN DIEGO, CA)
(National Center for Education Statistics) - STATE ID-6039721 Organizations: SAN DIEGO UNIFIED (SCHOOL DISTRICT)
KROC MIDDLE (5050 CONRAD AVE. in SAN DIEGO, CA)
(National Center for Education Statistics) - STATE ID-6059612 Organizations: SAN DIEGO UNIFIED (SCHOOL DISTRICT)
LAFAYETTE ELEMENTARY (6125 PRINTWOOD WAY in SAN DIEGO, CA)
(National Center for Education Statistics) - STATE ID-6039853 Organizations: SAN DIEGO UNIFIED (SCHOOL DISTRICT)
MACDOWELL (EDWARD A) ELEMENTARY (5095 ARVINELS AVE. in SAN DIEGO, CA)
(National Center for Education Statistics) - STATE ID-6039937 Organizations: SAN DIEGO UNIFIED (SCHOOL DISTRICT)
MADISON SENIOR HIGH (4833 DOLIVA DR. in SAN DIEGO, CA)
(National Center for Education Statistics) - STATE ID-3733698 Organizations: SAN DIEGO UNIFIED (SCHOOL DISTRICT)
MARSTON MIDDLE (3799 CLAIREMONT DR. in SAN DIEGO, CA)
(National Center for Education Statistics) - STATE ID-6059653 Organizations: SAN DIEGO UNIFIED (SCHOOL DISTRICT)
Housing units lacking complete plumbing facilities: 0.0% Housing units lacking complete kitchen facilities: 0.6%
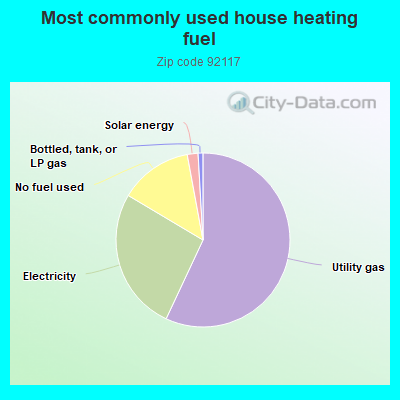
56.8%Utility gas
26.5%Electricity
13.5%No fuel used
2.0%Solar energy
0.9%Bottled, tank, or LP gas
Population in 1990: 49,737. Population change in the 1990s: +1,466 (+2.9%).
Place of birth for U.S.-born residents:
This state: 28,513
Northeast: 3,209
Midwest: 4,963
South: 3,149
West: 2,862
57% of the 92117 zip code residents lived in the same house 5 years ago. Out of people who lived in different houses, 70% lived in this county. Out of people who lived in different counties, 50% lived in California.
88% of the 92117 zip code residents lived in the same house 1 year ago. Out of people who lived in different houses, 68% moved from this county. Out of people who lived in different houses, 13% moved from different county within same state. Out of people who lived in different houses, 14% moved from different state. Out of people who lived in different houses, 3% moved from abroad.
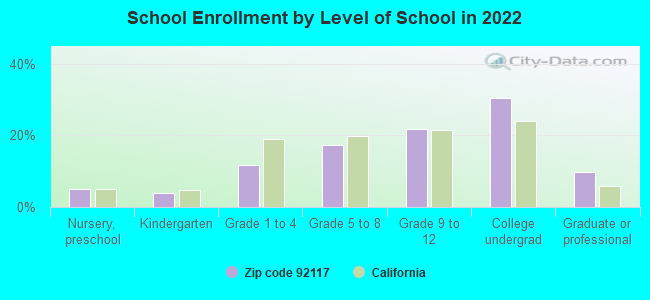
Private vs. public school enrollment:
Students in private schools in grades 1 to 8 (elementary and middle school): 229
Here:
6.5%
California:
10.5%
Students in private schools in grades 9 to 12 (high school): 91
Here:
3.4%
California:
8.5%
Students in private undergraduate colleges: 536
Here:
14.3%
California:
15.9%
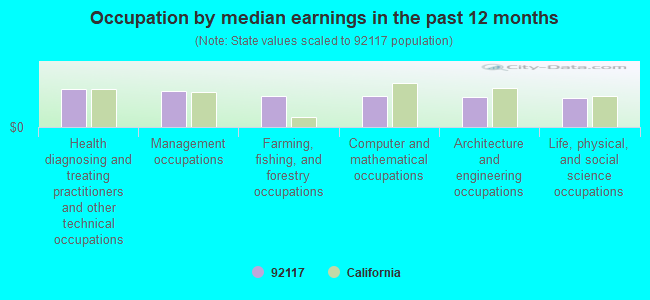
Occupation by median earnings in the past 12 months ($)
109,970Health diagnosing and treating practitioners and other technical occupations
102,945Management occupations
89,648Farming, fishing, and forestry occupations
88,276Computer and mathematical occupations
87,268Architecture and engineering occupations
83,689Life, physical, and social science occupations
Companies with biggest federal contracts located in this zip code (SAN DIEGO, CA):
MARATHON CONSTRUCTION CORPORAT (3052 CLAIREMONT DR; small business) : $39,856,340 in 76 contractsfrom 2000 to 2006
Contracts for Maintenance, Repair or Alteration of Real Property -- Other Non-Building Facilities, Construction of Structures and Facilities -- Ship Construction and Repair Facilities, Construction of Structures and Facilities -- Other Non-Building Facilities, Maintenance, Repair or Alteration of Real Property -- Dredging, and moreby Navy, U.S. Army Corps of Engineers - civil program financing only, Bureau of Reclamation Signed by year:2000: $2,626,158; 2001: $5,746,753; 2002: $446,928; 2003: $18,765,428; 2004: $3,577,843; 2005: $6,152,771; 2006: $2,540,459.
Biggest contracts:
$16,770,000 with Navy for Maintenance, Repair or Alteration of Real Property -- Other Non-Building Facilities. Signed on 2003-09-24. Completion date: 2006-05-26.
$3,530,703, same as above.Signed on 2001-12-03. Completion date: 2003-02-17.
$2,477,000 with Navy for Construction of Structures and Facilities -- Ship Construction and Repair Facilities. Taking place in WA. Signed on 2006-05-02. Completion date: 2006-10-25.
$1,832,000 with Navy for Maintenance, Repair or Alteration of Real Property -- Other Non-Building Facilities. Signed on 2005-03-31. Completion date: 2005-11-26.
COFFMAN SPECIALTIES,INC (4375) : $22,332,506 in 32 contractsfrom 2000 to 2006
Contracts for Maintenance, Repair or Alteration of Real Property -- Airport Runways, Maintenance, Repair or Alteration of Real Property -- Highways, Roads, Streets, Bridges, and Railways (includes resurfacing), Maintenance, Repair or Alteration of Real Property -- Other Non-Building Facilities, Maintenance, Repair or Alteration of Real Property -- Other Airfield Structures by Navy, Air Force Signed by year:2000: $1,219,993; 2001: $7,538,973; 2002: $10,060,411; 2003: $174,997; 2004: $123,288; 2005: $2,860,000; 2006: $354,844.
Biggest contracts:
$7,485,000 with Navy for Maintenance, Repair or Alteration of Real Property -- Airport Runways. Taking place in AZ. Signed on 2001-08-30. Completion date: 2002-08-30.
$5,885,000, same as above.Signed on 2002-02-01. Completion date: 2003-09-09.
$2,885,000 with Navy for Maintenance, Repair or Alteration of Real Property -- Highways, Roads, Streets, Bridges, and Railways (includes resurfacing). Signed on 2005-09-22. Completion date: 2006-04-30.
$2,445,000 with Navy for Maintenance, Repair or Alteration of Real Property -- Airport Runways. Taking place in AZ. Signed on 2002-12-23. Completion date: 2003-09-19.
CEA TECHNOLOGIES, INC (4901 MORENA BLVD, SUITE 13; small business) : $7,136,406 in 37 contractsfrom 1999 to 2005
Contracts for Defense Electronics and Communication Equipment -- Operational Systems Development (R&D), Miscellaneous Alarm, Signal and Security Detection Systems, Systems Engineering Services, Maintenance, Repair and Rebuilding of Equipment -- Communication, Detection, and Coherent Radiation Equipment, and moreby Navy Signed by year:2000: $3,036,768; 2001: $1,139,725; 2002: $1,443,098; 2003: $199,845; 2004: $1,170,759; 2005: $118,951; 2006: $0.
Biggest contracts:
$2,312,074 with Navy for Defense Electronics and Communication Equipment -- Operational Systems Development (R&D). Signed on 2000-04-12. Completion date: 2001-04-11.
$1,233,574 with Navy for Miscellaneous Alarm, Signal and Security Detection Systems. Signed on 2002-04-10. Completion date: 2003-04-09.
$479,842 with Navy for Defense Electronics and Communication Equipment -- Operational Systems Development (R&D). Taking place in TX. Signed on 2004-09-23. Completion date: 2005-09-22.
$427,938 with Navy for Systems Engineering Services. Signed on 2000-09-29. Completion date: 2000-09-29.
SUNDT CONSTRUCTION, INC , SOUT (4375 JUTLAND DR STE 200) : $5,695,805 in 15 contractsfrom 1999 to 2005
Contracts for Construction of Structures and Facilities -- Other Industrial Buildings, Construction of Structures and Facilities -- Water Supply Facilities, Construction of Structures and Facilities -- Other Conservation and Development Facilities, Maintenance, Repair or Alteration of Real Property -- Other Industrial Buildings by Navy, Army Signed by year:2000: $64,703; 2001: $3,312,642; 2002: -$7,851; 2003: $25,000; 2004: $57,977; 2005: $246,334; 2006: $0.
Biggest contracts:
$3,312,642 with Navy for Construction of Structures and Facilities -- Other Industrial Buildings. Signed on 2001-05-17. Completion date: 2002-07-12.
$1,997,000 with Navy for Construction of Structures and Facilities -- Water Supply Facilities. Signed on 1999-11-24. Completion date: 2000-09-04.
$246,334 with Navy for Construction of Structures and Facilities -- Other Industrial Buildings. Signed on 2005-11-16. Completion date: 2004-11-03.
$50,000, same as above.Signed on 2001-01-30. Completion date: 2002-01-30.
ALFFER CONSULTING (4802 LIEBEL CT; small business) : $1,818,770 in 26 contractsfrom 1999 to 2005
Contracts for Program Management/Support Services, Other Management Support Services, Other Professional Services, Other ADP and Telecommunications Services (includes data storage on tapes, compact disks, etc.) by Navy, Minerals Management Service Signed by year:2000: $332,654; 2001: $604,551; 2002: $32,000; 2003: $223,356; 2004: $262,047; 2005: $347,539; 2006: $0.
Biggest contracts:
$200,000 with Navy for Program Management/Support Services. Signed on 2005-09-26. Completion date: 2006-09-25.
$181,356 with Navy for Other Management Support Services. Signed on 2003-09-24. Completion date: 2004-09-28.
$180,894 with Navy for Program Management/Support Services. Signed on 2004-09-30. Completion date: 2005-09-30.
$180,000 with Navy for Other Management Support Services. Signed on 2001-09-29. Completion date: 2002-09-30.
N A I T , INC (4901 MORENA BLVD SUITE 401; small business) : $1,799,980 in 33 contractsfrom 2001 to 2006
Contracts for Other ADP and Telecommunications Services (includes data storage on tapes, compact disks, etc.), Facilities Operations Support Services by Federal Technology Service, Navy Signed by year:2000: $0; 2001: $202,000; 2002: $480,462; 2003: $50,000; 2004: $478,809; 2005: $528,709; 2006: $60,000.
Biggest contracts:
$288,462 with Federal Technology Service for Other ADP and Telecommunications Services (includes data storage on tapes, compact disks, etc.). Signed on 2002-10-15. Completion date: 2003-06-15.
$97,050 with Navy for Facilities Operations Support Services. Signed on 2005-08-08. Completion date: 2005-12-31.
$96,075, same as above.Signed on 2005-08-08. Completion date: 2005-12-31.
$96,000 with Federal Technology Service for Other ADP and Telecommunications Services (includes data storage on tapes, compact disks, etc.). Signed on 2002-07-15. Completion date: 2002-07-15.
SILVER BULLET SOLUTIONS INC (4747 MORENA BLVD STE 350; small business) : $1,173,537 in 10 contractsfrom 2000 to 2005
Contracts for Defense Electronics and Communication Equipment -- Applied Research and Exploratory Development (R&D), Defense Electronics and Communication Equipment -- Advanced Development (R&D), R&D-OTHER R & D-COMERCLIZ, Mathematical and Computer Sciences -- Basic Research (R&D) by Navy Signed by year:2000: $396,793; 2001: $156,978; 2002: -$80,002; 2003: $0; 2004: $99,939; 2005: $599,829; 2006: $0.
Biggest contracts:
$599,829 with Navy for Defense Electronics and Communication Equipment -- Applied Research and Exploratory Development (R&D). Signed on 2005-07-21. Completion date: 2007-07-25.
$250,000 with Navy for Defense Electronics and Communication Equipment -- Advanced Development (R&D). Signed on 2000-07-13. Completion date: 2005-07-12.
$169,998, same as above.Signed on 2002-09-04. Completion date: 2003-07-30.
$156,978, same as above.Signed on 2001-01-31. Completion date: 2001-08-30.
JON D BILLIG (5073 MT DURBAN DR; small business) : $1,013,952 in 6 contractsfrom 2000 to 2006
Contracts for Library Services by Navy Signed by year:2000: $753,336; 2001: $0; 2002: $0; 2003: $84,120; 2004: $85,128; 2005: $85,920; 2006: $5,448.
Biggest contracts:
$753,336 with Navy for Library Services. Signed on 2000-09-29. Completion date: 2001-09-30.
$85,920, same as above.Signed on 2005-08-23. Completion date: 2004-09-30.
$85,128, same as above.Signed on 2004-08-12. Completion date: 2004-09-30.
$84,120, same as above.Signed on 2003-09-17. Completion date: 2004-09-30.
MAGCANICA, INC (4204 JUTLAND DRIVE; small business) : $833,500 in 3 contractsfrom 2001 to 2003
$465,000 with Navy for Engineering -- Applied Research and Exploratory Development (R&D). Signed on 2002-12-31. Completion date: 2004-12-31.
$300,000, same as above.Signed on 2003-08-01. Completion date: 2004-12-31.
$68,500 with Navy for Defense Electronics and Communication Equipment -- Applied Research and Exploratory Development (R&D). Signed on 2001-06-01. Completion date: 2001-12-01.
COHEN, RONALD (6831 BOXFORD DR; small business) : $756,848 in 4 contractsfrom 2003 to 2005
$222,560 with Navy for General Health Care Services. Signed on 2005-10-19. Completion date: 2005-09-30.
$215,064, same as above.Signed on 2004-10-14. Completion date: 2005-09-30.
$207,504, same as above.Signed on 2003-10-01. Completion date: 2004-09-30.
$111,720, same as above.Signed on 2003-03-03. Completion date: 2003-09-30.
Top industries in this zip code by the number of employees in 2005:
Professional, Scientific, and Technical Services: Other Services Related to Advertising (over 1000 employees: 1 establishment, 1-4 employees: 2 establishments)
Administrative and Support and Waste Management and Remediation Services: Temporary Help Services (250-499: 1, 100-249: 3, 20-49: 1, 10-19: 1, 5-9: 2, 1-4: 2)
2005 - 2018 National Fire Incident Reporting System (NFIRS) incidents
Based on the data from the years 2005 - 2018 the average number of fires per year is 44. The highest number of reported fires - 87 took place in 2011, and the least - 0 in 2006. The data has a rising trend.
When looking into fire subcategories, the most reports belonged to: Structure Fires (39.0%), and Outside Fires (31.9%).
Fire incident types reported to NFIRS in Zip Code 92117


+$1,750
-$7,562
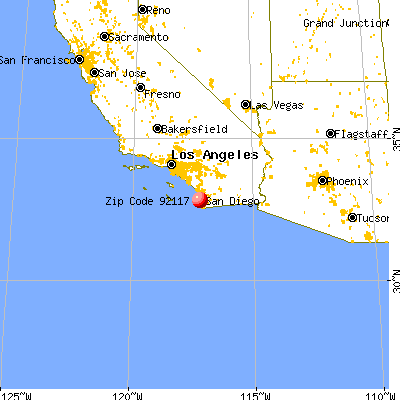
 Nearest zip codes: 92111, 92122, 92109, 92110, 92037, 92123.
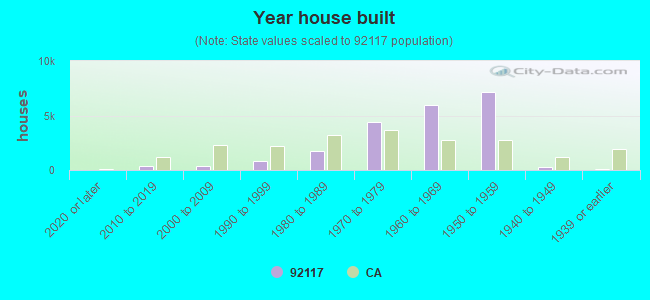


 Based on the data from the years 2005 - 2018 the average number of fires per year is 44. The highest number of reported fires - 87 took place in 2011, and the least - 0 in 2006. The data has a rising trend.
 When looking into fire subcategories, the most reports belonged to: Structure Fires (39.0%), and Outside Fires (31.9%).