Estimated zip code population in 2022: 45,606 Zip code population in 2010: 43,728 Zip code population in 2000: 34,891
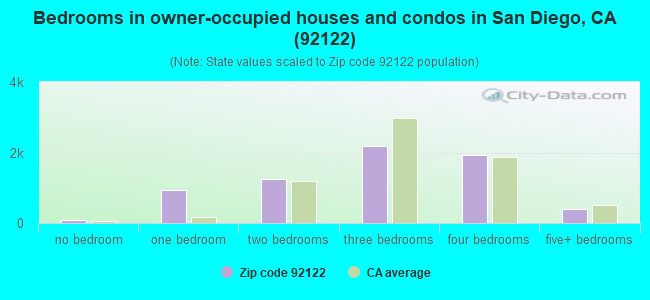
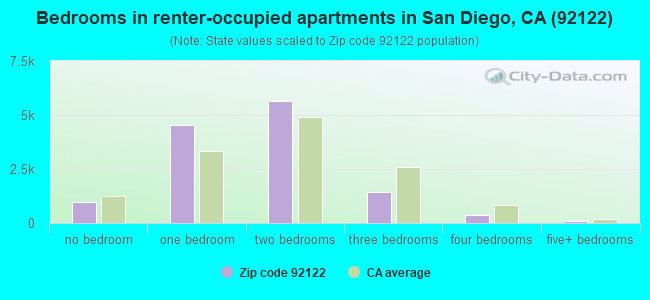
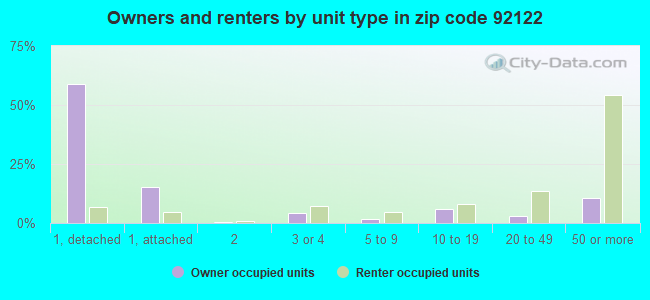
Houses and condos: 21,424 Renter-occupied apartments: 13,108
% of renters here:
66%
State:
44%
March 2022 cost of living index in zip code 92122: 126.0 (high, U.S. average is 100)
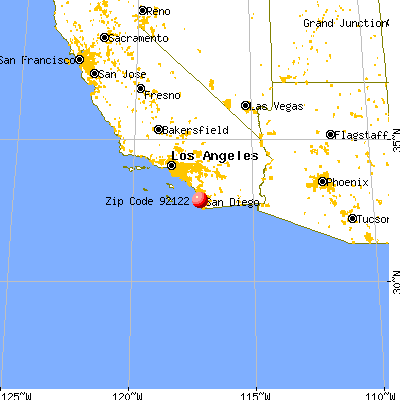
Land area: 15.9 sq. mi. Water area: 0.0 sq. mi.
Population density: 2,864 people per square mile
(average).
OSM Map
General Map
Google Map
MSN Map
OSM Map
General Map
Google Map
MSN Map
OSM Map
General Map
Google Map
MSN Map
OSM Map
General Map
Google Map
MSN Map
Please wait while loading the map...
Real estate property taxes paid for housing units in 2022:
This zip code:
0.6% ($5,885)
California:
0.7% ($4,831)
Median real estate property taxes paid for housing units with mortgages in 2022: $6,907 (0.7%) Median real estate property taxes paid for housing units with no mortgage in 2022: $4,564 (0.5%)
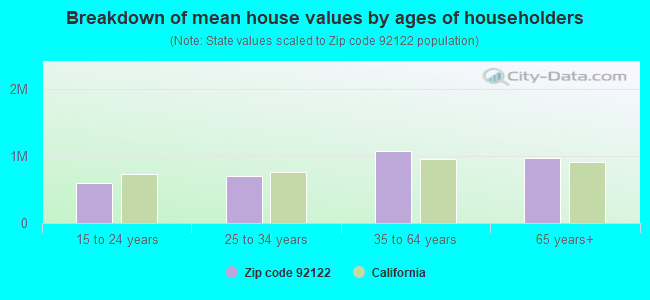
Estimated median house/condo value in 2022: $971,509
92122:
$971,509
California:
$715,900
According to our research of California and other state lists, there were 9 registered sex offenders living in 92122 zip code as of April 26, 2024. The ratio of all residents to sex offenders in zip code 92122 is 5,332 to 1. The ratio of registered sex offenders to all residents in this zip code is much lower than the state average.
Median resident age:
This zip code:
31.5 years
California median age:
37.9 years
Average household size:
This zip code:
2.3 people
California:
2.8 people
Averages for the 2020 tax year for zip code 92122, filed in 2021:
Average Adjusted Gross Income (AGI) in 2020: $109,589 (Individual Income Tax Returns)
Here:
$109,589
State:
$95,910
Salary/wage: $92,282 (reported on 78.1% of returns)
Here:
$92,282
State:
$77,331
(% of AGI for various income ranges: 1100.9% for AGIs below $25k, 3774.5% for AGIs $25k-50k, 6856.1% for AGIs $50k-75k, 10348.2% for AGIs $75k-100k, 19892.6% for AGIs $100k-200k, 91187.9% for AGIs over 200k)
Taxable interest for individuals: $2,193 (reported on 44.5% of returns)
This zip code:
$2,193
California:
$2,294
(% of AGI for various income ranges: 35.8% for AGIs below $25k, 58.9% for AGIs $25k-50k, 83.0% for AGIs $50k-75k, 104.1% for AGIs $75k-100k, 240.9% for AGIs $100k-200k, 1295.9% for AGIs over 200k)
Ordinary dividends: $8,256 (reported on 38.5% of returns)
Here:
$8,256
State:
$10,949
(% of AGI for various income ranges: 63.9% for AGIs below $25k, 126.0% for AGIs $25k-50k, 201.4% for AGIs $50k-75k, 308.2% for AGIs $75k-100k, 759.0% for AGIs $100k-200k, 5051.1% for AGIs over 200k)
Net capital gain/loss in AGI: +$25,113 (reported on 37.7% of returns)
Here:
+$25,113
State:
+$49,306
(% of AGI for various income ranges: 22.0% for AGIs below $25k, 94.9% for AGIs $25k-50k, 162.9% for AGIs $50k-75k, 404.9% for AGIs $75k-100k, 949.9% for AGIs $100k-200k, 23300.0% for AGIs over 200k)
Profit/loss from business: +$19,007 (reported on 15.7% of returns)
Here:
+$19,007
State:
+$15,671
(% of AGI for various income ranges: 104.9% for AGIs below $25k, 220.9% for AGIs $25k-50k, 235.9% for AGIs $50k-75k, 304.3% for AGIs $75k-100k, 643.6% for AGIs $100k-200k, 4222.0% for AGIs over 200k)
Taxable individual retirement arrangement distribution: $28,205 (reported on 9.7% of returns)
92122:
$28,205
California:
$23,505
(% of AGI for various income ranges: 58.0% for AGIs below $25k, 114.1% for AGIs $25k-50k, 247.6% for AGIs $50k-75k, 434.6% for AGIs $75k-100k, 802.1% for AGIs $100k-200k, 3316.9% for AGIs over 200k)
Self-employed (Keogh) retirement plans: $27,632 (reported on 1.2% of returns)
92122:
$27,632
California:
$30,163
(% of AGI for various income ranges: 29.1% for AGIs $50k-75k, 56.7% for AGIs $100k-200k, 721.6% for AGIs over 200k)
Total itemized deductions: $37,628 (reported on 16.6% of returns)
Here:
$37,628
State:
$39,517
(% of AGI for various income ranges: 146.3% for AGIs below $25k, 250.2% for AGIs $25k-50k, 451.4% for AGIs $50k-75k, 805.4% for AGIs $75k-100k, 1771.4% for AGIs $100k-200k, 8342.9% for AGIs over 200k)
Charity contributions: $9,870 (reported on 13.4% of returns)
Here:
$9,870
State:
$12,598
(% of AGI for various income ranges: 7.6% for AGIs below $25k, 20.2% for AGIs $25k-50k, 60.0% for AGIs $50k-75k, 108.6% for AGIs $75k-100k, 271.9% for AGIs $100k-200k, 2553.9% for AGIs over 200k)
Taxes paid: $8,404 (reported on 16.4% of returns)
92122:
$8,404
State:
$8,807
(% of AGI for various income ranges: 26.2% for AGIs below $25k, 45.8% for AGIs $25k-50k, 97.6% for AGIs $50k-75k, 222.2% for AGIs $75k-100k, 444.4% for AGIs $100k-200k, 1663.9% for AGIs over 200k)
Earned income credit: $1,288 (reported on 5.9% of returns)
Here:
$1,288
State:
$2,074
(% of AGI for various income ranges: 29.8% for AGIs below $25k, 23.5% for AGIs $25k-50k)
Percentage of individuals using paid preparers for their 2020 taxes: 93.3%
Here:
93%
State:
92%
(% for various income ranges: 91.2% for AGIs below $25k, 94.2% for AGIs $25k-50k, 93.3% for AGIs $50k-75k, 93.3% for AGIs $75k-100k, 94.1% for AGIs $100k-200k, 94.7% for AGIs over 200k)
Averages for the 2012 tax year for zip code 92122, filed in 2013:
Average Adjusted Gross Income (AGI) in 2012: $86,543 (Individual Income Tax Returns)
Here:
$86,543
State:
$72,726
Salary/wage: $75,786 (reported on 78.9% of returns)
Here:
$75,786
State:
$59,079
(% of AGI for various income ranges: 74.2% for AGIs below $25k, 77.3% for AGIs $25k-50k, 74.2% for AGIs $50k-75k, 75.9% for AGIs $75k-100k, 73.9% for AGIs $100k-200k, 58.1% for AGIs over 200k)
Taxable interest for individuals: $2,311 (reported on 48.4% of returns)
This zip code:
$2,311
California:
$2,146
(% of AGI for various income ranges: 2.2% for AGIs below $25k, 1.3% for AGIs $25k-50k, 1.2% for AGIs $50k-75k, 1.0% for AGIs $75k-100k, 1.0% for AGIs $100k-200k, 1.7% for AGIs over 200k)
Ordinary dividends: $7,429 (reported on 34.9% of returns)
Here:
$7,429
State:
$9,308
(% of AGI for various income ranges: 4.1% for AGIs below $25k, 2.3% for AGIs $25k-50k, 2.6% for AGIs $50k-75k, 2.3% for AGIs $75k-100k, 2.5% for AGIs $100k-200k, 3.8% for AGIs over 200k)
Net capital gain/loss in AGI: +$13,523 (reported on 31.8% of returns)
Here:
+$13,523
State:
+$30,460
(% of AGI for various income ranges: 0.4% for AGIs $25k-50k, 0.8% for AGIs $50k-75k, 0.9% for AGIs $75k-100k, 1.7% for AGIs $100k-200k, 12.3% for AGIs over 200k)
Profit/loss from business: +$18,174 (reported on 15.9% of returns)
Here:
+$18,174
State:
+$17,064
(% of AGI for various income ranges: 9.7% for AGIs below $25k, 5.0% for AGIs $25k-50k, 3.1% for AGIs $50k-75k, 2.8% for AGIs $75k-100k, 3.0% for AGIs $100k-200k, 2.8% for AGIs over 200k)
Taxable individual retirement arrangement distribution: $22,791 (reported on 12.6% of returns)
92122:
$22,791
California:
$19,557
(% of AGI for various income ranges: 3.8% for AGIs below $25k, 2.7% for AGIs $25k-50k, 2.8% for AGIs $50k-75k, 3.0% for AGIs $75k-100k, 3.7% for AGIs $100k-200k, 3.4% for AGIs over 200k)
Self-employment retirement plans: $21,704 (reported on 1.4% of returns)
92122:
$21,704
California:
$24,530
(% of AGI for various income ranges: 0.4% for AGIs below $25k, 0.3% for AGIs $50k-75k, 0.3% for AGIs $100k-200k, 0.6% for AGIs over 200k)
Total itemized deductions: $29,998 (20% of AGI, reported on 41.4% of returns)
Here:
$29,998
State:
$34,004
Here:
20.4% of AGI
State:
22.7% of AGI
(% of AGI for various income ranges: 16.5% for AGIs below $25k, 11.7% for AGIs $25k-50k, 12.1% for AGIs $50k-75k, 13.7% for AGIs $75k-100k, 14.9% for AGIs $100k-200k, 15.2% for AGIs over 200k)
Charity contributions: $3,859 (reported on 33.2% of returns)
Here:
$3,859
State:
$4,659
(% of AGI for various income ranges: 0.8% for AGIs below $25k, 0.8% for AGIs $25k-50k, 1.2% for AGIs $50k-75k, 1.4% for AGIs $75k-100k, 1.6% for AGIs $100k-200k, 1.7% for AGIs over 200k)
Taxes paid: $13,032 (reported on 41.2% of returns)
92122:
$13,032
State:
$14,448
(% of AGI for various income ranges: 2.7% for AGIs below $25k, 2.3% for AGIs $25k-50k, 3.1% for AGIs $50k-75k, 4.9% for AGIs $75k-100k, 6.4% for AGIs $100k-200k, 8.8% for AGIs over 200k)
Earned income credit: $1,275 (reported on 6.6% of returns)
Here:
$1,275
State:
$2,286
(% of AGI for various income ranges: 2.1% for AGIs below $25k, 0.3% for AGIs $25k-50k)
Percentage of individuals using paid preparers for their 2012 taxes: 49.4%
Here:
49%
State:
64%
(% for various income ranges: 43.2% for AGIs below $25k, 42.7% for AGIs $25k-50k, 49.7% for AGIs $50k-75k, 51.2% for AGIs $75k-100k, 55.9% for AGIs $100k-200k, 67.6% for AGIs over 200k)
Averages for the 2004 tax year for zip code 92122, filed in 2005:
Average Adjusted Gross Income (AGI) in 2004: $65,586 (Individual Income Tax Returns)
Here:
$65,586
State:
$58,600
Salary/wage: $57,964 (reported on 78.5% of returns)
Here:
$57,964
State:
$49,455
(% of AGI for various income ranges: 215.6% for AGIs below $10k, 73.3% for AGIs $10k-25k, 77.8% for AGIs $25k-50k, 75.3% for AGIs $50k-75k, 75.1% for AGIs $75k-100k, 62.6% for AGIs over 100k)
Taxable interest for individuals: $2,503 (reported on 58.3% of returns)
This zip code:
$2,503
California:
$2,365
(% of AGI for various income ranges: 17.5% for AGIs below $10k, 3.6% for AGIs $10k-25k, 2.5% for AGIs $25k-50k, 2.2% for AGIs $50k-75k, 1.9% for AGIs $75k-100k, 2.0% for AGIs over 100k)
Taxable dividends: $4,432 (reported on 36.8% of returns)
Here:
$4,432
State:
$4,746
(% of AGI for various income ranges: 16.6% for AGIs below $10k, 3.3% for AGIs $10k-25k, 2.3% for AGIs $25k-50k, 2.2% for AGIs $50k-75k, 2.1% for AGIs $75k-100k, 2.5% for AGIs over 100k)
Net capital gain/loss: +$15,425 (reported on 33.9% of returns)
Here:
+$15,425
State:
+$23,418
(% of AGI for various income ranges: -5.7% for AGIs below $10k, 1.0% for AGIs $10k-25k, 0.3% for AGIs $25k-50k, 1.0% for AGIs $50k-75k, 1.8% for AGIs $75k-100k, 13.9% for AGIs over 100k)
Profit/loss from business: +$18,285 (reported on 15.8% of returns)
Here:
+$18,285
State:
+$16,826
(% of AGI for various income ranges: 12.1% for AGIs below $10k, 6.4% for AGIs $10k-25k, 3.7% for AGIs $25k-50k, 3.7% for AGIs $50k-75k, 4.0% for AGIs $75k-100k, 4.6% for AGIs over 100k)
IRA payment deduction: $3,184 (reported on 3.1% of returns)
92122:
$3,184
California:
$3,192
(% of AGI for various income ranges: 0.6% for AGIs below $10k, 0.3% for AGIs $10k-25k, 0.3% for AGIs $25k-50k, 0.2% for AGIs $50k-75k, 0.2% for AGIs $75k-100k, 0.1% for AGIs over 100k)
Self-employed pension: $16,256 (reported on 2.2% of returns)
Here:
$16,256
California:
$17,688
(% of AGI for various income ranges: 0.2% for AGIs $10k-25k, 0.2% for AGIs $25k-50k, 0.2% for AGIs $50k-75k, 0.4% for AGIs $75k-100k, 0.8% for AGIs over 100k)
Total itemized deductions: $27,729 (25% of AGI, reported on 42.1% of returns)
Here:
$27,729
State:
$28,113
Here:
24.7% of AGI
State:
25.3% of AGI
(% of AGI for various income ranges: 54.1% for AGIs below $10k, 15.8% for AGIs $10k-25k, 12.6% for AGIs $25k-50k, 16.1% for AGIs $50k-75k, 17.1% for AGIs $75k-100k, 19.5% for AGIs over 100k)
Charity contributions deductions: $3,749 (3% of AGI, reported on 34.9% of returns)
Here:
$3,749
State:
$3,923
Here:
3.1% of AGI
State:
3.3% of AGI
(% of AGI for various income ranges: 2.0% for AGIs below $10k, 1.1% for AGIs $10k-25k, 1.3% for AGIs $25k-50k, 1.7% for AGIs $50k-75k, 1.9% for AGIs $75k-100k, 2.3% for AGIs over 100k)
Total tax: $11,353 (reported on 83.5% of returns)
92122:
$11,353
State:
$10,761
(% of AGI for various income ranges: 7.9% for AGIs below $10k, 5.5% for AGIs $10k-25k, 8.8% for AGIs $25k-50k, 11.6% for AGIs $50k-75k, 12.6% for AGIs $75k-100k, 17.9% for AGIs over 100k)
Earned income credit: $994 (reported on 4.7% of returns)
Here:
$994
State:
$1,763
Percentage of individuals using paid preparers for their 2004 taxes: 49.3%
Here:
49%
State:
66%
(% for various income ranges: 36.2% for AGIs below $10k, 45.1% for AGIs $10k-25k, 47.3% for AGIs $25k-50k, 52.3% for AGIs $50k-75k, 55.5% for AGIs $75k-100k, 62.8% for AGIs over 100k)
Likely homosexual households (counted as self-reported same-sex unmarried-partner households)
Lesbian couples: 0.1% of all households
Gay men: 0.2% of all households
Household received Food Stamps/SNAP in the past 12 months: 661 Household did not receive Food Stamps/SNAP in the past 12 months: 18,832
Women who had a birth in the past 12 months: 396 (377 now married, 16 unmarried) Women who did not have a birth in the past 12 months: 13,250 (4,285 now married, 9,004 unmarried)
Housing units in zip code 92122 with a mortgage: 4,045 (419 second mortgage, 17 home equity loan, 393 both second mortgage and home equity loan) Houses without a mortgage: 21
Median monthly owner costs for units with a mortgage: $3,117 Median monthly owner costs for units without a mortgage: $855
Residents with income below the poverty level in 2022:
This zip code:
22.3%
Whole state:
12.2%
Residents with income below 50% of the poverty level in 2022:
This zip code:
6.1%
Whole state:
6.2%
Median number of rooms in houses and condos:
Here:
5.6
State:
6.0
Median number of rooms in apartments:
Here:
3.4
State:
3.9
Notable locations in this zip code not listed on our city pages
Notable locations in zip code 92122: University City Village Golf Course (A), Miramar Landfill (B), Miramar (C), University Community Branch San Diego Public Library (D). Display/hide their locations on the map
Shopping Centers: UTC-Westfield Shoppingtown Shopping Center (1), University Square Shopping Center (2), University City Shopping Center (3), University Towne Centre Shopping Center (4), Costa Verde Shopping Center (5), Colony Plaza Shopping Center (6). Display/hide their locations on the map
Churches in zip code 92122 include: The Church of Jesus Christ of Latter Day Saints (A), Our Mother of Confidence Church (B), University City United Church (C), Lutheran Church of All Saints (D), University City United Church of Christ (E), First Baptist Church of San Diego (F). Display/hide their locations on the map
Parks in zip code 92122 include: Standley Park (1), Doyle Community Park (2), Marcy Park (3), Rose Canyon Open Space (4), Nobel Athletic Area (5), Standley Recreation Center (6), University Gardens Park (7), University Village Park (8). Display/hide their locations on the map
4,459 married couples with children.
1,093 single-parent households (550 men, 543 women).
60.4% of residents of 92122 zip code speak English at home.
6.9% of residents speak Spanish at home (77% very well, 18% well, 5% not well).
10.9% of residents speak other Indo-European language at home (79% very well, 16% well, 5% not well).
18.6% of residents speak Asian or Pacific Island language at home (66% very well, 29% well, 5% not well).
3.3% of residents speak other language at home (78% very well, 11% well, 12% not at all).
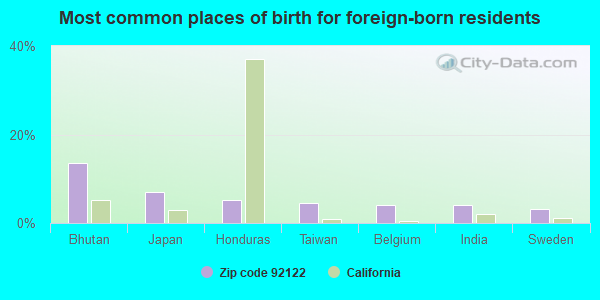
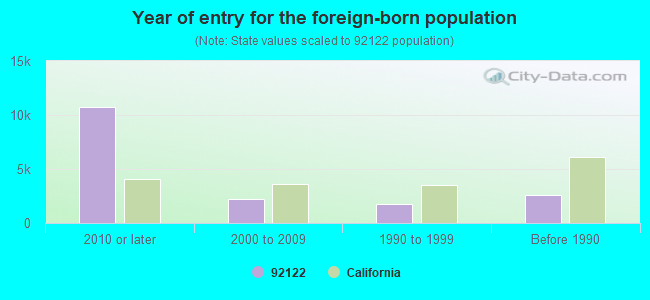
Foreign born population: 15,023 (32.9%) (35.2% of them are naturalized citizens)
Facilities with environmental interests located in this zip code:
CHEVRON STATION NO 94339 (3860 GOVERNOR DR in SAN DIEGO, CA)
STATE MASTER (California - Hazardous Waste Tracking) - HAZARDOU WASTE PROGRAM CRITERIA AND HAZARDOUS AIR POLLUTANT INVENTORY (Inventory of air pollution sources) Small Quantity Generators, between 100 kg and 1000 kg of hazardous waste/month (Resource Conservation and Recovery Act (tracking hazardous waste)) - notification Business SIC classification: GASOLINE SERVICE STATIONS Organizations: CHEVRON PRODUCTS CO (CONTACT/OWNER)
LA JOLLA CLEANERS (8508 GENESEE AVE in SAN DIEGO, CA)
Small Quantity Generators, between 100 kg and 1000 kg of hazardous waste/month (Resource Conservation and Recovery Act (tracking hazardous waste)) - notification Organizations: LORI S KIM (CONTACT/OWNER)
HAZARD MART EASTGATE (5590 EASTGATE MALL in SAN DIEGO, CA)
Small Quantity Generators, between 100 kg and 1000 kg of hazardous waste/month (Resource Conservation and Recovery Act (tracking hazardous waste))
HEALTHSOUTH DIAG CTR OF LA JOLLA (8929 UNIVERSITY CTR LN STE 207 in SAN DIEGO, CA)
Small Quantity Generators, between 100 kg and 1000 kg of hazardous waste/month (Resource Conservation and Recovery Act (tracking hazardous waste)) - notification Organizations: DIAGNOSTIC HEALTH CORP (CONTACT/OWNER)
HYATT REGENCY LA JOLLA (3777 LA JOLLA VILLAGE DR in SAN DIEGO, CA)
Small Quantity Generators, between 100 kg and 1000 kg of hazardous waste/month (Resource Conservation and Recovery Act (tracking hazardous waste)) - notification Organizations: STRATEGIC HOTEL CAPITAL INC (CONTACT/OWNER)
EXXON #1038 (3918 GOVERNOR DR in SAN DIEGO, CA)
CRITERIA AND HAZARDOUS AIR POLLUTANT INVENTORY (Inventory of air pollution sources) Business SIC classification: GASOLINE SERVICE STATIONS
LIGHTHOUSE EARLY CHILDHOOD (P.O. BOX 22657 in SAN DIEGO, CA)
COMPLIANCE ACTIVITY (Tracking inspections of insecticide, fungicide, and rodenticide, and toxic substances)
MOBIL / GOVERNOR DRIVE (3861 GOVERNOR DR in SAN DIEGO, CA)
CRITERIA AND HAZARDOUS AIR POLLUTANT INVENTORY (Inventory of air pollution sources) Business SIC classification: GASOLINE SERVICE STATIONS
NORTH COAST CLEANERS INC (8915 TOWNE CENTER DR in SAN DIEGO, CA)
CRITERIA AND HAZARDOUS AIR POLLUTANT INVENTORY (Inventory of air pollution sources) Business SIC classification: DRYCLEANING PLANTS, EXCEPT RUG CLEANING
Housing units lacking complete plumbing facilities: 0.3% Housing units lacking complete kitchen facilities: 0.9%
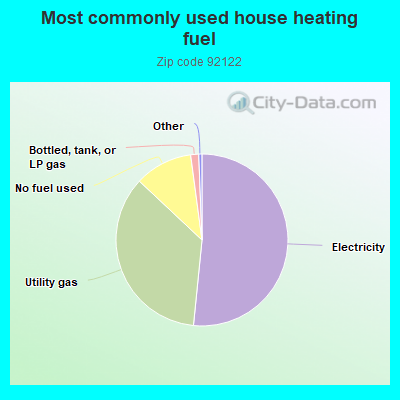
51.6%Electricity
35.4%Utility gas
10.9%No fuel used
1.5%Bottled, tank, or LP gas
Population in 1990: 30,192. Population change in the 1990s: +4,699 (+15.6%).
Place of birth for U.S.-born residents:
This state: 18,719
Northeast: 3,191
Midwest: 3,234
South: 1,929
West: 2,413
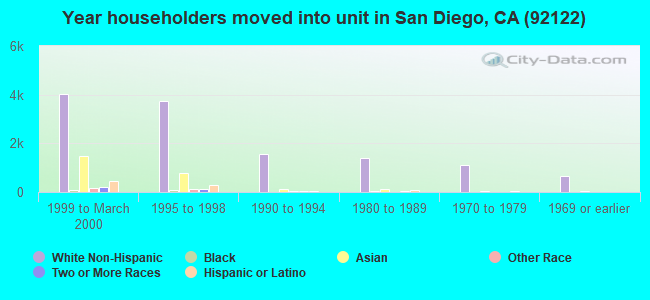
39% of the 92122 zip code residents lived in the same house 5 years ago. Out of people who lived in different houses, 47% lived in this county. Out of people who lived in different counties, 50% lived in California.
78% of the 92122 zip code residents lived in the same house 1 year ago. Out of people who lived in different houses, 52% moved from this county. Out of people who lived in different houses, 14% moved from different county within same state. Out of people who lived in different houses, 18% moved from different state. Out of people who lived in different houses, 16% moved from abroad.
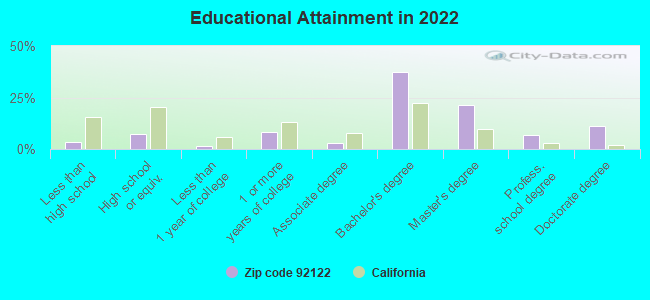
Private vs. public school enrollment:
Students in private schools in grades 1 to 8 (elementary and middle school): 343
Here:
15.4%
California:
10.5%
Students in private schools in grades 9 to 12 (high school): 192
Here:
13.8%
California:
8.5%
Students in private undergraduate colleges: 674
Here:
8.6%
California:
15.9%
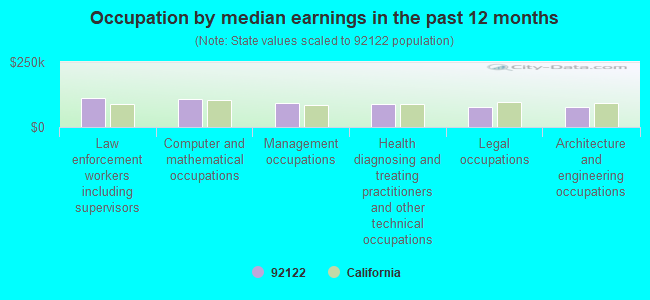
Occupation by median earnings in the past 12 months ($)
113,669Law enforcement workers including supervisors
106,964Computer and mathematical occupations
93,383Management occupations
90,363Health diagnosing and treating practitioners and other technical occupations
78,029Legal occupations
77,185Architecture and engineering occupations
Companies with biggest federal contracts located in this zip code (SAN DIEGO, CA):
BUILDING ENGINEERING AND SCIEN (5060 SHOREHAM PLACE; small business) : $1,340,405 in 6 contractsfrom 2004 to 2006
Contracts for Market Research and Public Opinion Services (includes telephone and field interviews, focus testing, and surveys), Program Management/Support Services, Maintenance, Repair and Rebuilding of Equipment -- Instruments and Laboratory Equipment by Army, Navy Signed by year:2000: $0; 2001: $0; 2002: $0; 2003: $0; 2004: $385,476; 2005: $455,026; 2006: $499,903.
Biggest contracts:
$419,992 with Army for Market Research and Public Opinion Services (includes telephone and field interviews, focus testing, and surveys). Signed on 2006-05-11. Completion date: 2007-02-22.
$405,026, same as above.Signed on 2005-03-09. Completion date: 2006-02-22.
$330,502 with Navy for Program Management/Support Services. Signed on 2004-05-13. Completion date: 2004-09-12.
$79,911 with Army for Market Research and Public Opinion Services (includes telephone and field interviews, focus testing, and surveys). Signed on 2006-02-17. Completion date: 2006-02-22.
GRANTREE CORPORATION (6310 GREENWICH DR #120) : $1,007,855 in 4 contractsin 2000
$727,175 with Navy for Lodging - Hotel/Motel. Signed on 2000-06-07. Completion date: 2000-12-31.
$273,600, same as above.Signed on 2000-07-24. Completion date: 2001-07-23.
$34,440, same as above.Signed on 2000-12-13. Completion date: 2001-03-15.
-$27,360, same as above.Signed on 2000-09-21. Completion date: 2000-09-21.
AONIX NORTH AMERICA (5040 SHOREHAM PLACE) : $730,831 in 20 contractsfrom 1999 to 2005
Contracts for ADP Input/Output and Storage Devices, ADP Software, ADP Facility Operation and Maintenance Services, ADP Components, and moreby Navy, Army, Air Force Signed by year:2000: $205,036; 2001: $148,690; 2002: $155,330; 2003: $114,000; 2004: $9,855; 2005: $46,023; 2006: $0.
Biggest contracts:
$97,740 with Navy for ADP Input/Output and Storage Devices. Signed on 2001-01-18. Completion date: 2002-01-31.
$86,000, same as above.Signed on 2000-04-18. Completion date: 2000-05-18.
$60,000 with Navy for ADP Software. Signed on 2002-07-10. Completion date: 2002-07-05.
$52,200, same as above.Signed on 2003-10-01. Completion date: 2004-09-30.
JACOBS ENGINEERING GROUP INC (3655 NOBEL DR STE 200) : $618,124 in 164 contractsfrom 1999 to 2002
Contracts for Architect - Engineer Services (including landscaping, interior layout, and designing) by Navy Signed by year:2000: $173,262; 2001: $251,146; 2002: $238,095; 2003: $0; 2004: $0; 2005: $0; 2006: $0.
Biggest contracts:
$127,706 with Navy for Architect - Engineer Services (including landscaping, interior layout, and designing). Signed on 2000-01-18. Completion date: 1997-09-30.
$96,260, same as above.Signed on 2001-09-28. Completion date: 1997-12-15.
$74,483, same as above.Signed on 2001-10-22. Completion date: 1997-12-31.
$68,619 with Navy for Architect - Engineer Services (including landscaping, interior layout, and designing). Taking place in AZ. Signed on 2002-09-26. Completion date: 1995-05-17.
RESOURCE ANALYSIS CORPORTION (4370 LA JOLLA VILLAGE DRIV; small business) : $424,896 in 5 contractsfrom 2003 to 2006
Contracts for Engineering and Technical Services, Other ADP and Telecommunications Services (includes data storage on tapes, compact disks, etc.), ADP Software by Navy Signed by year:2000: $0; 2001: $0; 2002: $0; 2003: $99,938; 2004: $174,958; 2005: $0; 2006: $150,000.
Biggest contracts:
$174,958 with Navy for Engineering and Technical Services. Signed on 2004-02-05. Completion date: 2004-09-30.
$99,938 with Navy for Other ADP and Telecommunications Services (includes data storage on tapes, compact disks, etc.). Signed on 2003-03-17. Completion date: 2003-12-31.
$50,000 with Navy for ADP Software. Signed on 2006-05-24. Completion date: 2006-06-01.
$50,000, same as above.Signed on 2006-04-14. Completion date: 2007-04-13.
ARDEN REALTY LIMITED PARTNERSHIP (; small business) : $290,807 in 28 contractsfrom 2003 to 2006
Contracts for Lease or Rental of Facilities -- Office Buildings by Public Buildings Service Signed by year:2000: $0; 2001: $0; 2002: $0; 2003: $101,931; 2004: $31,494; 2005: $83,896; 2006: $73,486.
Biggest contracts:
$10,498 with Public Buildings Service for Lease or Rental of Facilities -- Office Buildings. Signed on 2006-07-01. Completion date: 2006-09-30.
$10,498, same as above.Signed on 2006-07-01. Completion date: 2006-09-30.
$10,498, same as above.Signed on 2006-04-01. Completion date: 2006-09-30.
$10,498, same as above.Signed on 2006-04-01. Completion date: 2006-09-30.
DOUGLAS, BRUCE R (5952 ERLANGER ST; small business) : $262,936 in 3 contractsfrom 2004 to 2005
$120,640 with Navy for Other Medical Services. Signed on 2005-10-20. Completion date: 2005-09-30.
$114,840, same as above.Signed on 2004-10-14. Completion date: 2005-09-30.
$27,456, same as above.Signed on 2004-06-16. Completion date: 2004-09-30.
ALIGNMENT EXPRESS INC (3031 PENNANT WAY; small business) : $231,809 in 17 contractsfrom 2004 to 2006
Contracts for Truck and Tractor Attachments, Motor Vehicle Maintenance and Repair Shop Specialized Equipment, Gears, Pulleys, Sprockets, and Transmission Chain, Combat, Assault, and Tactical Vehicles, Tracked, and moreby Army, Navy, Defense Logistics Agency Signed by year:2000: $0; 2001: $0; 2002: $0; 2003: $0; 2004: $20,722; 2005: $127,710; 2006: $83,377.
Biggest contracts:
$25,000 with Army for Truck and Tractor Attachments. Signed on 2005-08-17. Completion date: 2005-10-13.
$24,030 with Navy for Motor Vehicle Maintenance and Repair Shop Specialized Equipment. Signed on 2005-07-27. Completion date: 2005-08-12.
$23,939 with Defense Logistics Agency for Gears, Pulleys, Sprockets, and Transmission Chain. Signed on 2006-03-13. Completion date: 2006-04-15.
$16,300 with Army for Motor Vehicle Maintenance and Repair Shop Specialized Equipment. Signed on 2006-01-24. Completion date: 2006-03-01.
INNOVATIVE DESIGN CONSULTANTS, (4304 ROBBINS ST; small business) : $197,530 in 2 contractsfrom 2002 to 2003
$100,000 with Navy for Miscellaneous Electric Power and Distribution Equipment. Signed on 2002-09-11. Completion date: 2002-09-12.
$97,530 with Navy for Well Drilling/Exploratory Services. Signed on 2003-12-18. Completion date: 2003-12-31.
J R ROMERO CONSTRUCTION COMP (3990 NOBEL DR , STE 303; small business) : $183,892 in 5 contractsfrom 2000 to 2003
Contracts for Construction of Structures and Facilities -- Other Non-Building Facilities, Construction of Structures and Facilities -- Miscellaneous Buildings, Maintenance, Repair or Alteration of Real Property -- Recreational Buildings by Navy Signed by year:2000: $85,097; 2001: $94,875; 2002: $5,920; 2003: -$2,000; 2004: $0; 2005: $0; 2006: $0.
Biggest contracts:
$92,875 with Navy for Construction of Structures and Facilities -- Other Non-Building Facilities. Signed on 2001-09-14. Completion date: 2002-01-02.
$85,097 with Navy for Construction of Structures and Facilities -- Miscellaneous Buildings. Signed on 2000-09-20. Completion date: 2000-09-20.
$5,920 with Navy for Maintenance, Repair or Alteration of Real Property -- Recreational Buildings. Signed on 2002-03-20. Completion date: 2002-05-20.
$2,000, same as above.Signed on 2001-04-03. Completion date: 2002-04-02.
Top industries in this zip code by the number of employees in 2005:
Real Estate and Rental and Leasing: Residential Property Managers (over 1000 employees: 1 establishment, 50-99 employees: 1 establishment, 10-19 employees: 2 establishments, 5-9 employees: 3 establishments, 1-4 employees: 5 establishments)
Administrative and Support and Waste Management and Remediation Services: Temporary Help Services (250-499: 1, 100-249: 1, 50-99: 3, 20-49: 3, 5-9: 1, 1-4: 1)
Finance and Insurance: Real Estate Credit (100-249: 1, 50-99: 3, 20-49: 5, 10-19: 1, 5-9: 1, 1-4: 13)
2005 - 2018 National Fire Incident Reporting System (NFIRS) incidents
Based on the data from the years 2005 - 2018 the average number of fires per year is 23. The highest number of reported fires - 51 took place in 2017, and the least - 0 in 2006. The data has a rising trend.
When looking into fire subcategories, the most reports belonged to: Structure Fires (61.7%), and Outside Fires (17.4%).
Fire incident types reported to NFIRS in Zip Code 92122


 Nearest zip codes: 92117, 92121, 92111, 92126, 92123, 92037.


 Based on the data from the years 2005 - 2018 the average number of fires per year is 23. The highest number of reported fires - 51 took place in 2017, and the least - 0 in 2006. The data has a rising trend.
 When looking into fire subcategories, the most reports belonged to: Structure Fires (61.7%), and Outside Fires (17.4%).