Estimated zip code population in 2022: 63,790 Zip code population in 2010: 61,827 Zip code population in 2000: 56,296
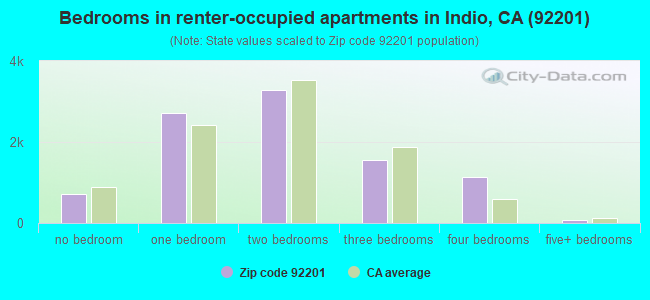
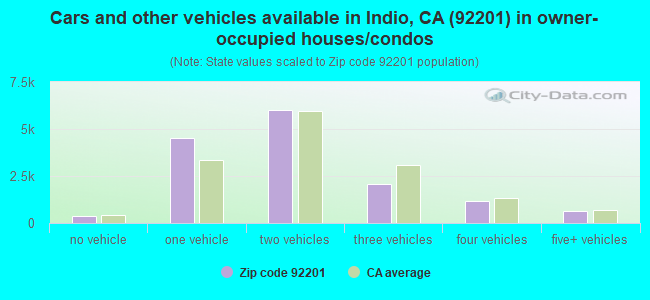
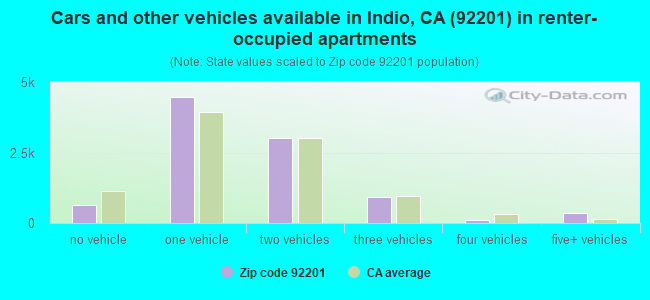
Houses and condos: 27,615 Renter-occupied apartments: 9,471
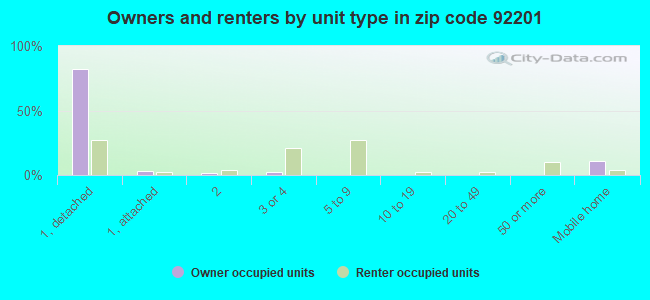
% of renters here:
39%
State:
44%
March 2022 cost of living index in zip code 92201: 81.7 (low, U.S. average is 100)
Land area: 22.7 sq. mi. Water area: 0.0 sq. mi.
Population density: 2,816 people per square mile
(average).
OSM Map
General Map
Google Map
MSN Map
OSM Map
General Map
Google Map
MSN Map
OSM Map
General Map
Google Map
MSN Map
OSM Map
General Map
Google Map
MSN Map
Please wait while loading the map...
Real estate property taxes paid for housing units in 2022:
This zip code:
1.0% ($3,340)
California:
0.7% ($4,831)
Median real estate property taxes paid for housing units with mortgages in 2022: $4,027 (1.1%) Median real estate property taxes paid for housing units with no mortgage in 2022: $2,746 (0.9%)
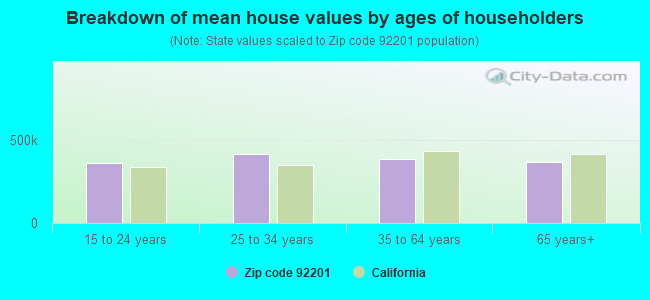
Estimated median house/condo value in 2022: $348,557
92201:
$348,557
California:
$715,900
According to our research of California and other state lists, there were 85 registered sex offenders living in 92201 zip code as of April 27, 2024. The ratio of all residents to sex offenders in zip code 92201 is 769 to 1. The ratio of registered sex offenders to all residents in this zip code is near the state average.
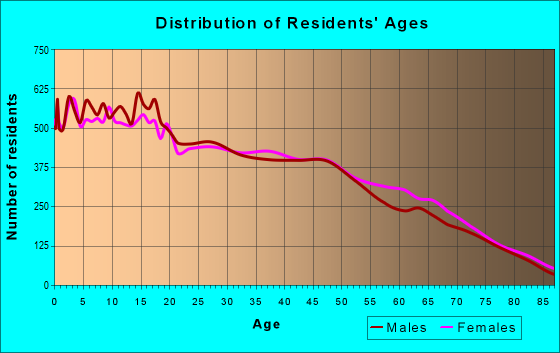
Median resident age:
This zip code:
39.2 years
California median age:
37.9 years
Average household size:
This zip code:
2.6 people
California:
2.8 people
Averages for the 2020 tax year for zip code 92201, filed in 2021:
Average Adjusted Gross Income (AGI) in 2020: $45,707 (Individual Income Tax Returns)
Here:
$45,707
State:
$95,910
Salary/wage: $38,119 (reported on 83.1% of returns)
Here:
$38,119
State:
$77,331
(% of AGI for various income ranges: 1325.2% for AGIs below $25k, 3776.6% for AGIs $25k-50k, 7369.5% for AGIs $50k-75k, 10303.6% for AGIs $75k-100k, 19264.7% for AGIs $100k-200k, 70318.3% for AGIs over 200k)
Taxable interest for individuals: $840 (reported on 23.3% of returns)
This zip code:
$840
California:
$2,294
(% of AGI for various income ranges: 7.0% for AGIs below $25k, 7.8% for AGIs $25k-50k, 31.1% for AGIs $50k-75k, 64.3% for AGIs $75k-100k, 183.9% for AGIs $100k-200k, 1126.7% for AGIs over 200k)
Ordinary dividends: $5,592 (reported on 7.3% of returns)
Here:
$5,592
State:
$10,949
(% of AGI for various income ranges: 10.8% for AGIs below $25k, 17.3% for AGIs $25k-50k, 56.0% for AGIs $50k-75k, 119.8% for AGIs $75k-100k, 356.8% for AGIs $100k-200k, 3087.5% for AGIs over 200k)
Net capital gain/loss in AGI: +$11,084 (reported on 7.8% of returns)
Here:
+$11,084
State:
+$49,306
(% of AGI for various income ranges: 4.3% for AGIs below $25k, 9.4% for AGIs $25k-50k, 73.8% for AGIs $50k-75k, 165.6% for AGIs $75k-100k, 673.3% for AGIs $100k-200k, 11297.5% for AGIs over 200k)
Profit/loss from business: +$9,700 (reported on 17.4% of returns)
Here:
+$9,700
State:
+$15,671
(% of AGI for various income ranges: 184.5% for AGIs below $25k, 149.1% for AGIs $25k-50k, 242.8% for AGIs $50k-75k, 312.1% for AGIs $75k-100k, 742.1% for AGIs $100k-200k, 6763.3% for AGIs over 200k)
Taxable individual retirement arrangement distribution: $22,506 (reported on 4.4% of returns)
92201:
$22,506
California:
$23,505
(% of AGI for various income ranges: 22.2% for AGIs below $25k, 39.3% for AGIs $25k-50k, 164.3% for AGIs $50k-75k, 351.6% for AGIs $75k-100k, 1097.1% for AGIs $100k-200k, 5089.2% for AGIs over 200k)
Self-employed (Keogh) retirement plans: $26,625 (reported on 0.1% of returns)
92201:
$26,625
California:
$30,163
(% of AGI for various income ranges: 110.9% for AGIs $100k-200k)
Total itemized deductions: $30,648 (reported on 8.5% of returns)
Here:
$30,648
State:
$39,517
(% of AGI for various income ranges: 47.8% for AGIs below $25k, 157.7% for AGIs $25k-50k, 528.8% for AGIs $50k-75k, 986.6% for AGIs $75k-100k, 2308.0% for AGIs $100k-200k, 12885.8% for AGIs over 200k)
Charity contributions: $6,223 (reported on 7.0% of returns)
Here:
$6,223
State:
$12,598
(% of AGI for various income ranges: 2.5% for AGIs below $25k, 19.0% for AGIs $25k-50k, 76.0% for AGIs $50k-75k, 153.1% for AGIs $75k-100k, 488.8% for AGIs $100k-200k, 2409.2% for AGIs over 200k)
Taxes paid: $8,084 (reported on 8.5% of returns)
92201:
$8,084
State:
$8,807
(% of AGI for various income ranges: 11.0% for AGIs below $25k, 41.7% for AGIs $25k-50k, 164.4% for AGIs $50k-75k, 300.7% for AGIs $75k-100k, 690.6% for AGIs $100k-200k, 2016.7% for AGIs over 200k)
Earned income credit: $2,434 (reported on 27.0% of returns)
Here:
$2,434
State:
$2,074
(% of AGI for various income ranges: 144.6% for AGIs below $25k, 114.7% for AGIs $25k-50k, 2.6% for AGIs $50k-75k)
Percentage of individuals using paid preparers for their 2020 taxes: 91.0%
Here:
91%
State:
92%
(% for various income ranges: 89.3% for AGIs below $25k, 91.4% for AGIs $25k-50k, 92.6% for AGIs $50k-75k, 93.3% for AGIs $75k-100k, 93.3% for AGIs $100k-200k, 93.6% for AGIs over 200k)
Averages for the 2012 tax year for zip code 92201, filed in 2013:
Average Adjusted Gross Income (AGI) in 2012: $36,686 (Individual Income Tax Returns)
Here:
$36,686
State:
$72,726
Salary/wage: $32,060 (reported on 84.4% of returns)
Here:
$32,060
State:
$59,079
(% of AGI for various income ranges: 77.2% for AGIs below $25k, 82.9% for AGIs $25k-50k, 77.9% for AGIs $50k-75k, 71.4% for AGIs $75k-100k, 68.7% for AGIs $100k-200k, 43.2% for AGIs over 200k)
Taxable interest for individuals: $903 (reported on 22.5% of returns)
This zip code:
$903
California:
$2,146
(% of AGI for various income ranges: 0.4% for AGIs below $25k, 0.3% for AGIs $25k-50k, 0.5% for AGIs $50k-75k, 0.6% for AGIs $75k-100k, 0.7% for AGIs $100k-200k, 1.4% for AGIs over 200k)
Ordinary dividends: $5,214 (reported on 7.2% of returns)
Here:
$5,214
State:
$9,308
(% of AGI for various income ranges: 0.5% for AGIs below $25k, 0.5% for AGIs $25k-50k, 0.7% for AGIs $50k-75k, 0.9% for AGIs $75k-100k, 1.2% for AGIs $100k-200k, 4.9% for AGIs over 200k)
Net capital gain/loss in AGI: +$7,577 (reported on 6.7% of returns)
Here:
+$7,577
State:
+$30,460
(% of AGI for various income ranges: 0.2% for AGIs $50k-75k, 0.6% for AGIs $75k-100k, 1.3% for AGIs $100k-200k, 13.9% for AGIs over 200k)
Profit/loss from business: +$10,205 (reported on 18.9% of returns)
Here:
+$10,205
State:
+$17,064
(% of AGI for various income ranges: 12.5% for AGIs below $25k, 4.0% for AGIs $25k-50k, 2.7% for AGIs $50k-75k, 2.6% for AGIs $75k-100k, 3.2% for AGIs $100k-200k, 4.5% for AGIs over 200k)
Taxable individual retirement arrangement distribution: $16,794 (reported on 5.5% of returns)
92201:
$16,794
California:
$19,557
(% of AGI for various income ranges: 1.3% for AGIs below $25k, 1.5% for AGIs $25k-50k, 2.0% for AGIs $50k-75k, 4.1% for AGIs $75k-100k, 4.5% for AGIs $100k-200k, 2.9% for AGIs over 200k)
Self-employment retirement plans: $18,020 (reported on 0.2% of returns)
92201:
$18,020
California:
$24,530
Total itemized deductions: $22,238 (29% of AGI, reported on 23.7% of returns)
Here:
$22,238
State:
$34,004
Here:
28.9% of AGI
State:
22.7% of AGI
(% of AGI for various income ranges: 5.7% for AGIs below $25k, 11.3% for AGIs $25k-50k, 17.6% for AGIs $50k-75k, 19.8% for AGIs $75k-100k, 19.9% for AGIs $100k-200k, 18.6% for AGIs over 200k)
Charity contributions: $2,908 (reported on 18.9% of returns)
Here:
$2,908
State:
$4,659
(% of AGI for various income ranges: 0.3% for AGIs below $25k, 0.9% for AGIs $25k-50k, 1.8% for AGIs $50k-75k, 2.3% for AGIs $75k-100k, 2.4% for AGIs $100k-200k, 2.3% for AGIs over 200k)
Taxes paid: $6,756 (reported on 23.7% of returns)
92201:
$6,756
State:
$14,448
(% of AGI for various income ranges: 1.6% for AGIs below $25k, 2.7% for AGIs $25k-50k, 4.6% for AGIs $50k-75k, 5.9% for AGIs $75k-100k, 7.0% for AGIs $100k-200k, 7.7% for AGIs over 200k)
Earned income credit: $2,821 (reported on 35.5% of returns)
Here:
$2,821
State:
$2,286
(% of AGI for various income ranges: 10.8% for AGIs below $25k, 2.2% for AGIs $25k-50k)
Percentage of individuals using paid preparers for their 2012 taxes: 72.5%
Here:
73%
State:
64%
(% for various income ranges: 70.8% for AGIs below $25k, 74.7% for AGIs $25k-50k, 75.3% for AGIs $50k-75k, 71.9% for AGIs $75k-100k, 72.9% for AGIs $100k-200k, 84.2% for AGIs over 200k)
Averages for the 2004 tax year for zip code 92201, filed in 2005:
Average Adjusted Gross Income (AGI) in 2004: $36,992 (Individual Income Tax Returns)
Here:
$36,992
State:
$58,600
Salary/wage: $32,887 (reported on 87.6% of returns)
Here:
$32,887
State:
$49,455
(% of AGI for various income ranges: 155.2% for AGIs below $10k, 84.7% for AGIs $10k-25k, 86.8% for AGIs $25k-50k, 82.3% for AGIs $50k-75k, 78.6% for AGIs $75k-100k, 55.8% for AGIs over 100k)
Taxable interest for individuals: $1,357 (reported on 31.4% of returns)
This zip code:
$1,357
California:
$2,365
(% of AGI for various income ranges: 4.3% for AGIs below $10k, 0.9% for AGIs $10k-25k, 0.8% for AGIs $25k-50k, 0.9% for AGIs $50k-75k, 1.0% for AGIs $75k-100k, 1.7% for AGIs over 100k)
Taxable dividends: $2,654 (reported on 10.7% of returns)
Here:
$2,654
State:
$4,746
(% of AGI for various income ranges: 3.4% for AGIs below $10k, 0.6% for AGIs $10k-25k, 0.5% for AGIs $25k-50k, 0.5% for AGIs $50k-75k, 0.6% for AGIs $75k-100k, 1.3% for AGIs over 100k)
Net capital gain/loss: +$14,057 (reported on 10.4% of returns)
Here:
+$14,057
State:
+$23,418
(% of AGI for various income ranges: -0.4% for AGIs below $10k, -0.2% for AGIs $10k-25k, 0.2% for AGIs $25k-50k, 0.7% for AGIs $50k-75k, 1.4% for AGIs $75k-100k, 14.7% for AGIs over 100k)
Profit/loss from business: +$11,748 (reported on 15.5% of returns)
Here:
+$11,748
State:
+$16,826
(% of AGI for various income ranges: 17.7% for AGIs below $10k, 6.2% for AGIs $10k-25k, 3.6% for AGIs $25k-50k, 3.7% for AGIs $50k-75k, 2.9% for AGIs $75k-100k, 7.0% for AGIs over 100k)
IRA payment deduction: $3,019 (reported on 1.5% of returns)
92201:
$3,019
California:
$3,192
(% of AGI for various income ranges: 0.2% for AGIs below $10k, 0.1% for AGIs $10k-25k, 0.1% for AGIs $25k-50k, 0.1% for AGIs $50k-75k, 0.2% for AGIs $75k-100k, 0.1% for AGIs over 100k)
Self-employed pension: $17,086 (reported on 0.4% of returns)
Here:
$17,086
California:
$17,688
(% of AGI for various income ranges: 0.0% for AGIs $25k-50k, 0.1% for AGIs $50k-75k, 0.1% for AGIs $75k-100k, 0.6% for AGIs over 100k)
Total itemized deductions: $20,873 (30% of AGI, reported on 33.0% of returns)
Here:
$20,873
State:
$28,113
Here:
30.2% of AGI
State:
25.3% of AGI
(% of AGI for various income ranges: 25.7% for AGIs below $10k, 8.6% for AGIs $10k-25k, 16.5% for AGIs $25k-50k, 22.3% for AGIs $50k-75k, 23.1% for AGIs $75k-100k, 21.3% for AGIs over 100k)
Charity contributions deductions: $2,713 (4% of AGI, reported on 28.5% of returns)
Here:
$2,713
State:
$3,923
Here:
3.8% of AGI
State:
3.3% of AGI
(% of AGI for various income ranges: 1.0% for AGIs below $10k, 0.7% for AGIs $10k-25k, 1.6% for AGIs $25k-50k, 2.4% for AGIs $50k-75k, 2.6% for AGIs $75k-100k, 3.0% for AGIs over 100k)
Total tax: $4,925 (reported on 62.4% of returns)
92201:
$4,925
State:
$10,761
(% of AGI for various income ranges: 5.8% for AGIs below $10k, 2.9% for AGIs $10k-25k, 4.5% for AGIs $25k-50k, 7.1% for AGIs $50k-75k, 9.1% for AGIs $75k-100k, 16.4% for AGIs over 100k)
Earned income credit: $2,074 (reported on 30.6% of returns)
Here:
$2,074
State:
$1,763
Percentage of individuals using paid preparers for their 2004 taxes: 75.7%
Here:
76%
State:
66%
(% for various income ranges: 71.4% for AGIs below $10k, 77.5% for AGIs $10k-25k, 76.0% for AGIs $25k-50k, 76.1% for AGIs $50k-75k, 74.5% for AGIs $75k-100k, 78.1% for AGIs over 100k)
Likely homosexual households (counted as self-reported same-sex unmarried-partner households)
Lesbian couples: 0.1% of all households
Gay men: 0.5% of all households
Household received Food Stamps/SNAP in the past 12 months: 5,272 Household did not receive Food Stamps/SNAP in the past 12 months: 19,402
Women who had a birth in the past 12 months: 633 (421 now married, 213 unmarried) Women who did not have a birth in the past 12 months: 14,157 (5,785 now married, 8,364 unmarried)
Housing units in zip code 92201 with a mortgage: 8,284 (361 second mortgage, 20 home equity loan, 241 both second mortgage and home equity loan) Houses without a mortgage: 34
Median monthly owner costs for units with a mortgage: $1,824 Median monthly owner costs for units without a mortgage: $673
Residents with income below the poverty level in 2022:
This zip code:
15.3%
Whole state:
12.2%
Residents with income below 50% of the poverty level in 2022:
This zip code:
10.7%
Whole state:
6.2%
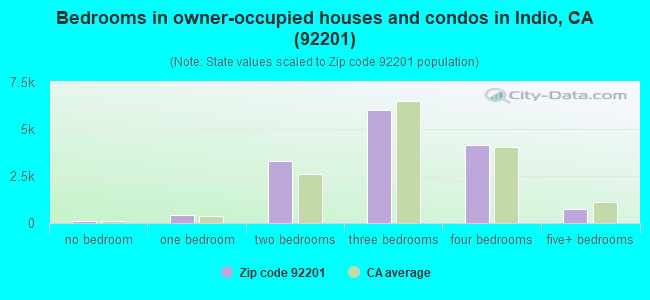
Median number of rooms in houses and condos:
Here:
5.5
State:
6.0
Median number of rooms in apartments:
Here:
3.9
State:
3.9
Notable locations in this zip code not listed on our city pages
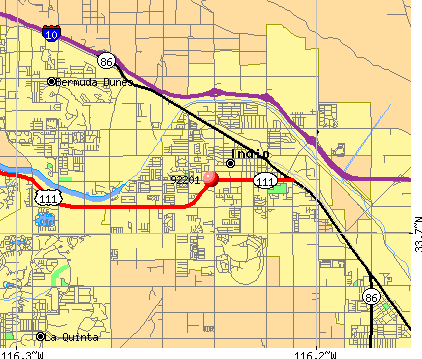
Notable locations in zip code 92201: Valley Sanitary District Water Reclamation Plant (A), Indian Waters Recreational Vehicle Park (B), Indian Palms Country Club (C), Empire Polo Club (D), Empire Equestrian Center (E), Eldorado Polo Club (F), Desert Air Recreational Vehicle Park (G), Indian Wells Recreational Vehicle Park (H), Indian Springs Golf Club (I), Fiesta Recreational Vehicle Park (J), Max T McCandless Memorial Branch Riverside Public Library (K), Indio Branch Riverside County Law Library (L), Indio Amtrak Station (M), Coachella Valley Museum (N), Riverside County Fire Department Station 88 - Indio Fire Station 3 (O), Riverside County Fire Department Station 87 - Indio Fire Station 2 (P), Riverside County Fire Department Station 86 - Indio Fire Station 1 (Q). Display/hide their locations on the map
Shopping Centers: Village Square Shopping Center (1), Tyselling Shopping Center (2), Town and Country Shopping Center (3), Indio Plaza Shopping Center (4), Indio Fashion Mall Shopping Center (5). Display/hide their locations on the map
Churches in zip code 92201 include: Second Missionary Baptist Church (A), Church of Christ of Indio (B), The Church of Jesus Christ of Latter Day Saints (C), Cornerstone Church of Indio (D), First African Methodist Episcopal Church (E), First Church of the Nazarene (F), Fountain of Living Water Church (G), Iglesia del Valle (H), Independent Evangelical Church (I). Display/hide their locations on the map
Parks in zip code 92201 include: Carreon Park (1), Davis Sports Complex (2), Miles Park (3), North Jackson Park (4), Riverside County Fairgrounds (5), South Jackson Park (6). Display/hide their locations on the map
8,075 married couples with children.
2,682 single-parent households (708 men, 1,974 women).
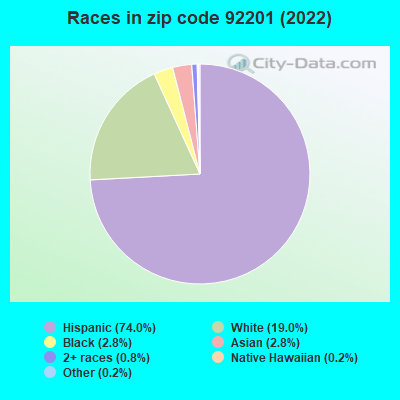
40.6% of residents of 92201 zip code speak English at home.
56.3% of residents speak Spanish at home (57% very well, 23% well, 12% not well, 8% not at all).
0.8% of residents speak other Indo-European language at home (76% very well, 19% well, 2% not well, 2% not at all).
2.2% of residents speak Asian or Pacific Island language at home (51% very well, 22% well, 20% not well, 6% not at all).
0.2% of residents speak other language at home (45% very well, 39% well, 16% not well).
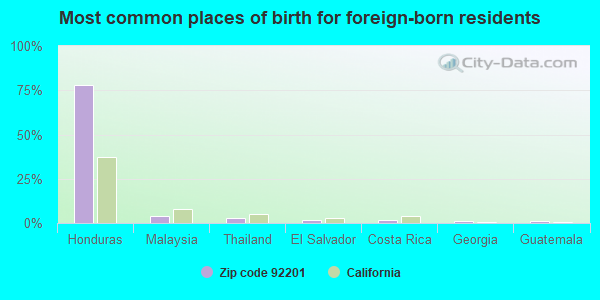
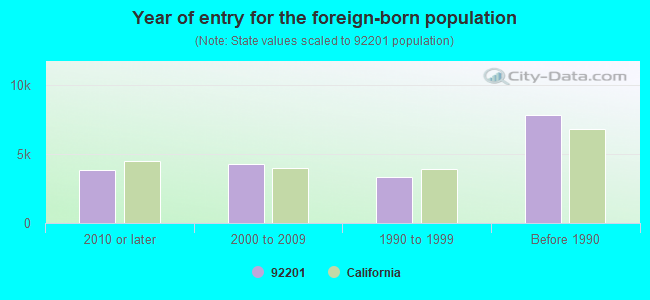
Foreign born population: 18,718 (29.3%) (48.3% of them are naturalized citizens)
Major facilities with environmental interests located in this zip code:
GRANITE CONSTRUCTION COMPANY (38155 MONROE STREET in INDIO, CA)
STATE MASTER (California - Hazardous Waste Tracking) - HAZARDOU WASTE PROGRAM CRITERIA AND HAZARDOUS AIR POLLUTANT INVENTORY (Inventory of air pollution sources) Large Quantity Generators, more that 1000 kg of hazardous waste/month (Resource Conservation and Recovery Act (tracking hazardous waste)) Business SIC classification: ASPHALT PAVING MIXTURES AND BLOCKS; REFUSE SYSTEMS Business NAICS classification: ASPHALT PAVING MIXTURE AND BLOCK MANUFACTURING.; SOLID WASTE LANDFILL.; SOLID WASTE LANDFILL. Alternative names: INDIO LANDFILL, MASSEY SAND AND ROCK
G AND C SMOG AND AUTO REPAIR (83420 INDIO BLVD STE B in INDIO, CA)
STATE MASTER (California - Hazardous Waste Tracking) - HAZARDOU WASTE PROGRAM Small Quantity Generators, between 100 kg and 1000 kg of hazardous waste/month (Resource Conservation and Recovery Act (tracking hazardous waste)) - notification Small Quantity Generators, between 100 kg and 1000 kg of hazardous waste/month (Resource Conservation and Recovery Act (tracking hazardous waste)) - notification Organizations: RUDY S GARZA (CONTACT/OWNER)
, JOSE COTA AND RAUL S GARZA (CONTACT/OWNER)
STATE MASTER (California - Hazardous Waste Tracking) - HAZARDOU WASTE PROGRAM Small Quantity Generators, between 100 kg and 1000 kg of hazardous waste/month (Resource Conservation and Recovery Act (tracking hazardous waste)) - notification Organizations: ROBERT AND JACKIE WILMETH (CONTACT/OWNER)
Alternative names: MARSHALLS FASHIONS CLEANERS
AAMCO TRANSMISSION (83533 HWY 111 in INDIO, CA)
STATE MASTER (California - Hazardous Waste Tracking) - HAZARDOU WASTE PROGRAM Small Quantity Generators, between 100 kg and 1000 kg of hazardous waste/month (Resource Conservation and Recovery Act (tracking hazardous waste)) - notification Organizations: MARIO VASQUEZ (CONTACT/OWNER)
EC SEWER SERVICE INC (84035 CABAZON RD in INDIO, CA) . Tribal Land
STATE MASTER (California - Hazardous Waste Tracking) - HAZARDOU WASTE PROGRAM TRANSPORTER (Resource Conservation and Recovery Act (tracking hazardous waste)) Organizations: SUSAN JOHNSON (CONTACT/OWNER)
ELMS EQUIPMENT RENTAL INC (81 531 INDUSTRIAL PLACE in INDIO, CA)
STATE MASTER (California - Hazardous Waste Tracking) - HAZARDOU WASTE PROGRAM Small Quantity Generators, between 100 kg and 1000 kg of hazardous waste/month (Resource Conservation and Recovery Act (tracking hazardous waste)) - notification Organizations: QUINTET LEASING (CONTACT/OWNER)
Alternative names: ELLIS TRANSPORTATION
FOOTE PHOTO CO (46 350 ARABIA in INDIO, CA)
STATE MASTER (California - Hazardous Waste Tracking) - HAZARDOU WASTE PROGRAM Small Quantity Generators, between 100 kg and 1000 kg of hazardous waste/month (Resource Conservation and Recovery Act (tracking hazardous waste)) - notification Organizations: ROBIN GRAY (CONTACT/OWNER)
CHEVRON STATION NO 90201 (82003 HWY 111 in INDIO, CA)
STATE MASTER (California - Hazardous Waste Tracking) - HAZARDOU WASTE PROGRAM Small Quantity Generators, between 100 kg and 1000 kg of hazardous waste/month (Resource Conservation and Recovery Act (tracking hazardous waste)) - notification Organizations: CHEVRON PRODUCTS CO (CONTACT/OWNER)
MADISON (JAMES) ELEMENTARY (80-845 AVE. 46 in INDIO, CA)
(National Center for Education Statistics) - STATE ID-6108955 Organizations: DESERT SANDS UNIFIED (SCHOOL DISTRICT)
AMISTAD HIGH (CONT.) (44-800 AUTO CENTER DR. in INDIO, CA)
(National Center for Education Statistics) - STATE ID-3331113 Organizations: DESERT SANDS UNIFIED (SCHOOL DISTRICT)
EISENHOWER (DWIGHT) ELEMENTARY (83-391 DILLON AVE. in INDIO, CA)
(National Center for Education Statistics) - STATE ID-6031942 Organizations: DESERT SANDS UNIFIED (SCHOOL DISTRICT)
FORD (GERALD R.) ELEMENTARY (44-210 WARNER TRAIL in INDIO, CA)
(National Center for Education Statistics) - STATE ID-6109789 Organizations: DESERT SANDS UNIFIED (SCHOOL DISTRICT)
Housing units lacking complete plumbing facilities: 0.6% Housing units lacking complete kitchen facilities: 1.0%
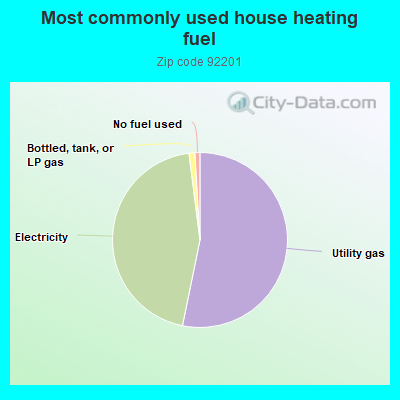
52.9%Utility gas
44.5%Electricity
1.1%Bottled, tank, or LP gas
0.9%No fuel used
Population in 1990: 47,118. Population change in the 1990s: +9,178 (+19.5%).
Place of birth for U.S.-born residents:
This state: 37,292
Northeast: 1,626
Midwest: 2,055
South: 1,653
West: 1,913
52% of the 92201 zip code residents lived in the same house 5 years ago. Out of people who lived in different houses, 79% lived in this county. Out of people who lived in different counties, 50% lived in California.
94% of the 92201 zip code residents lived in the same house 1 year ago. Out of people who lived in different houses, 55% moved from this county. Out of people who lived in different houses, 20% moved from different county within same state. Out of people who lived in different houses, 16% moved from different state. Out of people who lived in different houses, 15% moved from abroad.
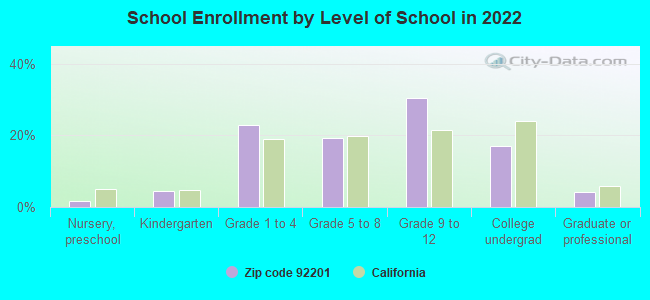
Private vs. public school enrollment:
Students in private schools in grades 1 to 8 (elementary and middle school): 349
Here:
6.0%
California:
10.5%
Students in private schools in grades 9 to 12 (high school): 205
Here:
4.8%
California:
8.5%
Students in private undergraduate colleges: 186
Here:
7.9%
California:
15.9%
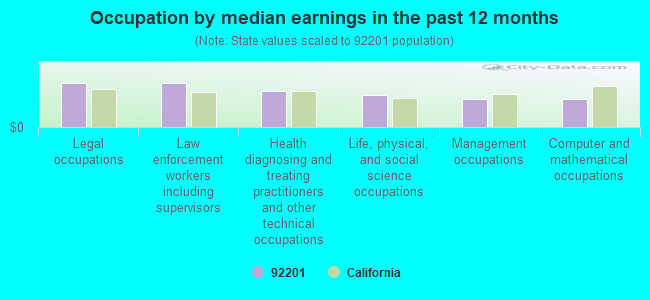
Occupation by median earnings in the past 12 months ($)
111,436Legal occupations
110,964Law enforcement workers including supervisors
91,224Health diagnosing and treating practitioners and other technical occupations
81,779Life, physical, and social science occupations
70,418Management occupations
70,230Computer and mathematical occupations
Companies with federal contracts located in this zip code (INDIO, CA):
T & M CONSTRUCTION, INC (81-920 INDUSTRIAL PLACE; small business) : $139,676 in 13 contractsfrom 2002 to 2006
Contracts for Fueling and Other Petroleum Services - Excluding Storage, Maintenance, Repair and Rebuilding of Equipment -- Fuels, Lubricants, Oils, and Waxes by Navy Signed by year:2000: $0; 2001: $0; 2002: $19,115; 2003: $47,894; 2004: $33,761; 2005: $19,843; 2006: $19,063.
Biggest contracts:
$28,687 with Navy for Fueling and Other Petroleum Services - Excluding Storage. Signed on 2004-10-25. Completion date: 2004-10-28.
$26,079, same as above.Signed on 2003-10-16. Completion date: 2004-10-28.
$19,843, same as above.Signed on 2005-03-31. Completion date: 2005-04-25.
$19,115, same as above.Signed on 2002-07-29. Completion date: 2003-07-30.
HERTZ EQUIPMENT RENTAL CORP (81495 INDUSTRIAL PLACE) : $133,305 in 4 contractsfrom 2000 to 2005
$40,337 with Navy for Lease or Rental of Equipment -- Ground Effect Vehicles, Motor Vehicles, Trailers, and Cycles. Signed on 2000-01-20. Completion date: 2000-03-24.
$40,015, same as above.Signed on 2002-09-03. Completion date: 2002-09-27.
$39,873 with Navy for Lease or Rental of Equipment -- Space Vehicles. Signed on 2003-10-06. Completion date: 2003-10-14.
$13,080 with Navy for Lease or Rental of Equipment -- Vehicular Equipment Components. Signed on 2005-09-09. Completion date: 2005-10-08.
UNITED RENTALS INC (83525 DATE AVE; small business) : $88,132 in 2 contractsfrom 2001 to 2005
$85,470 with Navy for Lease or Rental of Equipment -- Construction, Mining, Excavating, and Highway Maintenance Equipment. Signed on 2001-08-30. Completion date: 2001-09-07.
$2,662, same as above.Signed on 2005-09-10. Completion date: 2005-09-15.
UNICAST, INC (83-810 VIN DEO CIRCLE 402; small business) : $35,784 in 3 contractsin 2002
$35,784 with Defense Logistics Agency for Miscellaneous Power Transmission Equipment. Signed on 2002-07-05. Completion date: 2003-05-31.
$0 with Defense Logistics Agency for Optical Sighting and Ranging Equipment. Signed on 2002-09-30. Completion date: 2004-09-29.
$0 with Defense Logistics Agency for Launchers, Rocket and Pyrotechnic. Signed on 2002-07-15. Completion date: 2003-07-14.
COACHELLA VALLEY PRINTING GROU (45-140 TOWN ST; small business)
$3,650 with Army for Printing, Duplicating, and Bookbinding Equipment. Signed on 2004-07-16. Completion date: 2004-06-30.
Top industries in this zip code by the number of employees in 2005:
Administrative and Support and Waste Management and Remediation Services: Landscaping Services (250-499 employees: 1 establishment, 100-249 employees: 2 establishments, 50-99 employees: 3 establishments, 20-49 employees: 4 establishments, 10-19 employees: 5 establishments, 5-9 employees: 8 establishments, 1-4 employees: 22 establishments)
2006 - 2018 National Fire Incident Reporting System (NFIRS) incidents
According to the data from the years 2006 - 2018 the average number of fires per year is 197. The highest number of fire incidents - 279 took place in 2016, and the least - 46 in 2006. The data has an increasing trend.
When looking into fire subcategories, the most incidents belonged to: Outside Fires (52.4%), and Mobile Property/Vehicle Fires (23.7%).
Fire incident types reported to NFIRS in Zip Code 92201
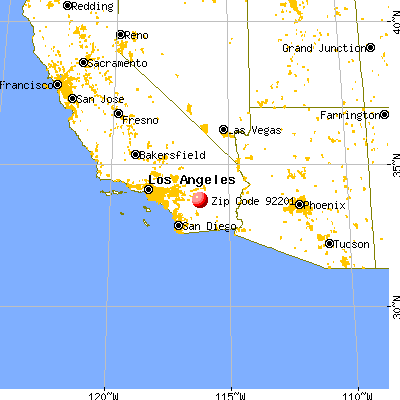


 Nearest zip codes: 92236, 92203, 92253, 92210, 92211, 92241.


 According to the data from the years 2006 - 2018 the average number of fires per year is 197. The highest number of fire incidents - 279 took place in 2016, and the least - 46 in 2006. The data has an increasing trend.
 When looking into fire subcategories, the most incidents belonged to: Outside Fires (52.4%), and Mobile Property/Vehicle Fires (23.7%).