Estimated zip code population in 2022: 37,583 Zip code population in 2010: 37,262 Zip code population in 2000: 23,970
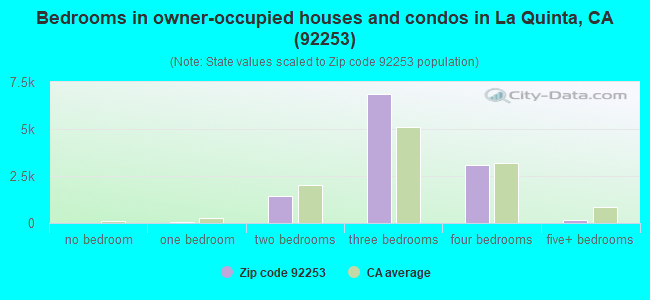
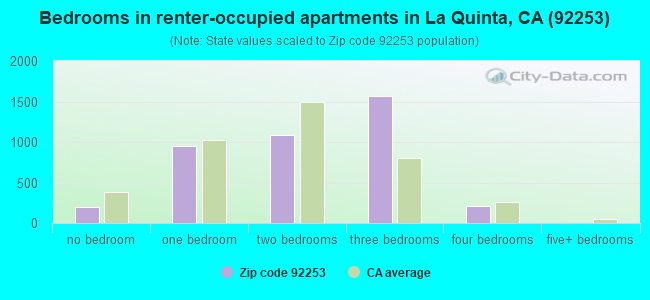
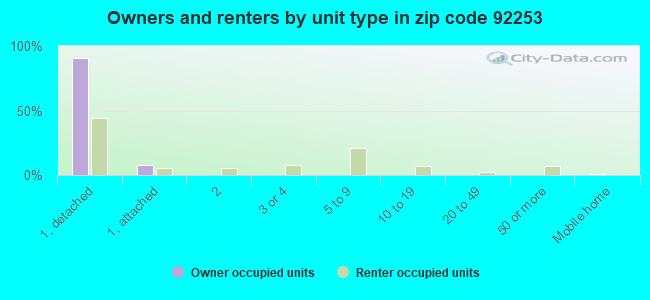
Houses and condos: 24,802 Renter-occupied apartments: 4,011
% of renters here:
26%
State:
44%
March 2022 cost of living index in zip code 92253: 82.6 (low, U.S. average is 100)
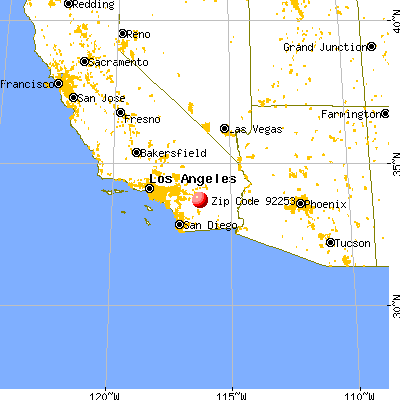
Land area: 35.0 sq. mi. Water area: 0.4 sq. mi.
Population density: 1,074 people per square mile
(low).
OSM Map
General Map
Google Map
MSN Map
OSM Map
General Map
Google Map
MSN Map
OSM Map
General Map
Google Map
MSN Map
OSM Map
General Map
Google Map
MSN Map
Please wait while loading the map...
Real estate property taxes paid for housing units in 2022:
This zip code:
0.9% ($5,389)
California:
0.7% ($4,831)
Median real estate property taxes paid for housing units with mortgages in 2022: $5,112 (0.9%) Median real estate property taxes paid for housing units with no mortgage in 2022: $6,168 (0.9%)
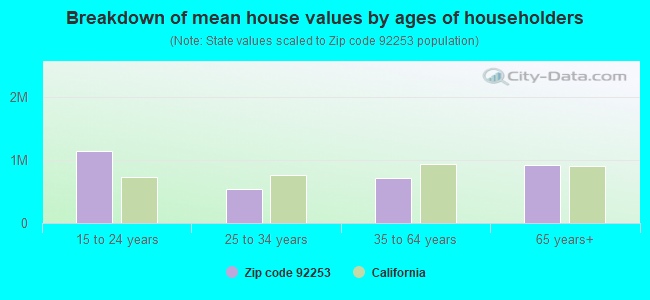
Estimated median house/condo value in 2022: $608,618
92253:
$608,618
California:
$715,900
According to our research of California and other state lists, there were 20 registered sex offenders living in 92253 zip code as of April 27, 2024. The ratio of all residents to sex offenders in zip code 92253 is 2,000 to 1. The ratio of registered sex offenders to all residents in this zip code is much lower than the state average.
Median resident age:
This zip code:
51.8 years
California median age:
37.9 years
Average household size:
This zip code:
2.4 people
California:
2.8 people
Averages for the 2020 tax year for zip code 92253, filed in 2021:
Average Adjusted Gross Income (AGI) in 2020: $94,860 (Individual Income Tax Returns)
Here:
$94,860
State:
$95,910
Salary/wage: $69,979 (reported on 71.0% of returns)
Here:
$69,979
State:
$77,331
(% of AGI for various income ranges: 1149.7% for AGIs below $25k, 3588.8% for AGIs $25k-50k, 6541.9% for AGIs $50k-75k, 9557.6% for AGIs $75k-100k, 18798.7% for AGIs $100k-200k, 101238.2% for AGIs over 200k)
Taxable interest for individuals: $2,622 (reported on 44.6% of returns)
This zip code:
$2,622
California:
$2,294
(% of AGI for various income ranges: 33.4% for AGIs below $25k, 50.2% for AGIs $25k-50k, 106.1% for AGIs $50k-75k, 173.8% for AGIs $75k-100k, 450.7% for AGIs $100k-200k, 2887.4% for AGIs over 200k)
Ordinary dividends: $13,242 (reported on 26.1% of returns)
Here:
$13,242
State:
$10,949
(% of AGI for various income ranges: 63.5% for AGIs below $25k, 105.9% for AGIs $25k-50k, 197.3% for AGIs $50k-75k, 509.3% for AGIs $75k-100k, 1133.7% for AGIs $100k-200k, 10302.6% for AGIs over 200k)
Net capital gain/loss in AGI: +$30,941 (reported on 26.5% of returns)
Here:
+$30,941
State:
+$49,306
(% of AGI for various income ranges: 24.5% for AGIs below $25k, 82.4% for AGIs $25k-50k, 178.5% for AGIs $50k-75k, 328.9% for AGIs $75k-100k, 1429.7% for AGIs $100k-200k, 34804.4% for AGIs over 200k)
Profit/loss from business: +$17,526 (reported on 21.2% of returns)
Here:
+$17,526
State:
+$15,671
(% of AGI for various income ranges: 185.4% for AGIs below $25k, 269.4% for AGIs $25k-50k, 485.2% for AGIs $50k-75k, 601.7% for AGIs $75k-100k, 1314.3% for AGIs $100k-200k, 7330.9% for AGIs over 200k)
Taxable individual retirement arrangement distribution: $32,959 (reported on 13.3% of returns)
92253:
$32,959
California:
$23,505
(% of AGI for various income ranges: 67.0% for AGIs below $25k, 170.8% for AGIs $25k-50k, 372.9% for AGIs $50k-75k, 876.1% for AGIs $75k-100k, 2302.6% for AGIs $100k-200k, 8785.0% for AGIs over 200k)
Self-employed (Keogh) retirement plans: $26,338 (reported on 1.2% of returns)
92253:
$26,338
California:
$30,163
(% of AGI for various income ranges: 37.7% for AGIs $50k-75k, 84.8% for AGIs $100k-200k, 1175.3% for AGIs over 200k)
Total itemized deductions: $35,539 (reported on 21.3% of returns)
Here:
$35,539
State:
$39,517
(% of AGI for various income ranges: 196.8% for AGIs below $25k, 422.0% for AGIs $25k-50k, 961.0% for AGIs $50k-75k, 1693.0% for AGIs $75k-100k, 3269.6% for AGIs $100k-200k, 14212.1% for AGIs over 200k)
Charity contributions: $7,925 (reported on 18.0% of returns)
Here:
$7,925
State:
$12,598
(% of AGI for various income ranges: 9.5% for AGIs below $25k, 40.2% for AGIs $25k-50k, 109.8% for AGIs $50k-75k, 208.7% for AGIs $75k-100k, 541.4% for AGIs $100k-200k, 4056.8% for AGIs over 200k)
Taxes paid: $8,742 (reported on 21.3% of returns)
92253:
$8,742
State:
$8,807
(% of AGI for various income ranges: 44.7% for AGIs below $25k, 97.4% for AGIs $25k-50k, 249.1% for AGIs $50k-75k, 516.7% for AGIs $75k-100k, 924.1% for AGIs $100k-200k, 2828.2% for AGIs over 200k)
Earned income credit: $2,061 (reported on 13.3% of returns)
Here:
$2,061
State:
$2,074
(% of AGI for various income ranges: 93.4% for AGIs below $25k, 81.3% for AGIs $25k-50k, 0.8% for AGIs $50k-75k)
Percentage of individuals using paid preparers for their 2020 taxes: 92.4%
Here:
92%
State:
92%
(% for various income ranges: 89.9% for AGIs below $25k, 91.9% for AGIs $25k-50k, 93.0% for AGIs $50k-75k, 93.1% for AGIs $75k-100k, 94.7% for AGIs $100k-200k, 94.7% for AGIs over 200k)
Averages for the 2012 tax year for zip code 92253, filed in 2013:
Average Adjusted Gross Income (AGI) in 2012: $80,290 (Individual Income Tax Returns)
Here:
$80,290
State:
$72,726
Salary/wage: $57,339 (reported on 74.0% of returns)
Here:
$57,339
State:
$59,079
(% of AGI for various income ranges: 68.0% for AGIs below $25k, 70.2% for AGIs $25k-50k, 66.6% for AGIs $50k-75k, 62.6% for AGIs $75k-100k, 58.9% for AGIs $100k-200k, 36.0% for AGIs over 200k)
Taxable interest for individuals: $3,683 (reported on 45.1% of returns)
This zip code:
$3,683
California:
$2,146
(% of AGI for various income ranges: 2.2% for AGIs below $25k, 1.5% for AGIs $25k-50k, 1.2% for AGIs $50k-75k, 1.6% for AGIs $75k-100k, 1.7% for AGIs $100k-200k, 2.8% for AGIs over 200k)
Ordinary dividends: $11,086 (reported on 25.3% of returns)
Here:
$11,086
State:
$9,308
(% of AGI for various income ranges: 2.9% for AGIs below $25k, 2.3% for AGIs $25k-50k, 2.3% for AGIs $50k-75k, 2.8% for AGIs $75k-100k, 2.8% for AGIs $100k-200k, 4.9% for AGIs over 200k)
Net capital gain/loss in AGI: +$29,515 (reported on 24.6% of returns)
Here:
+$29,515
State:
+$30,460
(% of AGI for various income ranges: 0.5% for AGIs $25k-50k, 0.9% for AGIs $50k-75k, 1.2% for AGIs $75k-100k, 2.0% for AGIs $100k-200k, 21.7% for AGIs over 200k)
Profit/loss from business: +$18,284 (reported on 21.6% of returns)
Here:
+$18,284
State:
+$17,064
(% of AGI for various income ranges: 13.5% for AGIs below $25k, 6.3% for AGIs $25k-50k, 5.5% for AGIs $50k-75k, 6.2% for AGIs $75k-100k, 3.9% for AGIs $100k-200k, 3.6% for AGIs over 200k)
Taxable individual retirement arrangement distribution: $31,695 (reported on 14.9% of returns)
92253:
$31,695
California:
$19,557
(% of AGI for various income ranges: 4.6% for AGIs below $25k, 3.9% for AGIs $25k-50k, 4.6% for AGIs $50k-75k, 5.1% for AGIs $75k-100k, 7.8% for AGIs $100k-200k, 5.8% for AGIs over 200k)
Self-employment retirement plans: $29,482 (reported on 1.1% of returns)
92253:
$29,482
California:
$24,530
(% of AGI for various income ranges: 0.2% for AGIs below $25k, 0.2% for AGIs $50k-75k, 0.4% for AGIs $75k-100k, 0.4% for AGIs $100k-200k, 0.7% for AGIs over 200k)
Total itemized deductions: $33,882 (25% of AGI, reported on 48.8% of returns)
Here:
$33,882
State:
$34,004
Here:
25.4% of AGI
State:
22.7% of AGI
(% of AGI for various income ranges: 21.6% for AGIs below $25k, 20.9% for AGIs $25k-50k, 22.1% for AGIs $50k-75k, 22.9% for AGIs $75k-100k, 22.7% for AGIs $100k-200k, 17.9% for AGIs over 200k)
Charity contributions: $3,831 (reported on 41.1% of returns)
Here:
$3,831
State:
$4,659
(% of AGI for various income ranges: 1.2% for AGIs below $25k, 1.7% for AGIs $25k-50k, 2.0% for AGIs $50k-75k, 2.1% for AGIs $75k-100k, 2.1% for AGIs $100k-200k, 2.0% for AGIs over 200k)
Taxes paid: $13,086 (reported on 48.8% of returns)
92253:
$13,086
State:
$14,448
(% of AGI for various income ranges: 5.0% for AGIs below $25k, 5.6% for AGIs $25k-50k, 6.4% for AGIs $50k-75k, 7.4% for AGIs $75k-100k, 8.4% for AGIs $100k-200k, 9.2% for AGIs over 200k)
Earned income credit: $2,437 (reported on 17.4% of returns)
Here:
$2,437
State:
$2,286
(% of AGI for various income ranges: 7.3% for AGIs below $25k, 1.4% for AGIs $25k-50k)
Percentage of individuals using paid preparers for their 2012 taxes: 68.1%
Here:
68%
State:
64%
(% for various income ranges: 62.2% for AGIs below $25k, 66.7% for AGIs $25k-50k, 69.0% for AGIs $50k-75k, 70.7% for AGIs $75k-100k, 74.1% for AGIs $100k-200k, 84.5% for AGIs over 200k)
Averages for the 2004 tax year for zip code 92253, filed in 2005:
Average Adjusted Gross Income (AGI) in 2004: $80,277 (Individual Income Tax Returns)
Here:
$80,277
State:
$58,600
Salary/wage: $60,742 (reported on 77.4% of returns)
Here:
$60,742
State:
$49,455
(% of AGI for various income ranges: 70.7% for AGIs $10k-25k, 75.2% for AGIs $25k-50k, 72.7% for AGIs $50k-75k, 69.0% for AGIs $75k-100k, 46.8% for AGIs over 100k)
Taxable interest for individuals: $4,184 (reported on 54.9% of returns)
This zip code:
$4,184
California:
$2,365
(% of AGI for various income ranges: 3.1% for AGIs $10k-25k, 2.2% for AGIs $25k-50k, 2.0% for AGIs $50k-75k, 2.4% for AGIs $75k-100k, 2.7% for AGIs over 100k)
Taxable dividends: $6,775 (reported on 30.1% of returns)
Here:
$6,775
State:
$4,746
(% of AGI for various income ranges: 2.5% for AGIs $10k-25k, 1.7% for AGIs $25k-50k, 1.6% for AGIs $50k-75k, 2.3% for AGIs $75k-100k, 2.5% for AGIs over 100k)
Net capital gain/loss: +$39,172 (reported on 29.9% of returns)
Here:
+$39,172
State:
+$23,418
(% of AGI for various income ranges: 0.3% for AGIs $10k-25k, 1.0% for AGIs $25k-50k, 1.9% for AGIs $50k-75k, 3.2% for AGIs $75k-100k, 20.0% for AGIs over 100k)
Profit/loss from business: +$21,525 (reported on 22.9% of returns)
Here:
+$21,525
State:
+$16,826
(% of AGI for various income ranges: 11.6% for AGIs $10k-25k, 6.9% for AGIs $25k-50k, 6.4% for AGIs $50k-75k, 5.9% for AGIs $75k-100k, 5.3% for AGIs over 100k)
IRA payment deduction: $3,634 (reported on 3.4% of returns)
92253:
$3,634
California:
$3,192
(% of AGI for various income ranges: 0.2% for AGIs $10k-25k, 0.3% for AGIs $25k-50k, 0.3% for AGIs $50k-75k, 0.2% for AGIs $75k-100k, 0.1% for AGIs over 100k)
Self-employed pension: $21,766 (reported on 2.1% of returns)
Here:
$21,766
California:
$17,688
(% of AGI for various income ranges: 0.3% for AGIs $25k-50k, 0.3% for AGIs $50k-75k, 0.3% for AGIs $75k-100k, 0.7% for AGIs over 100k)
Total itemized deductions: $31,328 (24% of AGI, reported on 57.1% of returns)
Here:
$31,328
State:
$28,113
Here:
24.1% of AGI
State:
25.3% of AGI
(% of AGI for various income ranges: 25.9% for AGIs $10k-25k, 26.1% for AGIs $25k-50k, 28.1% for AGIs $50k-75k, 27.8% for AGIs $75k-100k, 17.9% for AGIs over 100k)
Charity contributions deductions: $3,337 (2% of AGI, reported on 50.8% of returns)
Here:
$3,337
State:
$3,923
Here:
2.4% of AGI
State:
3.3% of AGI
(% of AGI for various income ranges: 1.7% for AGIs $10k-25k, 2.2% for AGIs $25k-50k, 2.6% for AGIs $50k-75k, 2.7% for AGIs $75k-100k, 1.8% for AGIs over 100k)
Total tax: $16,882 (reported on 77.4% of returns)
92253:
$16,882
State:
$10,761
(% of AGI for various income ranges: 4.5% for AGIs $10k-25k, 6.0% for AGIs $25k-50k, 7.9% for AGIs $50k-75k, 9.3% for AGIs $75k-100k, 19.8% for AGIs over 100k)
Earned income credit: $1,754 (reported on 12.7% of returns)
Here:
$1,754
State:
$1,763
Percentage of individuals using paid preparers for their 2004 taxes: 73.1%
Here:
73%
State:
66%
(% for various income ranges: 64.6% for AGIs below $10k, 70.2% for AGIs $10k-25k, 71.8% for AGIs $25k-50k, 75.7% for AGIs $50k-75k, 72.9% for AGIs $75k-100k, 82.5% for AGIs over 100k)
Likely homosexual households (counted as self-reported same-sex unmarried-partner households)
Lesbian couples: 0.1% of all households
Gay men: 0.2% of all households
Household received Food Stamps/SNAP in the past 12 months: 968 Household did not receive Food Stamps/SNAP in the past 12 months: 14,454
Women who had a birth in the past 12 months: 279 (228 now married, 51 unmarried) Women who did not have a birth in the past 12 months: 5,801 (2,446 now married, 3,349 unmarried)
Housing units in zip code 92253 with a mortgage: 7,701 (534 second mortgage, 37 home equity loan, 433 both second mortgage and home equity loan) Houses without a mortgage: 120
Median monthly owner costs for units with a mortgage: $2,408 Median monthly owner costs for units without a mortgage: $988
Residents with income below the poverty level in 2022:
This zip code:
9.5%
Whole state:
12.2%
Residents with income below 50% of the poverty level in 2022:
This zip code:
5.5%
Whole state:
6.2%
Median number of rooms in houses and condos:
Here:
5.9
State:
6.0
Median number of rooms in apartments:
Here:
4.1
State:
3.9
Notable locations in this zip code not listed on our city pages
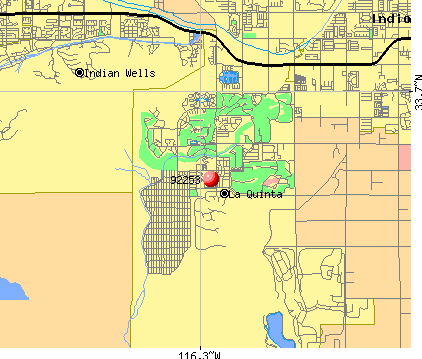
Notable locations in zip code 92253: TPC Stadium Golf Course (A), The Pyramids Club (B), Professional Golfers Association West Golf Course (C), Palm Royale Country Club (D), Pete Dye Resort Golf Course (E), La Quinta Mountain Golf Course (F), La Quinta Dunes Golf Course (G), La Quinta Citrus Golf Course (H), Jack Nicklaus Resort Golf Course (I), Jack Nicklaus Private Golf Course (J), Arnold Palmer Golf Course (K), La Quinta City Hall (L), La Quinta Branch Riverside City and County Public Library (M), Riverside County Fire Department Station 93 La Quinta North (N), Riverside County Fire Department Station 70 La Quinta South (O), Riverside County Fire Department Station 32 La Quinta (P). Display/hide their locations on the map
Parks in zip code 92253 include: Lake Cahuilla County Park (1), Fritz Burns Park (2), La Quinta Community Park (3), Lake Cahuilla Park (4). Display/hide their locations on the map
In group quarters: 81 (-1 institutionalized population)
Size of family households: 6,402 2-persons, 1,736 3-persons, 1,456 4-persons, 829 5-persons, 118 6-persons, 118 7-or-more-persons
Size of nonfamily households: 4,122 1-person, 896 2-persons, 44 3-persons
3,479 married couples with children.
2,032 single-parent households (768 men, 1,264 women).
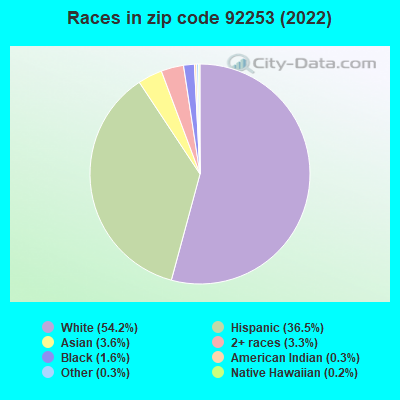
71.7% of residents of 92253 zip code speak English at home.
24.2% of residents speak Spanish at home (71% very well, 18% well, 9% not well, 2% not at all).
2.3% of residents speak other Indo-European language at home (84% very well, 13% well, 3% not well).
1.9% of residents speak Asian or Pacific Island language at home (67% very well, 19% well, 14% not well).
0.3% of residents speak other language at home (84% very well, 16% well).
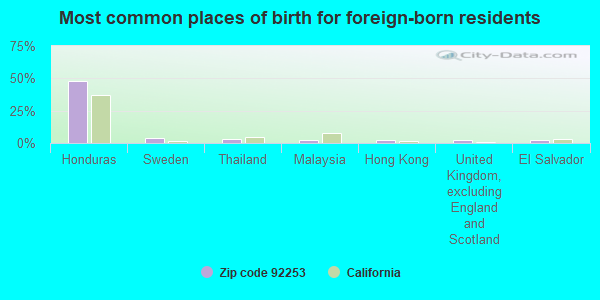
Foreign born population: 5,383 (14.3%) (67.8% of them are naturalized citizens)
This zip code:
14.3%
Whole state:
26.7%
48%Honduras
4%Sweden
3%Thailand
3%Malaysia
3%Hong Kong
2%United Kingdom, excluding England and Scotland
2%El Salvador
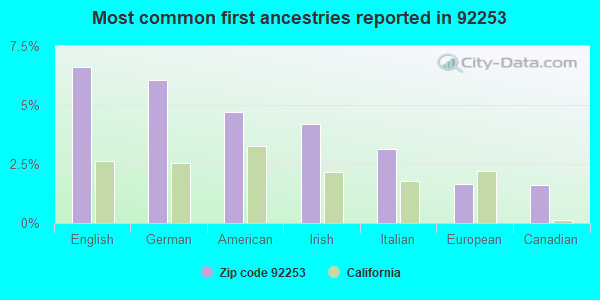
7%English
6%German
5%American
4%Irish
3%Italian
2%European
2%Canadian
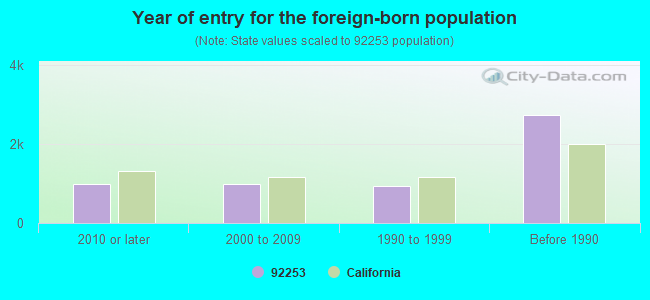
Year of entry for the foreign-born population
9952010 or later
9892000 to 2009
9491990 to 1999
2,741Before 1990
Facilities with environmental interests located in this zip code:
EMERALD DESERT CLEANERS (78 580 HWY 111 in LA QUINTA, CA)
STATE MASTER (California - Hazardous Waste Tracking) - HAZARDOU WASTE PROGRAM Small Quantity Generators, between 100 kg and 1000 kg of hazardous waste/month (Resource Conservation and Recovery Act (tracking hazardous waste)) - notification Organizations: GEARALD HILL (CONTACT/OWNER)
MAZDA SUPERSTORE (79225 HWY 111 in LA QUINTA, CA)
STATE MASTER (California - Hazardous Waste Tracking) - HAZARDOU WASTE PROGRAM Small Quantity Generators, between 100 kg and 1000 kg of hazardous waste/month (Resource Conservation and Recovery Act (tracking hazardous waste)) - notification Organizations: J P S CORP (CONTACT/OWNER)
MINT CLEANERS (50949 WASHINGTON in LA QUINTA, CA)
STATE MASTER (California - Hazardous Waste Tracking) - HAZARDOU WASTE PROGRAM Small Quantity Generators, between 100 kg and 1000 kg of hazardous waste/month (Resource Conservation and Recovery Act (tracking hazardous waste)) - notification Organizations: ALAN KIM (CONTACT/OWNER)
AMELIA EARHART ELMENTARY SCHOOL OF INTERNATIONAL S (45-250 DUNE PALMS ROAD in LA QUINTA, CA)
(National Center for Education Statistics) - STATE ID-6118863 Organizations: DESERT SANDS UNIFIED (SCHOOL DISTRICT)
HORIZON SCHOOL (47-950 DUNE PALMS RD. in LA QUINTA, CA)
(National Center for Education Statistics) - STATE ID-3330909 Organizations: DESERT SANDS UNIFIED (SCHOOL DISTRICT)
JOHN ADAMS ELEMENTARY (50-800 DESERT CLUB DR. in LA QUINTA, CA)
(National Center for Education Statistics) - STATE ID-6113898 Organizations: DESERT SANDS UNIFIED (SCHOOL DISTRICT)
LA QUINTA HIGH (79-255 WESTWARD HO DR. in LA QUINTA, CA)
(National Center for Education Statistics) - STATE ID-3330669 Organizations: DESERT SANDS UNIFIED (SCHOOL DISTRICT)
LA QUINTA MIDDLE (78-900 AVE. , NO. 50 in LA QUINTA, CA)
(National Center for Education Statistics) - STATE ID-6107759 Organizations: DESERT SANDS UNIFIED (SCHOOL DISTRICT)
LA QUINTA DRY CLEANERS (78279 US HWY 111 in LA QUINTA, CA)
Large Quantity Generators, more that 1000 kg of hazardous waste/month (Resource Conservation and Recovery Act (tracking hazardous waste)) Organizations: PATRICK CORINITA (CONTACT/OPERATOR)
, M & H REALTY PARTNERS 2 LP (CONTACT/OWNER)
Alternative names: LA QUINTA CLEANERS
LOWES HOME IMPROVEMENT WAREHOUSE LA QUINTA 208 (78 865 HWY 111 in LA QUINTA, CA)
(Resource Conservation and Recovery Act (tracking hazardous waste)) Organizations: LOWES H I W INC (CONTACT/OWNER)
Alternative names: EAGLE HARDWARE AND GARDEN NO 491, LOWES H I W LA QUINTA 208
LQ VILLAGE APTS/HOMES (HOUSING DEVELOP.) (EISENHAUER/CALLE TAMPICO in LA QUINTA, CA)
AIR MINOR (AIRS/AFS) Business SIC classification: GENERAL CONTRACTORS-SINGLE-FAMILY HOUSES
LA QUINTA HOTEL ENGINEERING (49499 EISENHOWER DR in LA QUINTA, CA)
Small Quantity Generators, between 100 kg and 1000 kg of hazardous waste/month (Resource Conservation and Recovery Act (tracking hazardous waste)) - notification
Housing units lacking complete plumbing facilities: 1.1% Housing units lacking complete kitchen facilities: 2.2%
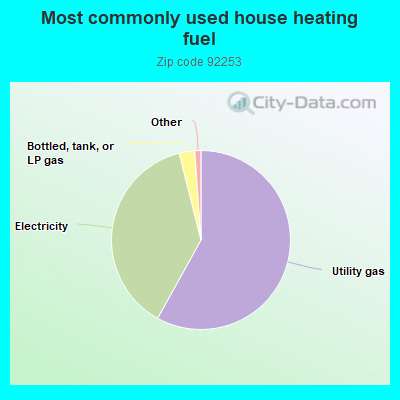
58.0%Utility gas
38.0%Electricity
2.8%Bottled, tank, or LP gas
Population in 1990: 9,392. Population change in the 1990s: +14,578 (+155.2%).
Place of birth for U.S.-born residents:
This state: 21,226
Northeast: 2,410
Midwest: 4,075
South: 1,924
West: 1,955
41% of the 92253 zip code residents lived in the same house 5 years ago. Out of people who lived in different houses, 57% lived in this county. Out of people who lived in different counties, 50% lived in California.
90% of the 92253 zip code residents lived in the same house 1 year ago. Out of people who lived in different houses, 34% moved from this county. Out of people who lived in different houses, 41% moved from different county within same state. Out of people who lived in different houses, 20% moved from different state. Out of people who lived in different houses, 7% moved from abroad.
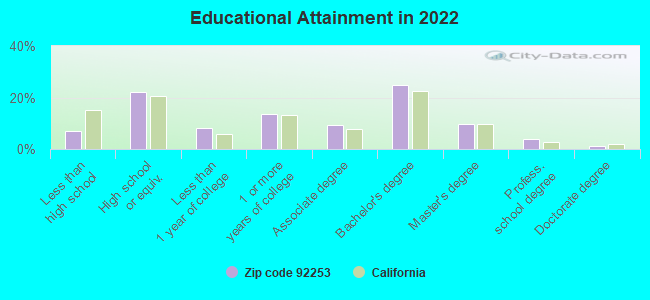
Private vs. public school enrollment:
Students in private schools in grades 1 to 8 (elementary and middle school): 498
Here:
17.2%
California:
10.5%
Students in private schools in grades 9 to 12 (high school): 180
Here:
10.0%
California:
8.5%
Students in private undergraduate colleges: 135
Here:
8.2%
California:
15.9%
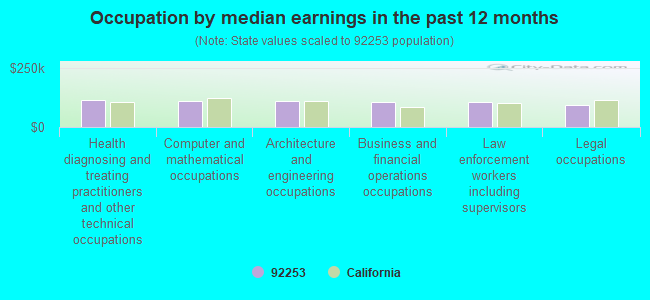
Occupation by median earnings in the past 12 months ($)
111,595Health diagnosing and treating practitioners and other technical occupations
110,082Computer and mathematical occupations
107,845Architecture and engineering occupations
107,108Business and financial operations occupations
106,621Law enforcement workers including supervisors
93,753Legal occupations
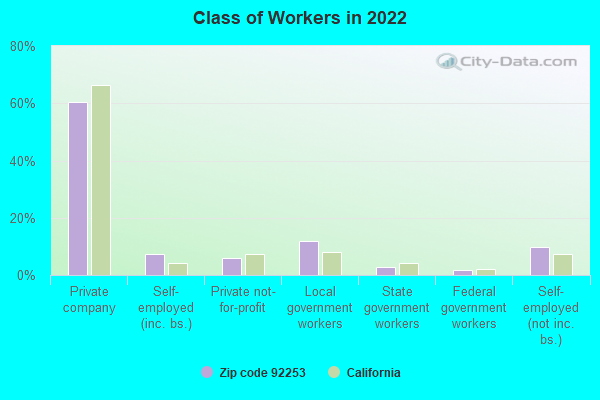
Companies with federal contracts located in this zip code:
CNL RESORT ANCILLARY TENANT CO (49-499 EISENHOWER DRIVE in LA QUINTA, CA)
$22,095 with Defense Contract Management Agency for Lease or Rental of Facilities -- Conference Space and Facilities. Signed on 2005-12-08. Completion date: 2006-01-27.
ADVANCED WEAPONS TECHNOLOGY, I (48290 VISTA CALICO in LA QUINTA, CA; small business)
$7,924 with Navy for Engineering and Technical Services. Signed on 2005-03-02. Completion date: 2005-03-31.
Top industries in this zip code by the number of employees in 2005:
Accommodation and Food Services: Hotels (except Casino Hotels) and Motels (over 1000 employees: 1 establishment)
2006 - 2018 National Fire Incident Reporting System (NFIRS) incidents
Based on the data from the years 2006 - 2018 the average number of fires per year is 70. The highest number of fire incidents - 102 took place in 2007, and the least - 21 in 2006. The data has a growing trend.
When looking into fire subcategories, the most reports belonged to: Outside Fires (41.1%), and Structure Fires (25.6%).
Fire incident types reported to NFIRS in Zip Code 92253


 Nearest zip codes: 92210, 92201, 92236, 92203, 92211, 92260.


 Based on the data from the years 2006 - 2018 the average number of fires per year is 70. The highest number of fire incidents - 102 took place in 2007, and the least - 21 in 2006. The data has a growing trend.
 When looking into fire subcategories, the most reports belonged to: Outside Fires (41.1%), and Structure Fires (25.6%).