Estimated zip code population in 2022: 30,781 Zip code population in 2010: 31,753 Zip code population in 2000: 29,322
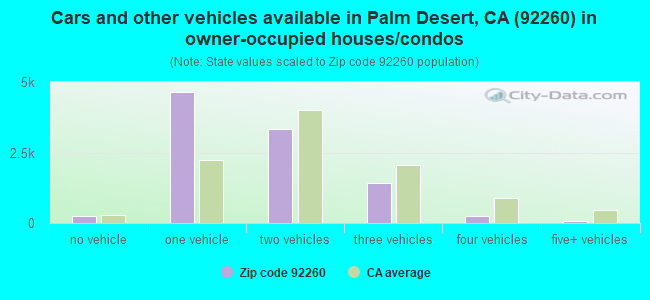
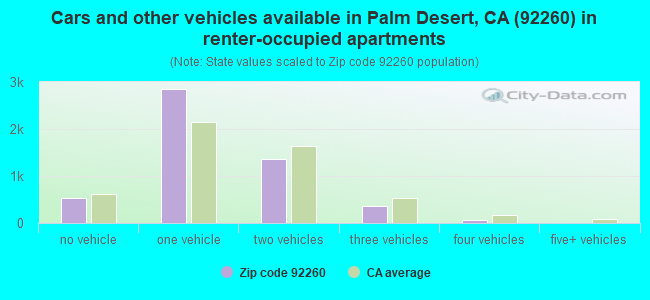
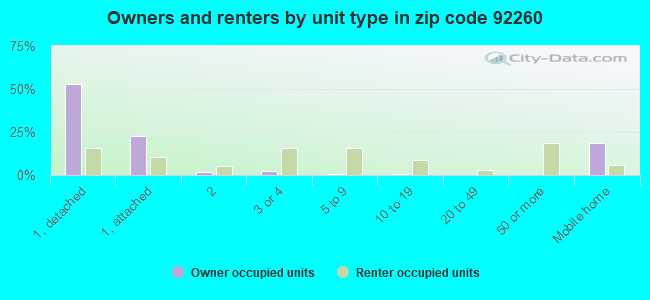
Houses and condos: 22,052 Renter-occupied apartments: 5,143
% of renters here:
34%
State:
44%
March 2022 cost of living index in zip code 92260: 82.3 (low, U.S. average is 100)
Land area: 28.4 sq. mi. Water area: 0.2 sq. mi.
Population density: 1,084 people per square mile
(low).
OSM Map
General Map
Google Map
MSN Map
OSM Map
General Map
Google Map
MSN Map
OSM Map
General Map
Google Map
MSN Map
OSM Map
General Map
Google Map
MSN Map
Please wait while loading the map...
Real estate property taxes paid for housing units in 2022:
This zip code:
0.9% ($4,071)
California:
0.7% ($4,831)
Median real estate property taxes paid for housing units with mortgages in 2022: $4,411 (0.9%) Median real estate property taxes paid for housing units with no mortgage in 2022: $3,761 (0.9%)
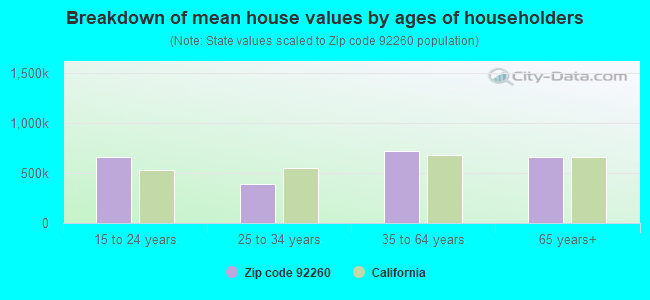
Estimated median house/condo value in 2022: $460,508
92260:
$460,508
California:
$715,900
According to our research of California and other state lists, there were 35 registered sex offenders living in 92260 zip code as of April 26, 2024. The ratio of all residents to sex offenders in zip code 92260 is 981 to 1. The ratio of registered sex offenders to all residents in this zip code is lower than the state average.
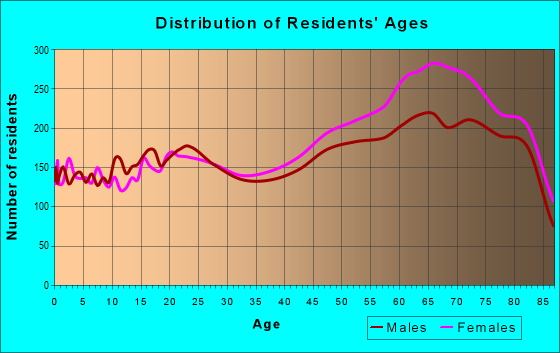
Median resident age:
This zip code:
57.9 years
California median age:
37.9 years
Average household size:
This zip code:
2.0 people
California:
2.8 people
Averages for the 2020 tax year for zip code 92260, filed in 2021:
Average Adjusted Gross Income (AGI) in 2020: $80,005 (Individual Income Tax Returns)
Here:
$80,005
State:
$95,910
Salary/wage: $57,102 (reported on 64.2% of returns)
Here:
$57,102
State:
$77,331
(% of AGI for various income ranges: 1071.8% for AGIs below $25k, 3452.9% for AGIs $25k-50k, 6113.6% for AGIs $50k-75k, 9491.3% for AGIs $75k-100k, 16645.7% for AGIs $100k-200k, 93453.3% for AGIs over 200k)
Taxable interest for individuals: $2,620 (reported on 41.6% of returns)
This zip code:
$2,620
California:
$2,294
(% of AGI for various income ranges: 43.5% for AGIs below $25k, 56.9% for AGIs $25k-50k, 165.0% for AGIs $50k-75k, 187.2% for AGIs $75k-100k, 508.1% for AGIs $100k-200k, 3429.5% for AGIs over 200k)
Ordinary dividends: $13,002 (reported on 27.4% of returns)
Here:
$13,002
State:
$10,949
(% of AGI for various income ranges: 88.5% for AGIs below $25k, 128.1% for AGIs $25k-50k, 314.4% for AGIs $50k-75k, 488.7% for AGIs $75k-100k, 1488.8% for AGIs $100k-200k, 14789.5% for AGIs over 200k)
Net capital gain/loss in AGI: +$26,198 (reported on 27.3% of returns)
Here:
+$26,198
State:
+$49,306
(% of AGI for various income ranges: 16.1% for AGIs below $25k, 67.6% for AGIs $25k-50k, 308.6% for AGIs $50k-75k, 496.3% for AGIs $75k-100k, 1935.7% for AGIs $100k-200k, 40717.6% for AGIs over 200k)
Profit/loss from business: +$15,068 (reported on 21.4% of returns)
Here:
+$15,068
State:
+$15,671
(% of AGI for various income ranges: 237.0% for AGIs below $25k, 261.8% for AGIs $25k-50k, 480.5% for AGIs $50k-75k, 817.2% for AGIs $75k-100k, 1555.9% for AGIs $100k-200k, 6777.6% for AGIs over 200k)
Taxable individual retirement arrangement distribution: $24,777 (reported on 15.8% of returns)
92260:
$24,777
California:
$23,505
(% of AGI for various income ranges: 133.1% for AGIs below $25k, 213.8% for AGIs $25k-50k, 582.1% for AGIs $50k-75k, 1196.7% for AGIs $75k-100k, 2786.1% for AGIs $100k-200k, 7619.0% for AGIs over 200k)
Self-employed (Keogh) retirement plans: $21,131 (reported on 1.1% of returns)
92260:
$21,131
California:
$30,163
(% of AGI for various income ranges: 29.5% for AGIs $50k-75k, 119.3% for AGIs $100k-200k, 1026.7% for AGIs over 200k)
Total itemized deductions: $40,434 (reported on 16.7% of returns)
Here:
$40,434
State:
$39,517
(% of AGI for various income ranges: 214.5% for AGIs below $25k, 321.8% for AGIs $25k-50k, 958.1% for AGIs $50k-75k, 1722.0% for AGIs $75k-100k, 3287.7% for AGIs $100k-200k, 20573.3% for AGIs over 200k)
Charity contributions: $10,214 (reported on 13.9% of returns)
Here:
$10,214
State:
$12,598
(% of AGI for various income ranges: 11.1% for AGIs below $25k, 31.6% for AGIs $25k-50k, 107.5% for AGIs $50k-75k, 236.0% for AGIs $75k-100k, 547.2% for AGIs $100k-200k, 6520.0% for AGIs over 200k)
Taxes paid: $7,966 (reported on 16.7% of returns)
92260:
$7,966
State:
$8,807
(% of AGI for various income ranges: 43.2% for AGIs below $25k, 67.7% for AGIs $25k-50k, 217.1% for AGIs $50k-75k, 467.5% for AGIs $75k-100k, 862.4% for AGIs $100k-200k, 2707.6% for AGIs over 200k)
Earned income credit: $1,912 (reported on 12.9% of returns)
Here:
$1,912
State:
$2,074
(% of AGI for various income ranges: 83.0% for AGIs below $25k, 62.2% for AGIs $25k-50k)
Percentage of individuals using paid preparers for their 2020 taxes: 92.3%
Here:
92%
State:
92%
(% for various income ranges: 90.0% for AGIs below $25k, 92.6% for AGIs $25k-50k, 93.8% for AGIs $50k-75k, 93.1% for AGIs $75k-100k, 94.1% for AGIs $100k-200k, 95.2% for AGIs over 200k)
Averages for the 2012 tax year for zip code 92260, filed in 2013:
Average Adjusted Gross Income (AGI) in 2012: $61,764 (Individual Income Tax Returns)
Here:
$61,764
State:
$72,726
Salary/wage: $44,620 (reported on 65.4% of returns)
Here:
$44,620
State:
$59,079
(% of AGI for various income ranges: 60.9% for AGIs below $25k, 64.3% for AGIs $25k-50k, 55.5% for AGIs $50k-75k, 47.9% for AGIs $75k-100k, 46.3% for AGIs $100k-200k, 33.0% for AGIs over 200k)
Taxable interest for individuals: $2,880 (reported on 43.3% of returns)
This zip code:
$2,880
California:
$2,146
(% of AGI for various income ranges: 2.5% for AGIs below $25k, 1.7% for AGIs $25k-50k, 2.2% for AGIs $50k-75k, 1.7% for AGIs $75k-100k, 2.0% for AGIs $100k-200k, 2.1% for AGIs over 200k)
Ordinary dividends: $10,613 (reported on 27.5% of returns)
Here:
$10,613
State:
$9,308
(% of AGI for various income ranges: 4.1% for AGIs below $25k, 2.6% for AGIs $25k-50k, 3.1% for AGIs $50k-75k, 4.0% for AGIs $75k-100k, 4.9% for AGIs $100k-200k, 6.6% for AGIs over 200k)
Net capital gain/loss in AGI: +$15,408 (reported on 26.7% of returns)
Here:
+$15,408
State:
+$30,460
(% of AGI for various income ranges: 0.2% for AGIs $25k-50k, 0.6% for AGIs $50k-75k, 1.4% for AGIs $75k-100k, 3.0% for AGIs $100k-200k, 18.6% for AGIs over 200k)
Profit/loss from business: +$15,965 (reported on 20.0% of returns)
Here:
+$15,965
State:
+$17,064
(% of AGI for various income ranges: 11.6% for AGIs below $25k, 6.2% for AGIs $25k-50k, 4.5% for AGIs $50k-75k, 4.3% for AGIs $75k-100k, 4.8% for AGIs $100k-200k, 3.8% for AGIs over 200k)
Taxable individual retirement arrangement distribution: $20,157 (reported on 18.9% of returns)
92260:
$20,157
California:
$19,557
(% of AGI for various income ranges: 5.8% for AGIs below $25k, 4.7% for AGIs $25k-50k, 6.3% for AGIs $50k-75k, 8.6% for AGIs $75k-100k, 8.1% for AGIs $100k-200k, 4.7% for AGIs over 200k)
Self-employment retirement plans: $22,300 (reported on 1.0% of returns)
92260:
$22,300
California:
$24,530
(% of AGI for various income ranges: 0.3% for AGIs $25k-50k, 0.4% for AGIs $75k-100k, 0.4% for AGIs $100k-200k, 0.6% for AGIs over 200k)
Total itemized deductions: $29,801 (26% of AGI, reported on 39.0% of returns)
Here:
$29,801
State:
$34,004
Here:
26.4% of AGI
State:
22.7% of AGI
(% of AGI for various income ranges: 20.7% for AGIs below $25k, 15.6% for AGIs $25k-50k, 17.8% for AGIs $50k-75k, 19.4% for AGIs $75k-100k, 21.5% for AGIs $100k-200k, 17.9% for AGIs over 200k)
Charity contributions: $3,913 (reported on 32.4% of returns)
Here:
$3,913
State:
$4,659
(% of AGI for various income ranges: 1.0% for AGIs below $25k, 1.2% for AGIs $25k-50k, 1.7% for AGIs $50k-75k, 1.9% for AGIs $75k-100k, 2.2% for AGIs $100k-200k, 2.7% for AGIs over 200k)
Taxes paid: $10,727 (reported on 38.9% of returns)
92260:
$10,727
State:
$14,448
(% of AGI for various income ranges: 4.1% for AGIs below $25k, 3.8% for AGIs $25k-50k, 4.8% for AGIs $50k-75k, 6.1% for AGIs $75k-100k, 8.0% for AGIs $100k-200k, 9.0% for AGIs over 200k)
Earned income credit: $2,167 (reported on 15.7% of returns)
Here:
$2,167
State:
$2,286
(% of AGI for various income ranges: 5.0% for AGIs below $25k, 0.9% for AGIs $25k-50k)
Percentage of individuals using paid preparers for their 2012 taxes: 69.9%
Here:
70%
State:
64%
(% for various income ranges: 64.9% for AGIs below $25k, 66.8% for AGIs $25k-50k, 71.6% for AGIs $50k-75k, 78.4% for AGIs $75k-100k, 80.1% for AGIs $100k-200k, 89.3% for AGIs over 200k)
Averages for the 2004 tax year for zip code 92260, filed in 2005:
Average Adjusted Gross Income (AGI) in 2004: $59,189 (Individual Income Tax Returns)
Here:
$59,189
State:
$58,600
Salary/wage: $42,772 (reported on 64.9% of returns)
Here:
$42,772
State:
$49,455
(% of AGI for various income ranges: 61.6% for AGIs $10k-25k, 62.8% for AGIs $25k-50k, 55.2% for AGIs $50k-75k, 47.7% for AGIs $75k-100k, 35.5% for AGIs over 100k)
Taxable interest for individuals: $3,904 (reported on 55.5% of returns)
This zip code:
$3,904
California:
$2,365
(% of AGI for various income ranges: 5.3% for AGIs $10k-25k, 3.6% for AGIs $25k-50k, 3.7% for AGIs $50k-75k, 3.1% for AGIs $75k-100k, 3.0% for AGIs over 100k)
Taxable dividends: $6,261 (reported on 35.7% of returns)
Here:
$6,261
State:
$4,746
(% of AGI for various income ranges: 4.5% for AGIs $10k-25k, 2.9% for AGIs $25k-50k, 3.5% for AGIs $50k-75k, 3.6% for AGIs $75k-100k, 3.5% for AGIs over 100k)
Net capital gain/loss: +$19,852 (reported on 34.4% of returns)
Here:
+$19,852
State:
+$23,418
(% of AGI for various income ranges: 0.2% for AGIs $10k-25k, 0.9% for AGIs $25k-50k, 2.0% for AGIs $50k-75k, 5.0% for AGIs $75k-100k, 18.0% for AGIs over 100k)
Profit/loss from business: +$21,269 (reported on 20.9% of returns)
Here:
+$21,269
State:
+$16,826
(% of AGI for various income ranges: 8.2% for AGIs $10k-25k, 7.7% for AGIs $25k-50k, 6.5% for AGIs $50k-75k, 7.3% for AGIs $75k-100k, 7.4% for AGIs over 100k)
Profit/loss from farming: +$5,400 (reported on 0.1% of returns)
Here:
+$5,400
State:
-$7,562
IRA payment deduction: $3,469 (reported on 3.7% of returns)
92260:
$3,469
California:
$3,192
(% of AGI for various income ranges: 0.3% for AGIs $10k-25k, 0.3% for AGIs $25k-50k, 0.3% for AGIs $50k-75k, 0.3% for AGIs $75k-100k, 0.1% for AGIs over 100k)
Self-employed pension: $17,649 (reported on 1.9% of returns)
Here:
$17,649
California:
$17,688
(% of AGI for various income ranges: 0.2% for AGIs $10k-25k, 0.3% for AGIs $25k-50k, 0.5% for AGIs $50k-75k, 0.5% for AGIs $75k-100k, 0.7% for AGIs over 100k)
Total itemized deductions: $26,407 (25% of AGI, reported on 44.8% of returns)
Here:
$26,407
State:
$28,113
Here:
24.9% of AGI
State:
25.3% of AGI
(% of AGI for various income ranges: 21.2% for AGIs $10k-25k, 20.0% for AGIs $25k-50k, 22.1% for AGIs $50k-75k, 23.4% for AGIs $75k-100k, 17.2% for AGIs over 100k)
Charity contributions deductions: $3,696 (3% of AGI, reported on 39.5% of returns)
Here:
$3,696
State:
$3,923
Here:
3.3% of AGI
State:
3.3% of AGI
(% of AGI for various income ranges: 1.6% for AGIs $10k-25k, 2.0% for AGIs $25k-50k, 2.3% for AGIs $50k-75k, 3.1% for AGIs $75k-100k, 2.5% for AGIs over 100k)
Total tax: $11,982 (reported on 75.6% of returns)
92260:
$11,982
State:
$10,761
(% of AGI for various income ranges: 4.3% for AGIs $10k-25k, 7.4% for AGIs $25k-50k, 10.0% for AGIs $50k-75k, 11.2% for AGIs $75k-100k, 19.9% for AGIs over 100k)
Earned income credit: $1,589 (reported on 11.8% of returns)
Here:
$1,589
State:
$1,763
Percentage of individuals using paid preparers for their 2004 taxes: 73.8%
Here:
74%
State:
66%
(% for various income ranges: 68.1% for AGIs below $10k, 71.0% for AGIs $10k-25k, 72.2% for AGIs $25k-50k, 75.2% for AGIs $50k-75k, 79.9% for AGIs $75k-100k, 85.8% for AGIs over 100k)
Likely homosexual households (counted as self-reported same-sex unmarried-partner households)
Lesbian couples: 0.2% of all households
Gay men: 0.9% of all households
Household received Food Stamps/SNAP in the past 12 months: 1,691 Household did not receive Food Stamps/SNAP in the past 12 months: 13,249
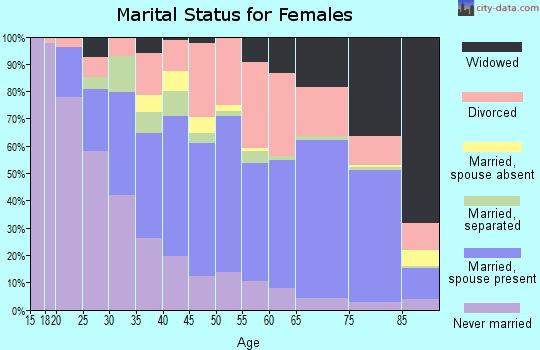
Women who had a birth in the past 12 months: 84 (50 now married, 34 unmarried) Women who did not have a birth in the past 12 months: 4,657 (1,803 now married, 2,856 unmarried)
Housing units in zip code 92260 with a mortgage: 4,777 (413 second mortgage, 12 home equity loan, 301 both second mortgage and home equity loan) Houses without a mortgage: 73
Median monthly owner costs for units with a mortgage: $2,241 Median monthly owner costs for units without a mortgage: $1,014
Residents with income below the poverty level in 2022:
This zip code:
15.2%
Whole state:
12.2%
Residents with income below 50% of the poverty level in 2022:
This zip code:
8.7%
Whole state:
6.2%
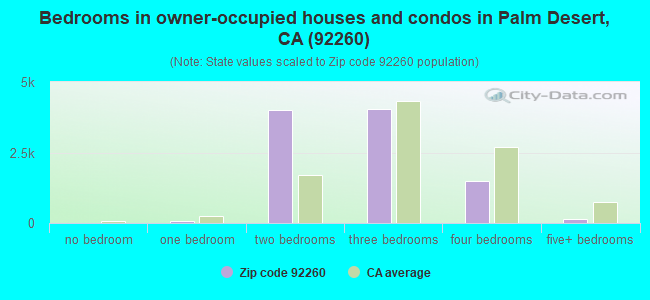
Median number of rooms in houses and condos:
Here:
5.6
State:
6.0
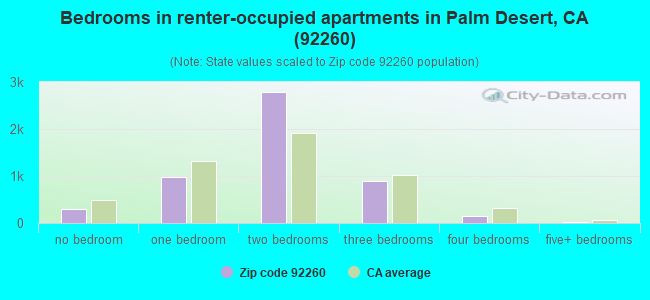
Median number of rooms in apartments:
Here:
4.0
State:
3.9
Notable locations in this zip code not listed on our city pages
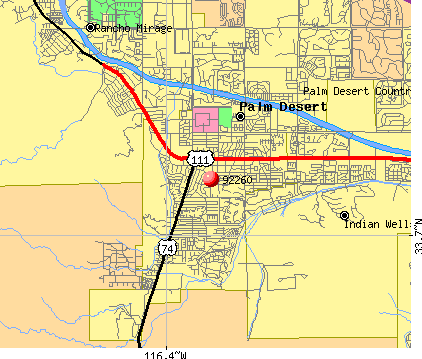
Notable locations in zip code 92260: Portola Country Club (A), Shadow Mountain Golf Course (B), Monterey Country Club (C), Marrakesh Country Club (D), Ironwood Country Club (E), Chaparral Country Club (F), Bighorn Golf Club (G), Suncrest Country Club (H), Santa Rosa Country Club (I), Palm Desert Greens Golf Course (J), Palm Desert Branch Riverside City and County Public Library (K), McCallum Theater (L), Joslyn Cove Senior Center (M), Riverside County Fire Department Station 67 Mesa View (N), Riverside County Fire Department Station 71 Palm Desert North (O), Riverside County Fire Department Station 33 Palm Desert (P). Display/hide their locations on the map
Shopping Centers: Town Center Square Shopping Center (1), Palms to Pines West Shopping Center (2), Palm Desert Shopping Center (3), Palms to Pines Shopping Center (4), El Paseo Shopping Center (5), Plaza de Monterey Shopping Center (6). Display/hide their locations on the map
Churches in zip code 92260 include: Christ of the Desert Newman Center (A), The Church of Jesus Christ of Latter Day Saints (B), Kingdom Hall of Jehovahs Witnesses (C), Hope Lutheran Church (D), Sacred Heart Catholic Church (E), Saint George Orthodox Church (F). Display/hide their locations on the map
1,930 married couples with children.
1,762 single-parent households (457 men, 1,305 women).
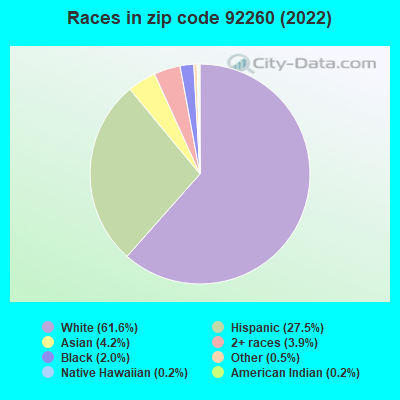
74.5% of residents of 92260 zip code speak English at home.
20.5% of residents speak Spanish at home (76% very well, 13% well, 10% not well, 2% not at all).
2.7% of residents speak other Indo-European language at home (80% very well, 8% well, 11% not well, 1% not at all).
2.7% of residents speak Asian or Pacific Island language at home (52% very well, 36% well, 8% not well, 4% not at all).
0.5% of residents speak other language at home (27% very well, 73% well).
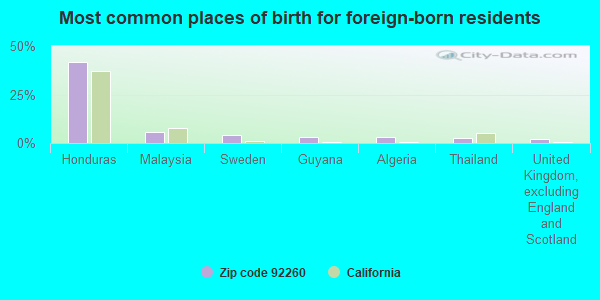
Foreign born population: 5,137 (16.7%) (65.3% of them are naturalized citizens)
Major facilities with environmental interests located in this zip code:
GLIDDEN COMPANY (41 905 BOARDWALK M 1 in PALM DESERT, CA)
STATE MASTER (California - Hazardous Waste Tracking) - HAZARDOU WASTE PROGRAM Small Quantity Generators, between 100 kg and 1000 kg of hazardous waste/month (Resource Conservation and Recovery Act (tracking hazardous waste)) - notification Alternative names: THE GLIDDEN CO. DBA ICI PAINTS
INDIAN RIDGE COUNTRY CLUB (40200 ELDORADO in PALM DESERT, CA)
STATE MASTER (California - Hazardous Waste Tracking) - HAZARDOU WASTE PROGRAM Small Quantity Generators, between 100 kg and 1000 kg of hazardous waste/month (Resource Conservation and Recovery Act (tracking hazardous waste)) - notification Organizations: SUNRISE COLONY (CONTACT/OWNER)
CHEVRON 92968 (77920 AVE OF THE STATES in PALM DESERT, CA) . Federal Facility
STATE MASTER (California - Hazardous Waste Tracking) - HAZARDOU WASTE PROGRAM Small Quantity Generators, between 100 kg and 1000 kg of hazardous waste/month (Resource Conservation and Recovery Act (tracking hazardous waste)) - notification Organizations: CHEVRON U S A PRODUCTS CO (CONTACT/OWNER)
Alternative names: CHEVRON STATION 9 2968
CHEVRON STATION NO 93047 (72 801 HIGHWAY 111 in PALM DESERT, CA)
STATE MASTER (California - Hazardous Waste Tracking) - HAZARDOU WASTE PROGRAM Small Quantity Generators, between 100 kg and 1000 kg of hazardous waste/month (Resource Conservation and Recovery Act (tracking hazardous waste)) - notification Organizations: CHEVRON PRODUCTS CO (CONTACT/OWNER)
MICHAEL LEWIS DESIGN (42480 RITTER CIR UNIT 7 in PALM DESERT, CA)
STATE MASTER (California - Hazardous Waste Tracking) - HAZARDOU WASTE PROGRAM Small Quantity Generators, between 100 kg and 1000 kg of hazardous waste/month (Resource Conservation and Recovery Act (tracking hazardous waste)) - notification
JAMES EARL CARTER ELEMENTARY (74-251 EAST HOVLEY LANE in PALM DESERT, CA)
(National Center for Education Statistics) - STATE ID-6113880 Organizations: DESERT SANDS UNIFIED (SCHOOL DISTRICT)
LINCOLN (ABRAHAM) ELEMENTARY (74-100 RUTLEDGE WAY in PALM DESERT, CA)
(National Center for Education Statistics) - STATE ID-6031926 Organizations: DESERT SANDS UNIFIED (SCHOOL DISTRICT)
A L M ANALYTICAL LABORATORY (77 725 ENFIELD LANE SUITE 110 in PALM DESERT, CA)
(Resource Conservation and Recovery Act (tracking hazardous waste)) Organizations: MARSHALL K CHEUNG (CONTACT/OWNER)
EXXONMOBIL OIL CORP. (73-001 COUNTRY CLUB DR in PALM DESERT, CA)
HAZARDOUS WASTE BIENNIAL REPORTER (Resource Conservation and Recovery Act (tracking hazardous waste)) Large Quantity Generators, more that 1000 kg of hazardous waste/month (Resource Conservation and Recovery Act (tracking hazardous waste)) Organizations: EXXONMOBIL OIL CORPORATION (CONTACT/OWNER)
JOSEPHS CLEANERS (44 419 TOWN CENTER WY STE G in PALM DESERT, CA)
EXCLUSIVE AUTO BODY (74872 VELIE WAY #7 in PALM DESERT, CA)
Small Quantity Generators, between 100 kg and 1000 kg of hazardous waste/month (Resource Conservation and Recovery Act (tracking hazardous waste)) - notification Organizations: STEVE HASTOR (CONTACT/OWNER)
MARK PALMER DESIGNS (41995 BOARDWALK STE A 1 in PALM DESERT, CA)
Small Quantity Generators, between 100 kg and 1000 kg of hazardous waste/month (Resource Conservation and Recovery Act (tracking hazardous waste)) - notification
CENTER PHOTO LAB (72840 HIGHWAY 111 SPACE D162 in PALM DESERT, CA)
Small Quantity Generators, between 100 kg and 1000 kg of hazardous waste/month (Resource Conservation and Recovery Act (tracking hazardous waste)) - notification Organizations: MARK WINSKI (CONTACT/OWNER)
Housing units lacking complete kitchen facilities: 1.2%
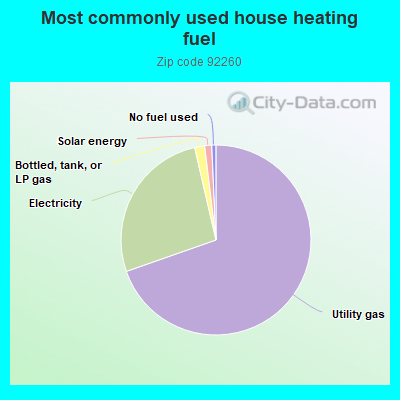
69.5%Utility gas
26.7%Electricity
1.7%Bottled, tank, or LP gas
1.2%Solar energy
0.7%No fuel used
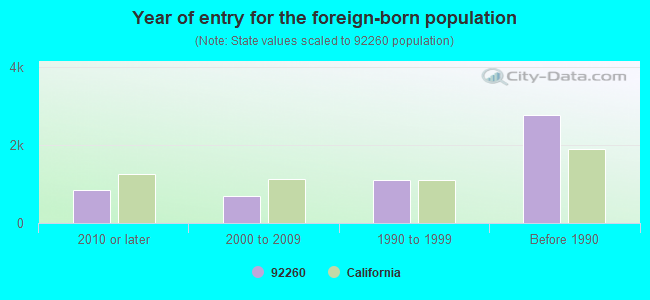
Population in 1990: 31,975.
Place of birth for U.S.-born residents:
This state: 14,813
Northeast: 2,420
Midwest: 3,650
South: 1,998
West: 2,144
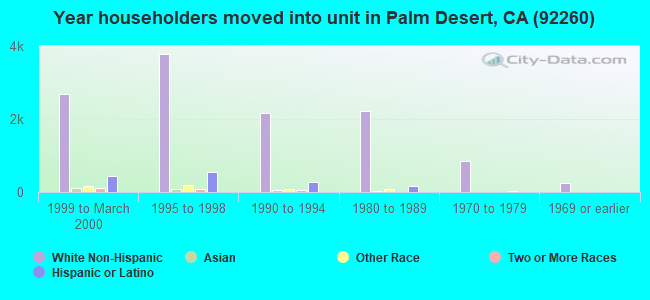
45% of the 92260 zip code residents lived in the same house 5 years ago. Out of people who lived in different houses, 52% lived in this county. Out of people who lived in different counties, 50% lived in California.
86% of the 92260 zip code residents lived in the same house 1 year ago. Out of people who lived in different houses, 47% moved from this county. Out of people who lived in different houses, 16% moved from different county within same state. Out of people who lived in different houses, 32% moved from different state. Out of people who lived in different houses, 5% moved from abroad.
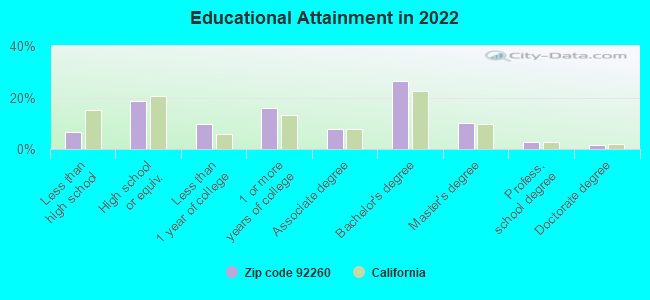
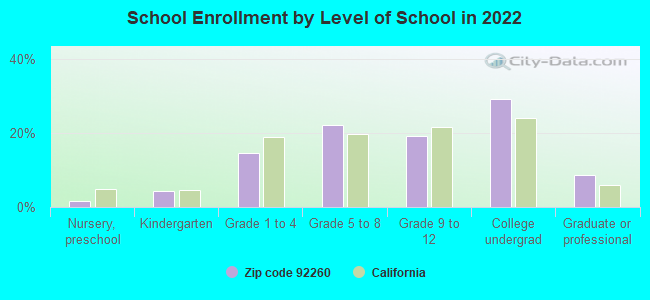
Private vs. public school enrollment:
Students in private schools in grades 1 to 8 (elementary and middle school): 267
Here:
13.4%
California:
10.5%
Students in private schools in grades 9 to 12 (high school): 92
Here:
8.9%
California:
8.5%
Students in private undergraduate colleges: 254
Here:
16.1%
California:
15.9%
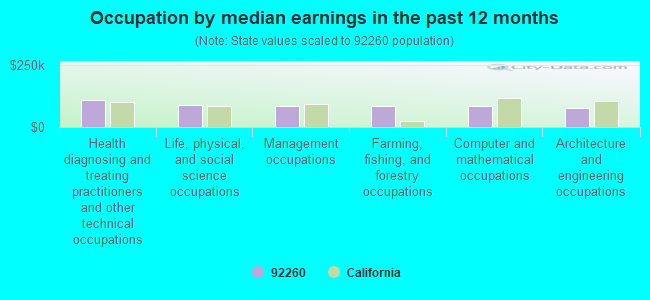
Occupation by median earnings in the past 12 months ($)
107,406Health diagnosing and treating practitioners and other technical occupations
89,602Life, physical, and social science occupations
84,862Management occupations
84,716Farming, fishing, and forestry occupations
84,657Computer and mathematical occupations
77,627Architecture and engineering occupations
Companies with federal contracts located in this zip code (PALM DESERT, CA):
DESIGN CONSTRUCTION (74-821 MERLE DR; small business) : $7,378,196 in 110 contractsfrom 2000 to 2006
Contracts for Maintenance, Repair or Alteration of Real Property -- Other Residential Buildings, Maintenance, Repair or Alteration of Real Property -- Other Non-Building Facilities, Construction of Structures and Facilities -- Other Non-Building Facilities, Maintenance, Repair or Alteration of Real Property -- Other Administrative Facilities and Service Buildings, and moreby Navy Signed by year:2000: $130,315; 2001: $582,997; 2002: $1,414,026; 2003: $1,628,708; 2004: $1,720,165; 2005: $1,787,349; 2006: $114,636.
Biggest contracts:
$976,042 with Navy for Maintenance, Repair or Alteration of Real Property -- Other Residential Buildings. Signed on 2003-09-15. Completion date: 2004-03-28.
$655,372 with Navy for Maintenance, Repair or Alteration of Real Property -- Other Non-Building Facilities. Signed on 2004-04-22. Completion date: 2004-09-10.
$451,870 with Navy for Construction of Structures and Facilities -- Other Non-Building Facilities. Signed on 2002-08-16. Completion date: 2003-01-28.
$341,874 with Navy for Maintenance, Repair or Alteration of Real Property -- Other Administrative Facilities and Service Buildings. Signed on 2002-09-10. Completion date: 2003-01-28.
IGNACIO SANCHEZ INC, GENERAL C (74821 MERLE DRIVE; small business) : $2,635,590 in 20 contractsfrom 1999 to 2001
Contracts for Construction of Structures and Facilities -- Troop Housing Facilities, Construction of Structures and Facilities -- Hospitals and Infirmaries, Maintenance, Repair or Alteration of Real Property -- Other Administrative Facilities and Service Buildings, Maintenance, Repair or Alteration of Real Property -- Hospitals and Infirmaries, and moreby Navy Signed by year:2000: $2,606,395; 2001: -$23,748; 2002: $0; 2003: $0; 2004: $0; 2005: $0; 2006: $0.
Biggest contracts:
$1,415,673 with Navy for Construction of Structures and Facilities -- Troop Housing Facilities. Signed on 2000-04-06. Completion date: 2001-01-07.
$471,933 with Navy for Construction of Structures and Facilities -- Hospitals and Infirmaries. Signed on 2000-04-14. Completion date: 2001-01-11.
$453,838, same as above.Signed on 2000-02-29. Completion date: 2000-07-14.
$82,183 with Navy for Maintenance, Repair or Alteration of Real Property -- Other Administrative Facilities and Service Buildings. Signed on 2000-01-20. Completion date: 2000-03-01.
RICHARD D LYNCH A MEDICAL CORP (72955 GRAPEVINE ST; small business) : $1,531,431 in 7 contractsfrom 2002 to 2005
Contracts for Radiology Services by Army Signed by year:2000: $0; 2001: $0; 2002: $413,478; 2003: $396,273; 2004: $360,840; 2005: $360,840; 2006: $0.
Biggest contracts:
$364,560 with Army for Radiology Services. Taking place in TX. Signed on 2002-10-15. Completion date: 2002-09-30.
$360,840, same as above.Signed on 2005-10-07. Completion date: 2002-09-30.
$360,840, same as above.Signed on 2004-10-05. Completion date: 2002-09-30.
$360,840, same as above.Signed on 2003-10-14. Completion date: 2002-09-30.
SKYCOMM (74924 COUNTRY CLUB STE#150; small business) : $221,438 in 9 contractsfrom 2000 to 2003
Contracts for Radio and Television Communication Equipment, Except Airborne, Electrical and Electronic Properties Measuring and Testing Instruments, Miscellaneous Communication Equipment, Coils and Transformers, and moreby Army, Air Force, Navy Signed by year:2000: $60,084; 2001: $99,028; 2002: $47,001; 2003: $15,325; 2004: $0; 2005: $0; 2006: $0.
Biggest contracts:
$39,978 with Army for Radio and Television Communication Equipment, Except Airborne. Taking place in AZ. Signed on 2001-04-25. Completion date: 2001-05-24.
$34,486 with Air Force for Radio and Television Communication Equipment, Except Airborne. Taking place in AK. Signed on 2002-06-04. Completion date: 2002-07-03.
$33,900 with Air Force for Electrical and Electronic Properties Measuring and Testing Instruments. Signed on 2001-07-18. Completion date: 2001-08-17.
$32,163 with Army for Miscellaneous Communication Equipment. Taking place in NE. Signed on 2000-05-03. Completion date: 2000-04-24.
VERMILLION'S ENVIRONMENTAL PRO (73-710 FRED WARING DR #220; small business) : $99,450 in 4 contractsfrom 2000 to 2005
$42,000 with Navy for Chemicals. Signed on 2005-03-22. Completion date: 2005-03-24.
$37,194 with Navy for Other Environmental Services, Studies, and Analytical Support. Signed on 2000-04-10. Completion date: 2000-06-16.
$15,192 with Navy for Preservative and Sealing Compounds. Signed on 2004-11-29. Completion date: 2004-11-30.
$5,064, same as above.Signed on 2004-11-03. Completion date: 2004-10-15.
WASTE MANAGEMENT OF CALIFORNIA (41575 ECLECTIC ST)
$96,408 with Navy for Trash/Garbage Collection Services - Including Portable Sanitation Services. Signed on 2005-04-28. Completion date: 2012-04-30.
MARRIOTT INTERNATIONAL (74855 COUNTRY CLUB DR)
$34,721 with Army for Lodging - Hotel/Motel. Signed on 2005-01-31. Completion date: 2005-02-02.
Top industries in this zip code by the number of employees in 2005:
Administrative and Support and Waste Management and Remediation Services: Security Guards and Patrol Services (250-499: 1, 100-249: 1, 50-99: 1, 5-9: 1, 1-4: 1)
Construction: All Other Specialty Trade Contractors (250-499: 1, 20-49: 1, 10-19: 1, 5-9: 2, 1-4: 8)
Management of Companies and Enterprises: Corporate, Subsidiary, and Regional Managing Offices (250-499: 1, 20-49: 1, 10-19: 1, 5-9: 1, 1-4: 2)
People in group quarters in 2010:
165 people in nursing facilities/skilled-nursing facilities
43 people in other noninstitutional facilities
33 people in group homes intended for adults
11 people in residential treatment centers for adults
People in group quarters in 2000:
233 people in nursing homes
64 people in other group homes
11 people in other noninstitutional group quarters
Fatal accident statistics in 2014:
Fatal accident count: 3
Vehicles involved in fatal accidents: 5
Fatal accidents caused by drunken drivers: 1
Fatalities: 3
Persons involved in fatal accidents: 6
Pedestrians involved in fatal accidents: 1
Fatal accident statistics in 2013:
Fatal accident count: 2
Vehicles involved in fatal accidents: 3
Fatal accidents caused by drunken drivers: 1
Fatalities: 2
Persons involved in fatal accidents: 5
Pedestrians involved in fatal accidents: 0
Home Mortgage Disclosure Act Aggregated Statistics For Year 2009 (Based on 6 full and 10 partial tracts)
A) FHA, FSA/RHS & VA Home Purchase Loans
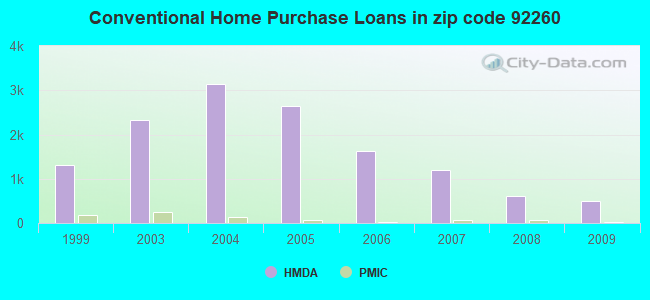
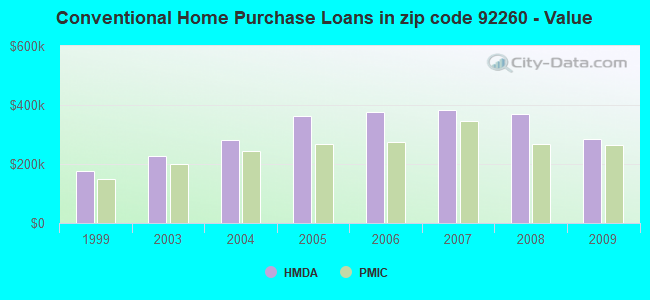
B) Conventional Home Purchase Loans
C) Refinancings
D) Home Improvement Loans
E) Loans on Dwellings For 5+ Families
F) Non-occupant Loans on < 5 Family Dwellings (A B C & D)
G) Loans On Manufactured Home Dwelling (A B C & D)
Number
Average Value
Number
Average Value
Number
Average Value
Number
Average Value
Number
Average Value
Number
Average Value
Number
Average Value
LOANS ORIGINATED
118
$219,143
503
$283,477
1,293
$304,395
44
$179,372
0
$0
711
$314,920
8
$160,022
APPLICATIONS APPROVED, NOT ACCEPTED
15
$253,783
68
$246,229
162
$281,923
2
$93,185
0
$0
100
$263,153
6
$157,013
APPLICATIONS DENIED
26
$209,523
113
$314,764
657
$352,474
22
$235,860
2
$1,257,645
272
$360,762
5
$135,996
APPLICATIONS WITHDRAWN
18
$208,654
92
$297,020
328
$332,390
14
$243,100
2
$793,750
145
$356,766
2
$109,780
FILES CLOSED FOR INCOMPLETENESS
4
$143,232
16
$293,747
70
$276,178
2
$199,625
0
$0
19
$314,054
1
$164,970
Aggregated Statistics For Year 2008 (Based on 6 full and 10 partial tracts)
A) FHA, FSA/RHS & VA Home Purchase Loans
B) Conventional Home Purchase Loans
C) Refinancings
D) Home Improvement Loans
E) Loans on Dwellings For 5+ Families
F) Non-occupant Loans on < 5 Family Dwellings (A B C & D)
G) Loans On Manufactured Home Dwelling (A B C & D)
Number
Average Value
Number
Average Value
Number
Average Value
Number
Average Value
Number
Average Value
Number
Average Value
Number
Average Value
LOANS ORIGINATED
69
$214,815
601
$370,516
762
$349,000
64
$209,768
9
$1,400,136
613
$404,540
24
$109,484
APPLICATIONS APPROVED, NOT ACCEPTED
4
$137,058
102
$374,017
175
$327,348
11
$147,258
0
$0
105
$337,199
7
$87,574
APPLICATIONS DENIED
22
$201,136
157
$395,478
466
$358,793
79
$365,384
0
$0
189
$425,632
21
$84,717
APPLICATIONS WITHDRAWN
7
$269,304
106
$465,387
247
$376,691
23
$378,318
0
$0
97
$446,729
2
$103,635
FILES CLOSED FOR INCOMPLETENESS
2
$226,600
33
$295,104
47
$309,774
9
$954,973
0
$0
31
$379,424
0
$0
Aggregated Statistics For Year 2007 (Based on 6 full and 10 partial tracts)
A) FHA, FSA/RHS & VA Home Purchase Loans
B) Conventional Home Purchase Loans
C) Refinancings
D) Home Improvement Loans
E) Loans on Dwellings For 5+ Families
F) Non-occupant Loans on < 5 Family Dwellings (A B C & D)
G) Loans On Manufactured Home Dwelling (A B C & D)
Number
Average Value
Number
Average Value
Number
Average Value
Number
Average Value
Number
Average Value
Number
Average Value
Number
Average Value
LOANS ORIGINATED
63
$160,169
1,207
$382,068
1,664
$374,960
170
$268,570
11
$1,313,599
986
$424,146
48
$129,137
APPLICATIONS APPROVED, NOT ACCEPTED
4
$142,750
206
$351,853
414
$326,310
37
$170,725
0
$0
162
$333,364
17
$77,649
APPLICATIONS DENIED
26
$151,614
378
$357,935
808
$400,674
125
$273,254
0
$0
262
$420,314
29
$119,210
APPLICATIONS WITHDRAWN
2
$169,205
147
$426,111
379
$394,639
54
$208,015
2
$271,920
123
$508,693
2
$110,695
FILES CLOSED FOR INCOMPLETENESS
0
$0
23
$441,678
125
$330,920
5
$140,584
0
$0
30
$237,519
0
$0
Aggregated Statistics For Year 2006 (Based on 6 full and 10 partial tracts)
A) FHA, FSA/RHS & VA Home Purchase Loans
B) Conventional Home Purchase Loans
C) Refinancings
D) Home Improvement Loans
E) Loans on Dwellings For 5+ Families
F) Non-occupant Loans on < 5 Family Dwellings (A B C & D)
G) Loans On Manufactured Home Dwelling (A B C & D)
Number
Average Value
Number
Average Value
Number
Average Value
Number
Average Value
Number
Average Value
Number
Average Value
Number
Average Value
LOANS ORIGINATED
8
$207,668
1,631
$374,599
2,100
$339,002
271
$249,748
10
$3,066,930
1,294
$384,721
35
$156,801
APPLICATIONS APPROVED, NOT ACCEPTED
0
$0
250
$375,234
373
$356,294
37
$317,363
0
$0
172
$381,893
7
$62,867
APPLICATIONS DENIED
2
$181,320
388
$374,123
813
$374,872
116
$264,293
2
$1,223,640
266
$372,994
23
$94,969
APPLICATIONS WITHDRAWN
0
$0
243
$346,690
590
$363,715
50
$323,997
4
$179,635
157
$354,113
12
$149,790
FILES CLOSED FOR INCOMPLETENESS
0
$0
49
$404,938
183
$302,874
11
$240,218
0
$0
35
$222,726
1
$195,030
Aggregated Statistics For Year 2005 (Based on 6 full and 10 partial tracts)
A) FHA, FSA/RHS & VA Home Purchase Loans
B) Conventional Home Purchase Loans
C) Refinancings
D) Home Improvement Loans
E) Loans on Dwellings For 5+ Families
F) Non-occupant Loans on < 5 Family Dwellings (A B C & D)
G) Loans On Manufactured Home Dwelling (A B C & D)
Number
Average Value
Number
Average Value
Number
Average Value
Number
Average Value
Number
Average Value
Number
Average Value
Number
Average Value
LOANS ORIGINATED
0
$0
2,645
$361,237
2,715
$313,364
387
$220,458
24
$1,211,842
1,844
$346,041
60
$159,933
APPLICATIONS APPROVED, NOT ACCEPTED
5
$195,784
307
$350,707
350
$303,751
63
$157,178
2
$3,472,465
193
$331,911
30
$112,714
APPLICATIONS DENIED
2
$133,025
519
$317,396
836
$321,809
130
$191,471
0
$0
305
$309,561
27
$105,727
APPLICATIONS WITHDRAWN
0
$0
324
$322,228
624
$334,462
97
$184,608
0
$0
198
$418,998
21
$100,975
FILES CLOSED FOR INCOMPLETENESS
0
$0
98
$377,716
242
$286,597
15
$171,490
0
$0
51
$292,070
4
$129,525
Aggregated Statistics For Year 2004 (Based on 6 full and 10 partial tracts)
A) FHA, FSA/RHS & VA Home Purchase Loans
B) Conventional Home Purchase Loans
C) Refinancings
D) Home Improvement Loans
E) Loans on Dwellings For 5+ Families
F) Non-occupant Loans on < 5 Family Dwellings (A B C & D)
G) Loans On Manufactured Home Dwelling (A B C & D)
Number
Average Value
Number
Average Value
Number
Average Value
Number
Average Value
Number
Average Value
Number
Average Value
Number
Average Value
LOANS ORIGINATED
4
$179,608
3,139
$281,098
2,897
$264,643
204
$181,860
21
$884,234
2,181
$273,904
91
$119,538
APPLICATIONS APPROVED, NOT ACCEPTED
2
$137,430
302
$275,544
477
$233,925
30
$163,905
0
$0
185
$271,342
27
$108,188
APPLICATIONS DENIED
6
$186,002
508
$270,610
885
$258,307
136
$121,716
2
$374,345
293
$262,090
38
$89,125
APPLICATIONS WITHDRAWN
4
$215,640
346
$307,941
663
$243,446
55
$153,708
2
$475,300
187
$249,975
6
$130,180
FILES CLOSED FOR INCOMPLETENESS
2
$135,880
65
$245,671
217
$223,355
9
$39,603
0
$0
33
$243,241
3
$102,800
Aggregated Statistics For Year 2003 (Based on 6 full and 10 partial tracts)
A) FHA, FSA/RHS & VA Home Purchase Loans
B) Conventional Home Purchase Loans
C) Refinancings
D) Home Improvement Loans
E) Loans on Dwellings For 5+ Families
F) Non-occupant Loans on < 5 Family Dwellings (A B C & D)
Number
Average Value
Number
Average Value
Number
Average Value
Number
Average Value
Number
Average Value
Number
Average Value
LOANS ORIGINATED
32
$157,959
2,332
$227,975
5,282
$221,384
67
$68,073
24
$926,230
2,284
$232,006
APPLICATIONS APPROVED, NOT ACCEPTED
6
$110,308
275
$204,032
669
$222,952
24
$43,622
2
$1,540,880
244
$219,668
APPLICATIONS DENIED
3
$159,170
345
$181,669
1,112
$216,600
66
$42,697
2
$289,935
297
$220,798
APPLICATIONS WITHDRAWN
4
$173,345
230
$218,671
794
$199,036
28
$187,950
2
$203,245
191
$241,319
FILES CLOSED FOR INCOMPLETENESS
0
$0
76
$222,375
196
$211,708
10
$53,430
0
$0
59
$198,042
Aggregated Statistics For Year 1999 (Based on 3 partial tracts)
A) FHA, FSA/RHS & VA Home Purchase Loans
B) Conventional Home Purchase Loans
C) Refinancings
D) Home Improvement Loans
E) Loans on Dwellings For 5+ Families
F) Non-occupant Loans on < 5 Family Dwellings (A B C & D)
2006 - 2018 National Fire Incident Reporting System (NFIRS) incidents
Based on the data from the years 2006 - 2018 the average number of fires per year is 68. The highest number of fire incidents - 114 took place in 2007, and the least - 14 in 2006. The data has a growing trend.
When looking into fire subcategories, the most reports belonged to: Outside Fires (35.7%), and Structure Fires (26.9%).
Fire incident types reported to NFIRS in Zip Code 92260


+$5,400
-$7,562
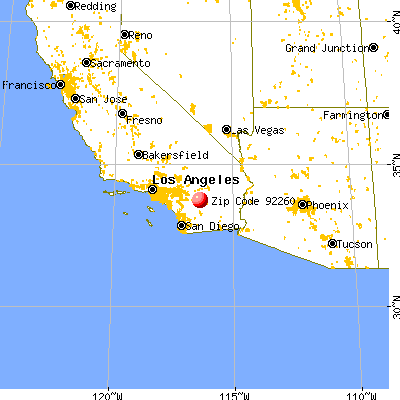
 Nearest zip codes: 92210, 92270, 92211, 92264, 92276, 92234.


 Based on the data from the years 2006 - 2018 the average number of fires per year is 68. The highest number of fire incidents - 114 took place in 2007, and the least - 14 in 2006. The data has a growing trend.
 When looking into fire subcategories, the most reports belonged to: Outside Fires (35.7%), and Structure Fires (26.9%).