Estimated zip code population in 2022: 17,113 Zip code population in 2010: 17,220 Zip code population in 2000: 12,452
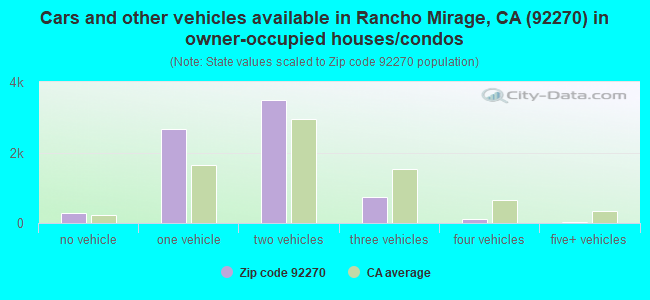
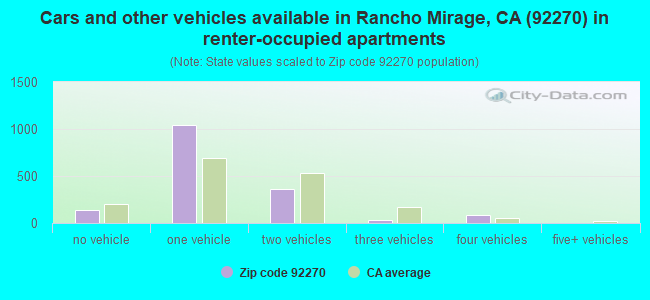
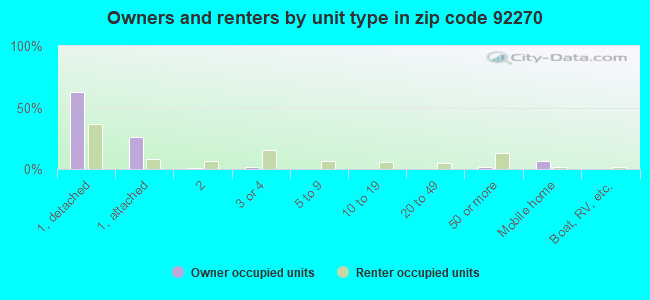
Houses and condos: 15,266 Renter-occupied apartments: 1,656
% of renters here:
19%
State:
44%
March 2022 cost of living index in zip code 92270: 82.8 (low, U.S. average is 100)
Land area: 26.7 sq. mi. Water area: 0.4 sq. mi.
Population density: 642 people per square mile
(low).
OSM Map
General Map
Google Map
MSN Map
OSM Map
General Map
Google Map
MSN Map
OSM Map
General Map
Google Map
MSN Map
OSM Map
General Map
Google Map
MSN Map
Please wait while loading the map...
Real estate property taxes paid for housing units in 2022:
This zip code:
0.9% ($6,930)
California:
0.7% ($4,831)
Median real estate property taxes paid for housing units with mortgages in 2022: $7,324 (0.9%) Median real estate property taxes paid for housing units with no mortgage in 2022: $6,642 (1.0%)
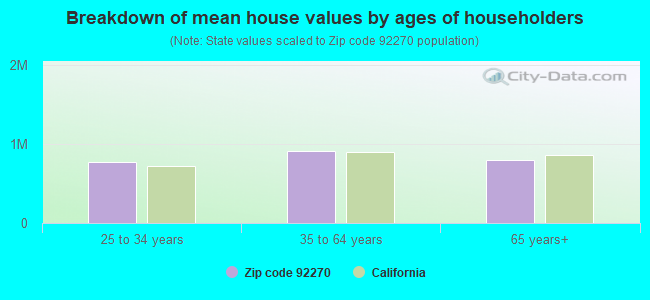
Estimated median house/condo value in 2022: $749,344
92270:
$749,344
California:
$715,900
According to our research of California and other state lists, there were 10 registered sex offenders living in 92270 zip code as of April 27, 2024. The ratio of all residents to sex offenders in zip code 92270 is 1,813 to 1. The ratio of registered sex offenders to all residents in this zip code is lower than the state average.
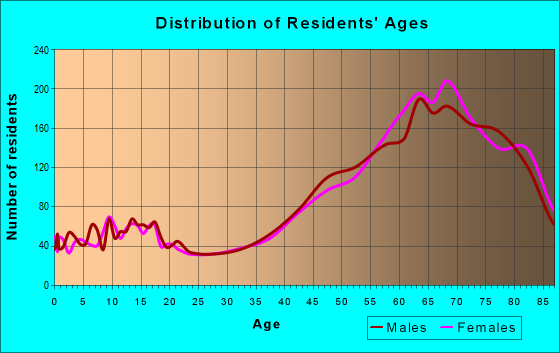
Median resident age:
This zip code:
65.9 years
California median age:
37.9 years
Average household size:
This zip code:
1.9 people
California:
2.8 people
Averages for the 2020 tax year for zip code 92270, filed in 2021:
Average Adjusted Gross Income (AGI) in 2020: $142,713 (Individual Income Tax Returns)
Here:
$142,713
State:
$95,910
Salary/wage: $105,609 (reported on 52.1% of returns)
Here:
$105,609
State:
$77,331
(% of AGI for various income ranges: 899.9% for AGIs below $25k, 3127.9% for AGIs $25k-50k, 5376.5% for AGIs $50k-75k, 7411.3% for AGIs $75k-100k, 14502.4% for AGIs $100k-200k, 100943.4% for AGIs over 200k)
Taxable interest for individuals: $4,639 (reported on 61.1% of returns)
This zip code:
$4,639
California:
$2,294
(% of AGI for various income ranges: 91.4% for AGIs below $25k, 217.0% for AGIs $25k-50k, 326.5% for AGIs $50k-75k, 554.2% for AGIs $75k-100k, 814.4% for AGIs $100k-200k, 4557.5% for AGIs over 200k)
Ordinary dividends: $17,050 (reported on 46.7% of returns)
Here:
$17,050
State:
$10,949
(% of AGI for various income ranges: 191.2% for AGIs below $25k, 420.1% for AGIs $25k-50k, 927.8% for AGIs $50k-75k, 1554.2% for AGIs $75k-100k, 2438.5% for AGIs $100k-200k, 13156.9% for AGIs over 200k)
Net capital gain/loss in AGI: +$39,671 (reported on 46.8% of returns)
Here:
+$39,671
State:
+$49,306
(% of AGI for various income ranges: 60.8% for AGIs below $25k, 163.7% for AGIs $25k-50k, 557.2% for AGIs $50k-75k, 1097.4% for AGIs $75k-100k, 3074.2% for AGIs $100k-200k, 43669.4% for AGIs over 200k)
Profit/loss from business: +$26,544 (reported on 23.1% of returns)
Here:
+$26,544
State:
+$15,671
(% of AGI for various income ranges: 262.9% for AGIs below $25k, 496.0% for AGIs $25k-50k, 858.0% for AGIs $50k-75k, 1286.1% for AGIs $75k-100k, 2253.5% for AGIs $100k-200k, 8306.2% for AGIs over 200k)
Taxable individual retirement arrangement distribution: $36,168 (reported on 23.4% of returns)
92270:
$36,168
California:
$23,505
(% of AGI for various income ranges: 210.9% for AGIs below $25k, 447.7% for AGIs $25k-50k, 1012.8% for AGIs $50k-75k, 1915.5% for AGIs $75k-100k, 4449.7% for AGIs $100k-200k, 10069.1% for AGIs over 200k)
Self-employed (Keogh) retirement plans: $30,057 (reported on 2.3% of returns)
92270:
$30,057
California:
$30,163
(% of AGI for various income ranges: 93.3% for AGIs $50k-75k, 194.7% for AGIs $100k-200k, 1461.2% for AGIs over 200k)
Total itemized deductions: $41,845 (reported on 32.8% of returns)
Here:
$41,845
State:
$39,517
(% of AGI for various income ranges: 550.2% for AGIs below $25k, 920.3% for AGIs $25k-50k, 1761.5% for AGIs $50k-75k, 3207.7% for AGIs $75k-100k, 5152.6% for AGIs $100k-200k, 18866.2% for AGIs over 200k)
Charity contributions: $10,403 (reported on 28.2% of returns)
Here:
$10,403
State:
$12,598
(% of AGI for various income ranges: 30.1% for AGIs below $25k, 83.2% for AGIs $25k-50k, 216.3% for AGIs $50k-75k, 396.5% for AGIs $75k-100k, 789.7% for AGIs $100k-200k, 5708.4% for AGIs over 200k)
Taxes paid: $8,869 (reported on 32.7% of returns)
92270:
$8,869
State:
$8,807
(% of AGI for various income ranges: 112.5% for AGIs below $25k, 213.0% for AGIs $25k-50k, 451.3% for AGIs $50k-75k, 859.0% for AGIs $75k-100k, 1324.2% for AGIs $100k-200k, 3208.8% for AGIs over 200k)
Earned income credit: $1,568 (reported on 6.2% of returns)
Here:
$1,568
State:
$2,074
(% of AGI for various income ranges: 57.6% for AGIs below $25k, 35.1% for AGIs $25k-50k)
Percentage of individuals using paid preparers for their 2020 taxes: 92.9%
Here:
93%
State:
92%
(% for various income ranges: 90.7% for AGIs below $25k, 93.7% for AGIs $25k-50k, 92.4% for AGIs $50k-75k, 92.7% for AGIs $75k-100k, 93.6% for AGIs $100k-200k, 94.5% for AGIs over 200k)
Averages for the 2012 tax year for zip code 92270, filed in 2013:
Average Adjusted Gross Income (AGI) in 2012: $122,440 (Individual Income Tax Returns)
Here:
$122,440
State:
$72,726
Salary/wage: $77,742 (reported on 53.3% of returns)
Here:
$77,742
State:
$59,079
(% of AGI for various income ranges: 47.3% for AGIs below $25k, 48.6% for AGIs $25k-50k, 41.0% for AGIs $50k-75k, 40.9% for AGIs $75k-100k, 34.0% for AGIs $100k-200k, 30.2% for AGIs over 200k)
Taxable interest for individuals: $5,934 (reported on 60.3% of returns)
This zip code:
$5,934
California:
$2,146
(% of AGI for various income ranges: 4.6% for AGIs below $25k, 3.8% for AGIs $25k-50k, 3.3% for AGIs $50k-75k, 2.6% for AGIs $75k-100k, 2.7% for AGIs $100k-200k, 2.8% for AGIs over 200k)
Ordinary dividends: $17,743 (reported on 44.9% of returns)
Here:
$17,743
State:
$9,308
(% of AGI for various income ranges: 9.0% for AGIs below $25k, 6.2% for AGIs $25k-50k, 6.2% for AGIs $50k-75k, 5.6% for AGIs $75k-100k, 7.2% for AGIs $100k-200k, 6.3% for AGIs over 200k)
Net capital gain/loss in AGI: +$35,669 (reported on 45.8% of returns)
Here:
+$35,669
State:
+$30,460
(% of AGI for various income ranges: 1.7% for AGIs $25k-50k, 1.3% for AGIs $50k-75k, 1.5% for AGIs $75k-100k, 4.6% for AGIs $100k-200k, 20.6% for AGIs over 200k)
Profit/loss from business: +$26,127 (reported on 23.8% of returns)
Here:
+$26,127
State:
+$17,064
(% of AGI for various income ranges: 15.7% for AGIs below $25k, 7.4% for AGIs $25k-50k, 6.4% for AGIs $50k-75k, 3.8% for AGIs $75k-100k, 6.3% for AGIs $100k-200k, 4.0% for AGIs over 200k)
Taxable individual retirement arrangement distribution: $31,827 (reported on 26.6% of returns)
92270:
$31,827
California:
$19,557
(% of AGI for various income ranges: 9.6% for AGIs below $25k, 7.7% for AGIs $25k-50k, 7.8% for AGIs $50k-75k, 9.6% for AGIs $75k-100k, 11.4% for AGIs $100k-200k, 4.8% for AGIs over 200k)
Self-employment retirement plans: $29,725 (reported on 2.1% of returns)
92270:
$29,725
California:
$24,530
(% of AGI for various income ranges: 0.7% for AGIs $50k-75k, 0.5% for AGIs $100k-200k, 0.6% for AGIs over 200k)
Total itemized deductions: $53,140 (29% of AGI, reported on 60.7% of returns)
Here:
$53,140
State:
$34,004
Here:
29.3% of AGI
State:
22.7% of AGI
(% of AGI for various income ranges: 46.2% for AGIs below $25k, 28.3% for AGIs $25k-50k, 28.0% for AGIs $50k-75k, 26.6% for AGIs $75k-100k, 25.4% for AGIs $100k-200k, 25.3% for AGIs over 200k)
Charity contributions: $6,073 (reported on 52.1% of returns)
Here:
$6,073
State:
$4,659
(% of AGI for various income ranges: 2.1% for AGIs below $25k, 2.3% for AGIs $25k-50k, 2.7% for AGIs $50k-75k, 2.5% for AGIs $75k-100k, 3.0% for AGIs $100k-200k, 2.5% for AGIs over 200k)
Taxes paid: $17,536 (reported on 60.5% of returns)
92270:
$17,536
State:
$14,448
(% of AGI for various income ranges: 10.5% for AGIs below $25k, 7.3% for AGIs $25k-50k, 8.4% for AGIs $50k-75k, 8.4% for AGIs $75k-100k, 9.0% for AGIs $100k-200k, 8.6% for AGIs over 200k)
Earned income credit: $1,784 (reported on 7.3% of returns)
Here:
$1,784
State:
$2,286
(% of AGI for various income ranges: 2.8% for AGIs below $25k, 0.4% for AGIs $25k-50k)
Percentage of individuals using paid preparers for their 2012 taxes: 75.0%
Here:
75%
State:
64%
(% for various income ranges: 66.7% for AGIs below $25k, 68.9% for AGIs $25k-50k, 76.5% for AGIs $50k-75k, 76.1% for AGIs $75k-100k, 82.9% for AGIs $100k-200k, 89.9% for AGIs over 200k)
Averages for the 2004 tax year for zip code 92270, filed in 2005:
Average Adjusted Gross Income (AGI) in 2004: $117,565 (Individual Income Tax Returns)
Here:
$117,565
State:
$58,600
Salary/wage: $87,913 (reported on 53.7% of returns)
Here:
$87,913
State:
$49,455
(% of AGI for various income ranges: 52.6% for AGIs $10k-25k, 49.1% for AGIs $25k-50k, 43.2% for AGIs $50k-75k, 38.2% for AGIs $75k-100k, 36.8% for AGIs over 100k)
Taxable interest for individuals: $9,260 (reported on 69.7% of returns)
This zip code:
$9,260
California:
$2,365
(% of AGI for various income ranges: 7.9% for AGIs $10k-25k, 5.8% for AGIs $25k-50k, 6.4% for AGIs $50k-75k, 5.6% for AGIs $75k-100k, 4.7% for AGIs over 100k)
Taxable dividends: $12,697 (reported on 50.5% of returns)
Here:
$12,697
State:
$4,746
(% of AGI for various income ranges: 7.7% for AGIs $10k-25k, 5.2% for AGIs $25k-50k, 6.2% for AGIs $50k-75k, 6.2% for AGIs $75k-100k, 4.9% for AGIs over 100k)
Net capital gain/loss: +$41,542 (reported on 51.1% of returns)
Here:
+$41,542
State:
+$23,418
(% of AGI for various income ranges: 0.6% for AGIs $10k-25k, 2.7% for AGIs $25k-50k, 4.1% for AGIs $50k-75k, 4.5% for AGIs $75k-100k, 20.5% for AGIs over 100k)
Profit/loss from business: +$30,319 (reported on 24.9% of returns)
Here:
+$30,319
State:
+$16,826
(% of AGI for various income ranges: 10.7% for AGIs $10k-25k, 9.6% for AGIs $25k-50k, 5.8% for AGIs $50k-75k, 7.7% for AGIs $75k-100k, 5.8% for AGIs over 100k)
IRA payment deduction: $3,607 (reported on 3.9% of returns)
92270:
$3,607
California:
$3,192
(% of AGI for various income ranges: 0.4% for AGIs $10k-25k, 0.3% for AGIs $25k-50k, 0.3% for AGIs $50k-75k, 0.2% for AGIs $75k-100k, 0.1% for AGIs over 100k)
Self-employed pension: $23,732 (reported on 3.1% of returns)
Here:
$23,732
California:
$17,688
(% of AGI for various income ranges: 0.3% for AGIs $10k-25k, 0.3% for AGIs $25k-50k, 0.4% for AGIs $50k-75k, 0.4% for AGIs $75k-100k, 0.7% for AGIs over 100k)
Total itemized deductions: $45,201 (25% of AGI, reported on 61.7% of returns)
Here:
$45,201
State:
$28,113
Here:
24.8% of AGI
State:
25.3% of AGI
(% of AGI for various income ranges: 37.9% for AGIs $10k-25k, 31.7% for AGIs $25k-50k, 30.4% for AGIs $50k-75k, 30.1% for AGIs $75k-100k, 20.2% for AGIs over 100k)
Charity contributions deductions: $7,619 (4% of AGI, reported on 55.3% of returns)
Here:
$7,619
State:
$3,923
Here:
3.9% of AGI
State:
3.3% of AGI
(% of AGI for various income ranges: 2.9% for AGIs $10k-25k, 3.0% for AGIs $25k-50k, 3.4% for AGIs $50k-75k, 4.0% for AGIs $75k-100k, 3.5% for AGIs over 100k)
Total tax: $28,263 (reported on 79.0% of returns)
92270:
$28,263
State:
$10,761
(% of AGI for various income ranges: 4.8% for AGIs $10k-25k, 7.7% for AGIs $25k-50k, 9.4% for AGIs $50k-75k, 11.0% for AGIs $75k-100k, 20.7% for AGIs over 100k)
Earned income credit: $1,346 (reported on 6.7% of returns)
Here:
$1,346
State:
$1,763
Percentage of individuals using paid preparers for their 2004 taxes: 80.3%
Here:
80%
State:
66%
(% for various income ranges: 75.7% for AGIs below $10k, 75.7% for AGIs $10k-25k, 74.9% for AGIs $25k-50k, 82.3% for AGIs $50k-75k, 81.2% for AGIs $75k-100k, 89.0% for AGIs over 100k)
Likely homosexual households (counted as self-reported same-sex unmarried-partner households)
Lesbian couples: 0.3% of all households
Gay men: 2.5% of all households
Household received Food Stamps/SNAP in the past 12 months: 432 Household did not receive Food Stamps/SNAP in the past 12 months: 8,307
Women who had a birth in the past 12 months: 17 (17 now married, 0 unmarried) Women who did not have a birth in the past 12 months: 1,463 (685 now married, 773 unmarried)
Housing units in zip code 92270 with a mortgage: 3,651 (374 second mortgage, 23 home equity loan, 249 both second mortgage and home equity loan) Houses without a mortgage: 34
Median monthly owner costs for units with a mortgage: $2,915 Median monthly owner costs for units without a mortgage: $1,242
Residents with income below the poverty level in 2022:
This zip code:
11.2%
Whole state:
12.2%
Residents with income below 50% of the poverty level in 2022:
This zip code:
4.1%
Whole state:
6.2%
Median number of rooms in houses and condos:
Here:
6.0
State:
6.0
Median number of rooms in apartments:
Here:
4.2
State:
3.9
Notable locations in this zip code not listed on our city pages
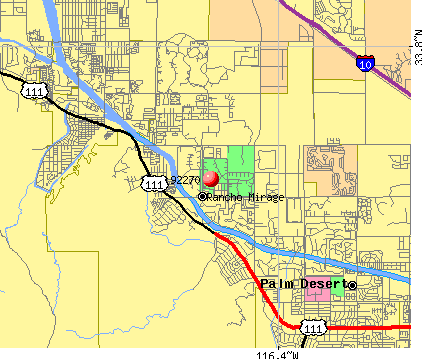
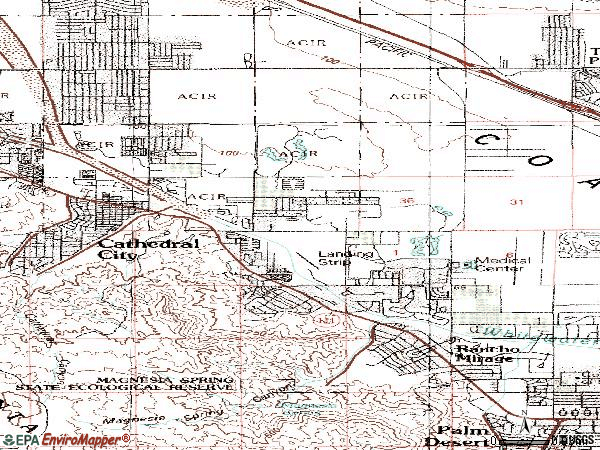
Notable locations in zip code 92270: Snyder Date Gardens (A), Rancho Las Arenas (B), Rancho las Palmas Country Club (C), The Springs Country Club (D), Sunrise Country Club (E), Rancho Mirage Country Club (F), Morningside Country Club (G), Desert Island Country Club (H), Anneberg Golf Course (I), Pete Dye Resort Golf Course (J), Mission Hills North Golf Course (K), Mission Hills Country Club (L), Dinah Shore Golf Course (M), Thunderbird Country Club (N), Tamarisk Country Club (O), Rancho Mirage Public Library (P), Rancho Mirage Chamber of Commerce (Q), Childrens Museum (R), Rancho Mirage City Hall (S), Del E Webb Memorial Medical Information Center (T). Display/hide their locations on the map
Shopping Centers: Rancho Mirage Plaza Shopping Center (1), Rancho las Palmas Shopping Center (2), Monterey Shore Shopping Center (3). Display/hide their locations on the map
Parks in zip code 92270 include: Wolfson Park (1), Bloch Cancer Survivors Park (2), Magnesia Canyon Ecological Reserve (3), Whitewater Park (4). Display/hide their locations on the map
901 married couples with children.
361 single-parent households (73 men, 288 women).
85.8% of residents of 92270 zip code speak English at home.
7.5% of residents speak Spanish at home (76% very well, 10% well, 10% not well, 4% not at all).
4.7% of residents speak other Indo-European language at home (81% very well, 16% well, 4% not well).
3.1% of residents speak Asian or Pacific Island language at home (71% very well, 20% well, 7% not well, 2% not at all).
0.5% of residents speak other language at home (71% very well, 29% well).
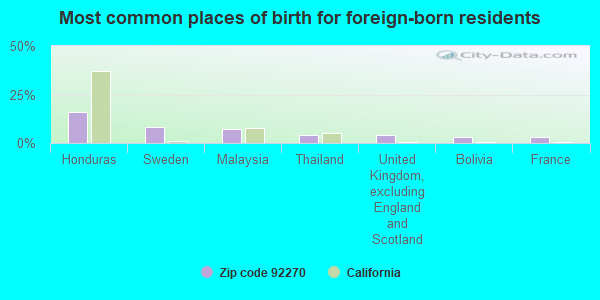
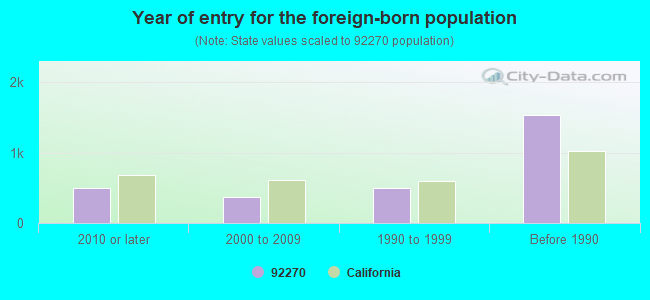
Foreign born population: 2,695 (15.8%) (57.3% of them are naturalized citizens)
Facilities with environmental interests located in this zip code:
EISENHOWER MEDICAL CENTER (39000 BOB HOPE DR in RANCHO MIRAGE, CA)
STATE MASTER (California - Hazardous Waste Tracking) - HAZARDOU WASTE PROGRAM COMPLIANCE ACTIVITY (Tracking inspections of insecticide, fungicide, and rodenticide, and toxic substances) CRITERIA AND HAZARDOUS AIR POLLUTANT INVENTORY (Inventory of air pollution sources) Small Quantity Generators, between 100 kg and 1000 kg of hazardous waste/month (Resource Conservation and Recovery Act (tracking hazardous waste)) - notification Organizations: GEO ELMORE (CONTACT/OWNER)
CHEVRON STATION 207510 (36101 BOB HOPE DR AND CORNER in RANCHO MIRAGE, CA)
STATE MASTER (California - Hazardous Waste Tracking) - HAZARDOU WASTE PROGRAM Small Quantity Generators, between 100 kg and 1000 kg of hazardous waste/month (Resource Conservation and Recovery Act (tracking hazardous waste)) - notification Organizations: CHEVRON PRODUCTS CO (CONTACT/OWNER)
AMERICAN INDUSTRIAL MFG (28780 SINGLE OAK DR in RANCHO MIRAGE, CA)
Small Quantity Generators, between 100 kg and 1000 kg of hazardous waste/month (Resource Conservation and Recovery Act (tracking hazardous waste)) - notification Business NAICS classification: OTHER MOTOR VEHICLE ELECTRICAL AND ELECTRONIC EQUIPMENT MANUFACTURING.; ALL OTHER MOTOR VEHICLE PARTS MANUFACTURING. Organizations: NIPPONDENSO OF CA (CONTACT/OWNER)
HOME DEPOT USA INC HD 0667 (34249 MONTEREY AVE in RANCHO MIRAGE, CA)
Small Quantity Generators, between 100 kg and 1000 kg of hazardous waste/month (Resource Conservation and Recovery Act (tracking hazardous waste))
HOME DEPOT USA INC HD FL0033 (71905 HWY 111 in RANCHO MIRAGE, CA)
Small Quantity Generators, between 100 kg and 1000 kg of hazardous waste/month (Resource Conservation and Recovery Act (tracking hazardous waste))
MISSION HILLS CLEANERS (36101 BOB HOPE STE D5 in RANCHO MIRAGE, CA)
CRITERIA AND HAZARDOUS AIR POLLUTANT INVENTORY (Inventory of air pollution sources) Small Quantity Generators, between 100 kg and 1000 kg of hazardous waste/month (Resource Conservation and Recovery Act (tracking hazardous waste)) - notification Business SIC classification: DRYCLEANING PLANTS, EXCEPT RUG CLEANING Organizations: FRANK KOTSIRIS (CONTACT/OWNER)
Alternative names: MISSION HILLS CLEANERS, FRANK
MARYWOOD COUNTRY DAY SCHOOL (72-850 CLANCY LN in RANCHO MIRAGE, CA)
COMPLIANCE ACTIVITY (Tracking inspections of insecticide, fungicide, and rodenticide, and toxic substances)
Housing units lacking complete plumbing facilities: 0.2% Housing units lacking complete kitchen facilities: 1.9%
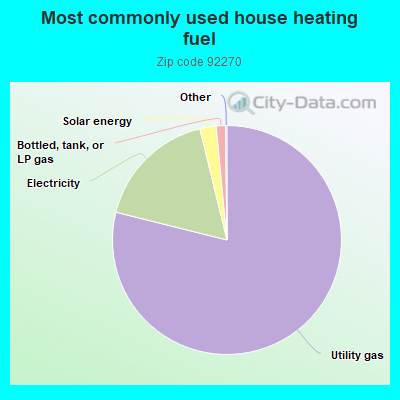
78.9%Utility gas
17.3%Electricity
2.3%Solar energy
1.3%Bottled, tank, or LP gas
Population in 1990: 9,737. Population change in the 1990s: +2,715 (+27.9%).
Place of birth for U.S.-born residents:
This state: 6,015
Northeast: 2,021
Midwest: 3,449
South: 1,274
West: 1,150
50% of the 92270 zip code residents lived in the same house 5 years ago. Out of people who lived in different houses, 46% lived in this county. Out of people who lived in different counties, 50% lived in California.
87% of the 92270 zip code residents lived in the same house 1 year ago. Out of people who lived in different houses, 38% moved from this county. Out of people who lived in different houses, 35% moved from different county within same state. Out of people who lived in different houses, 23% moved from different state. Out of people who lived in different houses, 5% moved from abroad.
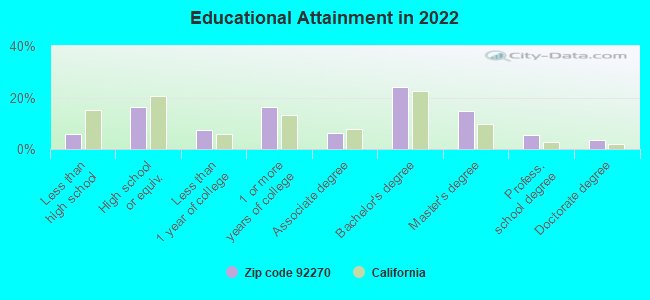
Private vs. public school enrollment:
Students in private schools in grades 1 to 8 (elementary and middle school): 282
Here:
44.5%
California:
10.5%
Students in private schools in grades 9 to 12 (high school): 23
Here:
5.2%
California:
8.5%
Students in private undergraduate colleges: 72
Here:
19.1%
California:
15.9%
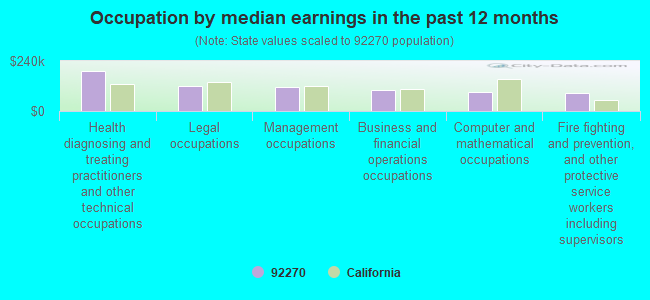
Occupation by median earnings in the past 12 months ($)
192,282Health diagnosing and treating practitioners and other technical occupations
118,738Legal occupations
114,279Management occupations
100,667Business and financial operations occupations
91,141Computer and mathematical occupations
84,065Fire fighting and prevention, and other protective service workers including supervisors
Companies with federal contracts located in this zip code:
SOUTHERN CALIFORNIA ENGINEERIN (70707 FRANK SINATRA DR UNI in RANCHO MIRAGE, CA; small business) : $5,289,635 in 57 contractsfrom 1999 to 2006
Contracts for Maintenance, Repair or Alteration of Real Property -- Other Non-Building Facilities, Maintenance, Repair or Alteration of Real Property -- EPG Facilities - Hydro, Installation of Equipment -- Plumbing, Heating, and Waste Disposal Equipment, Construction of Structures and Facilities -- Dams, and moreby U.S. Coast Guard, Bureau of Reclamation, United States Coast Guard (disused code: now 7008), Navy, and others Signed by year:2000: $1,241,970; 2001: $728,401; 2002: $598,325; 2003: $1,785,507; 2004: $858,786; 2005: $6,756; 2006: $12,232.
Biggest contracts:
$851,200 with U.S. Coast Guard for Maintenance, Repair or Alteration of Real Property -- Other Non-Building Facilities. Taking place in TX. Signed on 2003-09-15. Completion date: 2004-05-15.
$627,422 with Bureau of Reclamation for Maintenance, Repair or Alteration of Real Property -- EPG Facilities - Hydro. Taking place in AZ. Signed on 2003-10-02. Completion date: 2004-07-01.
$597,000 with Bureau of Reclamation for Maintenance, Repair or Alteration of Real Property -- EPG Facilities - Hydro. Taking place in NV. Signed on 2000-11-15. Completion date: 2001-09-15.
$540,000, same as above.Signed on 2000-10-15. Completion date: 2001-06-15.
D-ESPRIT (ONE EVENING STAR DRIVE in RANCHO MIRAGE, CA; small business) : $17,400 in 2 contractsin 2005
$9,400 with Army for Other Administrative Support Services. Taking place in MA. Signed on 2005-07-12. Completion date: 2005-08-03.
$8,000 with Army for Other Education and Training Services. Taking place in OK. Signed on 2005-07-25. Completion date: 2005-04-14.
Top industries in this zip code by the number of employees in 2005:
Health Care and Social Assistance: General Medical and Surgical Hospitals (over 1000: 1)
Health Care and Social Assistance: Offices of Physicians (except Mental Health Specialists) (100-249: 1, 50-99: 1, 20-49: 7, 10-19: 12, 5-9: 23, 1-4: 81)
Arts, Entertainment, and Recreation: Golf Courses and Country Clubs (100-249: 4, 50-99: 3, 20-49: 1)
2006 - 2018 National Fire Incident Reporting System (NFIRS) incidents
Based on the data from the years 2006 - 2018 the average number of fires per year is 28. The highest number of fire incidents - 37 took place in 2008, and the least - 8 in 2006. The data has a growing trend.
When looking into fire subcategories, the most reports belonged to: Structure Fires (30.9%), and Outside Fires (30.3%).
Fire incident types reported to NFIRS in Zip Code 92270


 Nearest zip codes: 92234, 92260, 92276, 92264, 92211, 92210.


 Based on the data from the years 2006 - 2018 the average number of fires per year is 28. The highest number of fire incidents - 37 took place in 2008, and the least - 8 in 2006. The data has a growing trend.
 When looking into fire subcategories, the most reports belonged to: Structure Fires (30.9%), and Outside Fires (30.3%).