Palm Desert, California
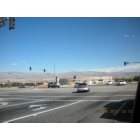
Palm Desert: Palm Desert, CA
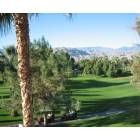
Palm Desert: Palm Desert golf course.
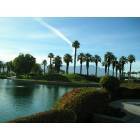
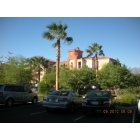
Palm Desert: the marriatt hotel on country club road(back yard)
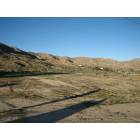
Palm Desert: A desert field with homes in the background.
Palm Desert: Marriott Shadow Ridge - Palm Desert, CA; very relaxing and has a championship golf course
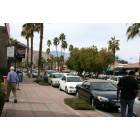
Palm Desert: El Paseo
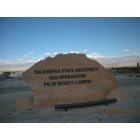
Palm Desert: Signage for California State University San Bernardino - Palm Desert Campus
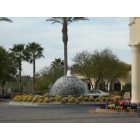
Palm Desert: Fountain at the Marriott Shadow Ridge - Palm Desert, CA; very relaxing and has a championship golf course
Palm Desert: University of California Riverside - Palm Desert Campus
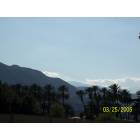
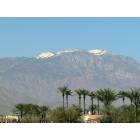
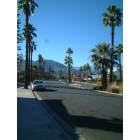
Palm Desert: A typically gorgeous view in Palm Desert, California
Palm Desert: Downtown Palm Desert, CA
- see
16
more - add
your
Submit your own pictures of this city and show them to the world
- OSM Map
- General Map
- Google Map
- MSN Map
Population change since 2000: +25.3%
 |
| Males: 24,215 | |
| Females: 27,368 |
| Median resident age: | 56.0 years |
| California median age: | 37.9 years |
Zip codes: 92260.
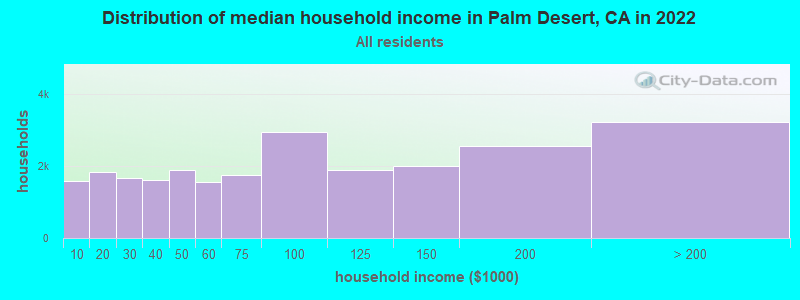
| Palm Desert: | $77,700 |
| CA: | $91,551 |
Estimated per capita income in 2022: $55,544 (it was $33,463 in 2000)
Palm Desert city income, earnings, and wages data
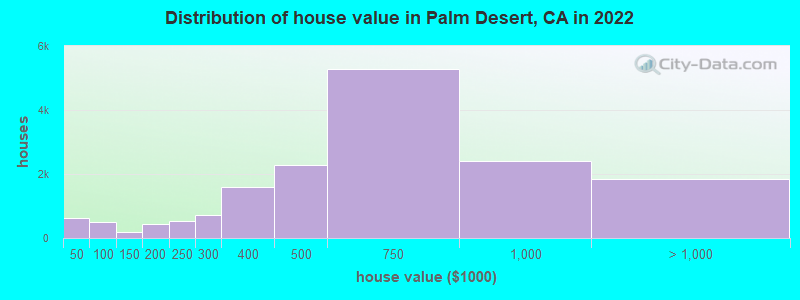
Estimated median house or condo value in 2022: $542,322 (it was $176,400 in 2000)
| Palm Desert: | $542,322 |
| CA: | $715,900 |
Mean prices in 2022: all housing units: $647,685; detached houses: $812,259; townhouses or other attached units: $556,953; in 2-unit structures: $361,013; in 3-to-4-unit structures: $461,505; in 5-or-more-unit structures: $696,161; mobile homes: $235,985
Median gross rent in 2022: $1,611.
(9.4% for White Non-Hispanic residents, 14.4% for Black residents, 19.7% for Hispanic or Latino residents, 46.3% for Native Hawaiian and other Pacific Islander residents, 15.7% for other race residents, 23.0% for two or more races residents)
Detailed information about poverty and poor residents in Palm Desert, CA


Compare current foreclosures in Palm Desert, CA:
| Photo | Address | Area | Beds / Baths | Price | Details |
|---|---|---|---|---|---|

|
#1
Leslie Ave
Palm Desert, CA 92260
|
1,592 sq. feet
|
3 baths 3 beds |
$355,000
|
show details |

|
#2
Desert Falls Dr E
Palm Desert, CA 92211
|
1,814 sq. feet
|
2 baths 2 beds |
show details | |

|
#3
Amir Dr
Palm Desert, CA 92260
|
- sq. feet
|
3 baths 3 beds |
show details | |

|
#4
Rockwell Cir
Palm Desert, CA 92211
|
1,160 sq. feet
|
2 baths 2 beds |
show details | |

|
#5
Terraza Dr
Palm Desert, CA 92260
|
2,718 sq. feet
|
4 baths 4 beds |
show details | |

|
#6
Buena Cir
Palm Desert, CA 92260
|
886 sq. feet
|
1 baths 2 beds |
show details | |

|
#7
Santa Rosa Way
Palm Desert, CA 92260
|
1,330 sq. feet
|
2 baths 3 beds |
show details | |

|
#8
Avenida Solana
Palm Desert, CA 92260
|
2,515 sq. feet
|
4 baths 3 beds |
show details | |

|
#9
California Dr
Palm Desert, CA 92211
|
1,330 sq. feet
|
2 baths 3 beds |
show details | |

|
#10
Barington Dr
Palm Desert, CA 92211
|
2,660 sq. feet
|
3 baths 4 beds |
show details |
| Photo | Address | Area | Beds / Baths | Price | Details |
|---|---|---|---|---|---|

|
#11
Vista Bonita
Palm Desert, CA 92260
|
2,531 sq. feet
|
2 baths 4 beds |
show details | |

|
#12
Pampas Ln
Palm Desert, CA 92260
|
1,344 sq. feet
|
2 baths 2 beds |
show details | |

|
#13
Florida Ave
Palm Desert, CA 92211
|
1,380 sq. feet
|
3 baths 2 beds |
show details | |

|
#14
Portola Ave
Palm Desert, CA 92260
|
1,629 sq. feet
|
2 baths 3 beds |
show details | |

|
#15
Lupine Ln Unit 15
Palm Desert, CA 92260
|
1,420 sq. feet
|
3 baths 2 beds |
show details | |

|
#16
Delaware Pl
Palm Desert, CA 92211
|
2,570 sq. feet
|
3 baths 4 beds |
show details | |

|
#17
Paseo Bravo
Palm Desert, CA 92211
|
1,465 sq. feet
|
3 baths 2 beds |
show details | |

|
#18
Warner Trl
Palm Desert, CA 92211
|
1,460 sq. feet
|
2 baths 2 beds |
show details | |

|
#19
Portola Ave Spc 135
Palm Desert, CA 92260
|
528 sq. feet
|
1 baths 1 beds |
show details | |

|
#20
Helen Moody Ln
Palm Desert, CA 92260
|
1,170 sq. feet
|
2 baths 3 beds |
show details |
| Photo | Address | Area | Beds / Baths | Price | Details |
|---|---|---|---|---|---|

|
#21
Tennessee Ave
Palm Desert, CA 92211
|
1,400 sq. feet
|
2 baths 3 beds |
show details | |

|
#22
Virginia Ave
Palm Desert, CA 92211
|
1,400 sq. feet
|
2 baths 4 beds |
show details | |

|
#23
Shadow Mountain Dr
Palm Desert, CA 92260
|
1,345 sq. feet
|
2 baths 2 beds |
show details | |

|
#24
Desert Flower Dr
Palm Desert, CA 92260
|
1,207 sq. feet
|
2 baths 2 beds |
show details | |

|
#25
Via Mattina
Palm Desert, CA 92260
|
1,961 sq. feet
|
2 baths 2 beds |
show details | |

|
#26
Palm Greens Pkwy
Palm Desert, CA 92260
|
1,344 sq. feet
|
2 baths 2 beds |
show details | |

|
#27
Cascada Ct
Palm Desert, CA 92211
|
2,688 sq. feet
|
3 baths 4 beds |
show details | |

|
#28
Crystal Falls Rd
Palm Desert, CA 92211
|
1,836 sq. feet
|
2 baths 2 beds |
show details | |

|
#29
Country Club Dr Apt 1515
Palm Desert, CA 92260
|
- sq. feet
|
- baths - beds |
show details | |

|
#30
Country Club Dr Apt 268
Palm Desert, CA 92211
|
- sq. feet
|
- baths - beds |
show details |
| Photo | Address | Area | Beds / Baths | Price | Details |
|---|---|---|---|---|---|

|
#31
Buena Cir
Palm Desert, CA 92260
|
- sq. feet
|
- baths - beds |
show details | |

|
#32
El Paseo # 12b
Palm Desert, CA 92260
|
- sq. feet
|
- baths - beds |
show details | |

|
#33
Buckboard Trl
Palm Desert, CA 92260
|
- sq. feet
|
- baths - beds |
show details | |

|
#34
Country Club Dr Apt 206
Palm Desert, CA 92260
|
- sq. feet
|
- baths - beds |
show details | |

|
#35
Calle Siem 321
Palm Desert, CA 92211
|
- sq. feet
|
- baths - beds |
show details | |

|
#36
Fred Waring Dr Ste A5
Palm Desert, CA 92260
|
- sq. feet
|
- baths - beds |
show details | |

|
#37
Catalina Way
Palm Desert, CA 92260
|
- sq. feet
|
- baths - beds |
show details | |

|
#38
Country Club Dr Apt 3014
Palm Desert, CA 92260
|
- sq. feet
|
- baths - beds |
show details | |

|
#39
California Dr
Palm Desert, CA 92211
|
- sq. feet
|
- baths - beds |
show details | |

|
#40
Vermeer Way
Palm Desert, CA 92211
|
- sq. feet
|
- baths - beds |
show details |
| Photo | Address | Area | Beds / Baths | Price | Details |
|---|---|---|---|---|---|

|
#41
Sheryl Ave Apt 9-1
Palm Desert, CA 92260
|
- sq. feet
|
- baths - beds |
show details | |

|
#42
Millennia Way
Palm Desert, CA 92211
|
- sq. feet
|
- baths - beds |
show details | |

|
Check over 1 million property listings on Foreclosure.com!
|
browse all offers | |||


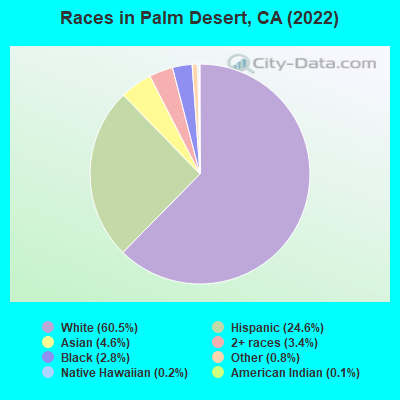
- 31,60860.5%White alone
- 12,83924.6%Hispanic
- 2,3934.6%Asian alone
- 1,7903.4%Two or more races
- 1,4692.8%Black alone
- 4340.8%Other race alone
- 820.2%Native Hawaiian and Other
Pacific Islander alone - 620.1%American Indian alone
According to our research of California and other state lists, there were 54 registered sex offenders living in Palm Desert, California as of April 27, 2024.
The ratio of all residents to sex offenders in Palm Desert is 971 to 1.
The ratio of registered sex offenders to all residents in this city is lower than the state average.
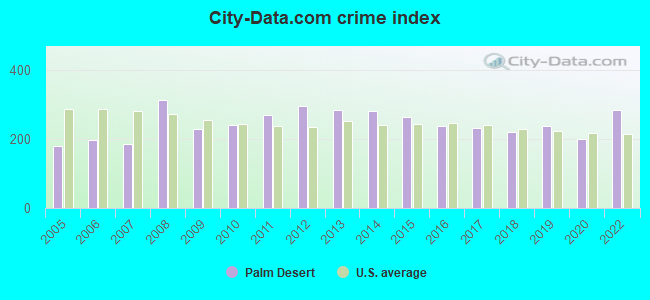
The City-Data.com crime index weighs serious crimes and violent crimes more heavily. Higher means more crime, U.S. average is 246.1. It adjusts for the number of visitors and daily workers commuting into cities.
- means the value is smaller than the state average.- means the value is about the same as the state average.
- means the value is bigger than the state average.
- means the value is much bigger than the state average.
Crime rate in Palm Desert detailed stats: murders, rapes, robberies, assaults, burglaries, thefts, arson
Full-time law enforcement employees in 2015, including police officers: 1 (1 officers - 1 male; 0 female).
| Officers per 1,000 residents here: | 0.02 |
| California average: | 1.98 |
 Recent articles from our blog. Our writers, many of them Ph.D. graduates or candidates, create easy-to-read articles on a wide variety of topics.


Latest news from Palm Desert, CA collected exclusively by city-data.com from local newspapers, TV, and radio stations
Palm Desert, CA City Guides:
Ancestries: American (8.2%), English (8.2%), Irish (5.8%), German (5.1%), Italian (4.3%), European (3.2%).
Current Local Time: PST time zone
Elevation: 243 feet
Land area: 24.4 square miles.
Population density: 2,117 people per square mile (low).
8,879 residents are foreign born (7.4% Latin America, 3.4% Asia, 2.9% Europe, 2.5% North America).
| This city: | 17.0% |
| California: | 26.5% |
Median real estate property taxes paid for housing units with mortgages in 2022: $4,690 (0.8%)
Median real estate property taxes paid for housing units with no mortgage in 2022: $4,418 (0.9%)
Nearest city with pop. 50,000+: Coachella Valley, CA  (13.3 miles , pop. 118,932).
Nearest city with pop. 200,000+: Riverside, CA (61.0 miles , pop. 255,166).
Nearest city with pop. 1,000,000+: San Diego, CA (79.4 miles , pop. 1,223,400).
Nearest cities:
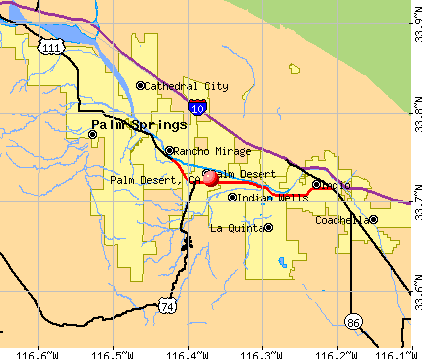
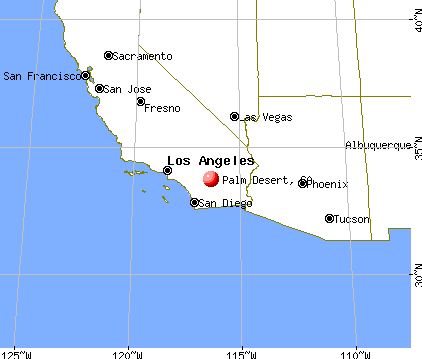
), Latitude: 33.73 N, Longitude: 116.37 W
Daytime population change due to commuting: +17,326 (+33.2%)
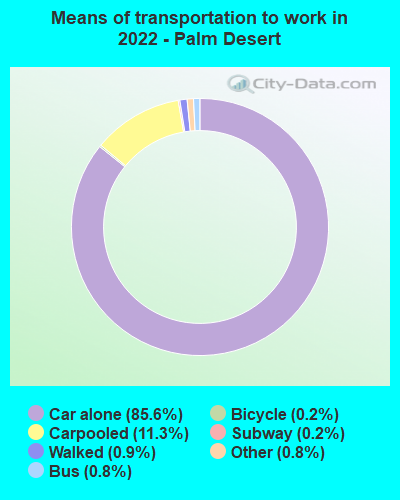
Workers who live and work in this city: 9,425 (44.1%)
Area code: 760

Palm Desert tourist attractions:
- Living Desert Zoo and Gardens - Palm Desert, California - desert zoo focusing on preservation of endangered species, research, and education
- Christopher Morgan Galleries
- Desert Springs JW Marriott Resort and Spa
- El Paseo Shopping District
- Family Golf Center of Palm Desert
- College of the Desert Street Fair
- Desert Willow Golf Resort
- Living Desert Zoo & Gardens
- McCallum Theatre for the Performing Arts
- Macy's Palm Desert
- Shadow Ridge Golf Club
- R E Welch Gallery
- Palm and Valley Golf Courses at Desert Springs
- Palm Desert Community Center & Gymnasium
- Palo Alto Baylands Nature Preserve
- Marriott's Desert Springs Villas II
- Zantman Galleries
- Warner Springs Ranch
- Palm Desert Athletic Club
- Marriott's Shadow Ridge
- Embassy Suites Hotel Palm Desert Resort
- Mojave Resort
- Residence Inn Palm Desert
Palm Desert, California accommodation & food services, waste management - Economy and Business Data
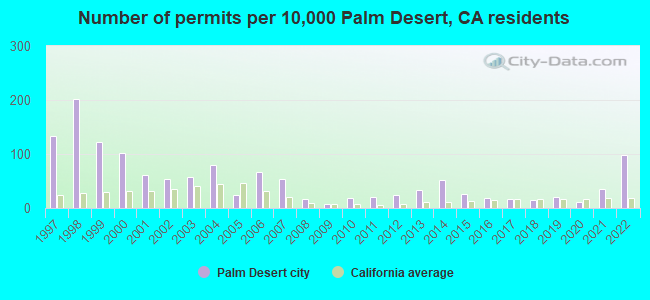
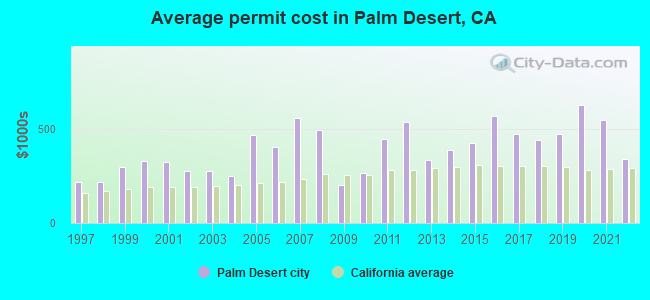
Single-family new house construction building permits:
- 2022: 403 buildings, average cost: $341,600
- 2021: 142 buildings, average cost: $547,300
- 2020: 49 buildings, average cost: $626,200
- 2019: 88 buildings, average cost: $472,600
- 2018: 61 buildings, average cost: $439,300
- 2017: 72 buildings, average cost: $473,700
- 2016: 75 buildings, average cost: $569,400
- 2015: 107 buildings, average cost: $423,900
- 2014: 208 buildings, average cost: $388,600
- 2013: 137 buildings, average cost: $331,700
- 2012: 100 buildings, average cost: $534,300
- 2011: 86 buildings, average cost: $446,600
- 2010: 74 buildings, average cost: $265,600
- 2009: 33 buildings, average cost: $203,900
- 2008: 66 buildings, average cost: $493,500
- 2007: 224 buildings, average cost: $555,900
- 2006: 271 buildings, average cost: $403,500
- 2005: 100 buildings, average cost: $469,200
- 2004: 325 buildings, average cost: $250,600
- 2003: 237 buildings, average cost: $274,500
- 2002: 221 buildings, average cost: $273,900
- 2001: 255 buildings, average cost: $322,300
- 2000: 417 buildings, average cost: $326,600
- 1999: 504 buildings, average cost: $299,200
- 1998: 833 buildings, average cost: $217,700
- 1997: 549 buildings, average cost: $215,400
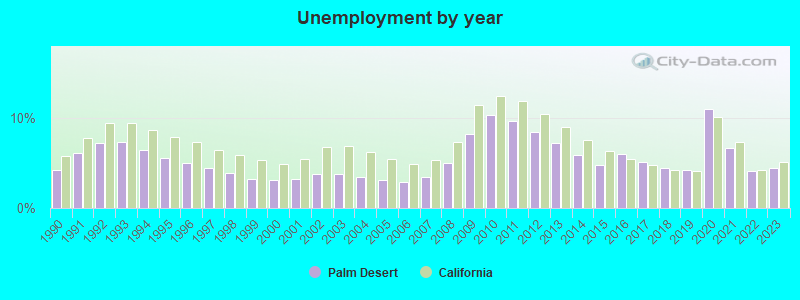
| Here: | 4.5% |
| California: | 5.1% |
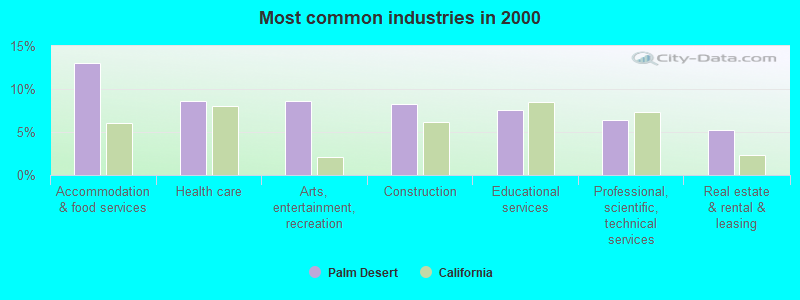
- Accommodation & food services (13.1%)
- Health care (8.6%)
- Arts, entertainment, recreation (8.6%)
- Construction (8.2%)
- Educational services (7.6%)
- Professional, scientific, technical services (6.4%)
- Real estate & rental & leasing (5.2%)
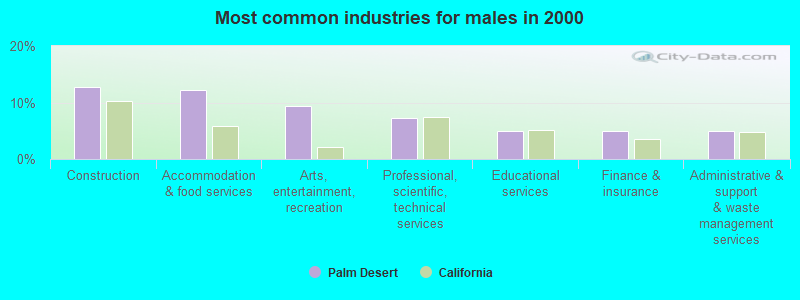
- Construction (12.8%)
- Accommodation & food services (12.2%)
- Arts, entertainment, recreation (9.3%)
- Professional, scientific, technical services (7.3%)
- Educational services (5.0%)
- Finance & insurance (4.9%)
- Administrative & support & waste management services (4.9%)
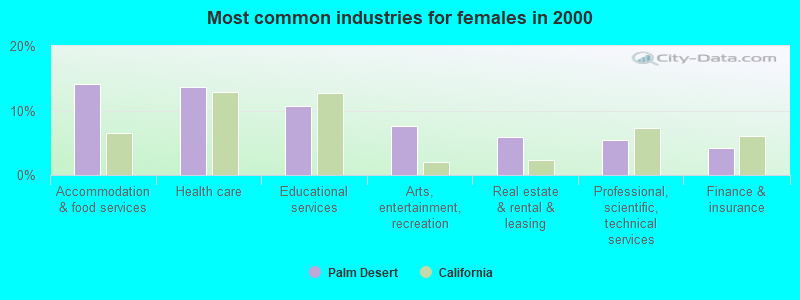
- Accommodation & food services (14.1%)
- Health care (13.7%)
- Educational services (10.7%)
- Arts, entertainment, recreation (7.7%)
- Real estate & rental & leasing (5.9%)
- Professional, scientific, technical services (5.4%)
- Finance & insurance (4.2%)
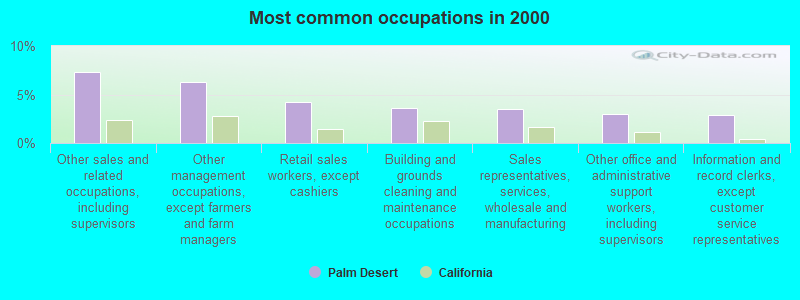
- Other sales and related occupations, including supervisors (7.3%)
- Other management occupations, except farmers and farm managers (6.3%)
- Retail sales workers, except cashiers (4.2%)
- Building and grounds cleaning and maintenance occupations (3.6%)
- Sales representatives, services, wholesale and manufacturing (3.5%)
- Other office and administrative support workers, including supervisors (3.0%)
- Information and record clerks, except customer service representatives (2.9%)
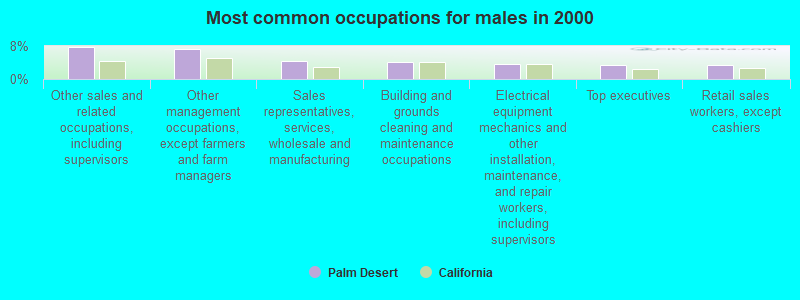
- Other sales and related occupations, including supervisors (7.8%)
- Other management occupations, except farmers and farm managers (7.3%)
- Sales representatives, services, wholesale and manufacturing (4.5%)
- Building and grounds cleaning and maintenance occupations (4.0%)
- Electrical equipment mechanics and other installation, maintenance, and repair workers, including supervisors (3.6%)
- Top executives (3.5%)
- Retail sales workers, except cashiers (3.5%)
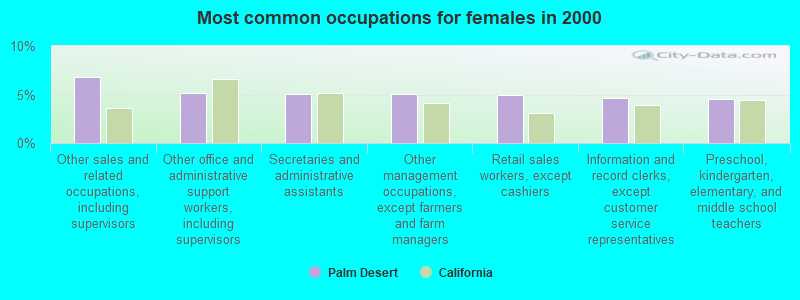
- Other sales and related occupations, including supervisors (6.8%)
- Other office and administrative support workers, including supervisors (5.1%)
- Secretaries and administrative assistants (5.1%)
- Other management occupations, except farmers and farm managers (5.1%)
- Retail sales workers, except cashiers (5.0%)
- Information and record clerks, except customer service representatives (4.6%)
- Preschool, kindergarten, elementary, and middle school teachers (4.6%)
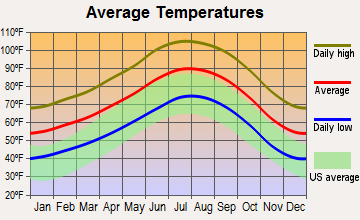
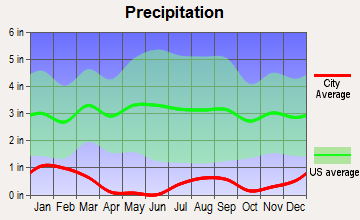
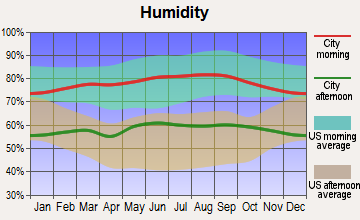
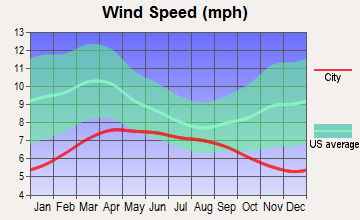
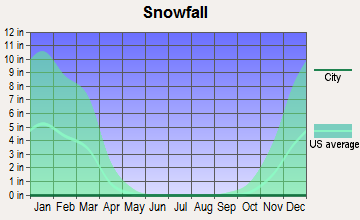
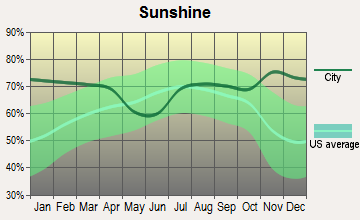
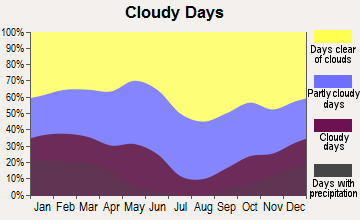
Average climate in Palm Desert, California
Based on data reported by over 4,000 weather stations
|
|

(lower is better)
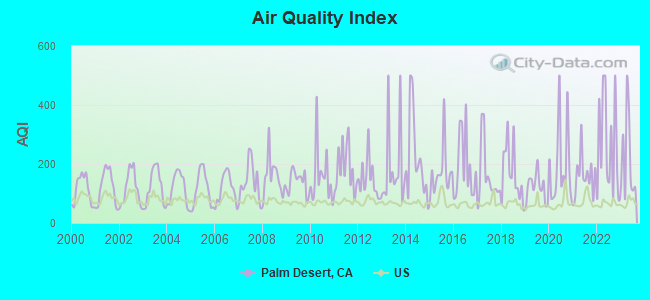
Air Quality Index (AQI) level in 2023 was 218. This is significantly worse than average.
| City: | 218 |
| U.S.: | 73 |
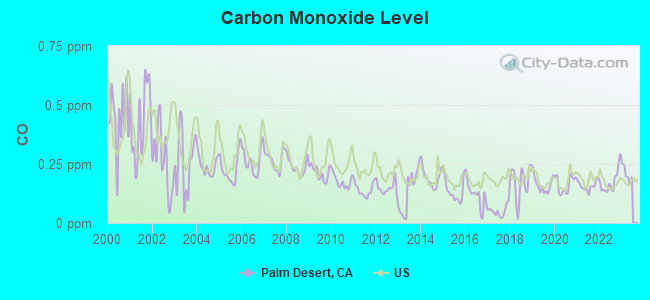
Carbon Monoxide (CO) [ppm] level in 2022 was 0.177. This is significantly better than average. Closest monitor was 8.6 miles away from the city center.
| City: | 0.177 |
| U.S.: | 0.251 |
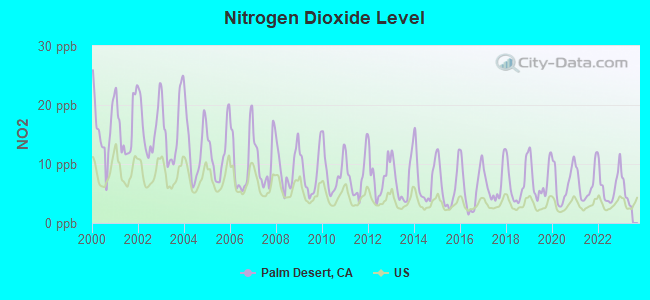
Nitrogen Dioxide (NO2) [ppb] level in 2022 was 6.26. This is worse than average. Closest monitor was 8.6 miles away from the city center.
| City: | 6.26 |
| U.S.: | 5.11 |
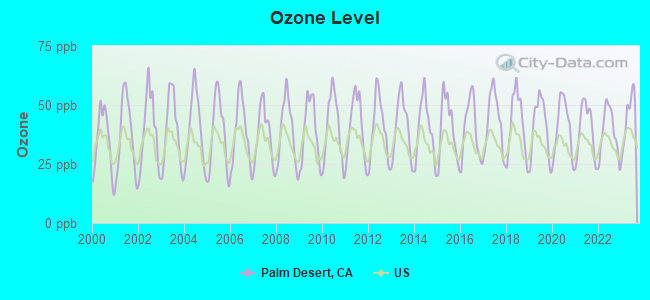
Ozone [ppb] level in 2023 was 44.9. This is worse than average. Closest monitor was 8.6 miles away from the city center.
| City: | 44.9 |
| U.S.: | 33.3 |
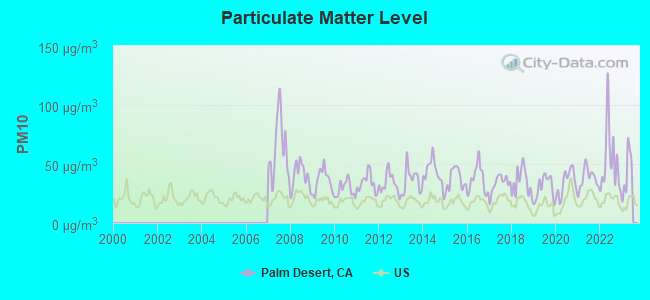
Particulate Matter (PM10) [µg/m3] level in 2022 was 52.3. This is significantly worse than average. Closest monitor was 8.9 miles away from the city center.
| City: | 52.3 |
| U.S.: | 19.2 |
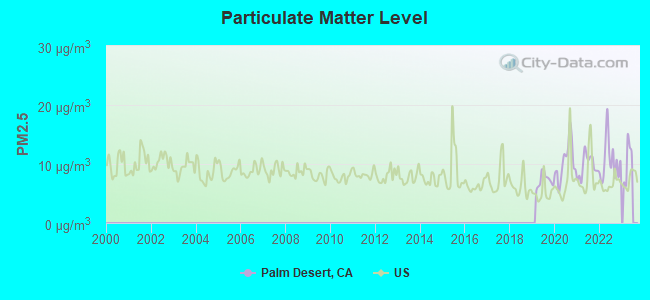
Particulate Matter (PM2.5) [µg/m3] level in 2022 was 10.5. This is worse than average. Closest monitor was 8.9 miles away from the city center.
| City: | 10.5 |
| U.S.: | 8.1 |
Earthquake activity:
Palm Desert-area historical earthquake activity is significantly above California state average. It is 6819% greater than the overall U.S. average.On 6/28/1992 at 11:57:34, a magnitude 7.6 (6.2 MB, 7.6 MS, 7.3 MW, Depth: 0.7 mi, Class: Major, Intensity: VIII - XII) earthquake occurred 33.1 miles away from Palm Desert center, causing 3 deaths (1 shaking deaths, 2 other deaths) and 400 injuries, causing $100,000,000 total damage and $40,000,000 insured losses
On 10/16/1999 at 09:46:44, a magnitude 7.4 (6.3 MB, 7.4 MS, 7.2 MW, 7.3 ML) earthquake occurred 54.7 miles away from Palm Desert center
On 7/21/1952 at 11:52:14, a magnitude 7.7 (7.7 UK) earthquake occurred 174.1 miles away from Palm Desert center, causing $50,000,000 total damage
On 5/19/1940 at 04:36:40, a magnitude 7.2 (7.2 UK) earthquake occurred 52.1 miles away from the city center, causing $33,000,000 total damage
On 12/31/1934 at 18:45:56, a magnitude 7.1 (7.1 UK) earthquake occurred 80.1 miles away from the city center
On 6/28/1992 at 15:05:30, a magnitude 6.9 (6.3 MB, 6.7 MS, 6.5 MW, 6.9 ME, Depth: 3.1 mi, Class: Strong, Intensity: VII - IX) earthquake occurred 46.7 miles away from Palm Desert center
Magnitude types: body-wave magnitude (MB), energy magnitude (ME), local magnitude (ML), surface-wave magnitude (MS), moment magnitude (MW)
Natural disasters:
The number of natural disasters in Riverside County (46) is a lot greater than the US average (15).Major Disasters (Presidential) Declared: 27
Emergencies Declared: 1
Causes of natural disasters: Fires: 22, Floods: 20, Storms: 8, Winter Storms: 8, Landslides: 6, Mudslides: 5, Heavy Rains: 2, Earthquake: 1, Flash Flood: 1, Freeze: 1, Hurricane: 1, Tornado: 1, Tropical Storm: 1, Other: 1 (Note: some incidents may be assigned to more than one category).
Main business address for: PENN OCTANE CORP (WHOLESALE-PETROLEUM & PETROLEUM PRODUCTS (NO BULK STATIONS)).
Hospitals and medical centers in Palm Desert:
- EISENHOWER MED CEN HOMECARE HOSPICE (42201 BEACON HILL #B)
- MANORCARE HEALTH SERVICES (74-350 COUNTRY CLUB DRIVE)
- MONTEREY PALMS HEALTHCARE CENTER (44-610 MONTEREY AVENUE)
- THE SPRINGS AT THE CARLOTTA (41-505 CARLOTTA DRIVE)
- RAI-CORPORATE WAY-PALM DESERT (41-501 CORPORATE WAY)
- EISENHOWER MEDICAL CENTER HOMECARE (42 201 BEACON HILL #B)
- HOME HEALTH ANGELS (74040 HIGHWAY 111, STUITE L-217)
Heliports located in Palm Desert:
Colleges/Universities in Palm Desert:
- College of the Desert (Full-time enrollment: 5,686; Location: 43-500 Monterey Ave; Public; Website: collegeofthedesert.edu)
- Milan Institute-Palm Desert (Full-time enrollment: 357; Location: 75-030 Gerald Ford Drive, Suite 203; Private, for-profit; Website: www.milaninstitute.edu)
- International School of Beauty Inc (Full-time enrollment: 281; Location: 72261 Hwy 111 Ste 121-B; Private, for-profit; Website: internationalschoolofbeauty.com)
Other colleges/universities with over 2000 students near Palm Desert:
- Mt San Jacinto Community College District (about 35 miles; San Jacinto, CA; Full-time enrollment: 8,426)
- Crafton Hills College (about 48 miles; Yucaipa, CA; FT enrollment: 3,222)
- Moreno Valley College (about 50 miles; Moreno Valley, CA; FT enrollment: 4,650)
- University of Redlands (about 52 miles; Redlands, CA; FT enrollment: 4,854)
- Loma Linda University (about 56 miles; Loma Linda, CA; FT enrollment: 2,839)
- The Art Institute of California-Argosy University Inland Empire (about 58 miles; San Bernardino, CA; FT enrollment: 2,238)
- University of California-Riverside (about 58 miles; Riverside, CA; FT enrollment: 20,647)
Public high school in Palm Desert:
- PALM DESERT HIGH (Students: 1,482, Location: 74-910 AZTEC RD., Grades: 9-12)
Private high schools in Palm Desert:
Public elementary/middle schools in Palm Desert:
- PALM DESERT CHARTER MIDDLE (Students: 1,182, Location: 74-200 RUTLEDGE WAY, Grades: 6-8, Charter school)
- ABRAHAM LINCOLN ELEMENTARY (Students: 460, Location: 74-100 RUTLEDGE WAY, Grades: KG-5)
- GEORGE WASHINGTON CHARTER (Students: 450, Location: 45-768 PORTOLA AVE., Grades: KG-5, Charter school)
- JAMES EARL CARTER ELEMENTARY (Students: 416, Location: 74-251 HOVLEY LN. E., Grades: KG-5)
- RONALD REAGAN ELEMENTARY (Students: 416, Location: 39-800 LIBERTY DR., Grades: KG-5)
Private elementary/middle schools in Palm Desert:
- SACRED HEART SCHOOL (Students: 611, Location: 43775 DEEP CANYON RD, Grades: PK-8)
- PALM DESERT LEARNING TREE (Students: 151, Location: 42675 WASHINGTON ST, Grades: PK-5)
- THE ACADEMY OF PALM DESERT COMMUNITY PRESBYTERIAN (Students: 132, Location: 47321 STATE HIGHWAY 74, Grades: PK-5)
- DESERT ADVENTIST ACADEMY (Students: 87, Location: 74200 COUNTRY CLUB DR STE 2, Grades: KG-8)
- JEWISH COMMUNITY SCHOOL OF THE DESERT (Students: 51, Location: 73251 HOVLEY LN W, Grades: PK-6)
- MONTESSORI SCHOOL OF THE DESERT (Students: 10, Location: 73925 FRED WARING DR, Grades: KG-1)
User-submitted facts and corrections:
- KRCK-FM 97.7 is no longer an "80's" themed station. They are now dubbing themselves as "The number 1 Hit Music Station." http://www.krck.com/home.htm
- KRCK-FM 97.7 is the only 80's radio outlet in the Coachella Valley.
- KRCK-FM 97.7 is the only 80\'s radio outlet in the Coachella Valley, and is totally missing from your listing.
KRCK has been broadcasting from its studios in Palm Desert for more than 2 years.
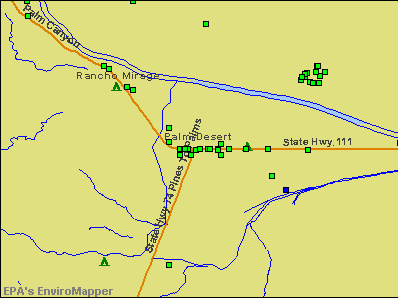
Points of interest:
Notable locations in Palm Desert: Portola Country Club (A), Palm Desert Country Club (B), Oasis Country Club (C), Woodhaven Country Club (D), Shadow Mountain Golf Course (E), Monterey Country Club (F), Marrakesh Country Club (G), Ironwood Country Club (H), Chaparral Country Club (I), Bighorn Golf Club (J), The Lakes Country Club (K), Palm Valley Country Club (L), Palm Desert Resort and Country Club (M), Indian Ridge Country Club (N), Emerald Desert Country Club (O), Desert Falls Country Club (P), Avondale Country Club (Q), Santa Rosa Country Club (R), Palm Desert Branch Riverside City and County Public Library (S), Palm Desert Country Club Branch Riverside City and County Public Library (T). Display/hide their locations on the map
Shopping Centers: Town Center Square Shopping Center (1), Palms to Pines West Shopping Center (2), Palm Desert Shopping Center (3), Palms to Pines Shopping Center (4), El Paseo Shopping Center (5), Plaza de Monterey Shopping Center (6), Monterey Marketplace Shopping Center (7). Display/hide their locations on the map
Main business address in Palm Desert: PENN OCTANE CORP (A). Display/hide its location on the map
Churches in Palm Desert include: Christ of the Desert Newman Center (A), The Church of Jesus Christ of Latter Day Saints (B), First Baptist Church (C), Kingdom Hall of Jehovahs Witnesses (D), Hope Lutheran Church (E), Sacred Heart Catholic Church (F), Saint George Orthodox Church (G). Display/hide their locations on the map
Creeks: Dead Indian Creek (A), Cat Creek (B), Ramon Creek (C). Display/hide their locations on the map
Parks in Palm Desert include: Cahuilla Park (1), Civic Center Park (2), Palm Desert Community Park (3). Display/hide their locations on the map
Tourist attractions: Arte Gallery (Art Museums; 73680 El Paseo) (1), The Living Desert Zoo & Gardens (Botanical Gardens; 47900 Portola Avenue) (2). Display/hide their approximate locations on the map
Hotels: Best Western Palm Desert Resor (74 695 Highway 111) (1), Casa Larrea Inn (73771 Larrea St) (2), Bighorn Concierge (255 Palowet Drive) (3). Display/hide their approximate locations on the map
Birthplace of: Jack Blades - Rock bass guitarist, Steve Previn - Film and TV director, David Wachs - Actor.
Drinking water stations with addresses in Palm Desert and their reported violations in the past:
SHADOW HILLS RV RESORT (Population served: 150, Groundwater):Past monitoring violations:
- One minor monitoring violation
| This city: | 2.1 people |
| California: | 2.9 people |
| This city: | 57.3% |
| Whole state: | 68.7% |
| This city: | 6.9% |
| Whole state: | 7.2% |
Likely homosexual households (counted as self-reported same-sex unmarried-partner households)
- Lesbian couples: 0.7% of all households
- Gay men: 0.9% of all households
People in group quarters in Palm Desert in 2010:
- 210 people in nursing facilities/skilled-nursing facilities
- 43 people in other noninstitutional facilities
- 39 people in group homes intended for adults
- 14 people in residential treatment centers for adults
- 2 people in workers' group living quarters and job corps centers
People in group quarters in Palm Desert in 2000:
- 152 people in nursing homes
- 64 people in other group homes
- 11 people in other noninstitutional group quarters
Banks with most branches in Palm Desert (2011 data):
- Wells Fargo Bank, National Association: Palm Desert Pcs Branch, Palm Desert Branch, Monterey Store Branch, Desert Gateway Branch, Tri City Branch. Info updated 2011/04/05: Bank assets: $1,161,490.0 mil, Deposits: $905,653.0 mil, headquarters in Sioux Falls, SD, positive income, 6395 total offices, Holding Company: Wells Fargo & Company
- Bank of America, National Association: Palm Desert Branch, Monterey Avenue Branch, Palm Desert Private Bank, Washington Street Branch. Info updated 2009/11/18: Bank assets: $1,451,969.3 mil, Deposits: $1,077,176.8 mil, headquarters in Charlotte, NC, positive income, 5782 total offices, Holding Company: Bank Of America Corporation
- U.S. Bank National Association: Palm Desert Highway 111 Branch, Palm Desert - El Paseo Branch, Palm Desert - Univeristy Village Bra, Palm Desert Albertsons Branch. Info updated 2012/01/30: Bank assets: $330,470.8 mil, Deposits: $236,091.5 mil, headquarters in Cincinnati, OH, positive income, 3121 total offices, Holding Company: U.S. Bancorp
- FirstBank: 42nd & Washington Branch, Palm Desert Branch, Sun City Branch. Info updated 2011/12/05: Bank assets: $11,597.1 mil, Deposits: $10,530.4 mil, headquarters in Lakewood, CO, positive income, Mortgage Lending Specialization, 130 total offices, Holding Company: Firstbank Holding Company
- Palm Desert National Bank: at 73-745 El Paseo Drive, branch established on 1981/12/07; Coachella Valley Mesngr. Ser. Branch at 73-745 El Paseo, branch established on 1993/09/27. Info updated 2006/11/03: Bank assets: $125.8 mil, Deposits: $122.8 mil, local headquarters, negative income in the last year, Commercial Lending Specialization, 2 total offices, Holding Company: Palm Desert Investments
- Union Bank, National Association: Cook And County Club Branch at 74924 Country Club Drive Ste 1, branch established on 1994/03/25; Palm Desert Branch at 73785 El Paseo Avenue, branch established on 1993/11/01. Info updated 2011/09/01: Bank assets: $88,967.5 mil, Deposits: $65,286.4 mil, headquarters in San Francisco, CA, positive income, Commercial Lending Specialization, 403 total offices, Holding Company: Mitsubishi Ufj Financial Group, Inc.
- JPMorgan Chase Bank, National Association: Palm Desert Stater Bros at 78210 Varner Rd, branch established on 2010/05/07; 72-705 State Hwy 111 Branch at 72-705 State Hwy 111, branch established on 1919/01/01. Info updated 2011/11/10: Bank assets: $1,811,678.0 mil, Deposits: $1,190,738.0 mil, headquarters in Columbus, OH, positive income, International Specialization, 5577 total offices, Holding Company: Jpmorgan Chase & Co.
- First California Bank: Palm Desert Branch at 78-000 Fred Waring Drive, Suite 100, branch established on 2003/03/03. Info updated 2011/02/22: Bank assets: $1,813.2 mil, Deposits: $1,428.5 mil, headquarters in Westlake Village, CA, positive income, Commercial Lending Specialization, 22 total offices, Holding Company: First California Financial Group, Inc.
- Frontier Bank, FSB: Washington Street Branch at 39580 Washington St, branch established on 2006/11/13. Info updated 2011/12/02: Bank assets: $261.3 mil, Deposits: $226.3 mil, headquarters in Park City, UT, negative income in the last year, Commercial Lending Specialization, 5 total offices
- 9 other banks with 9 local branches
For population 15 years and over in Palm Desert:
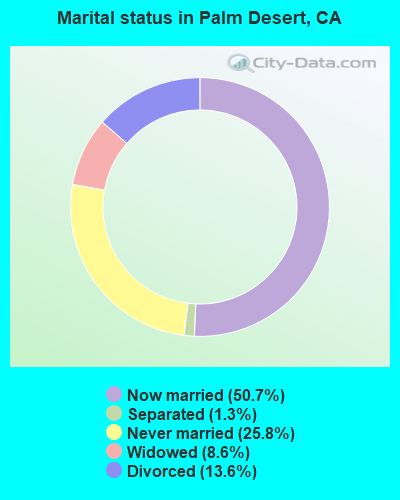
- Never married: 25.8%
- Now married: 50.7%
- Separated: 1.3%
- Widowed: 8.6%
- Divorced: 13.6%
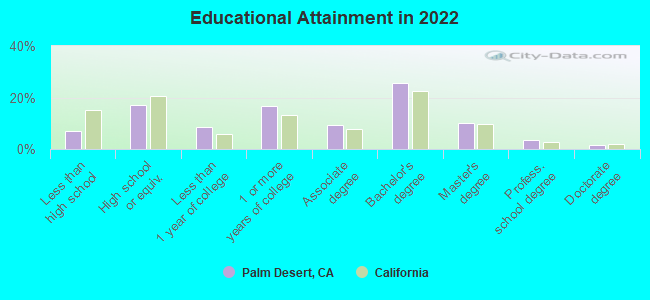
For population 25 years and over in Palm Desert:
- High school or higher: 93.0%
- Bachelor's degree or higher: 39.9%
- Graduate or professional degree: 14.8%
- Unemployed: 4.8%
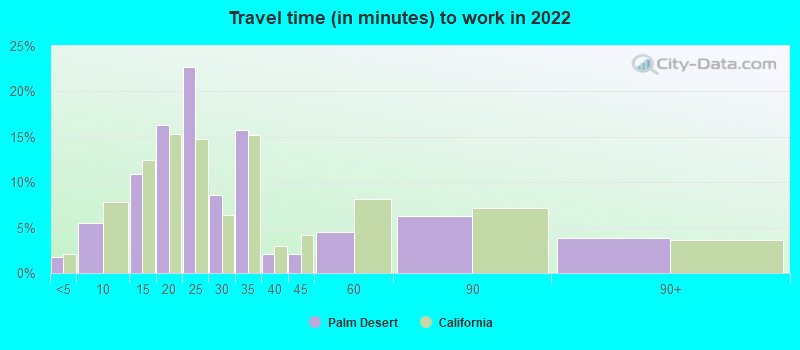
- Mean travel time to work (commute): 18.5 minutes
| Here: | 10.8 |
| California average: | 15.5 |


Graphs represent county-level data. Detailed 2008 Election Results
Religion statistics for Palm Desert, CA (based on Riverside County data)


| Religion | Adherents | Congregations |
|---|---|---|
| Catholic | 602,765 | 51 |
| Evangelical Protestant | 240,306 | 741 |
| Other | 77,581 | 194 |
| Mainline Protestant | 29,535 | 103 |
| Black Protestant | 19,170 | 40 |
| Orthodox | 3,647 | 11 |
| None | 1,216,637 | - |
Food Environment Statistics:
| This county: | 1.60 / 10,000 pop. |
| California: | 2.14 / 10,000 pop. |
| Riverside County: | 0.05 / 10,000 pop. |
| California: | 0.04 / 10,000 pop. |
| Riverside County: | 0.44 / 10,000 pop. |
| California: | 0.62 / 10,000 pop. |
| Riverside County: | 1.51 / 10,000 pop. |
| California: | 1.49 / 10,000 pop. |
| This county: | 5.45 / 10,000 pop. |
| California: | 7.42 / 10,000 pop. |
| This county: | 7.7% |
| California: | 7.3% |
| This county: | 24.5% |
| California: | 21.3% |
| Riverside County: | 15.2% |
| State: | 17.9% |
Health and Nutrition:
| Here: | 52.2% |
| State: | 49.4% |
| Palm Desert: | 49.4% |
| California: | 48.0% |
| Palm Desert: | 28.5 |
| State: | 28.1 |
| Palm Desert: | 19.4% |
| California: | 20.2% |
| Palm Desert: | 10.9% |
| California: | 11.2% |
| Here: | 6.9 |
| California: | 6.8 |
| Here: | 35.4% |
| California: | 31.5% |
| Palm Desert: | 56.3% |
| California: | 56.4% |
| Palm Desert: | 76.1% |
| California: | 80.9% |
More about Health and Nutrition of Palm Desert, CA Residents
| Local government employment and payroll (March 2022) | |||||
| Function | Full-time employees | Monthly full-time payroll | Average yearly full-time wage | Part-time employees | Monthly part-time payroll |
|---|---|---|---|---|---|
| Other and Unallocable | 33 | $253,212 | $92,077 | 0 | $0 |
| Streets and Highways | 27 | $222,152 | $98,734 | 0 | $0 |
| Other Government Administration | 21 | $183,885 | $105,077 | 0 | $0 |
| Financial Administration | 18 | $180,365 | $120,243 | 0 | $0 |
| Parks and Recreation | 8 | $71,898 | $107,847 | 0 | $0 |
| Housing and Community Development (Local) | 4 | $40,498 | $121,494 | 0 | $0 |
| Totals for Government | 111 | $952,011 | $102,920 | 0 | $0 |
Palm Desert government finances - Expenditure in 2017 (per resident):
- Construction - Regular Highways: $5,739,000 ($111.26)
Housing and Community Development: $4,220,000 ($81.81)
Parks and Recreation: $1,117,000 ($21.65)
Central Staff Services: $474,000 ($9.19)
- Current Operations - Police Protection: $20,133,000 ($390.30)
Parks and Recreation: $19,518,000 ($378.38)
Central Staff Services: $14,212,000 ($275.52)
Local Fire Protection: $12,096,000 ($234.50)
Regular Highways: $10,481,000 ($203.19)
Housing and Community Development: $9,486,000 ($183.90)
Financial Administration: $3,004,000 ($58.24)
Protective Inspection and Regulation - Other: $2,252,000 ($43.66)
Health - Other: $971,000 ($18.82)
General - Other: $513,000 ($9.95)
- General - Interest on Debt: $11,496,000 ($222.86)
- Other Capital Outlay - Housing and Community Development: $11,977,000 ($232.19)
Natural Resources - Other: $117,000 ($2.27)
General - Other: $109,000 ($2.11)
Financial Administration: $33,000 ($0.64)
Parks and Recreation: $23,000 ($0.45)
Local Fire Protection: $3,000 ($0.06)
Central Staff Services: $2,000 ($0.04)
Palm Desert government finances - Revenue in 2017 (per resident):
- Charges - Other: $13,250,000 ($256.87)
Parks and Recreation: $10,179,000 ($197.33)
Housing and Community Development: $8,123,000 ($157.47)
Regular Highways: $849,000 ($16.46)
- Federal Intergovernmental - Other: $1,189,000 ($23.05)
Housing and Community Development: $251,000 ($4.87)
- Miscellaneous - Special Assessments: $25,031,000 ($485.26)
General Revenue - Other: $5,855,000 ($113.51)
Donations From Private Sources: $1,745,000 ($33.83)
Interest Earnings: $1,460,000 ($28.30)
Fines and Forfeits: $202,000 ($3.92)
Rents: $161,000 ($3.12)
- State Intergovernmental - Highways: $953,000 ($18.48)
Other: $505,000 ($9.79)
General Local Government Support: $10,000 ($0.19)
- Tax - General Sales and Gross Receipts: $21,133,000 ($409.69)
Other Selective Sales: $16,521,000 ($320.28)
Property: $10,148,000 ($196.73)
Public Utilities Sales: $3,147,000 ($61.01)
Other License: $1,852,000 ($35.90)
Occupation and Business License - Other: $1,118,000 ($21.67)
Other: $929,000 ($18.01)
Documentary and Stock Transfer: $691,000 ($13.40)
Palm Desert government finances - Debt in 2017 (per resident):
- Long Term Debt - Beginning Outstanding - Unspecified Public Purpose: $392,963,000 ($7618.07)
Outstanding Unspecified Public Purpose: $328,881,000 ($6375.76)
Retired Unspecified Public Purpose: $309,782,000 ($6005.51)
Issue, Unspecified Public Purpose: $245,700,000 ($4763.20)
Beginning Outstanding - Public Debt for Private Purpose: $90,462,000 ($1753.72)
Outstanding Nonguaranteed - Industrial Revenue: $87,932,000 ($1704.67)
Retired Nonguaranteed - Public Debt for Private Purpose: $2,530,000 ($49.05)
Palm Desert government finances - Cash and Securities in 2017 (per resident):
- Bond Funds - Cash and Securities: $83,334,000 ($1615.53)
- Other Funds - Cash and Securities: $201,256,000 ($3901.60)
- Sinking Funds - Cash and Securities: $87,932,000 ($1704.67)
7.19% of this county's 2021 resident taxpayers lived in other counties in 2020 ($71,521 average adjusted gross income)
| Here: | 7.19% |
| California average: | 5.19% |
0.03% of residents moved from foreign countries ($210 average AGI)
Riverside County: 0.03% California average: 0.03%
Top counties from which taxpayers relocated into this county between 2020 and 2021:
| from Los Angeles County, CA | |
| from San Bernardino County, CA | |
| from Orange County, CA |
6.28% of this county's 2020 resident taxpayers moved to other counties in 2021 ($64,593 average adjusted gross income)
| Here: | 6.28% |
| California average: | 6.14% |
0.02% of residents moved to foreign countries ($200 average AGI)
Riverside County: 0.02% California average: 0.02%
Top counties to which taxpayers relocated from this county between 2020 and 2021:
| to San Bernardino County, CA | |
| to Los Angeles County, CA | |
| to Orange County, CA |
| Businesses in Palm Desert, CA | ||||
| Name | Count | Name | Count | |
|---|---|---|---|---|
| 7-Eleven | 1 | Justice | 1 | |
| 99 Cents Only Stores | 2 | Kohl's | 1 | |
| ALDO | 1 | Kroger | 1 | |
| AT&T | 2 | Lane Bryant | 1 | |
| Ace Hardware | 1 | Lane Furniture | 1 | |
| Aeropostale | 1 | LensCrafters | 2 | |
| Albertsons | 2 | Lowe's | 1 | |
| American Eagle Outfitters | 1 | Macy's | 2 | |
| Ann Taylor | 1 | Marriott | 7 | |
| Apple Store | 1 | Marshalls | 1 | |
| Applebee's | 1 | MasterBrand Cabinets | 10 | |
| Arby's | 1 | McDonald's | 3 | |
| Ashley Furniture | 1 | Men's Wearhouse | 1 | |
| AutoZone | 1 | Motel 6 | 1 | |
| Avenue | 1 | Motherhood Maternity | 2 | |
| Banana Republic | 1 | New Balance | 7 | |
| Barnes & Noble | 1 | New York & Co | 1 | |
| Baskin-Robbins | 1 | Nike | 2 | |
| Bath & Body Works | 1 | OfficeMax | 1 | |
| Bed Bath & Beyond | 1 | Old Navy | 1 | |
| Best Western | 1 | Olive Garden | 1 | |
| Brooks Brothers | 1 | Outback | 1 | |
| Brookstone | 1 | Outback Steakhouse | 1 | |
| Buffalo Wild Wings | 1 | Pac Sun | 1 | |
| Burger King | 2 | Panda Express | 3 | |
| CVS | 1 | Panera Bread | 1 | |
| Cache | 2 | Payless | 2 | |
| Carl\s Jr. | 2 | PetSmart | 1 | |
| Casual Male XL | 1 | Pier 1 Imports | 1 | |
| Charlotte Russe | 1 | Pizza Hut | 1 | |
| Chico's | 1 | Popeyes | 1 | |
| Chipotle | 1 | Pottery Barn | 1 | |
| Chuck E. Cheese's | 1 | Quiznos | 2 | |
| Cinnabon | 1 | RadioShack | 1 | |
| Circle K | 5 | Rite Aid | 3 | |
| Cold Stone Creamery | 2 | SAS Shoes | 1 | |
| Coldwater Creek | 1 | Safeway | 1 | |
| Comfort Suites | 1 | Saks Fifth Avenue | 1 | |
| Costco | 1 | Sam's Club | 1 | |
| DHL | 1 | Sears | 2 | |
| Decora Cabinetry | 3 | Soma Intimates | 1 | |
| Dennys | 1 | Spencer Gifts | 1 | |
| Discount Tire | 1 | Sprint Nextel | 1 | |
| Domino's Pizza | 2 | Staples | 1 | |
| El Pollo Loco | 1 | Starbucks | 9 | |
| Ethan Allen | 1 | Subway | 3 | |
| Express | 1 | T-Mobile | 6 | |
| Famous Footwear | 1 | T.J.Maxx | 1 | |
| FedEx | 16 | Taco Bell | 1 | |
| Finish Line | 1 | Talbots | 1 | |
| Foot Locker | 1 | Target | 1 | |
| Forever 21 | 1 | Torrid | 1 | |
| GNC | 3 | Toys"R"Us | 1 | |
| GameStop | 2 | Trader Joe's | 1 | |
| Gap | 1 | True Value | 1 | |
| Gymboree | 1 | U-Haul | 2 | |
| H&R Block | 2 | UPS | 15 | |
| Hilton | 2 | Vans | 4 | |
| Holiday Inn | 1 | Verizon Wireless | 2 | |
| Hollister Co. | 1 | Victoria's Secret | 1 | |
| HomeTown Buffet | 1 | Vons | 1 | |
| Hot Topic | 1 | Walgreens | 2 | |
| IHOP | 1 | Walmart | 1 | |
| J.Crew | 1 | Wendy's | 1 | |
| JCPenney | 1 | Westin | 1 | |
| Jamba Juice | 1 | Wet Seal | 1 | |
| Jones New York | 3 | World Gym | 1 | |
| Journeys | 1 | YMCA | 1 | |
| Juicy Couture | 1 | |||
Strongest AM radio stations in Palm Desert:
- KNWQ (1140 AM; 10 kW; PALM SPRINGS, CA; Owner: MCC RADIO, LLC)
- KCMJ (1270 AM; 5 kW; THOUSAND PALMS, CA; Owner: MCC RADIO, LLC)
- KXPS (1010 AM; 4 kW; THOUSAND PALMS, CA; Owner: MCC RADIO, LLC)
- KPSI (920 AM; 5 kW; PALM SPRINGS, CA; Owner: R & R RADIO CORPORATION)
- KNWZ (970 AM; 5 kW; COACHELLA, CA; Owner: MCC RADIO, LLC)
- KESQ (1400 AM; 1 kW; INDIO, CA; Owner: GULF-CALIFORNIA BROADCAST CO.)
- KWXY (1340 AM; 1 kW; CATHEDRAL CITY, CA; Owner: GLEN BARNETT, INC.)
- KGAM (1450 AM; 1 kW; PALM SPRINGS, CA; Owner: R & R RADIO CORPORATION)
- KFMB (760 AM; 50 kW; SAN DIEGO, CA; Owner: MIDWEST TELEVISION, INC.)
- KPLS (830 AM; 50 kW; ORANGE, CA; Owner: CRN LICENSES, LLC)
- KLAC (570 AM; 50 kW; LOS ANGELES, CA; Owner: AMFM RADIO LICENSES, L.L.C.)
- KCBQ (1170 AM; 50 kW; SAN DIEGO, CA; Owner: RADIO 1210, INC.)
- KFI (640 AM; 50 kW; LOS ANGELES, CA; Owner: CAPSTAR TX LIMITED PARTNERSHIP)
Strongest FM radio stations in Palm Desert:
- KATY-FM (101.3 FM; IDYLLWILD, CA; Owner: ALL PRO BROADCASTING, INC.)
- KCLB-FM (93.7 FM; COACHELLA, CA; Owner: MCC RADIO, LLC)
- KCRI (89.3 FM; INDIO, CA; Owner: SANTA MONICA COMMUNITY COLLEGE DIST.)
- KLOB (94.7 FM; THOUSAND PALMS, CA; Owner: ENTRAVISION HOLDINGS, LLC)
- KJJZ (102.3 FM; INDIO, CA; Owner: R M BROADCASTING L.L.C.)
- KUNA-FM (96.7 FM; LA QUINTA, CA; Owner: GULF-CALIFORNIA BROADCAST COMPANY)
- K280CV (103.9 FM; CATHEDRAL CITY, CA; Owner: MCC RADIO, LLC)
- KLRD (90.1 FM; YUCAIPA, CA; Owner: EDUCATIONAL MEDIA FOUNDATION)
- KEZN (103.1 FM; PALM DESERT, CA; Owner: INFINITY RADIO SUBSIDIARY OPERATIONS INC.)
- KHCS (91.7 FM; PALM DESERT, CA; Owner: PRAIRIE AVENUE GOSPEL CENTER)
- KMRJ (99.5 FM; RANCHO MIRAGE, CA; Owner: DANIEL P. MITCHELL)
- KDES-FM (104.7 FM; PALM SPRINGS, CA; Owner: R & R RADIO CORPORATION)
- K201AR (88.1 FM; BANNING, CA; Owner: KSGN, INC.)
- K232CX (94.3 FM; DESERT HOT SPRINGS, CA; Owner: MCC RADIO, LLC)
- KWXY-FM (98.5 FM; CATHEDRAL CITY, CA; Owner: GLEN BARNETT, INC.)
- KPSC (88.5 FM; PALM SPRINGS, CA; Owner: UNIVERSITY OF SOUTHERN CALIFORNIA)
- KYOR (106.9 FM; YUCCA VALLEY, CA; Owner: MCC RADIO, LLC)
- KKUU (92.7 FM; INDIO, CA; Owner: MCC RADIO, LLC)
- KRTM (88.9 FM; TEMECULA, CA; Owner: PENFOLD COMMUNICATIONS, INC.)
- KLVJ (100.1 FM; JULIAN, CA; Owner: EDUCATIONAL MEDIA FOUNDATION)
TV broadcast stations around Palm Desert:
- KESQ-TV (Channel 42; PALM SPRINGS, CA; Owner: GULF-CALIFORNIA BROADCAST COMPANY)
- KYAV-LP (Channel 12; PALM SPRINGS, CA; Owner: JDF INVESTMENT CO. LLC)
- KVPS-LP (Channel 8; INDIO, CA; Owner: VALCOM BROADCASTING LLC)
- KMIR-TV (Channel 36; PALM SPRINGS, CA; Owner: JOURNAL BROADCAST CORPORATION)
- K25GW (Channel 25; INDIO, CA; Owner: DESERT SPRINGS, INC.)
- K19DH (Channel 19; INDIO, CA; Owner: DESERT BROADCASTING, INC.)
- KEVC-CA (Channel 5; INDIO, CA; Owner: ENTRAVISION HOLDINGS, LLC)
- KPSP-LP (Channel 58; CATHEDRAL CITY-PALM, CA; Owner: DESERT TELEVISION LLC)
- K06MB (Channel 6; INDIO, CA; Owner: PARK PLACE BROADCASTING COMPANY)
- KVER-CA (Channel 4; INDIO, CA; Owner: ENTRAVISION HOLDINGS, LLC)
- KODG-LP (Channel 17; PALM SPRINGS, CA; Owner: BILTMORE BROADCASTING CORPORATION)
- National Bridge Inventory (NBI) Statistics
- 24Number of bridges
- 443ft / 135mTotal length
- 693,452Total average daily traffic
- 118,205Total average daily truck traffic
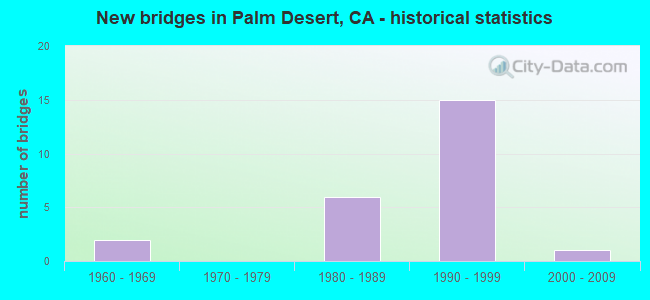
- New bridges - historical statistics
- 21960-1969
- 61980-1989
- 151990-1999
- 12000-2009
FCC Registered Commercial Land Mobile Towers: 4 (See the full list of FCC Registered Commercial Land Mobile Towers in Palm Desert, CA)
FCC Registered Broadcast Land Mobile Towers: 78 (See the full list of FCC Registered Broadcast Land Mobile Towers)
FCC Registered Microwave Towers: 103 (See the full list of FCC Registered Microwave Towers in this town)
FCC Registered Paging Towers: 2 (See the full list of FCC Registered Paging Towers)
FCC Registered Amateur Radio Licenses: 392 (See the full list of FCC Registered Amateur Radio Licenses in Palm Desert)
FAA Registered Aircraft Manufacturers and Dealers: 2 (See the full list of FAA Registered Manufacturers and Dealers in Palm Desert)
FAA Registered Aircraft: 37 (See the full list of FAA Registered Aircraft)
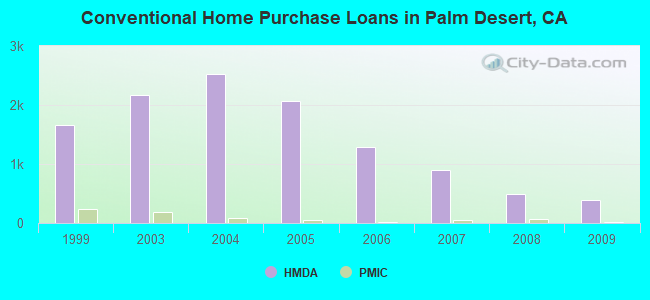
| Home Mortgage Disclosure Act Aggregated Statistics For Year 2009 (Based on 3 full and 5 partial tracts) | ||||||||||||||
| A) FHA, FSA/RHS & VA Home Purchase Loans | B) Conventional Home Purchase Loans | C) Refinancings | D) Home Improvement Loans | E) Loans on Dwellings For 5+ Families | F) Non-occupant Loans on < 5 Family Dwellings (A B C & D) | G) Loans On Manufactured Home Dwelling (A B C & D) | ||||||||
|---|---|---|---|---|---|---|---|---|---|---|---|---|---|---|
| Number | Average Value | Number | Average Value | Number | Average Value | Number | Average Value | Number | Average Value | Number | Average Value | Number | Average Value | |
| LOANS ORIGINATED | 99 | $218,188 | 397 | $266,374 | 1,055 | $273,835 | 39 | $161,803 | 1 | $12,374,640 | 599 | $268,753 | 10 | $143,081 |
| APPLICATIONS APPROVED, NOT ACCEPTED | 11 | $250,308 | 48 | $256,500 | 127 | $273,809 | 4 | $204,352 | 0 | $0 | 77 | $260,372 | 6 | $162,110 |
| APPLICATIONS DENIED | 20 | $198,208 | 82 | $283,134 | 498 | $304,128 | 15 | $189,413 | 1 | $1,274,710 | 215 | $281,062 | 7 | $124,720 |
| APPLICATIONS WITHDRAWN | 16 | $224,464 | 64 | $257,512 | 250 | $293,781 | 11 | $223,998 | 1 | $804,520 | 115 | $290,237 | 3 | $234,860 |
| FILES CLOSED FOR INCOMPLETENESS | 4 | $181,065 | 11 | $263,595 | 64 | $269,632 | 1 | $202,330 | 0 | $0 | 19 | $268,459 | 1 | $276,640 |
Detailed HMDA statistics for the following Tracts: 0449.11 , 0449.12, 0449.13, 0449.14, 0451.05, 0451.06, 0451.07, 0451.08
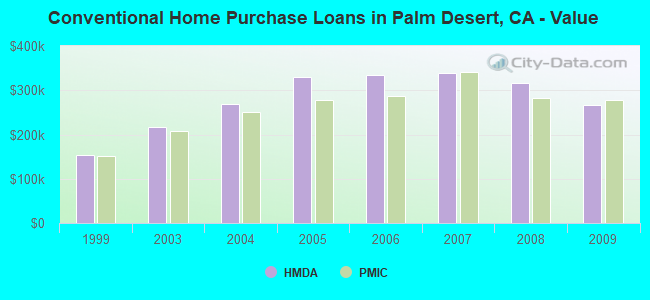
| Private Mortgage Insurance Companies Aggregated Statistics For Year 2009 (Based on 3 full and 5 partial tracts) | ||||||
| A) Conventional Home Purchase Loans | B) Refinancings | C) Non-occupant Loans on < 5 Family Dwellings (A & B) | ||||
|---|---|---|---|---|---|---|
| Number | Average Value | Number | Average Value | Number | Average Value | |
| LOANS ORIGINATED | 9 | $278,237 | 5 | $358,424 | 2 | $260,440 |
| APPLICATIONS APPROVED, NOT ACCEPTED | 4 | $232,040 | 2 | $352,495 | 2 | $163,995 |
| APPLICATIONS DENIED | 2 | $289,735 | 1 | $225,460 | 0 | $0 |
| APPLICATIONS WITHDRAWN | 1 | $190,770 | 0 | $0 | 0 | $0 |
| FILES CLOSED FOR INCOMPLETENESS | 1 | $150,670 | 0 | $0 | 0 | $0 |
Detailed PMIC statistics for the following Tracts: 0449.11 , 0449.12, 0449.13, 0449.14, 0451.05, 0451.06, 0451.07, 0451.08
Fire-safe hotels and motels in Palm Desert, California:
- Embassy Suites Palm Desert Resort, 74-700 Hwy 111, Palm Desert, California 92260 , Phone: (760) 340-6600, Fax: (760) 340-9519
- Holiday Inn Express Palm Desert, 74675 Hwy 111, Palm Desert, California 92260 , Phone: (760) 340-4303, Fax: (760) 340-3723
- Courtyard By Marriott, Palm Desert, 74895 Frank Sinatra, Palm Desert, California 92211 , Phone: (760) 776-4150, Fax: (760) 776-1816
- Hampton Inn & Suites, 74 900 Gerald Ford Dr, Palm Desert, California 92211 , Phone: (760) 340-1001, Fax: (760) 340-9050
- Sun Dunes Villas, 40-215 Harris Ln, Palm Desert, California 92211 , Phone: (760) 345-4621
- Homewood Suites Palm Desert, 36999 Cook St, Palm Desert, California 92211 , Phone: (760) 568-1600, Fax: (760) 568-1608
- Best Western Plus Palm Desert Resort, 74695 Hwy 111, Palm desert, California 92260 , Phone: (760) 340-4441, Fax: (760) 773-9413
- Fairfield Inn & Suites Palm Desert, 74-764 Technology Dr, Palm desert, California 92211 , Phone: (760) 636-1600
- Autograph Hotel Paseo, 45-400 Larkspur Ln, Palm desert, California 92260 , Phone: (888) 236-2427
| Most common first names in Palm Desert, CA among deceased individuals | ||
| Name | Count | Lived (average) |
|---|---|---|
| Robert | 379 | 76.1 years |
| John | 373 | 76.7 years |
| William | 320 | 76.3 years |
| Mary | 253 | 79.8 years |
| James | 239 | 75.9 years |
| Richard | 182 | 74.5 years |
| George | 180 | 78.3 years |
| Charles | 178 | 77.0 years |
| Dorothy | 151 | 80.9 years |
| Helen | 150 | 82.8 years |
| Most common last names in Palm Desert, CA among deceased individuals | ||
| Last name | Count | Lived (average) |
|---|---|---|
| Smith | 104 | 77.1 years |
| Johnson | 75 | 75.6 years |
| Miller | 71 | 79.5 years |
| Davis | 56 | 79.8 years |
| Jones | 54 | 77.7 years |
| Brown | 53 | 77.2 years |
| Williams | 47 | 78.9 years |
| Anderson | 47 | 80.7 years |
| Thompson | 43 | 76.6 years |
| Taylor | 42 | 76.7 years |

- 77.7%Utility gas
- 18.0%Electricity
- 2.3%Solar energy
- 1.4%Bottled, tank, or LP gas
- 0.2%No fuel used
- 0.2%Other fuel
- 0.1%Wood
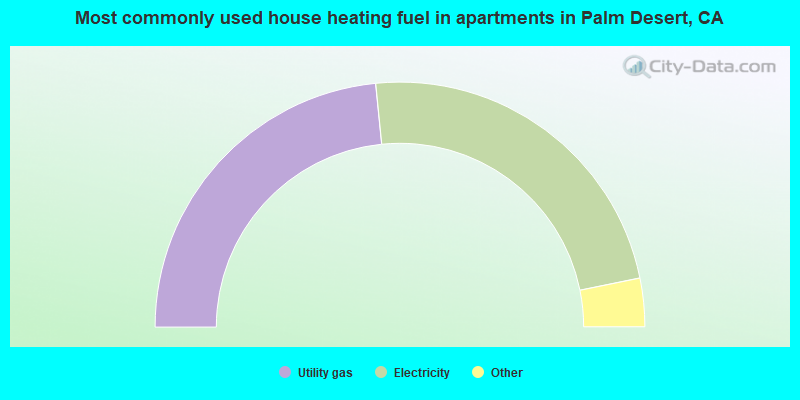
- 46.8%Utility gas
- 46.7%Electricity
- 3.4%Bottled, tank, or LP gas
- 2.7%No fuel used
- 0.2%Other fuel
- 0.2%Solar energy
Palm Desert compared to California state average:
- Unemployed percentage significantly below state average.
- Median age significantly above state average.
- House age below state average.
- Percentage of population with a bachelor's degree or higher above state average.
Palm Desert on our top lists:
- #2 on the list of "Top 101 cities with largest percentage of males in occupations: personal care and service occupations (population 50,000+)"
- #2 on the list of "Top 100 cities with oldest residents (pop. 50,000+)"
- #8 on the list of "Top 101 cities with largest percentage of males in occupations: arts, design, entertainment, sports, and media occupations (population 50,000+)"
- #9 on the list of "Top 101 cities with largest percentage of males in industries: arts, entertainment, and recreation (population 50,000+)"
- #10 on the list of "Top 101 cities with the lowest average yearly precipitation (population 50,000+)"
- #12 on the list of "Top 100 cities with strongest arts, entertainment, recreation, accommodation and food services industries (pop. 50,000+)"
- #14 on the list of "Top 101 cities with largest percentage of females in industries: accommodation and food services (population 50,000+)"
- #15 on the list of "Top 101 cities with the largest percentage of likely gay men couples (counted as self-reported male-male unmarried-partner households) (population 50,000+)"
- #15 on the list of "Top 101 cities with largest percentage of females in industries: real estate and rental and leasing (population 50,000+)"
- #16 on the list of "Top 101 cities with the highest daily high temperatures (population 50,000+)"
- #19 on the list of "Top 101 cities with the largest percentage of likely homosexual households (counted as self-reported same-sex unmarried-partner households) (population 50,000+)"
- #20 on the list of "Top 101 cities with the highest cost per building permit(population 50,000+)"
- #21 on the list of "Top 101 cities with largest percentage of females in occupations: arts, design, entertainment, sports, and media occupations (population 50,000+)"
- #24 on the list of "Top 101 cities with largest percentage of females in industries: information (population 50,000+)"
- #24 on the list of "Top 101 cities with largest percentage of females in industries: arts, entertainment, and recreation (population 50,000+)"
- #25 on the list of "Top 101 cities with the hottest summers (population 50,000+)"
- #31 on the list of "Top 101 cities with largest percentage of males in industries: administrative and support and waste management services (population 50,000+)"
- #33 on the list of "Top 101 cities with the smallest precipitation differences during a year (population 50,000+)"
- #34 on the list of "Top 101 cities with the highest percentage of workers working at home, population 50,000+"
- #34 on the list of "Top 101 cities with the largest percentage of likely lesbian couples (counted as self-reported female-female unmarried-partner households) (population 50,000+)"
- #3 on the list of "Top 101 counties with the highest lead air pollution readings in 2012 (µg/m3)"
- #4 on the list of "Top 101 counties with the highest ground withdrawal of fresh water for public supply"
- #11 on the list of "Top 101 counties with the most Catholic adherents"
- #11 on the list of "Top 101 counties with the highest total withdrawal of fresh water for public supply"
- #12 on the list of "Top 101 counties with the highest carbon monoxide air pollution readings in 2012 (ppm)"

|
|
Total of 130 patent applications in 2008-2024.