La Quinta, California Submit your own pictures of this city and show them to the world
OSM Map
General Map
Google Map
MSN Map
OSM Map
General Map
Google Map
MSN Map
OSM Map
General Map
Google Map
MSN Map
OSM Map
General Map
Google Map
MSN Map
Please wait while loading the map...
Population in 2022: 38,392 (97% urban, 3% rural). Population change since 2000: +62.0%Males: 20,011 Females: 18,381
March 2022 cost of living index in La Quinta: 83.3 (low, U.S. average is 100) Percentage of residents living in poverty in 2022: 9.5%for White Non-Hispanic residents , 23.5% for Black residents , 13.1% for Hispanic or Latino residents , 3.4% for American Indian residents , 14.2% for other race residents , 12.9% for two or more races residents )
Profiles of local businesses
Business Search - 14 Million verified businesses
Data:
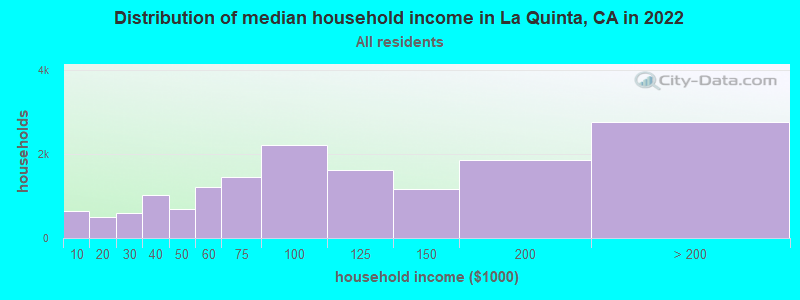
Median household income ($)
Median household income (% change since 2000)
Household income diversity
Ratio of average income to average house value (%)
Ratio of average income to average rent
Median household income ($) - White
Median household income ($) - Black or African American
Median household income ($) - Asian
Median household income ($) - Hispanic or Latino
Median household income ($) - American Indian and Alaska Native
Median household income ($) - Multirace
Median household income ($) - Other Race
Median household income for houses/condos with a mortgage ($)
Median household income for apartments without a mortgage ($)
Races - White alone (%)
Races - White alone (% change since 2000)
Races - Black alone (%)
Races - Black alone (% change since 2000)
Races - American Indian alone (%)
Races - American Indian alone (% change since 2000)
Races - Asian alone (%)
Races - Asian alone (% change since 2000)
Races - Hispanic (%)
Races - Hispanic (% change since 2000)
Races - Native Hawaiian and Other Pacific Islander alone (%)
Races - Native Hawaiian and Other Pacific Islander alone (% change since 2000)
Races - Two or more races (%)
Races - Two or more races (% change since 2000)
Races - Other race alone (%)
Races - Other race alone (% change since 2000)
Racial diversity
Unemployment (%)
Unemployment (% change since 2000)
Unemployment (%) - White
Unemployment (%) - Black or African American
Unemployment (%) - Asian
Unemployment (%) - Hispanic or Latino
Unemployment (%) - American Indian and Alaska Native
Unemployment (%) - Multirace
Unemployment (%) - Other Race
Population density (people per square mile)
Population - Males (%)
Population - Females (%)
Population - Males (%) - White
Population - Males (%) - Black or African American
Population - Males (%) - Asian
Population - Males (%) - Hispanic or Latino
Population - Males (%) - American Indian and Alaska Native
Population - Males (%) - Multirace
Population - Males (%) - Other Race
Population - Females (%) - White
Population - Females (%) - Black or African American
Population - Females (%) - Asian
Population - Females (%) - Hispanic or Latino
Population - Females (%) - American Indian and Alaska Native
Population - Females (%) - Multirace
Population - Females (%) - Other Race
Coronavirus confirmed cases (Apr 27, 2024)
Deaths caused by coronavirus (Apr 27, 2024)
Coronavirus confirmed cases (per 100k population) (Apr 27, 2024)
Deaths caused by coronavirus (per 100k population) (Apr 27, 2024)
Daily increase in number of cases (Apr 27, 2024)
Weekly increase in number of cases (Apr 27, 2024)
Cases doubled (in days) (Apr 27, 2024)
Hospitalized patients (Apr 18, 2022)
Negative test results (Apr 18, 2022)
Total test results (Apr 18, 2022)
COVID Vaccine doses distributed (per 100k population) (Sep 19, 2023)
COVID Vaccine doses administered (per 100k population) (Sep 19, 2023)
COVID Vaccine doses distributed (Sep 19, 2023)
COVID Vaccine doses administered (Sep 19, 2023)
Likely homosexual households (%)
Likely homosexual households (% change since 2000)
Likely homosexual households - Lesbian couples (%)
Likely homosexual households - Lesbian couples (% change since 2000)
Likely homosexual households - Gay men (%)
Likely homosexual households - Gay men (% change since 2000)
Cost of living index
Median gross rent ($)
Median contract rent ($)
Median monthly housing costs ($)
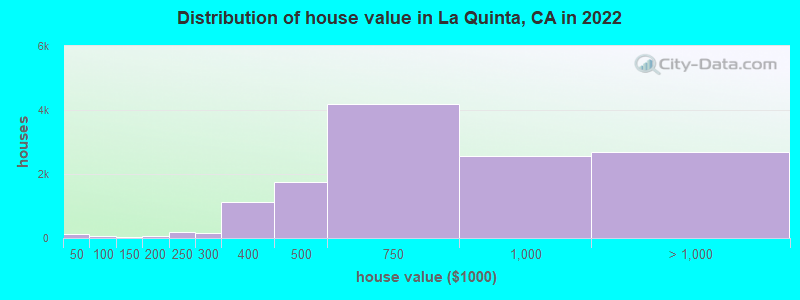
Median house or condo value ($)
Median house or condo value ($ change since 2000)
Mean house or condo value by units in structure - 1, detached ($)
Mean house or condo value by units in structure - 1, attached ($)
Mean house or condo value by units in structure - 2 ($)
Mean house or condo value by units in structure by units in structure - 3 or 4 ($)
Mean house or condo value by units in structure - 5 or more ($)
Mean house or condo value by units in structure - Boat, RV, van, etc. ($)
Mean house or condo value by units in structure - Mobile home ($)
Median house or condo value ($) - White
Median house or condo value ($) - Black or African American
Median house or condo value ($) - Asian
Median house or condo value ($) - Hispanic or Latino
Median house or condo value ($) - American Indian and Alaska Native
Median house or condo value ($) - Multirace
Median house or condo value ($) - Other Race
Median resident age
Resident age diversity
Median resident age - Males
Median resident age - Females
Median resident age - White
Median resident age - Black or African American
Median resident age - Asian
Median resident age - Hispanic or Latino
Median resident age - American Indian and Alaska Native
Median resident age - Multirace
Median resident age - Other Race
Median resident age - Males - White
Median resident age - Males - Black or African American
Median resident age - Males - Asian
Median resident age - Males - Hispanic or Latino
Median resident age - Males - American Indian and Alaska Native
Median resident age - Males - Multirace
Median resident age - Males - Other Race
Median resident age - Females - White
Median resident age - Females - Black or African American
Median resident age - Females - Asian
Median resident age - Females - Hispanic or Latino
Median resident age - Females - American Indian and Alaska Native
Median resident age - Females - Multirace
Median resident age - Females - Other Race
Commute - mean travel time to work (minutes)
Travel time to work - Less than 5 minutes (%)
Travel time to work - Less than 5 minutes (% change since 2000)
Travel time to work - 5 to 9 minutes (%)
Travel time to work - 5 to 9 minutes (% change since 2000)
Travel time to work - 10 to 19 minutes (%)
Travel time to work - 10 to 19 minutes (% change since 2000)
Travel time to work - 20 to 29 minutes (%)
Travel time to work - 20 to 29 minutes (% change since 2000)
Travel time to work - 30 to 39 minutes (%)
Travel time to work - 30 to 39 minutes (% change since 2000)
Travel time to work - 40 to 59 minutes (%)
Travel time to work - 40 to 59 minutes (% change since 2000)
Travel time to work - 60 to 89 minutes (%)
Travel time to work - 60 to 89 minutes (% change since 2000)
Travel time to work - 90 or more minutes (%)
Travel time to work - 90 or more minutes (% change since 2000)
Marital status - Never married (%)
Marital status - Now married (%)
Marital status - Separated (%)
Marital status - Widowed (%)
Marital status - Divorced (%)
Median family income ($)
Median family income (% change since 2000)
Median non-family income ($)
Median non-family income (% change since 2000)
Median per capita income ($)
Median per capita income (% change since 2000)
Median family income ($) - White
Median family income ($) - Black or African American
Median family income ($) - Asian
Median family income ($) - Hispanic or Latino
Median family income ($) - American Indian and Alaska Native
Median family income ($) - Multirace
Median family income ($) - Other Race
Median year house/condo built
Median year apartment built
Year house built - Built 2005 or later (%)
Year house built - Built 2000 to 2004 (%)
Year house built - Built 1990 to 1999 (%)
Year house built - Built 1980 to 1989 (%)
Year house built - Built 1970 to 1979 (%)
Year house built - Built 1960 to 1969 (%)
Year house built - Built 1950 to 1959 (%)
Year house built - Built 1940 to 1949 (%)
Year house built - Built 1939 or earlier (%)
Average household size
Household density (households per square mile)
Average household size - White
Average household size - Black or African American
Average household size - Asian
Average household size - Hispanic or Latino
Average household size - American Indian and Alaska Native
Average household size - Multirace
Average household size - Other Race
Occupied housing units (%)
Vacant housing units (%)
Owner occupied housing units (%)
Renter occupied housing units (%)
Vacancy status - For rent (%)
Vacancy status - For sale only (%)
Vacancy status - Rented or sold, not occupied (%)
Vacancy status - For seasonal, recreational, or occasional use (%)
Vacancy status - For migrant workers (%)
Vacancy status - Other vacant (%)
Residents with income below the poverty level (%)
Residents with income below 50% of the poverty level (%)
Children below poverty level (%)
Poor families by family type - Married-couple family (%)
Poor families by family type - Male, no wife present (%)
Poor families by family type - Female, no husband present (%)
Poverty status for native-born residents (%)
Poverty status for foreign-born residents (%)
Poverty among high school graduates not in families (%)
Poverty among people who did not graduate high school not in families (%)
Residents with income below the poverty level (%) - White
Residents with income below the poverty level (%) - Black or African American
Residents with income below the poverty level (%) - Asian
Residents with income below the poverty level (%) - Hispanic or Latino
Residents with income below the poverty level (%) - American Indian and Alaska Native
Residents with income below the poverty level (%) - Multirace
Residents with income below the poverty level (%) - Other Race
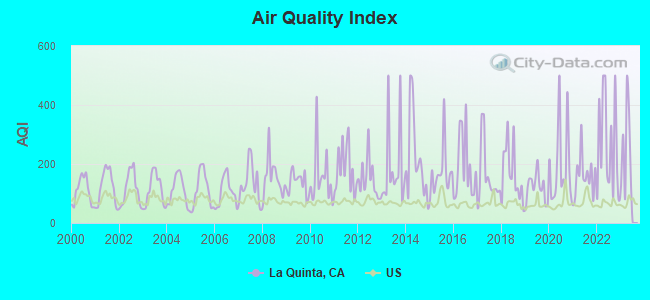
Air pollution - Air Quality Index (AQI)
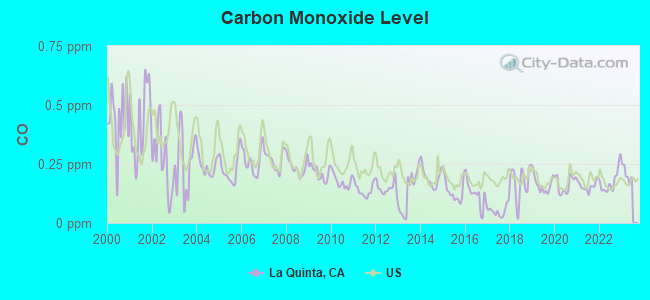
Air pollution - CO
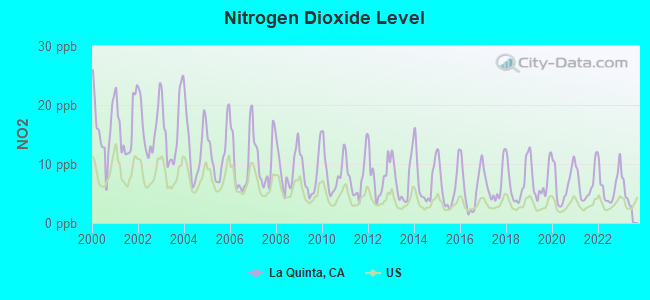
Air pollution - NO2
Air pollution - SO2
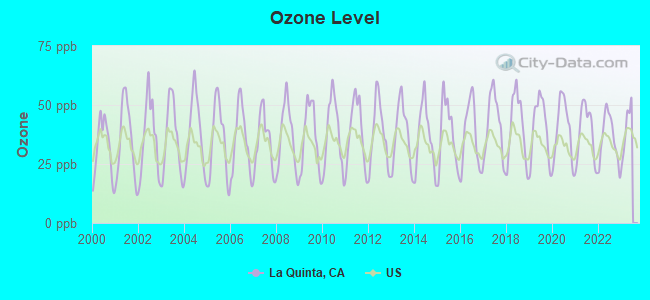
Air pollution - Ozone
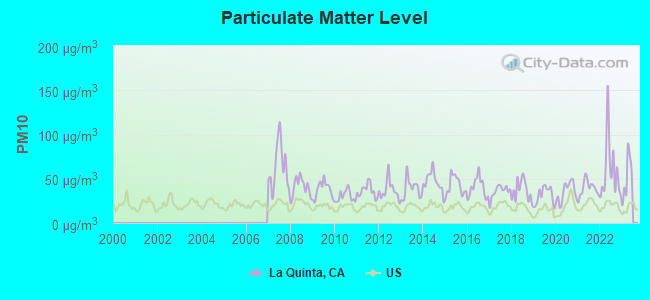
Air pollution - PM10
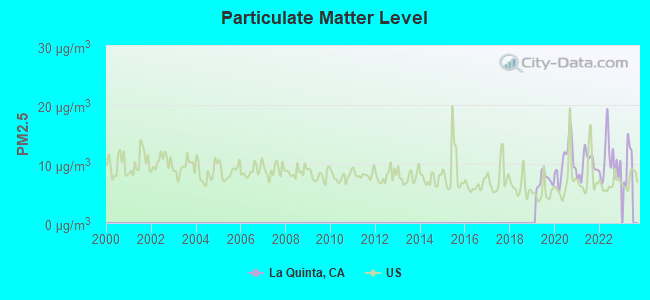
Air pollution - PM25
Air pollution - Pb
Crime - Murders per 100,000 population
Crime - Rapes per 100,000 population
Crime - Robberies per 100,000 population
Crime - Assaults per 100,000 population
Crime - Burglaries per 100,000 population
Crime - Thefts per 100,000 population
Crime - Auto thefts per 100,000 population
Crime - Arson per 100,000 population
Crime - City-data.com crime index
Crime - Violent crime index
Crime - Property crime index
Crime - Murders per 100,000 population (5 year average)
Crime - Rapes per 100,000 population (5 year average)
Crime - Robberies per 100,000 population (5 year average)
Crime - Assaults per 100,000 population (5 year average)
Crime - Burglaries per 100,000 population (5 year average)
Crime - Thefts per 100,000 population (5 year average)
Crime - Auto thefts per 100,000 population (5 year average)
Crime - Arson per 100,000 population (5 year average)
Crime - City-data.com crime index (5 year average)
Crime - Violent crime index (5 year average)
Crime - Property crime index (5 year average)
1996 Presidential Elections Results (%) - Democratic Party (Clinton)
1996 Presidential Elections Results (%) - Republican Party (Dole)
1996 Presidential Elections Results (%) - Other
2000 Presidential Elections Results (%) - Democratic Party (Gore)
2000 Presidential Elections Results (%) - Republican Party (Bush)
2000 Presidential Elections Results (%) - Other
2004 Presidential Elections Results (%) - Democratic Party (Kerry)
2004 Presidential Elections Results (%) - Republican Party (Bush)
2004 Presidential Elections Results (%) - Other
2008 Presidential Elections Results (%) - Democratic Party (Obama)
2008 Presidential Elections Results (%) - Republican Party (McCain)
2008 Presidential Elections Results (%) - Other
2012 Presidential Elections Results (%) - Democratic Party (Obama)
2012 Presidential Elections Results (%) - Republican Party (Romney)
2012 Presidential Elections Results (%) - Other
2016 Presidential Elections Results (%) - Democratic Party (Clinton)
2016 Presidential Elections Results (%) - Republican Party (Trump)
2016 Presidential Elections Results (%) - Other
2020 Presidential Elections Results (%) - Democratic Party (Biden)
2020 Presidential Elections Results (%) - Republican Party (Trump)
2020 Presidential Elections Results (%) - Other
Ancestries Reported - Arab (%)
Ancestries Reported - Czech (%)
Ancestries Reported - Danish (%)
Ancestries Reported - Dutch (%)
Ancestries Reported - English (%)
Ancestries Reported - French (%)
Ancestries Reported - French Canadian (%)
Ancestries Reported - German (%)
Ancestries Reported - Greek (%)
Ancestries Reported - Hungarian (%)
Ancestries Reported - Irish (%)
Ancestries Reported - Italian (%)
Ancestries Reported - Lithuanian (%)
Ancestries Reported - Norwegian (%)
Ancestries Reported - Polish (%)
Ancestries Reported - Portuguese (%)
Ancestries Reported - Russian (%)
Ancestries Reported - Scotch-Irish (%)
Ancestries Reported - Scottish (%)
Ancestries Reported - Slovak (%)
Ancestries Reported - Subsaharan African (%)
Ancestries Reported - Swedish (%)
Ancestries Reported - Swiss (%)
Ancestries Reported - Ukrainian (%)
Ancestries Reported - United States (%)
Ancestries Reported - Welsh (%)
Ancestries Reported - West Indian (%)
Ancestries Reported - Other (%)
Educational Attainment - No schooling completed (%)
Educational Attainment - Less than high school (%)
Educational Attainment - High school or equivalent (%)
Educational Attainment - Less than 1 year of college (%)
Educational Attainment - 1 or more years of college (%)
Educational Attainment - Associate degree (%)
Educational Attainment - Bachelor's degree (%)
Educational Attainment - Master's degree (%)
Educational Attainment - Professional school degree (%)
Educational Attainment - Doctorate degree (%)
School Enrollment - Nursery, preschool (%)
School Enrollment - Kindergarten (%)
School Enrollment - Grade 1 to 4 (%)
School Enrollment - Grade 5 to 8 (%)
School Enrollment - Grade 9 to 12 (%)
School Enrollment - College undergrad (%)
School Enrollment - Graduate or professional (%)
School Enrollment - Not enrolled in school (%)
School enrollment - Public schools (%)
School enrollment - Private schools (%)
School enrollment - Not enrolled (%)
Median number of rooms in houses and condos
Median number of rooms in apartments
Housing units lacking complete plumbing facilities (%)
Housing units lacking complete kitchen facilities (%)
Density of houses
Urban houses (%)
Rural houses (%)
Households with people 60 years and over (%)
Households with people 65 years and over (%)
Households with people 75 years and over (%)
Households with one or more nonrelatives (%)
Households with no nonrelatives (%)
Population in households (%)
Family households (%)
Nonfamily households (%)
Population in families (%)
Family households with own children (%)
Median number of bedrooms in owner occupied houses
Mean number of bedrooms in owner occupied houses
Median number of bedrooms in renter occupied houses
Mean number of bedrooms in renter occupied houses
Median number of vehichles in owner occupied houses
Mean number of vehichles in owner occupied houses
Median number of vehichles in renter occupied houses
Mean number of vehichles in renter occupied houses
Mortgage status - with mortgage (%)
Mortgage status - with second mortgage (%)
Mortgage status - with home equity loan (%)
Mortgage status - with both second mortgage and home equity loan (%)
Mortgage status - without a mortgage (%)
Average family size
Average family size - White
Average family size - Black or African American
Average family size - Asian
Average family size - Hispanic or Latino
Average family size - American Indian and Alaska Native
Average family size - Multirace
Average family size - Other Race
Geographical mobility - Same house 1 year ago (%)
Geographical mobility - Moved within same county (%)
Geographical mobility - Moved from different county within same state (%)
Geographical mobility - Moved from different state (%)
Geographical mobility - Moved from abroad (%)
Place of birth - Born in state of residence (%)
Place of birth - Born in other state (%)
Place of birth - Native, outside of US (%)
Place of birth - Foreign born (%)
Housing units in structures - 1, detached (%)
Housing units in structures - 1, attached (%)
Housing units in structures - 2 (%)
Housing units in structures - 3 or 4 (%)
Housing units in structures - 5 to 9 (%)
Housing units in structures - 10 to 19 (%)
Housing units in structures - 20 to 49 (%)
Housing units in structures - 50 or more (%)
Housing units in structures - Mobile home (%)
Housing units in structures - Boat, RV, van, etc. (%)
House/condo owner moved in on average (years ago)
Renter moved in on average (years ago)
Year householder moved into unit - Moved in 1999 to March 2000 (%)
Year householder moved into unit - Moved in 1995 to 1998 (%)
Year householder moved into unit - Moved in 1990 to 1994 (%)
Year householder moved into unit - Moved in 1980 to 1989 (%)
Year householder moved into unit - Moved in 1970 to 1979 (%)
Year householder moved into unit - Moved in 1969 or earlier (%)
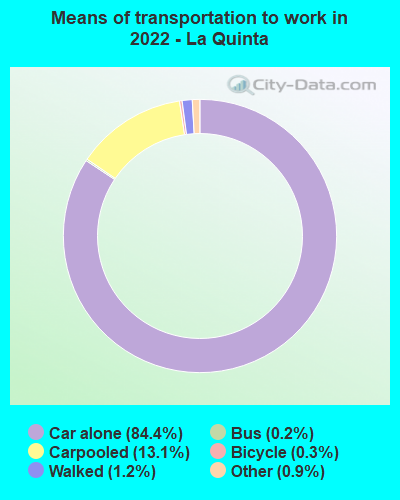
Means of transportation to work - Drove car alone (%)
Means of transportation to work - Carpooled (%)
Means of transportation to work - Public transportation (%)
Means of transportation to work - Bus or trolley bus (%)
Means of transportation to work - Streetcar or trolley car (%)
Means of transportation to work - Subway or elevated (%)
Means of transportation to work - Railroad (%)
Means of transportation to work - Ferryboat (%)
Means of transportation to work - Taxicab (%)
Means of transportation to work - Motorcycle (%)
Means of transportation to work - Bicycle (%)
Means of transportation to work - Walked (%)
Means of transportation to work - Other means (%)
Working at home (%)
Industry diversity
Most Common Industries - Agriculture, forestry, fishing and hunting, and mining (%)
Most Common Industries - Agriculture, forestry, fishing and hunting (%)
Most Common Industries - Mining, quarrying, and oil and gas extraction (%)
Most Common Industries - Construction (%)
Most Common Industries - Manufacturing (%)
Most Common Industries - Wholesale trade (%)
Most Common Industries - Retail trade (%)
Most Common Industries - Transportation and warehousing, and utilities (%)
Most Common Industries - Transportation and warehousing (%)
Most Common Industries - Utilities (%)
Most Common Industries - Information (%)
Most Common Industries - Finance and insurance, and real estate and rental and leasing (%)
Most Common Industries - Finance and insurance (%)
Most Common Industries - Real estate and rental and leasing (%)
Most Common Industries - Professional, scientific, and management, and administrative and waste management services (%)
Most Common Industries - Professional, scientific, and technical services (%)
Most Common Industries - Management of companies and enterprises (%)
Most Common Industries - Administrative and support and waste management services (%)
Most Common Industries - Educational services, and health care and social assistance (%)
Most Common Industries - Educational services (%)
Most Common Industries - Health care and social assistance (%)
Most Common Industries - Arts, entertainment, and recreation, and accommodation and food services (%)
Most Common Industries - Arts, entertainment, and recreation (%)
Most Common Industries - Accommodation and food services (%)
Most Common Industries - Other services, except public administration (%)
Most Common Industries - Public administration (%)
Occupation diversity
Most Common Occupations - Management, business, science, and arts occupations (%)
Most Common Occupations - Management, business, and financial occupations (%)
Most Common Occupations - Management occupations (%)
Most Common Occupations - Business and financial operations occupations (%)
Most Common Occupations - Computer, engineering, and science occupations (%)
Most Common Occupations - Computer and mathematical occupations (%)
Most Common Occupations - Architecture and engineering occupations (%)
Most Common Occupations - Life, physical, and social science occupations (%)
Most Common Occupations - Education, legal, community service, arts, and media occupations (%)
Most Common Occupations - Community and social service occupations (%)
Most Common Occupations - Legal occupations (%)
Most Common Occupations - Education, training, and library occupations (%)
Most Common Occupations - Arts, design, entertainment, sports, and media occupations (%)
Most Common Occupations - Healthcare practitioners and technical occupations (%)
Most Common Occupations - Health diagnosing and treating practitioners and other technical occupations (%)
Most Common Occupations - Health technologists and technicians (%)
Most Common Occupations - Service occupations (%)
Most Common Occupations - Healthcare support occupations (%)
Most Common Occupations - Protective service occupations (%)
Most Common Occupations - Fire fighting and prevention, and other protective service workers including supervisors (%)
Most Common Occupations - Law enforcement workers including supervisors (%)
Most Common Occupations - Food preparation and serving related occupations (%)
Most Common Occupations - Building and grounds cleaning and maintenance occupations (%)
Most Common Occupations - Personal care and service occupations (%)
Most Common Occupations - Sales and office occupations (%)
Most Common Occupations - Sales and related occupations (%)
Most Common Occupations - Office and administrative support occupations (%)
Most Common Occupations - Natural resources, construction, and maintenance occupations (%)
Most Common Occupations - Farming, fishing, and forestry occupations (%)
Most Common Occupations - Construction and extraction occupations (%)
Most Common Occupations - Installation, maintenance, and repair occupations (%)
Most Common Occupations - Production, transportation, and material moving occupations (%)
Most Common Occupations - Production occupations (%)
Most Common Occupations - Transportation occupations (%)
Most Common Occupations - Material moving occupations (%)
People in Group quarters - Institutionalized population (%)
People in Group quarters - Correctional institutions (%)
People in Group quarters - Federal prisons and detention centers (%)
People in Group quarters - Halfway houses (%)
People in Group quarters - Local jails and other confinement facilities (including police lockups) (%)
People in Group quarters - Military disciplinary barracks (%)
People in Group quarters - State prisons (%)
People in Group quarters - Other types of correctional institutions (%)
People in Group quarters - Nursing homes (%)
People in Group quarters - Hospitals/wards, hospices, and schools for the handicapped (%)
People in Group quarters - Hospitals/wards and hospices for chronically ill (%)
People in Group quarters - Hospices or homes for chronically ill (%)
People in Group quarters - Military hospitals or wards for chronically ill (%)
People in Group quarters - Other hospitals or wards for chronically ill (%)
People in Group quarters - Hospitals or wards for drug/alcohol abuse (%)
People in Group quarters - Mental (Psychiatric) hospitals or wards (%)
People in Group quarters - Schools, hospitals, or wards for the mentally retarded (%)
People in Group quarters - Schools, hospitals, or wards for the physically handicapped (%)
People in Group quarters - Institutions for the deaf (%)
People in Group quarters - Institutions for the blind (%)
People in Group quarters - Orthopedic wards and institutions for the physically handicapped (%)
People in Group quarters - Wards in general hospitals for patients who have no usual home elsewhere (%)
People in Group quarters - Wards in military hospitals for patients who have no usual home elsewhere (%)
People in Group quarters - Juvenile institutions (%)
People in Group quarters - Long-term care (%)
People in Group quarters - Homes for abused, dependent, and neglected children (%)
People in Group quarters - Residential treatment centers for emotionally disturbed children (%)
People in Group quarters - Training schools for juvenile delinquents (%)
People in Group quarters - Short-term care, detention or diagnostic centers for delinquent children (%)
People in Group quarters - Type of juvenile institution unknown (%)
People in Group quarters - Noninstitutionalized population (%)
People in Group quarters - College dormitories (includes college quarters off campus) (%)
People in Group quarters - Military quarters (%)
People in Group quarters - On base (%)
People in Group quarters - Barracks, unaccompanied personnel housing (UPH), (Enlisted/Officer), ;and similar group living quarters for military personnel (%)
People in Group quarters - Transient quarters for temporary residents (%)
People in Group quarters - Military ships (%)
People in Group quarters - Group homes (%)
People in Group quarters - Homes or halfway houses for drug/alcohol abuse (%)
People in Group quarters - Homes for the mentally ill (%)
People in Group quarters - Homes for the mentally retarded (%)
People in Group quarters - Homes for the physically handicapped (%)
People in Group quarters - Other group homes (%)
People in Group quarters - Religious group quarters (%)
People in Group quarters - Dormitories (%)
People in Group quarters - Agriculture workers' dormitories on farms (%)
People in Group quarters - Job Corps and vocational training facilities (%)
People in Group quarters - Other workers' dormitories (%)
People in Group quarters - Crews of maritime vessels (%)
People in Group quarters - Other nonhousehold living situations (%)
People in Group quarters - Other noninstitutional group quarters (%)
Residents speaking English at home (%)
Residents speaking English at home - Born in the United States (%)
Residents speaking English at home - Native, born elsewhere (%)
Residents speaking English at home - Foreign born (%)
Residents speaking Spanish at home (%)
Residents speaking Spanish at home - Born in the United States (%)
Residents speaking Spanish at home - Native, born elsewhere (%)
Residents speaking Spanish at home - Foreign born (%)
Residents speaking other language at home (%)
Residents speaking other language at home - Born in the United States (%)
Residents speaking other language at home - Native, born elsewhere (%)
Residents speaking other language at home - Foreign born (%)
Class of Workers - Employee of private company (%)
Class of Workers - Self-employed in own incorporated business (%)
Class of Workers - Private not-for-profit wage and salary workers (%)
Class of Workers - Local government workers (%)
Class of Workers - State government workers (%)
Class of Workers - Federal government workers (%)
Class of Workers - Self-employed workers in own not incorporated business and Unpaid family workers (%)
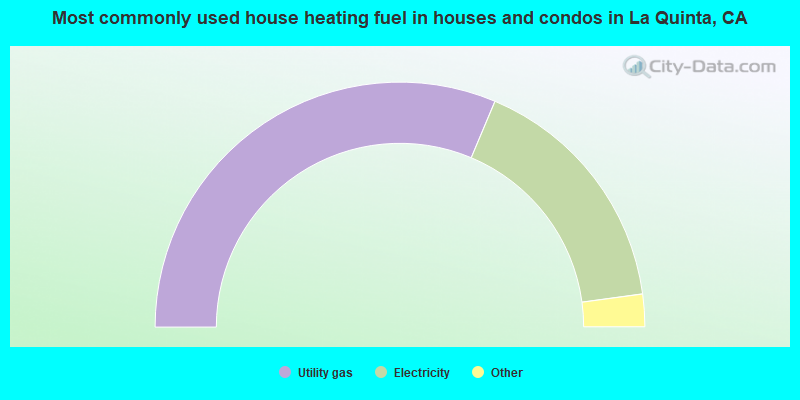
House heating fuel used in houses and condos - Utility gas (%)
House heating fuel used in houses and condos - Bottled, tank, or LP gas (%)
House heating fuel used in houses and condos - Electricity (%)
House heating fuel used in houses and condos - Fuel oil, kerosene, etc. (%)
House heating fuel used in houses and condos - Coal or coke (%)
House heating fuel used in houses and condos - Wood (%)
House heating fuel used in houses and condos - Solar energy (%)
House heating fuel used in houses and condos - Other fuel (%)
House heating fuel used in houses and condos - No fuel used (%)
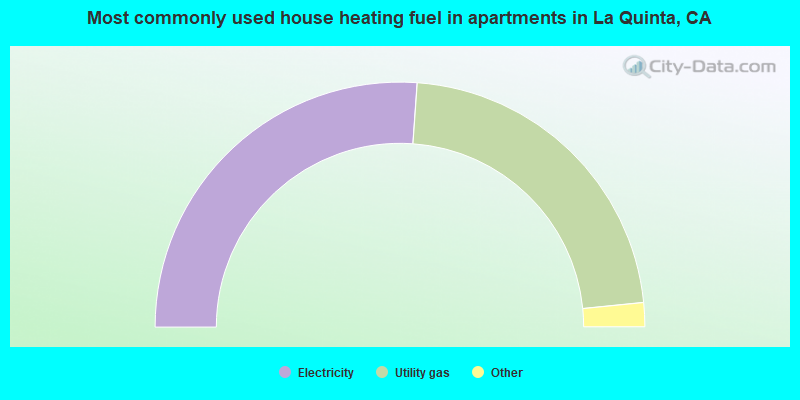
House heating fuel used in apartments - Utility gas (%)
House heating fuel used in apartments - Bottled, tank, or LP gas (%)
House heating fuel used in apartments - Electricity (%)
House heating fuel used in apartments - Fuel oil, kerosene, etc. (%)
House heating fuel used in apartments - Coal or coke (%)
House heating fuel used in apartments - Wood (%)
House heating fuel used in apartments - Solar energy (%)
House heating fuel used in apartments - Other fuel (%)
House heating fuel used in apartments - No fuel used (%)
Armed forces status - In Armed Forces (%)
Armed forces status - Civilian (%)
Armed forces status - Civilian - Veteran (%)
Armed forces status - Civilian - Nonveteran (%)
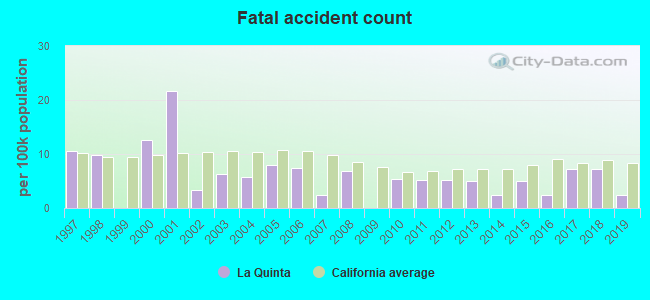
Fatal accidents locations in years 2005-2021
Fatal accidents locations in 2005
Fatal accidents locations in 2006
Fatal accidents locations in 2007
Fatal accidents locations in 2008
Fatal accidents locations in 2009
Fatal accidents locations in 2010
Fatal accidents locations in 2011
Fatal accidents locations in 2012
Fatal accidents locations in 2013
Fatal accidents locations in 2014
Fatal accidents locations in 2015
Fatal accidents locations in 2016
Fatal accidents locations in 2017
Fatal accidents locations in 2018
Fatal accidents locations in 2019
Fatal accidents locations in 2020
Fatal accidents locations in 2021
Alcohol use - People drinking some alcohol every month (%)
Alcohol use - People not drinking at all (%)
Alcohol use - Average days/month drinking alcohol
Alcohol use - Average drinks/week
Alcohol use - Average days/year people drink much
Audiometry - Average condition of hearing (%)
Audiometry - People that can hear a whisper from across a quiet room (%)
Audiometry - People that can hear normal voice from across a quiet room (%)
Audiometry - Ears ringing, roaring, buzzing (%)
Audiometry - Had a job exposure to loud noise (%)
Audiometry - Had off-work exposure to loud noise (%)
Blood Pressure & Cholesterol - Has high blood pressure (%)
Blood Pressure & Cholesterol - Checking blood pressure at home (%)
Blood Pressure & Cholesterol - Frequently checking blood cholesterol (%)
Blood Pressure & Cholesterol - Has high cholesterol level (%)
Consumer Behavior - Money monthly spent on food at supermarket/grocery store
Consumer Behavior - Money monthly spent on food at other stores
Consumer Behavior - Money monthly spent on eating out
Consumer Behavior - Money monthly spent on carryout/delivered foods
Consumer Behavior - Income spent on food at supermarket/grocery store (%)
Consumer Behavior - Income spent on food at other stores (%)
Consumer Behavior - Income spent on eating out (%)
Consumer Behavior - Income spent on carryout/delivered foods (%)
Current Health Status - General health condition (%)
Current Health Status - Blood donors (%)
Current Health Status - Has blood ever tested for HIV virus (%)
Current Health Status - Left-handed people (%)
Dermatology - People using sunscreen (%)
Diabetes - Diabetics (%)
Diabetes - Had a blood test for high blood sugar (%)
Diabetes - People taking insulin (%)
Diet Behavior & Nutrition - Diet health (%)
Diet Behavior & Nutrition - Milk product consumption (# of products/month)
Diet Behavior & Nutrition - Meals not home prepared (#/week)
Diet Behavior & Nutrition - Meals from fast food or pizza place (#/week)
Diet Behavior & Nutrition - Ready-to-eat foods (#/month)
Diet Behavior & Nutrition - Frozen meals/pizza (#/month)
Drug Use - People that ever used marijuana or hashish (%)
Drug Use - Ever used hard drugs (%)
Drug Use - Ever used any form of cocaine (%)
Drug Use - Ever used heroin (%)
Drug Use - Ever used methamphetamine (%)
Health Insurance - People covered by health insurance (%)
Kidney Conditions-Urology - Avg. # of times urinating at night
Medical Conditions - People with asthma (%)
Medical Conditions - People with anemia (%)
Medical Conditions - People with psoriasis (%)
Medical Conditions - People with overweight (%)
Medical Conditions - Elderly people having difficulties in thinking or remembering (%)
Medical Conditions - People who ever received blood transfusion (%)
Medical Conditions - People having trouble seeing even with glass/contacts (%)
Medical Conditions - People with arthritis (%)
Medical Conditions - People with gout (%)
Medical Conditions - People with congestive heart failure (%)
Medical Conditions - People with coronary heart disease (%)
Medical Conditions - People with angina pectoris (%)
Medical Conditions - People who ever had heart attack (%)
Medical Conditions - People who ever had stroke (%)
Medical Conditions - People with emphysema (%)
Medical Conditions - People with thyroid problem (%)
Medical Conditions - People with chronic bronchitis (%)
Medical Conditions - People with any liver condition (%)
Medical Conditions - People who ever had cancer or malignancy (%)
Mental Health - People who have little interest in doing things (%)
Mental Health - People feeling down, depressed, or hopeless (%)
Mental Health - People who have trouble sleeping or sleeping too much (%)
Mental Health - People feeling tired or having little energy (%)
Mental Health - People with poor appetite or overeating (%)
Mental Health - People feeling bad about themself (%)
Mental Health - People who have trouble concentrating on things (%)
Mental Health - People moving or speaking slowly or too fast (%)
Mental Health - People having thoughts they would be better off dead (%)
Oral Health - Average years since last visit a dentist
Oral Health - People embarrassed because of mouth (%)
Oral Health - People with gum disease (%)
Oral Health - General health of teeth and gums (%)
Oral Health - Average days a week using dental floss/device
Oral Health - Average days a week using mouthwash for dental problem
Oral Health - Average number of teeth
Pesticide Use - Households using pesticides to control insects (%)
Pesticide Use - Households using pesticides to kill weeds (%)
Physical Activity - People doing vigorous-intensity work activities (%)
Physical Activity - People doing moderate-intensity work activities (%)
Physical Activity - People walking or bicycling (%)
Physical Activity - People doing vigorous-intensity recreational activities (%)
Physical Activity - People doing moderate-intensity recreational activities (%)
Physical Activity - Average hours a day doing sedentary activities
Physical Activity - Average hours a day watching TV or videos
Physical Activity - Average hours a day using computer
Physical Functioning - People having limitations keeping them from working (%)
Physical Functioning - People limited in amount of work they can do (%)
Physical Functioning - People that need special equipment to walk (%)
Physical Functioning - People experiencing confusion/memory problems (%)
Physical Functioning - People requiring special healthcare equipment (%)
Prescription Medications - Average number of prescription medicines taking
Preventive Aspirin Use - Adults 40+ taking low-dose aspirin (%)
Reproductive Health - Vaginal deliveries (%)
Reproductive Health - Cesarean deliveries (%)
Reproductive Health - Deliveries resulted in a live birth (%)
Reproductive Health - Pregnancies resulted in a delivery (%)
Reproductive Health - Women breastfeeding newborns (%)
Reproductive Health - Women that had a hysterectomy (%)
Reproductive Health - Women that had both ovaries removed (%)
Reproductive Health - Women that have ever taken birth control pills (%)
Reproductive Health - Women taking birth control pills (%)
Reproductive Health - Women that have ever used Depo-Provera or injectables (%)
Reproductive Health - Women that have ever used female hormones (%)
Sexual Behavior - People 18+ that ever had sex (vaginal, anal, or oral) (%)
Sexual Behavior - Males 18+ that ever had vaginal sex with a woman (%)
Sexual Behavior - Males 18+ that ever performed oral sex on a woman (%)
Sexual Behavior - Males 18+ that ever had anal sex with a woman (%)
Sexual Behavior - Males 18+ that ever had any sex with a man (%)
Sexual Behavior - Females 18+ that ever had vaginal sex with a man (%)
Sexual Behavior - Females 18+ that ever performed oral sex on a man (%)
Sexual Behavior - Females 18+ that ever had anal sex with a man (%)
Sexual Behavior - Females 18+ that ever had any kind of sex with a woman (%)
Sexual Behavior - Average age people first had sex
Sexual Behavior - Average number of female sex partners in lifetime (males 18+)
Sexual Behavior - Average number of female vaginal sex partners in lifetime (males 18+)
Sexual Behavior - Average age people first performed oral sex on a woman (18+)
Sexual Behavior - Average number of woman performed oral sex on in lifetime (18+)
Sexual Behavior - Average number of male sex partners in lifetime (males 18+)
Sexual Behavior - Average number of male anal sex partners in lifetime (males 18+)
Sexual Behavior - Average age people first performed oral sex on a man (18+)
Sexual Behavior - Average number of male oral sex partners in lifetime (18+)
Sexual Behavior - People using protection when performing oral sex (%)
Sexual Behavior - Average number of times people have vaginal or anal sex a year
Sexual Behavior - People having sex without condom (%)
Sexual Behavior - Average number of male sex partners in lifetime (females 18+)
Sexual Behavior - Average number of male vaginal sex partners in lifetime (females 18+)
Sexual Behavior - Average number of female sex partners in lifetime (females 18+)
Sexual Behavior - Circumcised males 18+ (%)
Sleep Disorders - Average hours sleeping at night
Sleep Disorders - People that has trouble sleeping (%)
Smoking-Cigarette Use - People smoking cigarettes (%)
Taste & Smell - People 40+ having problems with smell (%)
Taste & Smell - People 40+ having problems with taste (%)
Taste & Smell - People 40+ that ever had wisdom teeth removed (%)
Taste & Smell - People 40+ that ever had tonsils teeth removed (%)
Taste & Smell - People 40+ that ever had a loss of consciousness because of a head injury (%)
Taste & Smell - People 40+ that ever had a broken nose or other serious injury to face or skull (%)
Taste & Smell - People 40+ that ever had two or more sinus infections (%)
Weight - Average height (inches)
Weight - Average weight (pounds)
Weight - Average BMI
Weight - People that are obese (%)
Weight - People that ever were obese (%)
Weight - People trying to lose weight (%)
19,488 50.5% White alone 14,472 37.5% Hispanic 1,468 3.8% Asian alone 1,360 3.5% Two or more races 602 1.6% Black alone 215 0.6% Other race alone 121 0.3% American Indian alone 90 0.2% Native Hawaiian and Other
According to our research of California and other state lists, there were 22 registered sex offenders living in La Quinta, California as of April 27, 2024 . The ratio of all residents to sex offenders in La Quinta is 1,859 to 1.The ratio of registered sex offenders to all residents in this city is much lower than the state average.
Officers per 1,000 residents here:
0.02California average:
1.98
Latest news from La Quinta, CA collected exclusively by city-data.com from local newspapers, TV, and radio stations
Ancestries: German (5.8%), English (5.6%), American (4.8%), Irish (3.9%), Italian (3.0%), European (2.0%).
Current Local Time:
Land area: 31.8 square miles.
Population density: 1,209 people per square mile (low).
5,574 residents are foreign born (7.8% Latin America , 2.5% Asia , 2.0% North America , 1.4% Europe ).
This city:
14.4%California:
26.5%
Median real estate property taxes paid for housing units with mortgages in 2022: $5,043 (0.8%)Median real estate property taxes paid for housing units with no mortgage in 2022: $6,355 (0.8%)
Nearest city with pop. 50,000+: Coachella Valley, CA
Nearest city with pop. 200,000+: Riverside, CA
Nearest city with pop. 1,000,000+: San Diego, CA
Nearest cities:
Latitude: 33.68 N, Longitude: 116.30 W
Daytime population change due to commuting: -1,121 (-2.9%)Workers who live and work in this city: 5,630 (35.3%)
Area code commonly used in this area: 760
La Quinta tourist attractions:
Single-family new house construction building permits:
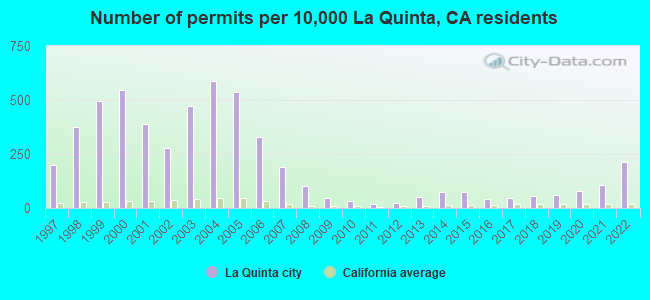
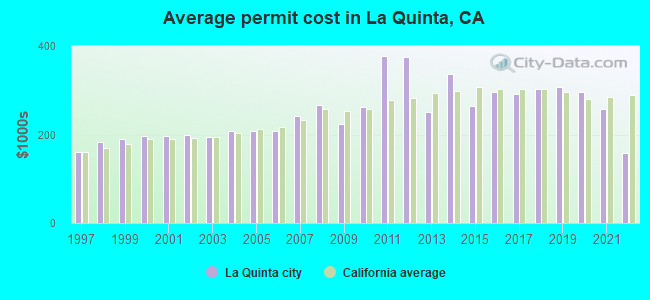
2022: 501 buildings , average cost: $159,4002021: 256 buildings , average cost: $257,1002020: 190 buildings , average cost: $295,8002019: 139 buildings , average cost: $307,0002018: 127 buildings , average cost: $303,0002017: 113 buildings , average cost: $291,0002016: 102 buildings , average cost: $296,3002015: 173 buildings , average cost: $264,2002014: 174 buildings , average cost: $336,4002013: 116 buildings , average cost: $250,1002012: 55 buildings , average cost: $376,1002011: 41 buildings , average cost: $377,6002010: 79 buildings , average cost: $263,2002009: 109 buildings , average cost: $222,9002008: 237 buildings , average cost: $266,5002007: 448 buildings , average cost: $241,3002006: 775 buildings , average cost: $207,7002005: 1269 buildings , average cost: $209,4002004: 1392 buildings , average cost: $207,8002003: 1116 buildings , average cost: $194,7002002: 657 buildings , average cost: $199,5002001: 916 buildings , average cost: $196,3002000: 1293 buildings , average cost: $196,2001999: 1170 buildings , average cost: $189,9001998: 888 buildings , average cost: $182,5001997: 467 buildings , average cost: $161,300Unemployment in December 2023: Population change in the 1990s: +12,105 (+104.5%).
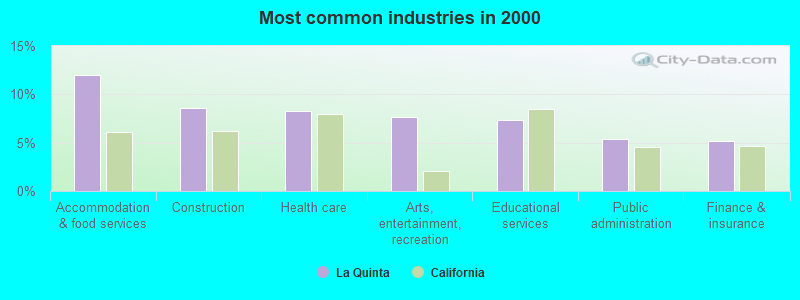
Most common industries in La Quinta, CA (%)
Both Males Females
Accommodation & food services (12.0%)
Construction (8.6%)
Health care (8.2%)
Arts, entertainment, recreation (7.6%)
Educational services (7.3%)
Public administration (5.4%)
Finance & insurance (5.2%)
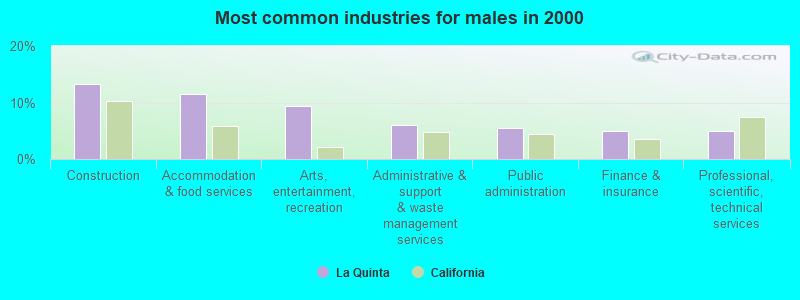
Construction (13.3%)
Accommodation & food services (11.5%)
Arts, entertainment, recreation (9.4%)
Administrative & support & waste management services (6.0%)
Public administration (5.5%)
Finance & insurance (4.9%)
Professional, scientific, technical services (4.9%)
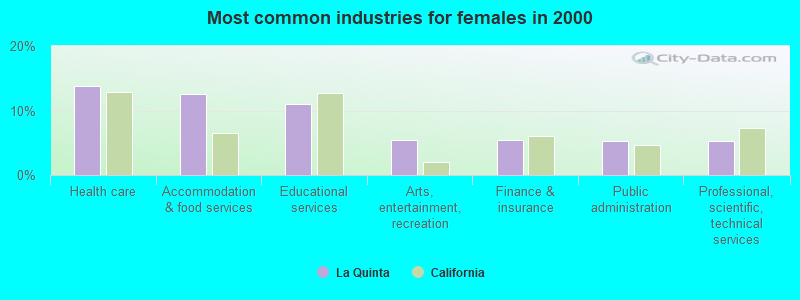
Health care (13.8%)
Accommodation & food services (12.6%)
Educational services (10.9%)
Arts, entertainment, recreation (5.5%)
Finance & insurance (5.5%)
Public administration (5.3%)
Professional, scientific, technical services (5.2%)
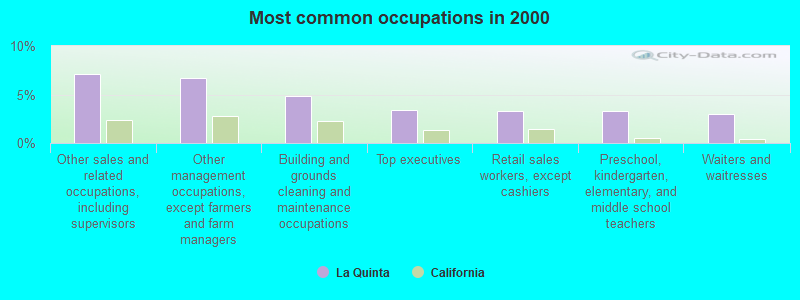
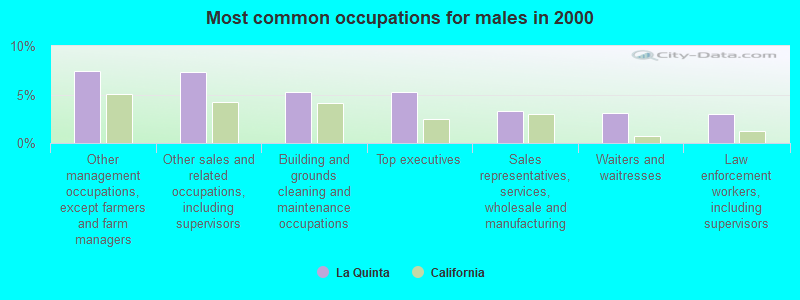
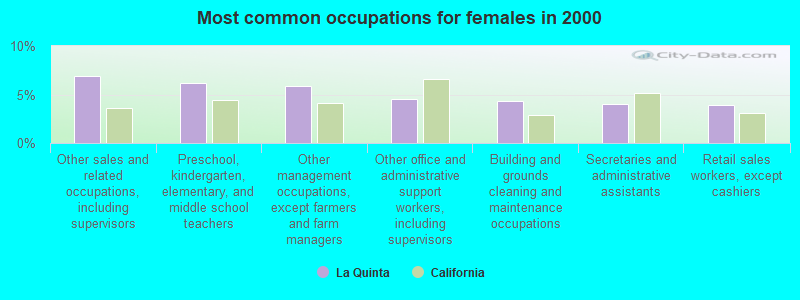
Most common occupations in La Quinta, CA (%)
Both Males Females
Other sales and related occupations, including supervisors (7.1%)
Other management occupations, except farmers and farm managers (6.7%)
Building and grounds cleaning and maintenance occupations (4.9%)
Top executives (3.4%)
Retail sales workers, except cashiers (3.3%)
Preschool, kindergarten, elementary, and middle school teachers (3.3%)
Waiters and waitresses (3.0%)
Other management occupations, except farmers and farm managers (7.4%)
Other sales and related occupations, including supervisors (7.3%)
Building and grounds cleaning and maintenance occupations (5.3%)
Top executives (5.3%)
Sales representatives, services, wholesale and manufacturing (3.3%)
Waiters and waitresses (3.1%)
Law enforcement workers, including supervisors (3.0%)
Other sales and related occupations, including supervisors (6.9%)
Preschool, kindergarten, elementary, and middle school teachers (6.2%)
Other management occupations, except farmers and farm managers (5.9%)
Other office and administrative support workers, including supervisors (4.5%)
Building and grounds cleaning and maintenance occupations (4.3%)
Secretaries and administrative assistants (4.1%)
Retail sales workers, except cashiers (3.9%)
Earthquake activity:
La Quinta-area historical earthquake activity is significantly above California state average. It is 6734% greater than the overall U.S. average. On 6/28/1992 at 11:57:34, a magnitude 7.6 (6.2 MB, 7.6 MS, 7.3 MW, Depth: 0.7 mi, Class: Major, Intensity: VIII - XII) earthquake occurred 37.7 miles away from La Quinta center, causing 3 deaths ( 1 shaking deaths, 2 other deaths) and 400 injuries, causing $100,000,000 total damage and $40,000,000 insured lossesOn 10/16/1999 at 09:46:44, a magnitude 7.4 (6.3 MB, 7.4 MS, 7.2 MW, 7.3 ML) earthquake occurred 58.6 miles away from the city center On 5/19/1940 at 04:36:40, a magnitude 7.2 (7.2 UK) earthquake occurred 46.7 miles away from La Quinta center, causing $33,000,000 total damage On 7/21/1952 at 11:52:14, a magnitude 7.7 (7.7 UK) earthquake occurred 179.5 miles away from the city center, causing $50,000,000 total damage On 12/31/1934 at 18:45:56, a magnitude 7.1 (7.1 UK) earthquake occurred 75.2 miles away from the city center On 10/15/1979 at 23:16:54, a magnitude 7.0 (5.7 MB, 6.9 MS, 7.0 ML, 6.4 MW) earthquake occurred 70.7 miles away from La Quinta center Magnitude types: body-wave magnitude (MB), local magnitude (ML), surface-wave magnitude (MS), moment magnitude (MW) Natural disasters: The number of natural disasters in Riverside County (46) is a lot greater than the US average (15).Major Disasters (Presidential) Declared: 27Emergencies Declared: 1Fires: 22, Floods: 20, Storms: 8, Winter Storms: 8, Landslides: 6, Mudslides: 5, Heavy Rains: 2, Earthquake: 1, Flash Flood: 1, Freeze: 1, Hurricane: 1, Tornado: 1, Tropical Storm: 1, Other: 1 (Note: some incidents may be assigned to more than one category). Hospitals and medical centers in La Quinta: LA QUINTA KIDNEY CENTER, LLC (43576 WASHINGTON STREET, SUITE 101)
Other hospitals and medical centers near La Quinta: KIDNEY INSTITUTE OF THE DESERT (Dialysis Facility, about 4 miles away; INDIO, CA)
COUNTRY VILLA RANCHO MIRAGE HEALTHCARE CTR (Nursing Home, about 9 miles away; RANCHO MIRAGE, CA)
MONTEREY PALMS HEALTHCARE CENTER (Nursing Home, about 10 miles away; PALM DESERT, CA)
CANYON SPRINGS (Hospital, about 13 miles away; CATHEDRAL CITY, CA)
CHARTER BHS OF SO CA PALM SPRINGS (Hospital, about 13 miles away; CATHEDRAL CITY, CA)
CATHEDRAL CITY DIALYSIS (Dialysis Facility, about 15 miles away; CATHEDRAL CITY, CA)
PREMIER CARE CENTER FOR PALM SPRINGS (Nursing Home, about 16 miles away; PALM SPRINGS, CA)
Amtrak stations near La Quinta: 5 miles: INDIO (45995 MONROE ST.) - Bus Station Services: fully wheelchair accessible, public payphones, snack bar, free short-term parking, call for taxi service.
7 miles: PALM DESERT (MONTEREY AVE. & SAN GORGONIO WAY) - Bus Station Services: fully wheelchair accessible, public payphones, snack bar, free short-term parking, call for taxi service, public transit connection.
18 miles: PALM SPRINGS (300 N. INDIAN AVE.) - Bus Station Services: fully wheelchair accessible, public payphones, free short-term parking, call for taxi service, public transit connection.
Colleges/Universities in La Quinta: Milan Institute of Cosmetology-La Quinta Full-time enrollment: 216; Location: 47120 Dune Palms Ste C-2, D and E; Private, for-profit; Website: www.milaninstitute.edu)
Coachella Valley Beauty College Full-time enrollment: 100; Location: 79450 Highway 111; Private, for-profit; Website: www.cvbeautycollege.com/)
Colleges/universities with over 2000 students nearest to La Quinta:
College of the Desert (about 7 miles; Palm Desert, CA ; Full-time enrollment: 5,686)
Mt San Jacinto Community College District (about 40 miles; San Jacinto, CA ; FT enrollment: 8,426)
Crafton Hills College (about 53 miles; Yucaipa, CA ; FT enrollment: 3,222)
Moreno Valley College (about 55 miles; Moreno Valley, CA ; FT enrollment: 4,650)
University of Redlands (about 57 miles; Redlands, CA ; FT enrollment: 4,854)
Loma Linda University (about 62 miles; Loma Linda, CA ; FT enrollment: 2,839)
The Art Institute of California-Argosy University Inland Empire (about 63 miles; San Bernardino, CA ; FT enrollment: 2,238)
Public high schools in La Quinta: LA QUINTA HIGH Students: 2,228, Location: 79-255 W.WARD HO DR., Grades: 9-12)HORIZON Students: 216, Location: 43-330 PALM ROYALE DR., Grades: KG-12)SUMMIT HIGH (CONTINUATION) Students: 95, Location: 43-330 PALM ROYALE DR., Grades: 10-12)Public elementary/middle schools in La Quinta: COLONEL MITCHELL PAIGE MIDDLE Students: 1,250, Location: 43-495 PALM ROYALE DR., Grades: 6-8)LA QUINTA MIDDLE Students: 684, Location: 78-900 AVE. 50, Grades: 6-8)HARRY S. TRUMAN ELEMENTARY Students: 528, Location: 78-870 AVE. 50, Grades: KG-5)BENJAMIN FRANKLIN ELEMENTARY Students: 395, Location: 77-800 CALLE TAMPICO, Grades: KG-5)JOHN ADAMS ELEMENTARY Students: 282, Location: 50-800 DESERT CLUB DR., Grades: KG-5)Private elementary/middle school in La Quinta: LA QUINTA CHRISTIAN FELLOWSHIP Students: 14, Location: 50-800 CALLE PALOMA, Grades: KG-7)
See full list of schools located in La Quinta
Notable locations in La Quinta: (A) , The Pyramids Club (B) , Professional Golfers Association West Golf Course (C) , Palm Royale Country Club (D) , Pete Dye Resort Golf Course (E) , La Quinta Mountain Golf Course (F) , La Quinta Dunes Golf Course (G) , La Quinta Citrus Golf Course (H) , Jack Nicklaus Resort Golf Course (I) , Jack Nicklaus Private Golf Course (J) , Arnold Palmer Golf Course (K) , La Quinta City Hall (L) , La Quinta Branch Riverside City and County Public Library (M) , Riverside County Fire Department Station 93 La Quinta North (N) , Riverside County Fire Department Station 70 La Quinta South (O) , Riverside County Fire Department Station 32 La Quinta (P) . Display/hide their locations on the map
Shopping Center: (1) . Display/hide its location on the map
Reservoir: (A) . Display/hide its location on the map
Creek: (A) . Display/hide its location on the map
Parks in La Quinta include: (1) , Fritz Burns Park (2) , La Quinta Community Park (3) , Lake Cahuilla Park (4) . Display/hide their locations on the map
Riverside County has a predicted average indoor radon screening level between 2 and 4 pCi/L (pico curies per liter) - Moderate Potential Drinking water stations with addresses in La Quinta and their reported violations in the past:
KENNEDY GROCERY (Population served: 450, Groundwater):
Past monitoring violations:
5 routine major monitoring violations
6 minor monitoring violations
Drinking water stations with addresses in La Quinta that have no violations reported:
MADISON CENTER WATER SYSTEM (Population served: 35, Primary Water Source Type: Groundwater)
Average household size: This city:
2.5 peopleCalifornia:
2.9 people
Percentage of family households: This city:
72.3%Whole state:
68.7%
Percentage of households with unmarried partners: This city:
6.5%Whole state:
7.2%
Likely homosexual households (counted as self-reported same-sex unmarried-partner households)
Lesbian couples: 0.6% of all households Gay men: 0.6% of all households
People in group quarters in La Quinta in 2010:
38 people in group homes intended for adults
7 people in nursing facilities/skilled-nursing facilities
7 people in workers' group living quarters and job corps centers
5 people in residential treatment centers for adults
People in group quarters in La Quinta in 2000:
31 people in other group homes
5 people in unknown juvenile institutions
4 people in agriculture workers' dormitories on farms
Banks with most branches in La Quinta (2011 data):
Wells Fargo Bank, National Association: Pavilion At La Quinta Branch at 79-234 Sthy 111, branch established on 2007/01/22; Hwy 111 & Washington St. Branch at 78630 Sthy 111, branch established on 1997/04/18. Info updated 2011/04/05: Bank assets: $1,161,490.0 mil, Deposits: $905,653.0 mil, headquarters in Sioux Falls, SD, positive income , 6395 total offices , Holding Company: Wells Fargo & Company
U.S. Bank National Association: La Quinta Branch at 78435 Highway 111, branch established on 1957/10/16; La Quinta Cove Branch at 50991 Washington Street, branch established on 2011/04/04. Info updated 2012/01/30: Bank assets: $330,470.8 mil, Deposits: $236,091.5 mil, headquarters in Cincinnati, OH, positive income , 3121 total offices , Holding Company: U.S. Bancorp
Bank of Southern California, N.A.: La Quinta Branch at 47-020 Washington, branch established on 2001/11/30. Info updated 2011/09/29: Bank assets: $188.0 mil, Deposits: $162.4 mil, headquarters in San Diego, CA, positive income , Commercial Lending Specialization, 6 total offices
Pacific Western Bank: La Quinta Branch at 78-080 Calle Estado Suite 101, branch established on 2002/02/01. Info updated 2011/03/14: Bank assets: $5,513.1 mil, Deposits: $4,614.5 mil, headquarters in Los Angeles, CA, positive income , Commercial Lending Specialization, 78 total offices , Holding Company: Capgen Capital Group Ii Lp
First Foundation Bank: Desert Office Branch at 78100 Main Street, Suite 202, branch established on 2011/05/02. Info updated 2011/07/21: Bank assets: $548.6 mil, Deposits: $409.9 mil, headquarters in Irvine, CA, positive income , Commercial Lending Specialization, 3 total offices
Rabobank, National Association: La Quinta Branch at 51-290 Avenida Bermudas, branch established on 1987/03/16. Info updated 2011/01/27: Bank assets: $11,745.0 mil, Deposits: $8,446.0 mil, headquarters in Roseville, CA, positive income , Agricultural Specialization, 124 total offices , Holding Company: Cooperatieve Centrale Raiffeisen-Boerenleenbank B.A., "rabobank Nederland
Bank of America, National Association: Point Happy Branch at 78-400 Highway 111, branch established on 2003/10/20. Info updated 2009/11/18: Bank assets: $1,451,969.3 mil, Deposits: $1,077,176.8 mil, headquarters in Charlotte, NC, positive income , 5782 total offices , Holding Company: Bank Of America Corporation
OneWest Bank, FSB: La Quinta Branch at 78010 Main St Ste 100, branch established on 2004/05/17. Info updated 2011/07/21: Bank assets: $26,181.3 mil, Deposits: $15,408.4 mil, headquarters in Pasadena, CA, positive income , 79 total offices
Union Bank, National Association: La Quinta Branch at 79670 Highway 111, branch established on 2008/03/24. Info updated 2011/09/01: Bank assets: $88,967.5 mil, Deposits: $65,286.4 mil, headquarters in San Francisco, CA, positive income , Commercial Lending Specialization, 403 total offices , Holding Company: Mitsubishi Ufj Financial Group, Inc.
3 other banks with 3 local branches
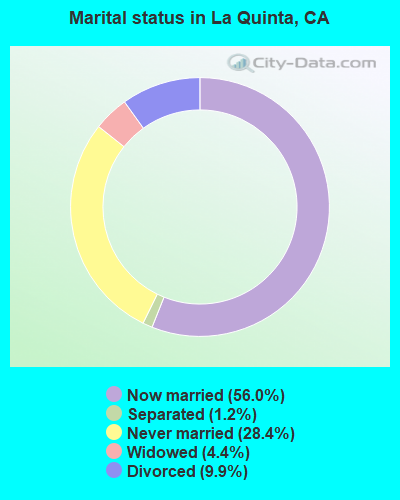
For population 15 years and over in La Quinta:
Never married: 28.4%Now married: 56.0%Separated: 1.2%Widowed: 4.4%Divorced: 9.9% For population 25 years and over in La Quinta:
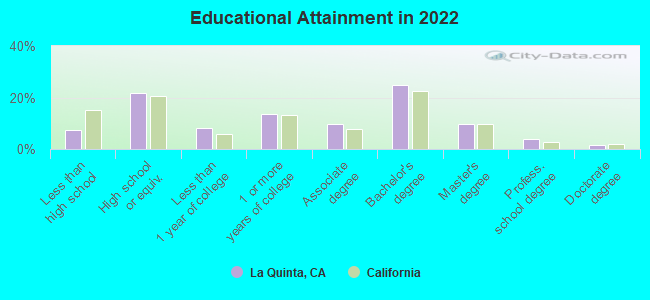
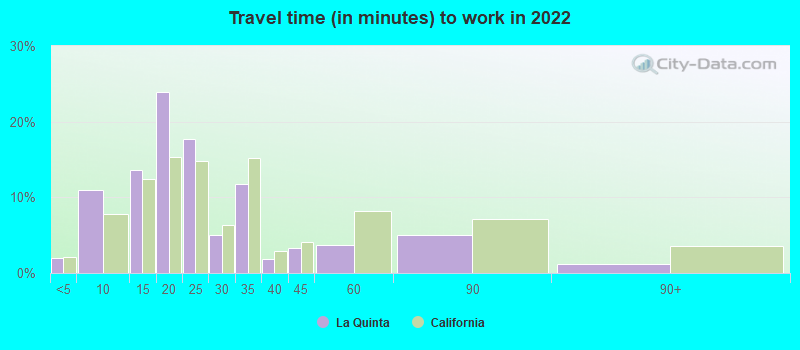
High school or higher: 92.7%Bachelor's degree or higher: 38.4%Graduate or professional degree: 14.1%Unemployed: 5.3%Mean travel time to work (commute): 21.5 minutes
Education Gini index (Inequality in education) Here:
11.1California average:
15.5
Religion statistics for La Quinta, CA (based on Riverside County data)
Religion Adherents Congregations Catholic 602,765 51 Evangelical Protestant 240,306 741 Other 77,581 194 Mainline Protestant 29,535 103 Black Protestant 19,170 40 Orthodox 3,647 11 None 1,216,637 -
Source: Clifford Grammich, Kirk Hadaway, Richard Houseal, Dale E.Jones, Alexei Krindatch, Richie Stanley and Richard H.Taylor. 2012. 2010 U.S.Religion Census: Religious Congregations & Membership Study. Association of Statisticians of American Religious Bodies. Jones, Dale E., et al. 2002. Congregations and Membership in the United States 2000. Nashville, TN: Glenmary Research Center. Graphs represent county-level data
Food Environment Statistics: Number of grocery stores : 330Riverside County :
1.60 / 10,000 pop.California :
2.14 / 10,000 pop.
Number of supercenters and club stores : 11This county :
0.05 / 10,000 pop.California :
0.04 / 10,000 pop.
Number of convenience stores (no gas) : 91Riverside County :
0.44 / 10,000 pop.State :
0.62 / 10,000 pop.
Number of convenience stores (with gas) : 311Riverside County :
1.51 / 10,000 pop.California :
1.49 / 10,000 pop.
Number of full-service restaurants : 1,125Here :
5.45 / 10,000 pop.California :
7.42 / 10,000 pop.
Adult diabetes rate : Riverside County :
7.7%State :
7.3%
Adult obesity rate : Here :
24.5%California :
21.3%
Low-income preschool obesity rate : Riverside County :
15.2%California :
17.9%
Health and Nutrition: Healthy diet rate : La Quinta:
49.7%California:
49.4%
Average overall health of teeth and gums : This city:
48.4%California:
48.0%
People feeling badly about themselves : This city:
20.6%California:
20.2%
People not drinking alcohol at all : La Quinta:
9.8%California:
11.2%
Average hours sleeping at night : La Quinta:
6.8California:
6.8
General health condition : This city:
56.3%California:
56.4%
Average condition of hearing : Here:
78.9%California:
80.9%
More about Health and Nutrition of La Quinta, CA Residents
Local government employment and payroll (March 2022)
Function
Full-time employees
Monthly full-time payroll
Average yearly full-time wage
Part-time employees
Monthly part-time payroll
Other Government Administration
33 $241,989 $87,996 1 $130 Other and Unallocable
15 $89,222 $71,378 2 $1,101 Streets and Highways
11 $66,875 $72,955 0 $0 Housing and Community Development (Local)
9 $61,413 $81,884 0 $0 Parks and Recreation
9 $58,136 $77,515 7 $12,028 Financial Administration
8 $60,256 $90,384 0 $0
Totals for Government
85 $577,890 $81,584 10 $13,259
La Quinta government finances - Expenditure in 2017 (per resident):
Construction - Regular Highways: $5,023,000 ($130.83)
Housing and Community Development: $3,004,000 ($78.25)Libraries: $173,000 ($4.51)Parks and Recreation: $166,000 ($4.32)Current Operations - Police Protection: $14,767,000 ($384.64)
Parks and Recreation: $6,572,000 ($171.18)Local Fire Protection: $5,829,000 ($151.83)Central Staff Services: $5,663,000 ($147.50)Protective Inspection and Regulation - Other: $4,911,000 ($127.92)Regular Highways: $2,890,000 ($75.28)Housing and Community Development: $1,917,000 ($49.93)Health - Other: $1,472,000 ($38.34)Libraries: $1,271,000 ($33.11)General - Interest on Debt: $9,340,000 ($243.28)
Other Capital Outlay - Housing and Community Development: $748,000 ($19.48)
Parks and Recreation: $178,000 ($4.64)General - Other: $45,000 ($1.17)Central Staff Services: $38,000 ($0.99)Local Fire Protection: $29,000 ($0.76)
La Quinta government finances - Revenue in 2017 (per resident):
Charges - Other: $7,744,000 ($201.71)
Parks and Recreation: $3,772,000 ($98.25)Housing and Community Development: $2,993,000 ($77.96)Regular Highways: $954,000 ($24.85)Federal Intergovernmental - General Local Government Support: $1,463,000 ($38.11)
Other: $460,000 ($11.98)Housing and Community Development: $126,000 ($3.28)Local Intergovernmental - Other: $3,271,000 ($85.20)
Miscellaneous - Rents: $1,443,000 ($37.59)
General Revenue - Other: $429,000 ($11.17)Interest Earnings: $399,000 ($10.39)Fines and Forfeits: $348,000 ($9.06)State Intergovernmental - Highways: $763,000 ($19.87)
Other: $700,000 ($18.23)General Local Government Support: $78,000 ($2.03)Tax - Property: $32,524,000 ($847.16)
Other Selective Sales: $9,354,000 ($243.64)General Sales and Gross Receipts: $8,598,000 ($223.95)Public Utilities Sales: $1,726,000 ($44.96)Other License: $1,720,000 ($44.80)Documentary and Stock Transfer: $585,000 ($15.24)Occupation and Business License - Other: $364,000 ($9.48)
La Quinta government finances - Debt in 2017 (per resident):
Long Term Debt - Beginning Outstanding - Unspecified Public Purpose: $215,011,000 ($5600.41)
Outstanding Unspecified Public Purpose: $211,664,000 ($5513.23)Retired Unspecified Public Purpose: $41,138,000 ($1071.53)Issue, Unspecified Public Purpose: $37,791,000 ($984.35)
La Quinta government finances - Cash and Securities in 2017 (per resident):
Bond Funds - Cash and Securities: $5,839,000 ($152.09)
Other Funds - Cash and Securities: $117,547,000 ($3061.76)
Sinking Funds - Cash and Securities: $48,842,000 ($1272.19)
7.19% of this county's 2021 resident taxpayers lived in other counties in 2020 ($71,521 average adjusted gross income )
Here:
7.19%California average:
5.19%
0.03% of residents moved from foreign countries ($210 average AGI )Riverside County:
0.03%California average:
0.03%
Top counties from which taxpayers relocated into this county between 2020 and 2021:
6.28% of this county's 2020 resident taxpayers moved to other counties in 2021 ($64,593 average adjusted gross income )
Here:
6.28%California average:
6.14%
0.02% of residents moved to foreign countries ($200 average AGI )Riverside County:
0.02%California average:
0.02%
Top counties to which taxpayers relocated from this county between 2020 and 2021:
Businesses in La Quinta, CA
Name Count Name Count
99 Cents Only Stores 1 McDonald's 2 AT&T 1 Nissan 1 Ace Hardware 1 Office Depot 1 Applebee's 1 OfficeMax 1 AutoZone 1 Panda Express 1 Baskin-Robbins 1 Panera Bread 1 Bed Bath & Beyond 1 Payless 1 CVS 1 PetSmart 1 Carl\s Jr. 1 Pizza Hut 1 Chevrolet 1 Quiznos 1 Chipotle 1 RadioShack 1 Circle K 2 Red Robin 1 Cold Stone Creamery 1 Safeway 1 Costco 1 Sprint Nextel 1 DHL 1 Staples 1 Domino's Pizza 1 Starbucks 4 Famous Footwear 1 Subway 2 Fashion Bug 1 T-Mobile 4 FedEx 6 Taco Bell 1 GameStop 1 Target 1 Goodwill 2 Trader Joe's 1 H&R Block 1 U-Haul 1 Home Depot 1 UPS 5 IHOP 1 Verizon Wireless 1 Jones New York 3 Vons 1 Kohl's 1 Walgreens 1 Kroger 1 Walmart 1 Lowe's 1 Wendy's 1 Marshalls 1 World Gym 1 MasterBrand Cabinets 1
Strongest AM radio stations in La Quinta:
KNWZ (970 AM; 5 kW; COACHELLA, CA; Owner: MCC RADIO, LLC)
KESQ (1400 AM; 1 kW; INDIO, CA; Owner: GULF-CALIFORNIA BROADCAST CO.)
KNWQ (1140 AM; 10 kW; PALM SPRINGS, CA; Owner: MCC RADIO, LLC)
KCMJ (1270 AM; 5 kW; THOUSAND PALMS, CA; Owner: MCC RADIO, LLC)
KPSI (920 AM; 5 kW; PALM SPRINGS, CA; Owner: R & R RADIO CORPORATION)
KXPS (1010 AM; 4 kW; THOUSAND PALMS, CA; Owner: MCC RADIO, LLC)
KFMB (760 AM; 50 kW; SAN DIEGO, CA; Owner: MIDWEST TELEVISION, INC.)
KPLS (830 AM; 50 kW; ORANGE, CA; Owner: CRN LICENSES, LLC)
KCBQ (1170 AM; 50 kW; SAN DIEGO, CA; Owner: RADIO 1210, INC.)
KLAC (570 AM; 50 kW; LOS ANGELES, CA; Owner: AMFM RADIO LICENSES, L.L.C.)
KFI (640 AM; 50 kW; LOS ANGELES, CA; Owner: CAPSTAR TX LIMITED PARTNERSHIP)
KTNQ (1020 AM; 50 kW; LOS ANGELES, CA; Owner: KTNQ-AM LICENSE CORP.)
KWXY (1340 AM; 1 kW; CATHEDRAL CITY, CA; Owner: GLEN BARNETT, INC.)
Strongest FM radio stations in La Quinta:
KCLB-FM (93.7 FM; COACHELLA, CA; Owner: MCC RADIO, LLC)
KCRI (89.3 FM; INDIO, CA; Owner: SANTA MONICA COMMUNITY COLLEGE DIST.)
KJJZ (102.3 FM; INDIO, CA; Owner: R M BROADCASTING L.L.C.)
KUNA-FM (96.7 FM; LA QUINTA, CA; Owner: GULF-CALIFORNIA BROADCAST COMPANY)
KATY-FM (101.3 FM; IDYLLWILD, CA; Owner: ALL PRO BROADCASTING, INC.)
KLRD (90.1 FM; YUCAIPA, CA; Owner: EDUCATIONAL MEDIA FOUNDATION)
KKUU (92.7 FM; INDIO, CA; Owner: MCC RADIO, LLC)
K201AR (88.1 FM; BANNING, CA; Owner: KSGN, INC.)
K232CX (94.3 FM; DESERT HOT SPRINGS, CA; Owner: MCC RADIO, LLC)
KPSC (88.5 FM; PALM SPRINGS, CA; Owner: UNIVERSITY OF SOUTHERN CALIFORNIA)
KLOB (94.7 FM; THOUSAND PALMS, CA; Owner: ENTRAVISION HOLDINGS, LLC)
KRTM (88.9 FM; TEMECULA, CA; Owner: PENFOLD COMMUNICATIONS, INC.)
KLVJ (100.1 FM; JULIAN, CA; Owner: EDUCATIONAL MEDIA FOUNDATION)
K280CV (103.9 FM; CATHEDRAL CITY, CA; Owner: MCC RADIO, LLC)
KYOR (106.9 FM; YUCCA VALLEY, CA; Owner: MCC RADIO, LLC)
KEZN (103.1 FM; PALM DESERT, CA; Owner: INFINITY RADIO SUBSIDIARY OPERATIONS INC.)
KRCK-FM (97.7 FM; MECCA, CA; Owner: PLAYA DEL SOL BROADCASTERS)
KHCS (91.7 FM; PALM DESERT, CA; Owner: PRAIRIE AVENUE GOSPEL CENTER)
KMRJ (99.5 FM; RANCHO MIRAGE, CA; Owner: DANIEL P. MITCHELL)
KDES-FM (104.7 FM; PALM SPRINGS, CA; Owner: R & R RADIO CORPORATION)
TV broadcast stations around La Quinta:
KESQ-TV (Channel 42; PALM SPRINGS, CA; Owner: GULF-CALIFORNIA BROADCAST COMPANY)
K19DH (Channel 19; INDIO, CA; Owner: DESERT BROADCASTING, INC.)
KYAV-LP (Channel 12; PALM SPRINGS, CA; Owner: JDF INVESTMENT CO. LLC)
KVPS-LP (Channel 8; INDIO, CA; Owner: VALCOM BROADCASTING LLC)
KEVC-CA (Channel 5; INDIO, CA; Owner: ENTRAVISION HOLDINGS, LLC)
KMIR-TV (Channel 36; PALM SPRINGS, CA; Owner: JOURNAL BROADCAST CORPORATION)
K06MB (Channel 6; INDIO, CA; Owner: PARK PLACE BROADCASTING COMPANY)
KVER-CA (Channel 4; INDIO, CA; Owner: ENTRAVISION HOLDINGS, LLC)
KODG-LP (Channel 17; PALM SPRINGS, CA; Owner: BILTMORE BROADCASTING CORPORATION)
National Bridge Inventory (NBI) Statistics 8 Number of bridges180ft / 54.6m Total length143,389 Total average daily traffic1,431 Total average daily truck traffic127,668 Total future (year 2037) average daily traffic
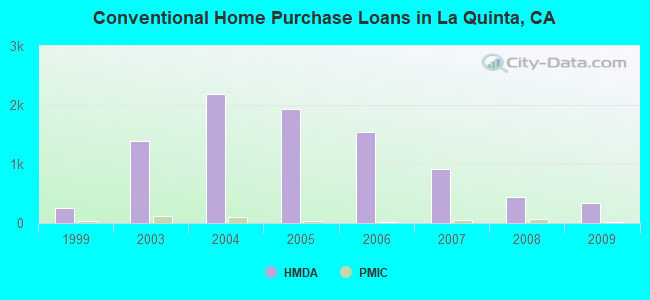
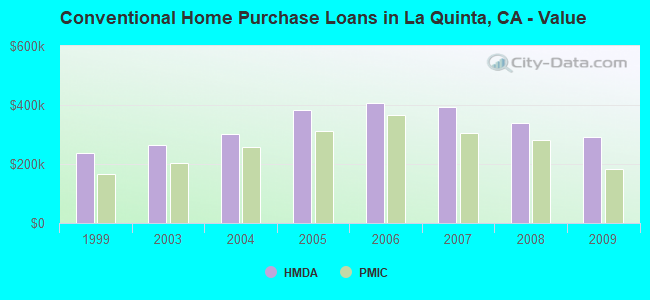
Home Mortgage Disclosure Act Aggregated Statistics For Year 2009(Based on 3 full and 3 partial tracts) A) FHA, FSA/RHS & VA B) Conventional C) Refinancings D) Home Improvement Loans E) Loans on Dwellings For 5+ Families F) Non-occupant Loans on G) Loans On Manufactured Number Average Value Number Average Value Number Average Value Number Average Value Number Average Value Number Average Value Number Average Value
LOANS ORIGINATED 143 $197,199 339 $291,353 679 $325,520 17 $208,632 0 $0 405 $349,493 0 $0 APPLICATIONS APPROVED, NOT ACCEPTED 12 $193,843 30 $300,747 79 $318,538 5 $117,080 1 $16,400,000 45 $334,897 0 $0 APPLICATIONS DENIED 30 $214,639 70 $315,397 359 $355,418 19 $144,416 0 $0 142 $381,591 1 $92,640 APPLICATIONS WITHDRAWN 22 $210,995 54 $327,219 185 $356,012 7 $148,839 1 $988,000 82 $426,425 0 $0 FILES CLOSED FOR INCOMPLETENESS 2 $191,890 10 $240,563 52 $304,133 2 $253,515 0 $0 20 $268,354 0 $0
Aggregated Statistics For Year 2008(Based on 3 full and 3 partial tracts) A) FHA, FSA/RHS & VA B) Conventional C) Refinancings D) Home Improvement Loans F) Non-occupant Loans on G) Loans On Manufactured Number Average Value Number Average Value Number Average Value Number Average Value Number Average Value Number Average Value
LOANS ORIGINATED 89 $216,565 438 $339,651 476 $340,048 28 $143,979 362 $385,858 0 $0 APPLICATIONS APPROVED, NOT ACCEPTED 4 $258,835 76 $464,122 100 $379,552 13 $85,796 62 $400,280 5 $81,942 APPLICATIONS DENIED 17 $253,731 101 $438,483 347 $331,119 58 $159,393 98 $354,757 2 $95,430 APPLICATIONS WITHDRAWN 18 $233,288 60 $384,121 136 $369,257 16 $271,881 60 $344,357 0 $0 FILES CLOSED FOR INCOMPLETENESS 2 $226,500 11 $399,625 56 $325,319 5 $556,794 16 $475,919 0 $0
Aggregated Statistics For Year 2007(Based on 3 full and 3 partial tracts) A) FHA, FSA/RHS & VA B) Conventional C) Refinancings D) Home Improvement Loans E) Loans on Dwellings For 5+ Families F) Non-occupant Loans on G) Loans On Manufactured Number Average Value Number Average Value Number Average Value Number Average Value Number Average Value Number Average Value Number Average Value
LOANS ORIGINATED 9 $229,991 915 $393,397 1,058 $380,731 103 $247,347 2 $12,664,080 611 $477,338 2 $89,740 APPLICATIONS APPROVED, NOT ACCEPTED 0 $0 168 $394,575 299 $355,026 26 $153,091 0 $0 107 $389,674 2 $81,155 APPLICATIONS DENIED 1 $297,000 259 $392,376 669 $369,996 105 $190,380 0 $0 181 $435,945 3 $85,623 APPLICATIONS WITHDRAWN 3 $308,537 144 $375,282 300 $363,652 35 $170,773 0 $0 78 $427,310 0 $0 FILES CLOSED FOR INCOMPLETENESS 1 $237,000 29 $420,167 109 $302,120 9 $191,922 0 $0 19 $360,989 0 $0
Aggregated Statistics For Year 2006(Based on 3 full and 3 partial tracts) A) FHA, FSA/RHS & VA B) Conventional C) Refinancings D) Home Improvement Loans F) Non-occupant Loans on G) Loans On Manufactured Number Average Value Number Average Value Number Average Value Number Average Value Number Average Value Number Average Value
LOANS ORIGINATED 6 $251,640 1,536 $406,926 1,470 $344,266 187 $224,811 821 $459,003 1 $128,430 APPLICATIONS APPROVED, NOT ACCEPTED 0 $0 244 $371,948 262 $315,484 35 $149,908 114 $417,526 4 $45,790 APPLICATIONS DENIED 0 $0 443 $405,217 733 $344,261 125 $160,941 198 $475,879 4 $167,880 APPLICATIONS WITHDRAWN 1 $320,620 276 $384,843 488 $320,849 50 $168,749 127 $434,664 0 $0 FILES CLOSED FOR INCOMPLETENESS 0 $0 49 $334,172 133 $317,981 8 $124,438 22 $398,654 0 $0
Aggregated Statistics For Year 2005(Based on 3 full and 3 partial tracts) A) FHA, FSA/RHS & VA B) Conventional C) Refinancings D) Home Improvement Loans E) Loans on Dwellings For 5+ Families F) Non-occupant Loans on G) Loans On Manufactured Number Average Value Number Average Value Number Average Value Number Average Value Number Average Value Number Average Value Number Average Value
LOANS ORIGINATED 2 $189,735 1,936 $384,489 1,872 $313,732 210 $205,349 2 $12,407,615 1,040 $400,165 1 $305,840 APPLICATIONS APPROVED, NOT ACCEPTED 0 $0 240 $354,679 260 $300,506 35 $180,313 0 $0 102 $380,566 8 $70,938 APPLICATIONS DENIED 1 $297,000 391 $359,629 596 $316,648 124 $134,387 2 $680,000 160 $376,052 10 $145,297 APPLICATIONS WITHDRAWN 1 $222,000 356 $371,136 485 $273,422 59 $175,396 0 $0 131 $443,007 4 $137,232 FILES CLOSED FOR INCOMPLETENESS 0 $0 67 $375,499 184 $288,531 13 $188,698 0 $0 32 $363,421 0 $0
Aggregated Statistics For Year 2004(Based on 3 full and 3 partial tracts) A) FHA, FSA/RHS & VA B) Conventional C) Refinancings D) Home Improvement Loans E) Loans on Dwellings For 5+ Families F) Non-occupant Loans on G) Loans On Manufactured Number Average Value Number Average Value Number Average Value Number Average Value Number Average Value Number Average Value Number Average Value
LOANS ORIGINATED 12 $211,732 2,178 $302,871 1,973 $261,582 182 $148,164 2 $1,272,830 1,192 $312,784 4 $145,500 APPLICATIONS APPROVED, NOT ACCEPTED 1 $57,180 250 $283,926 329 $226,814 35 $134,719 0 $0 138 $290,554 1 $44,200 APPLICATIONS DENIED 3 $198,153 373 $284,099 597 $233,781 109 $108,722 0 $0 180 $303,773 6 $81,567 APPLICATIONS WITHDRAWN 3 $202,020 304 $316,763 514 $233,340 46 $98,124 0 $0 145 $323,166 3 $204,843 FILES CLOSED FOR INCOMPLETENESS 0 $0 45 $299,412 174 $206,995 24 $89,284 0 $0 23 $284,593 0 $0
Aggregated Statistics For Year 2003(Based on 3 full and 3 partial tracts) A) FHA, FSA/RHS & VA B) Conventional C) Refinancings D) Home Improvement Loans F) Non-occupant Loans on Number Average Value Number Average Value Number Average Value Number Average Value Number Average Value
LOANS ORIGINATED 53 $144,077 1,383 $262,739 2,987 $224,858 52 $55,695 1,037 $293,979 APPLICATIONS APPROVED, NOT ACCEPTED 6 $160,700 133 $260,690 438 $201,750 20 $94,089 109 $306,877 APPLICATIONS DENIED 12 $142,603 176 $216,108 685 $188,683 52 $38,005 125 $276,971 APPLICATIONS WITHDRAWN 6 $180,605 133 $290,280 586 $185,799 18 $95,859 99 $291,649 FILES CLOSED FOR INCOMPLETENESS 2 $146,500 28 $184,208 120 $369,638 7 $33,804 26 $999,194
Aggregated Statistics For Year 1999(Based on 2 partial tracts) A) FHA, FSA/RHS & VA B) Conventional C) Refinancings D) Home Improvement Loans F) Non-occupant Loans on Number Average Value Number Average Value Number Average Value Number Average Value Number Average Value
LOANS ORIGINATED 47 $109,166 250 $238,806 141 $231,205 24 $78,215 105 $282,822 APPLICATIONS APPROVED, NOT ACCEPTED 2 $69,630 24 $248,006 30 $219,734 7 $28,229 15 $255,607 APPLICATIONS DENIED 3 $101,983 34 $202,359 64 $175,275 11 $41,135 14 $353,390 APPLICATIONS WITHDRAWN 5 $119,318 33 $211,784 41 $167,112 2 $96,830 10 $322,327 FILES CLOSED FOR INCOMPLETENESS 1 $104,600 6 $218,858 13 $250,272 1 $63,760 3 $247,003
Detailed HMDA statistics for the following Tracts:
0451.09
, 0451.10 , 0451.11 , 0451.13 , 0452.05 , 0456.03
Private Mortgage Insurance Companies Aggregated Statistics For Year 2009(Based on 3 full and 3 partial tracts) A) Conventional B) Refinancings C) Non-occupant Loans on Number Average Value Number Average Value Number Average Value
LOANS ORIGINATED 15 $182,083 2 $367,715 3 $209,567 APPLICATIONS APPROVED, NOT ACCEPTED 5 $248,704 3 $362,100 2 $166,995 APPLICATIONS DENIED 4 $243,082 0 $0 1 $166,730 APPLICATIONS WITHDRAWN 0 $0 1 $169,940 0 $0 FILES CLOSED FOR INCOMPLETENESS 3 $263,403 0 $0 1 $347,760
Aggregated Statistics For Year 2008(Based on 3 full and 3 partial tracts) A) Conventional B) Refinancings C) Non-occupant Loans on Number Average Value Number Average Value Number Average Value
LOANS ORIGINATED 62 $282,765 15 $300,173 15 $286,920 APPLICATIONS APPROVED, NOT ACCEPTED 18 $308,709 22 $322,885 8 $370,492 APPLICATIONS DENIED 6 $276,048 4 $305,290 4 $321,882 APPLICATIONS WITHDRAWN 5 $290,812 1 $343,620 1 $231,930 FILES CLOSED FOR INCOMPLETENESS 2 $252,750 1 $142,680 1 $142,680
Aggregated Statistics For Year 2007(Based on 3 full and 3 partial tracts) A) Conventional B) Refinancings C) Non-occupant Loans on Number Average Value Number Average Value Number Average Value
LOANS ORIGINATED 50 $306,355 34 $355,452 17 $336,978 APPLICATIONS APPROVED, NOT ACCEPTED 4 $285,410 9 $376,703 1 $264,000 APPLICATIONS DENIED 10 $575,600 3 $333,087 7 $551,000 APPLICATIONS WITHDRAWN 1 $212,690 7 $430,103 0 $0 FILES CLOSED FOR INCOMPLETENESS 0 $0 0 $0 0 $0
Aggregated Statistics For Year 2006(Based on 3 full and 3 partial tracts) A) Conventional B) Refinancings C) Non-occupant Loans on Number Average Value Number Average Value Number Average Value
LOANS ORIGINATED 18 $366,156 15 $347,589 6 $314,013 APPLICATIONS APPROVED, NOT ACCEPTED 4 $394,522 5 $348,618 1 $468,350 APPLICATIONS DENIED 0 $0 1 $1,332,000 0 $0 APPLICATIONS WITHDRAWN 2 $435,045 0 $0 1 $229,260 FILES CLOSED FOR INCOMPLETENESS 0 $0 0 $0 0 $0
Aggregated Statistics For Year 2005(Based on 3 full and 3 partial tracts) A) Conventional B) Refinancings C) Non-occupant Loans on Number Average Value Number Average Value Number Average Value
LOANS ORIGINATED 34 $312,538 20 $323,286 12 $296,068 APPLICATIONS APPROVED, NOT ACCEPTED 5 $289,522 6 $271,895 2 $242,870 APPLICATIONS DENIED 2 $251,465 0 $0 1 $176,000 APPLICATIONS WITHDRAWN 0 $0 2 $387,960 0 $0 FILES CLOSED FOR INCOMPLETENESS 0 $0 2 $228,560 0 $0
Aggregated Statistics For Year 2004(Based on 3 full and 3 partial tracts) A) Conventional B) Refinancings C) Non-occupant Loans on Number Average Value Number Average Value Number Average Value
LOANS ORIGINATED 102 $258,809 28 $230,340 43 $242,297 APPLICATIONS APPROVED, NOT ACCEPTED 28 $230,748 12 $263,232 11 $250,118 APPLICATIONS DENIED 0 $0 0 $0 0 $0 APPLICATIONS WITHDRAWN 3 $332,540 4 $219,768 0 $0 FILES CLOSED FOR INCOMPLETENESS 3 $405,333 2 $152,525 3 $405,333
Aggregated Statistics For Year 2003(Based on 3 full and 3 partial tracts) A) Conventional B) Refinancings C) Non-occupant Loans on Number Average Value Number Average Value Number Average Value
LOANS ORIGINATED 116 $204,462 82 $192,304 39 $205,419 APPLICATIONS APPROVED, NOT ACCEPTED 19 $194,774 31 $195,975 9 $183,581 APPLICATIONS DENIED 3 $161,647 2 $170,395 2 $157,500 APPLICATIONS WITHDRAWN 6 $212,633 4 $206,560 3 $236,377 FILES CLOSED FOR INCOMPLETENESS 1 $169,940 1 $112,220 0 $0
Aggregated Statistics For Year 1999(Based on 2 partial tracts) A) Conventional B) Refinancings C) Non-occupant Loans on Number Average Value Number Average Value Number Average Value
LOANS ORIGINATED 27 $166,174 4 $125,438 5 $212,794 APPLICATIONS APPROVED, NOT ACCEPTED 2 $186,695 2 $109,670 1 $91,250 APPLICATIONS DENIED 1 $147,880 0 $0 0 $0 APPLICATIONS WITHDRAWN 1 $136,000 0 $0 0 $0 FILES CLOSED FOR INCOMPLETENESS 0 $0 0 $0 0 $0
Detailed PMIC statistics for the following Tracts:
0451.09
, 0451.10 , 0451.11 , 0451.13 , 0452.05 , 0456.03 Fire-safe hotels and motels in La Quinta, California:
Embassy Suites La Quinta Hotel & Spa, 50-777 Santa Rosa Plz, La Quinta, California 92253 Phone: (760) 777-1711, Fax: (760) 777-9749
Homewood Suites By Hilton - La Quinta, 45200 Washington St, La Quinta, California 92253 Phone: (760) 391-4600, Fax: (760) 391-4601
All 2 fire-safe hotels and motels in La Quinta, California
Most common first names in La Quinta, CA among deceased individuals Name Count Lived (average)
William 67 75.7 years Robert 63 73.6 years John 58 74.7 years Mary 51 81.7 years James 50 74.3 years Charles 32 75.0 years Richard 31 75.0 years George 28 77.9 years Joseph 26 76.9 years Edward 26 75.3 years
Most common last names in La Quinta, CA among deceased individuals Last name Count Lived (average)
Miller 19 76.1 years Brown 17 77.6 years Smith 14 80.3 years Martin 11 75.5 years Anderson 10 81.7 years Johnson 10 73.3 years Scott 10 79.7 years Cook 10 82.5 years Williams 9 76.1 years Jones 9 78.0 years
La Quinta compared to California state average:
Unemployed percentage significantly below state average. Black race population percentage below state average. Median age significantly above state average. Renting percentage below state average. Length of stay since moving in above state average. House age significantly below state average. Percentage of population with a bachelor's degree or higher above state average.
#66 on the list of "Top 101 cities with largest percentage of females in industries: construction (population 5,000+)"
#84 on the list of "Top 101 cities with the most local government spending on highway construction per resident (population 10,000+)"
#85 on the list of "Top 101 cities with the most residents born in Armenia (population 500+)"
#3 on the list of "Top 101 counties with the highest lead air pollution readings in 2012 (µg/m3 )"
#4 on the list of "Top 101 counties with the highest ground withdrawal of fresh water for public supply"
#11 on the list of "Top 101 counties with the most Catholic adherents"
#11 on the list of "Top 101 counties with the highest total withdrawal of fresh water for public supply"
#12 on the list of "Top 101 counties with the highest carbon monoxide air pollution readings in 2012 (ppm)"
Top Patent Applicants
Robert Demars (10)
Robert Radi (9)
Nils Forsblom (8)
Terry D. Harper (4)
Vaughn E. Ostland (4)
Debra Galeazzi (3)
Steve C. White (3)
James G. Maclean (3)
George Furmanski (3)
Julius G. Hammerslag (3)
Total of 107 patent applications in 2008-2024.
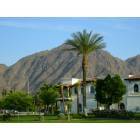
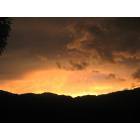
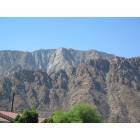
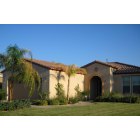
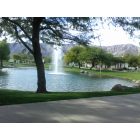
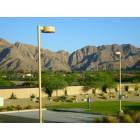
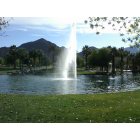
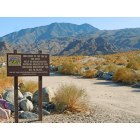
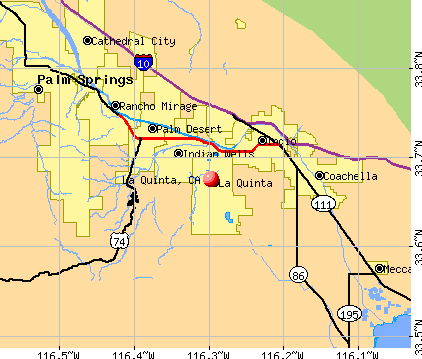


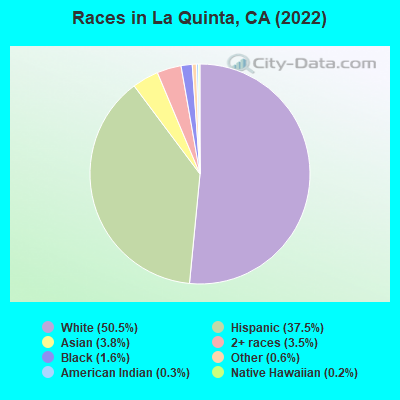
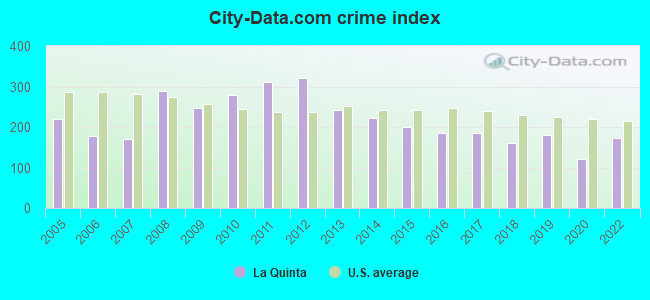
 Recent articles from our blog. Our writers, many of them Ph.D. graduates or candidates, create easy-to-read articles on a wide variety of topics.

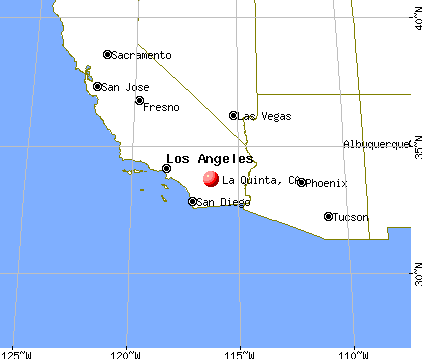
 (8.2 miles