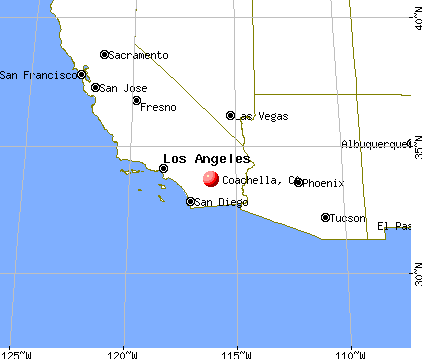
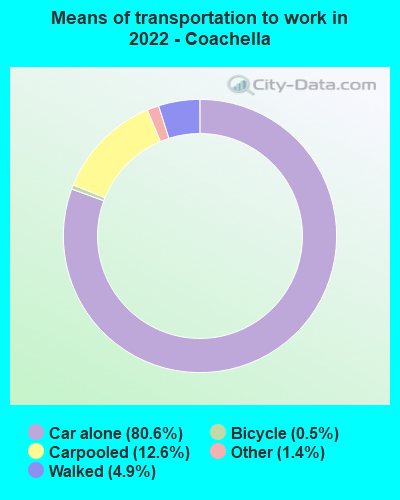
Coachella, California
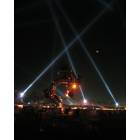
Coachella: Coachella 2008
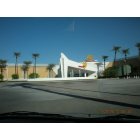
Coachella: Spotlight 29 Casino
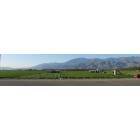
Coachella: Lettuce Fields
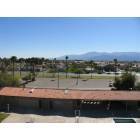
Coachella: Bagdouma Park
Coachella: Date Palm Tree, Coachella, CA
- add
your
Submit your own pictures of this city and show them to the world
- OSM Map
- General Map
- Google Map
- MSN Map
Population change since 2000: +88.5%
| Males: 21,730 | |
| Females: 21,105 |
| Median resident age: | 35.4 years |
| California median age: | 37.9 years |
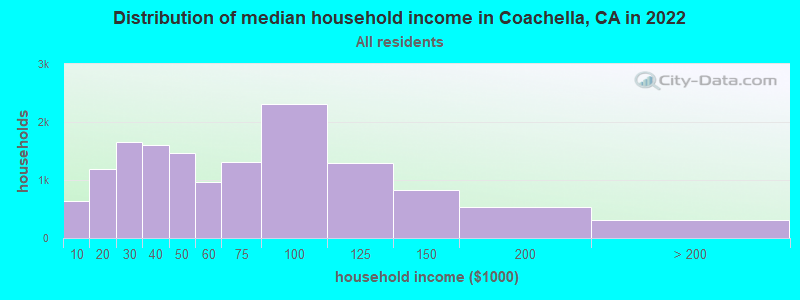
| Coachella: | $53,859 |
| CA: | $91,551 |
Estimated per capita income in 2022: $24,038 (it was $7,416 in 2000)
Coachella city income, earnings, and wages data
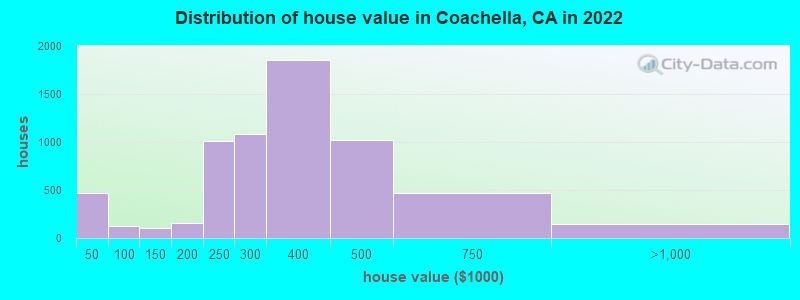
Estimated median house or condo value in 2022: $361,508 (it was $82,600 in 2000)
| Coachella: | $361,508 |
| CA: | $715,900 |
Mean prices in 2022: all housing units: $586,167; detached houses: $631,165; townhouses or other attached units: $625,082; in 2-unit structures: $464,831; in 3-to-4-unit structures: $482,529; in 5-or-more-unit structures: $526,423; mobile homes: $178,284; occupied boats, rvs, vans, etc.: $86,227
Median gross rent in 2022: $1,012.
(15.4% for White Non-Hispanic residents, 11.2% for Hispanic or Latino residents, 0.9% for American Indian residents, 12.5% for other race residents, 9.2% for two or more races residents)
Detailed information about poverty and poor residents in Coachella, CA

Compare current foreclosures near Coachella, CA:
| Photo | Address | Area | Beds / Baths | Price | Details |
|---|---|---|---|---|---|

|
#1
Tripoli Way
Coachella, CA 92236
|
1,072 sq. feet
|
1 baths 3 beds |
$39,092
|
show details |

|
#2
Chiapas Dr
Coachella, CA 92236
|
1,363 sq. feet
|
2 baths 4 beds |
show details | |

|
#3
Corte Cindarella
Coachella, CA 92236
|
1,259 sq. feet
|
2 baths 3 beds |
show details | |

|
#4
Calle Diego
Coachella, CA 92236
|
2,350 sq. feet
|
2 baths 3 beds |
show details | |

|
#5
San Capistrano Dr
Coachella, CA 92236
|
2,653 sq. feet
|
4 baths 6 beds |
show details | |

|
#6
Calle Bonita
Coachella, CA 92236
|
1,388 sq. feet
|
2 baths 4 beds |
show details | |

|
#7
Magnolia St
Coachella, CA 92236
|
1,428 sq. feet
|
2 baths 4 beds |
show details | |

|
#8
Tyler St
Coachella, CA 92236
|
1,516 sq. feet
|
1 baths 3 beds |
show details | |

|
#9
Tyler St Spc 60
Coachella, CA 92236
|
924 sq. feet
|
1 baths 3 beds |
show details | |

|
#10
Glendora Ridge Ave
Coachella, CA 92236
|
2,940 sq. feet
|
3 baths 5 beds |
show details |
| Photo | Address | Area | Beds / Baths | Price | Details |
|---|---|---|---|---|---|

|
#11
Valencia Ln
Coachella, CA 92236
|
1,100 sq. feet
|
2 baths 3 beds |
show details | |

|
#12
Sundown Ln
Coachella, CA 92236
|
1,242 sq. feet
|
2 baths 3 beds |
show details | |

|
#13
Coxcomb Dr
Coachella, CA 92236
|
1,908 sq. feet
|
2 baths 4 beds |
show details | |

|
#14
Tijsseling Ct Apt D
Coachella, CA 92236
|
- sq. feet
|
- baths - beds |
show details | |

|
#15
Laguna Ln
Coachella, CA 92236
|
- sq. feet
|
- baths - beds |
show details | |

|
#16
Camino Rosario
Coachella, CA 92236
|
- sq. feet
|
- baths - beds |
show details | |

|
#17
Calle Florena
Coachella, CA 92236
|
- sq. feet
|
- baths - beds |
show details | |

|
#18
Calle Balderas
Coachella, CA 92236
|
- sq. feet
|
- baths - beds |
show details | |

|
#19
Avenida Yucateco
Coachella, CA 92236
|
- sq. feet
|
- baths - beds |
show details | |

|
#20
Leslie Ave
Palm Desert, CA 92260
|
1,592 sq. feet
|
3 baths 3 beds |
$355,000
|
show details |
| Photo | Address | Area | Beds / Baths | Price | Details |
|---|---|---|---|---|---|

|
#21
Avenue 50 # 50
Coachella, CA 92236
|
- sq. feet
|
- baths - beds |
show details | |

|
#22
Saint Andrews Dr
Thousand Palms, CA 92276
|
636 sq. feet
|
1 baths 2 beds |
$8,511
|
show details |

|
#23
Colonial Dr
Thousand Palms, CA 92276
|
800 sq. feet
|
1 baths 2 beds |
$13,249
|
show details |

|
#24
Desert Falls Dr E
Palm Desert, CA 92211
|
1,814 sq. feet
|
2 baths 2 beds |
show details | |

|
#25
Aurora Ave
Indio, CA 92201
|
8,450 sq. feet
|
3 baths 4 beds |
show details | |

|
#26
Buena Cir
Palm Desert, CA 92260
|
886 sq. feet
|
1 baths 2 beds |
show details | |

|
#27
Amir Dr
Palm Desert, CA 92260
|
- sq. feet
|
3 baths 3 beds |
show details | |

|
#28
Apache St
Indio, CA 92203
|
936 sq. feet
|
1 baths 3 beds |
show details | |

|
#29
Palo Verde St
Indio, CA 92201
|
1,026 sq. feet
|
2 baths 3 beds |
show details | |

|
#30
Stillwater Dr
La Quinta, CA 92253
|
3,589 sq. feet
|
7 baths 5 beds |
show details |
| Photo | Address | Area | Beds / Baths | Price | Details |
|---|---|---|---|---|---|

|
#31
Rockwell Cir
Palm Desert, CA 92211
|
1,160 sq. feet
|
2 baths 2 beds |
show details | |

|
#32
Terraza Dr
Palm Desert, CA 92260
|
2,718 sq. feet
|
4 baths 4 beds |
show details | |

|
#33
Helen Moody Ln
Palm Desert, CA 92260
|
1,170 sq. feet
|
2 baths 3 beds |
show details | |

|
#34
Capri St
Rancho Mirage, CA 92270
|
1,640 sq. feet
|
2 baths 2 beds |
show details | |

|
#35
Santa Rosa Way
Palm Desert, CA 92260
|
1,330 sq. feet
|
2 baths 3 beds |
show details | |

|
#36
Lupine Ln Unit 15
Palm Desert, CA 92260
|
1,420 sq. feet
|
3 baths 2 beds |
show details | |

|
#37
Portola Ave Spc 135
Palm Desert, CA 92260
|
528 sq. feet
|
1 baths 1 beds |
show details | |

|
#38
Avenida Solana
Palm Desert, CA 92260
|
2,515 sq. feet
|
4 baths 3 beds |
show details | |

|
#39
Portola Ave
Palm Desert, CA 92260
|
1,629 sq. feet
|
2 baths 3 beds |
show details | |

|
#40
Paseo Bravo
Palm Desert, CA 92211
|
1,465 sq. feet
|
3 baths 2 beds |
show details |
| Photo | Address | Area | Beds / Baths | Price | Details |
|---|---|---|---|---|---|

|
#41
Torremolinos Dr
Rancho Mirage, CA 92270
|
1,270 sq. feet
|
2 baths 2 beds |
show details | |

|
#42
Mottle Cir
Rancho Mirage, CA 92270
|
1,850 sq. feet
|
3 baths 4 beds |
show details | |

|
#43
Virginia Ave
Palm Desert, CA 92211
|
1,400 sq. feet
|
2 baths 4 beds |
show details | |

|
#44
Cascada Ct
Palm Desert, CA 92211
|
2,688 sq. feet
|
3 baths 4 beds |
show details | |

|
#45
Crystal Falls Rd
Palm Desert, CA 92211
|
1,836 sq. feet
|
2 baths 2 beds |
show details | |

|
#46
Sand Rock Rd
Thousand Palms, CA 92276
|
2,015 sq. feet
|
2 baths 2 beds |
show details | |

|
#47
Tennessee Ave
Palm Desert, CA 92211
|
1,400 sq. feet
|
2 baths 3 beds |
show details | |

|
#48
Barington Dr
Palm Desert, CA 92211
|
2,660 sq. feet
|
3 baths 4 beds |
show details | |

|
#49
Florida Ave
Palm Desert, CA 92211
|
1,380 sq. feet
|
3 baths 2 beds |
show details | |

|
Check over 1 million property listings on Foreclosure.com!
|
browse all offers | |||


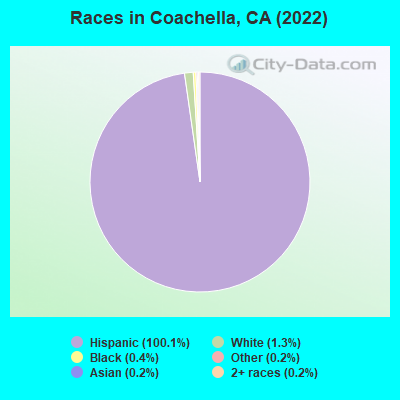
- 43,103100.1%Hispanic
- 5601.3%White alone
- 1720.4%Black alone
- 830.2%Asian alone
- 980.2%Other race alone
- 670.2%Two or more races
- 190.04%American Indian alone
- 120.03%Native Hawaiian and Other
Pacific Islander alone
According to our research of California and other state lists, there were 40 registered sex offenders living in Coachella, California as of April 27, 2024.
The ratio of all residents to sex offenders in Coachella is 1,126 to 1.
The ratio of registered sex offenders to all residents in this city is lower than the state average.
Type |
2009 |
2010 |
2011 |
2012 |
2013 |
2014 |
2015 |
2016 |
2017 |
2018 |
2019 |
2020 |
2022 |
|---|---|---|---|---|---|---|---|---|---|---|---|---|---|
| Murders (per 100,000) | 4 (9.6) | 2 (4.9) | 1 (2.4) | 5 (11.9) | 2 (4.6) | 5 (11.5) | 3 (6.7) | 2 (4.4) | 0 (0.0) | 1 (2.2) | 0 (0.0) | 2 (4.3) | 9 (20.9) |
| Rapes (per 100,000) | 9 (21.5) | 3 (7.4) | 5 (12.1) | 9 (21.4) | 2 (4.6) | 3 (6.9) | 3 (6.7) | 9 (19.8) | 3 (6.6) | 5 (10.8) | 9 (19.4) | 6 (13.0) | 1 (2.3) |
| Robberies (per 100,000) | 64 (152.9) | 74 (181.8) | 76 (184.5) | 67 (159.4) | 56 (129.2) | 51 (116.9) | 51 (113.5) | 62 (136.6) | 41 (89.8) | 40 (86.7) | 43 (92.5) | 39 (84.2) | 36 (83.6) |
| Assaults (per 100,000) | 178 (425.2) | 114 (280.1) | 194 (471.1) | 184 (437.7) | 58 (133.9) | 107 (245.2) | 96 (213.6) | 88 (193.8) | 84 (184.0) | 58 (125.8) | 74 (159.2) | 92 (198.7) | 108 (250.8) |
| Burglaries (per 100,000) | 479 (1,144) | 551 (1,354) | 467 (1,134) | 424 (1,009) | 358 (826.2) | 273 (625.7) | 200 (444.9) | 232 (511.0) | 182 (398.7) | 123 (266.7) | 135 (290.4) | 58 (125.3) | 90 (209.0) |
| Thefts (per 100,000) | 578 (1,381) | 667 (1,639) | 972 (2,360) | 780 (1,856) | 634 (1,463) | 660 (1,513) | 802 (1,784) | 847 (1,866) | 775 (1,698) | 766 (1,661) | 580 (1,248) | 498 (1,075) | 464 (1,077) |
| Auto thefts (per 100,000) | 297 (709.5) | 405 (995.0) | 258 (626.5) | 343 (816.0) | 380 (877.0) | 219 (501.9) | 236 (525.0) | 223 (491.2) | 184 (403.1) | 254 (550.8) | 179 (385.1) | 159 (343.4) | 164 (380.8) |
| Arson (per 100,000) | 10 (23.9) | 11 (27.0) | 6 (14.6) | 10 (23.8) | 5 (11.5) | 5 (11.5) | 6 (13.3) | 6 (13.2) | 4 (8.8) | 4 (8.7) | 5 (10.8) | 4 (8.6) | 3 (7.0) |
| City-Data.com crime index | 359.3 | 366.2 | 388.0 | 386.4 | 265.0 | 257.0 | 239.9 | 254.1 | 197.1 | 193.4 | 176.1 | 163.3 | 207.1 |
The City-Data.com crime index weighs serious crimes and violent crimes more heavily. Higher means more crime, U.S. average is 246.1. It adjusts for the number of visitors and daily workers commuting into cities.
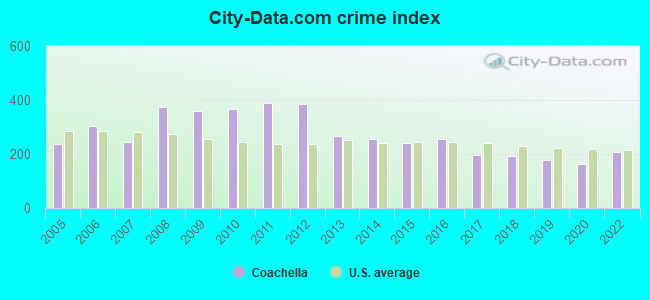
Crime rate in Coachella detailed stats: murders, rapes, robberies, assaults, burglaries, thefts, arson
Full-time law enforcement employees in 2015, including police officers: 1 (1 officers - 1 male; 0 female).
| Officers per 1,000 residents here: | 0.02 |
| California average: | 1.98 |
 Recent articles from our blog. Our writers, many of them Ph.D. graduates or candidates, create easy-to-read articles on a wide variety of topics.


Latest news from Coachella, CA collected exclusively by city-data.com from local newspapers, TV, and radio stations
Ancestries: American (1.1%).
Current Local Time: PST time zone
Elevation: -71 feet
Land area: 20.8 square miles.
Population density: 2,057 people per square mile (low).
17,937 residents are foreign born (40.8% Latin America).
| This city: | 41.7% |
| California: | 26.5% |
Median real estate property taxes paid for housing units with mortgages in 2022: $4,262 (1.1%)
Median real estate property taxes paid for housing units with no mortgage in 2022: $2,695 (0.9%)
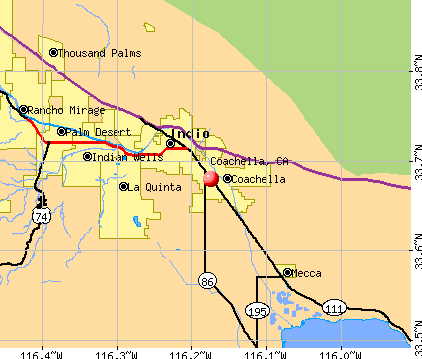
Nearest city with pop. 50,000+: Coachella Valley, CA  (2.3 miles , pop. 118,932).
Nearest city with pop. 200,000+: Riverside, CA (72.6 miles , pop. 255,166).
Nearest city with pop. 1,000,000+: San Diego, CA (83.9 miles , pop. 1,223,400).
Nearest cities:
), ), )Latitude: 33.68 N, Longitude: 116.17 W
Daytime population change due to commuting: -11,507 (-26.7%)
Workers who live and work in this city: 4,491 (20.5%)
Area code commonly used in this area: 760
Coachella, California accommodation & food services, waste management - Economy and Business Data
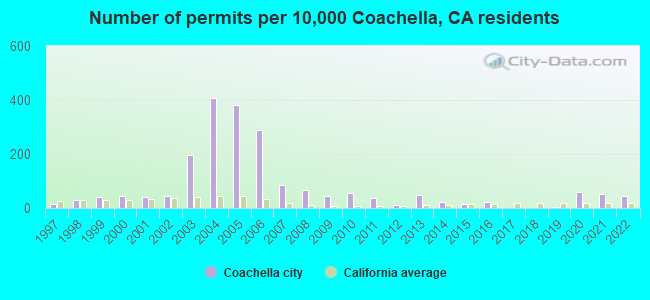
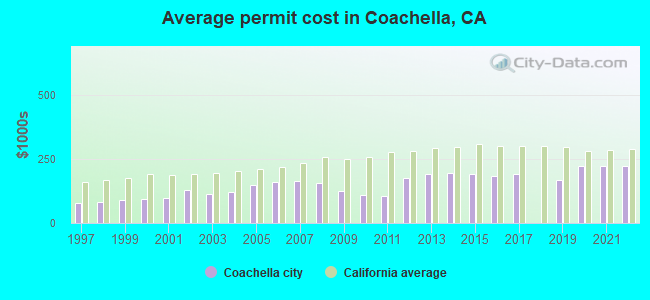
Single-family new house construction building permits:
- 2022: 105 buildings, average cost: $224,700
- 2021: 119 buildings, average cost: $224,600
- 2020: 137 buildings, average cost: $224,800
- 2019: 6 buildings, average cost: $168,700
- 2017: 2 buildings, average cost: $190,400
- 2016: 51 buildings, average cost: $183,800
- 2015: 34 buildings, average cost: $190,000
- 2014: 50 buildings, average cost: $195,400
- 2013: 107 buildings, average cost: $189,700
- 2012: 22 buildings, average cost: $175,300
- 2011: 87 buildings, average cost: $104,100
- 2010: 124 buildings, average cost: $109,800
- 2009: 97 buildings, average cost: $124,200
- 2008: 154 buildings, average cost: $155,200
- 2007: 196 buildings, average cost: $165,000
- 2006: 658 buildings, average cost: $161,600
- 2005: 863 buildings, average cost: $150,000
- 2004: 927 buildings, average cost: $121,600
- 2003: 451 buildings, average cost: $112,700
- 2002: 102 buildings, average cost: $127,900
- 2001: 92 buildings, average cost: $97,000
- 2000: 98 buildings, average cost: $94,300
- 1999: 93 buildings, average cost: $90,000
- 1998: 64 buildings, average cost: $83,400
- 1997: 31 buildings, average cost: $78,400
| Here: | 10.4% |
| California: | 5.1% |
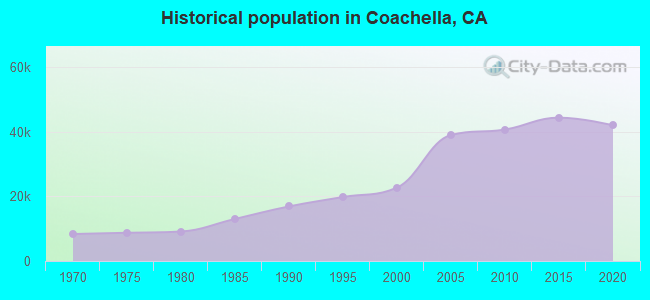
Population change in the 1990s: +5,238 (+30.0%).
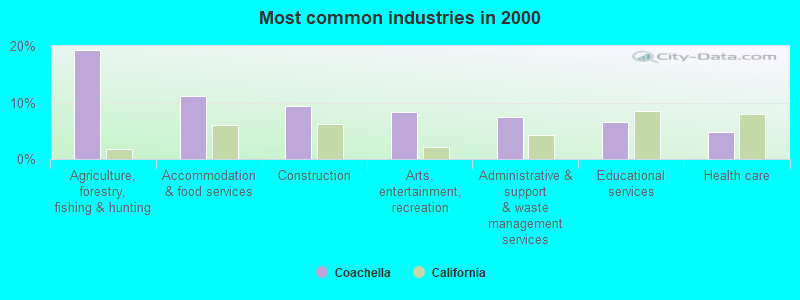
- Agriculture, forestry, fishing & hunting (19.3%)
- Accommodation & food services (11.2%)
- Construction (9.3%)
- Arts, entertainment, recreation (8.3%)
- Administrative & support & waste management services (7.4%)
- Educational services (6.6%)
- Health care (4.8%)
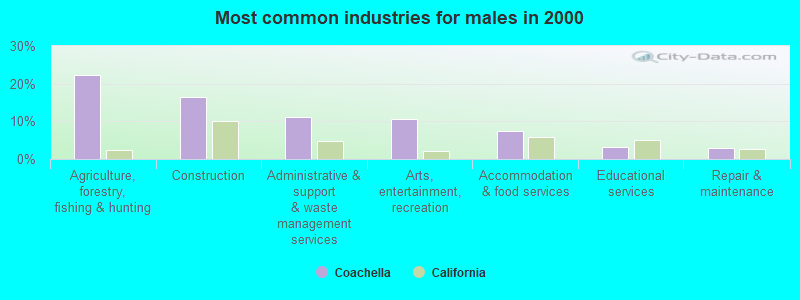
- Agriculture, forestry, fishing & hunting (22.2%)
- Construction (16.5%)
- Administrative & support & waste management services (11.3%)
- Arts, entertainment, recreation (10.7%)
- Accommodation & food services (7.3%)
- Educational services (3.3%)
- Repair & maintenance (3.0%)
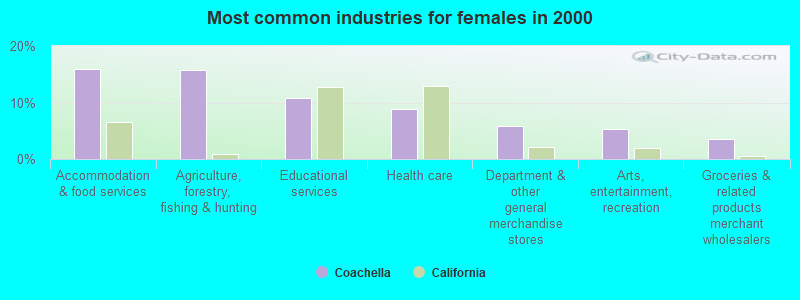
- Accommodation & food services (15.9%)
- Agriculture, forestry, fishing & hunting (15.7%)
- Educational services (10.7%)
- Health care (8.9%)
- Department & other general merchandise stores (5.8%)
- Arts, entertainment, recreation (5.3%)
- Groceries & related products merchant wholesalers (3.5%)
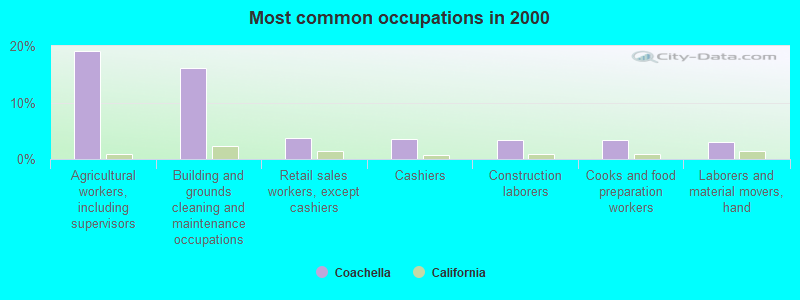
- Agricultural workers, including supervisors (19.1%)
- Building and grounds cleaning and maintenance occupations (16.1%)
- Retail sales workers, except cashiers (3.7%)
- Cashiers (3.5%)
- Construction laborers (3.4%)
- Cooks and food preparation workers (3.4%)
- Laborers and material movers, hand (3.0%)
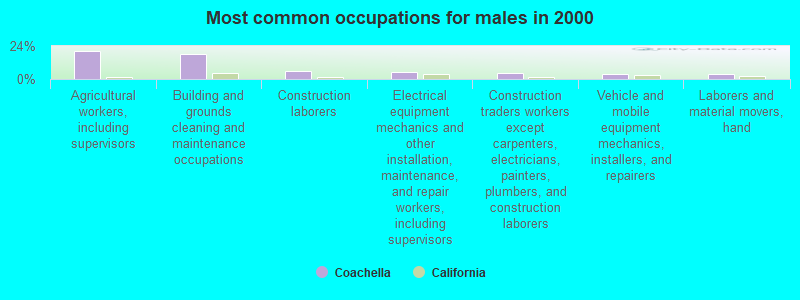
- Agricultural workers, including supervisors (20.5%)
- Building and grounds cleaning and maintenance occupations (18.5%)
- Construction laborers (6.2%)
- Electrical equipment mechanics and other installation, maintenance, and repair workers, including supervisors (5.1%)
- Construction traders workers except carpenters, electricians, painters, plumbers, and construction laborers (4.4%)
- Vehicle and mobile equipment mechanics, installers, and repairers (3.7%)
- Laborers and material movers, hand (3.3%)
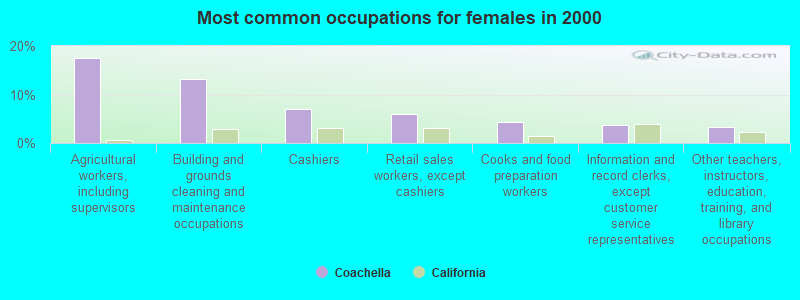
- Agricultural workers, including supervisors (17.5%)
- Building and grounds cleaning and maintenance occupations (13.2%)
- Cashiers (6.9%)
- Retail sales workers, except cashiers (5.9%)
- Cooks and food preparation workers (4.3%)
- Information and record clerks, except customer service representatives (3.6%)
- Other teachers, instructors, education, training, and library occupations (3.3%)
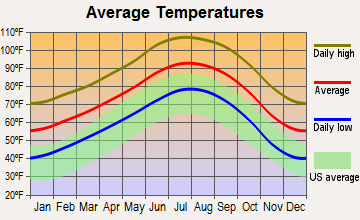
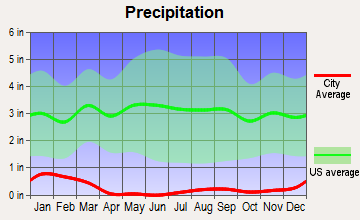
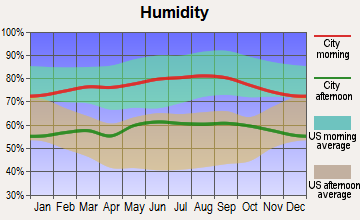
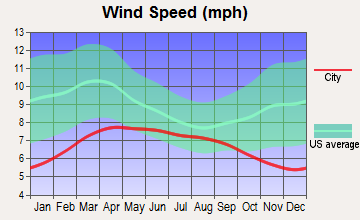
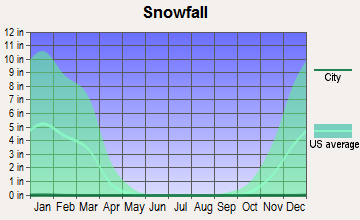
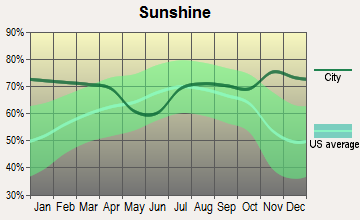
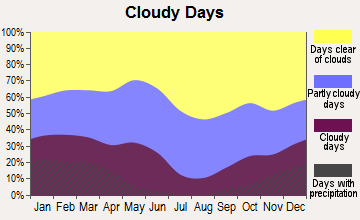
Average climate in Coachella, California
Based on data reported by over 4,000 weather stations
|
|


(lower is better)
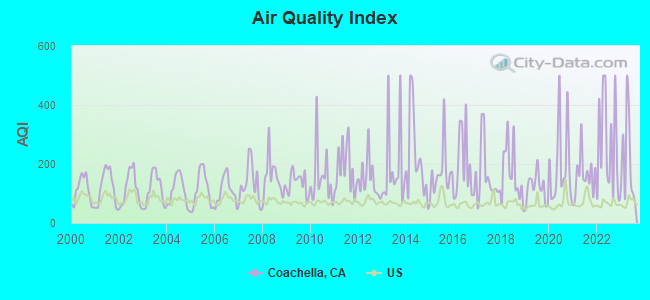
Air Quality Index (AQI) level in 2023 was 210. This is significantly worse than average.
| City: | 210 |
| U.S.: | 73 |
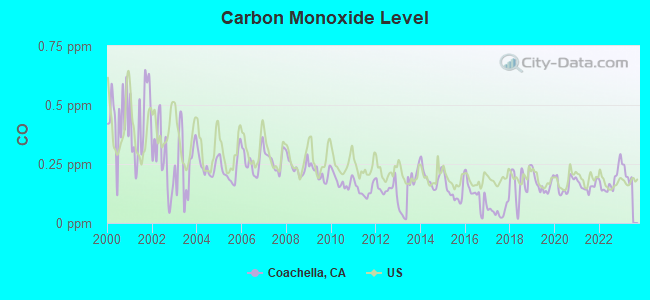
Carbon Monoxide (CO) [ppm] level in 2022 was 0.177. This is significantly better than average. Closest monitor was 3.3 miles away from the city center.
| City: | 0.177 |
| U.S.: | 0.251 |
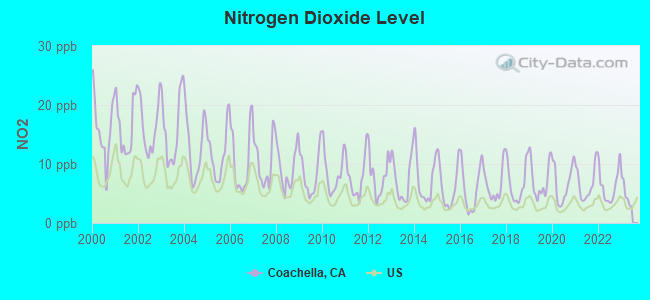
Nitrogen Dioxide (NO2) [ppb] level in 2022 was 6.26. This is worse than average. Closest monitor was 3.3 miles away from the city center.
| City: | 6.26 |
| U.S.: | 5.11 |
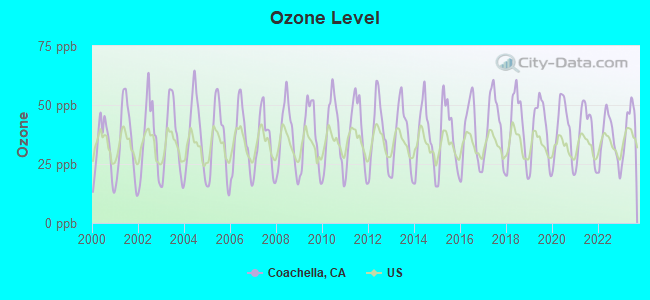
Ozone [ppb] level in 2023 was 41.0. This is worse than average. Closest monitor was 2.9 miles away from the city center.
| City: | 41.0 |
| U.S.: | 33.3 |
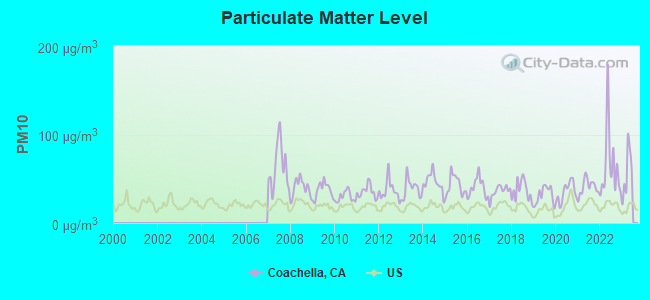
Particulate Matter (PM10) [µg/m3] level in 2022 was 64.1. This is significantly worse than average. Closest monitor was 2.9 miles away from the city center.
| City: | 64.1 |
| U.S.: | 19.2 |
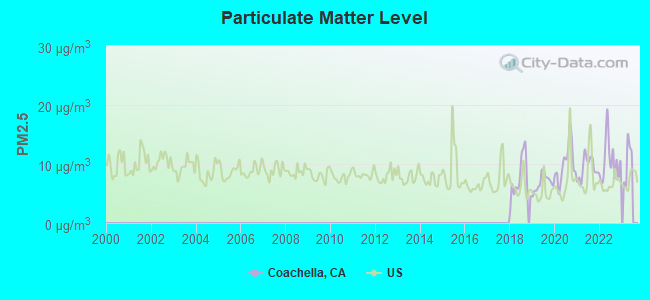
Particulate Matter (PM2.5) [µg/m3] level in 2022 was 10.5. This is worse than average. Closest monitor was 2.9 miles away from the city center.
| City: | 10.5 |
| U.S.: | 8.1 |
Earthquake activity:
Coachella-area historical earthquake activity is significantly above California state average. It is 6642% greater than the overall U.S. average.On 6/28/1992 at 11:57:34, a magnitude 7.6 (6.2 MB, 7.6 MS, 7.3 MW, Depth: 0.7 mi, Class: Major, Intensity: VIII - XII) earthquake occurred 40.5 miles away from Coachella center, causing 3 deaths (1 shaking deaths, 2 other deaths) and 400 injuries, causing $100,000,000 total damage and $40,000,000 insured losses
On 10/16/1999 at 09:46:44, a magnitude 7.4 (6.3 MB, 7.4 MS, 7.2 MW, 7.3 ML) earthquake occurred 59.7 miles away from Coachella center
On 5/19/1940 at 04:36:40, a magnitude 7.2 (7.2 UK) earthquake occurred 42.0 miles away from Coachella center, causing $33,000,000 total damage
On 7/21/1952 at 11:52:14, a magnitude 7.7 (7.7 UK) earthquake occurred 185.4 miles away from the city center, causing $50,000,000 total damage
On 12/31/1934 at 18:45:56, a magnitude 7.1 (7.1 UK) earthquake occurred 72.8 miles away from Coachella center
On 10/15/1979 at 23:16:54, a magnitude 7.0 (5.7 MB, 6.9 MS, 7.0 ML, 6.4 MW) earthquake occurred 67.3 miles away from Coachella center
Magnitude types: body-wave magnitude (MB), local magnitude (ML), surface-wave magnitude (MS), moment magnitude (MW)
Natural disasters:
The number of natural disasters in Riverside County (46) is a lot greater than the US average (15).Major Disasters (Presidential) Declared: 27
Emergencies Declared: 1
Causes of natural disasters: Fires: 22, Floods: 20, Storms: 8, Winter Storms: 8, Landslides: 6, Mudslides: 5, Heavy Rains: 2, Earthquake: 1, Flash Flood: 1, Freeze: 1, Hurricane: 1, Tornado: 1, Tropical Storm: 1, Other: 1 (Note: some incidents may be assigned to more than one category).
Hospitals and medical centers near Coachella:
- KIDNEY INSTITUTE OF THE DESERT (Dialysis Facility, about 5 miles away; INDIO, CA)
- LA QUINTA KIDNEY CENTER, LLC (Dialysis Facility, about 8 miles away; LA QUINTA, CA)
- COUNTRY VILLA RANCHO MIRAGE HEALTHCARE CTR (Nursing Home, about 15 miles away; RANCHO MIRAGE, CA)
- MONTEREY PALMS HEALTHCARE CENTER (Nursing Home, about 15 miles away; PALM DESERT, CA)
Amtrak stations near Coachella:
- 5 miles: INDIO (45995 MONROE ST.) - Bus Station . Services: fully wheelchair accessible, public payphones, snack bar, free short-term parking, call for taxi service.
- 13 miles: PALM DESERT (MONTEREY AVE. & SAN GORGONIO WAY) - Bus Station . Services: fully wheelchair accessible, public payphones, snack bar, free short-term parking, call for taxi service, public transit connection.
College/University in Coachella:
Colleges/universities with over 2000 students nearest to Coachella:
- College of the Desert (about 13 miles; Palm Desert, CA; Full-time enrollment: 5,686)
- Mt San Jacinto Community College District (about 47 miles; San Jacinto, CA; FT enrollment: 8,426)
- Crafton Hills College (about 59 miles; Yucaipa, CA; FT enrollment: 3,222)
- Moreno Valley College (about 61 miles; Moreno Valley, CA; FT enrollment: 4,650)
- University of Redlands (about 63 miles; Redlands, CA; FT enrollment: 4,854)
- Loma Linda University (about 68 miles; Loma Linda, CA; FT enrollment: 2,839)
- California State University-San Marcos (about 69 miles; San Marcos, CA; FT enrollment: 8,070)
Public high school in Coachella:
Public elementary/middle schools in Coachella:
- CAHUILLA DESERT ACADEMY JUNIOR HIGH (Students: 724, Location: 82-489 AVE. 52, Grades: 7-8)
- BOBBY DUKE MIDDLE (Students: 696, Location: 85-358 BAGDAD AVE., Grades: 7-8)
- CESAR CHAVEZ ELEMENTARY (Students: 601, Location: 49-601 AVENIDA DE ORO, Grades: KG-6)
- VALLEY VIEW ELEMENTARY (Students: 486, Location: 85-270 VALLEY RD., Grades: KG-6)
- CORAL MOUNTAIN ACADEMY (Students: 482, Location: 51-375 VAN BUREN ST., Grades: KG-6)
- VALLE DEL SOL ELEMENTARY (Students: 469, Location: 51-433 ED WAY, Grades: KG-6)
- PETER PENDLETON ELEMENTARY (Students: 442, Location: 84-750 CALLE ROJO, Grades: KG-6)
- PALM VIEW ELEMENTARY (Students: 389, Location: 1390 SEVENTH ST., Grades: KG-6)
- IMAGINE SCHOOLS, RIVERSIDE COUNTY (Location: 84-090 AVE. 50, Grades: KG-2, Charter school)
Private elementary/middle school in Coachella:
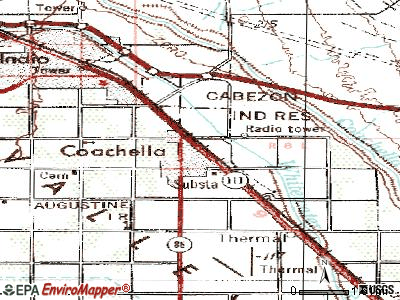
Points of interest:
Notable locations in Coachella: Coachella Wastewater Treatment Plant (A), American Medical Response Coachella (B), Coachella Chamber of Commerce (C), Coachella Branch Riverside City and County Public Library (D), Riverside County Fire Department Station 79 Coachella (E). Display/hide their locations on the map
Shopping Centers: Coachella Shopping Center (1), Coachella Plaza Shopping Center (2). Display/hide their locations on the map
Parks in Coachella include: Bagdouma Park (1), Dateland Park (2), De Oro Park (3), Sierra Vista Park (4). Display/hide their locations on the map
Birthplace of: Randy Caballero - Boxer.
Drinking water stations with addresses in Coachella and their reported violations in the past:
CASTRO TRAILER PARK (Population served: 180, Groundwater):Past monitoring violations:COACHELLA VALLEY PUBLIC CEMETERY (Population served: 25, Groundwater):
- Initial Tap Sampling for Pb and Cu - In NOV-14-2001, Contaminant: Lead and Copper Rule. Follow-up actions: St Violation/Reminder Notice (NOV-14-2001)
- Initial Tap Sampling for Pb and Cu - In NOV-14-2001, Contaminant: Lead and Copper Rule
- Initial Tap Sampling for Pb and Cu - In NOV-14-2001, Contaminant: Lead and Copper Rule
- One routine major monitoring violation
Past health violations:Past monitoring violations:
- MCL, Monthly (TCR) - In SEP-2005, Contaminant: Coliform. Follow-up actions: St Formal NOV issued (OCT-14-2005)
- MCL, Monthly (TCR) - In SEP-2005, Contaminant: Coliform
- MCL, Monthly (TCR) - In SEP-2005, Contaminant: Coliform
- 4 routine major monitoring violations
- One regular monitoring violation
| This city: | 4.5 people |
| California: | 2.9 people |
| This city: | 92.6% |
| Whole state: | 68.7% |
| This city: | 9.7% |
| Whole state: | 7.2% |
Likely homosexual households (counted as self-reported same-sex unmarried-partner households)
- Lesbian couples: 0.5% of all households
- Gay men: 0.4% of all households
People in group quarters in Coachella in 2000:
- 31 people in agriculture workers' dormitories on farms
- 8 people in other noninstitutional group quarters
- 5 people in unknown juvenile institutions
Banks with branches in Coachella (2011 data):
- Rabobank, National Association: Coachella Branch at 1491 South Sixth Street, branch established on 1912/01/01. Info updated 2011/01/27: Bank assets: $11,745.0 mil, Deposits: $8,446.0 mil, headquarters in Roseville, CA, positive income, Agricultural Specialization, 124 total offices, Holding Company: Cooperatieve Centrale Raiffeisen-Boerenleenbank B.A., "rabobank Nederland
- Bank of America, National Association: Jackson Square Branch at 83017 Avenue 48, branch established on 2006/11/16. Info updated 2009/11/18: Bank assets: $1,451,969.3 mil, Deposits: $1,077,176.8 mil, headquarters in Charlotte, NC, positive income, 5782 total offices, Holding Company: Bank Of America Corporation
- Wells Fargo Bank, National Association: East Coachella Branch at 49201 Grapefruit Blvd, branch established on 2007/07/16. Info updated 2011/04/05: Bank assets: $1,161,490.0 mil, Deposits: $905,653.0 mil, headquarters in Sioux Falls, SD, positive income, 6395 total offices, Holding Company: Wells Fargo & Company
For population 15 years and over in Coachella:
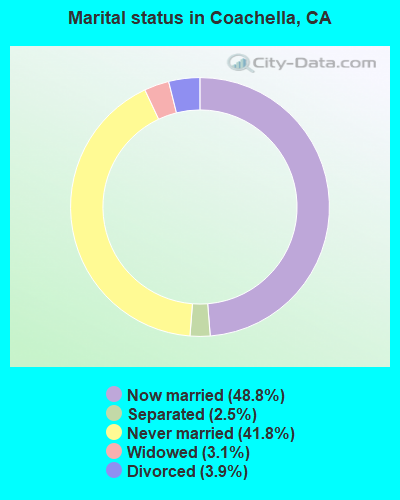
- Never married: 41.8%
- Now married: 48.8%
- Separated: 2.5%
- Widowed: 3.1%
- Divorced: 3.9%
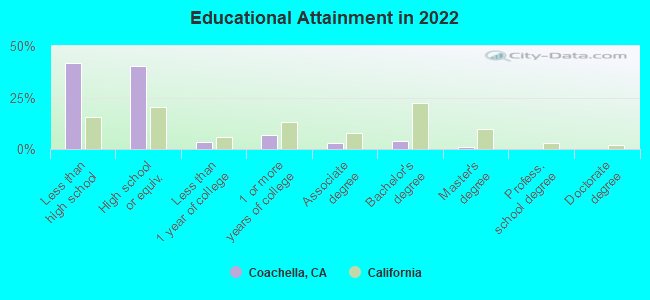
For population 25 years and over in Coachella:
- High school or higher: 58.4%
- Bachelor's degree or higher: 4.6%
- Graduate or professional degree: 1.1%
- Unemployed: 11.7%
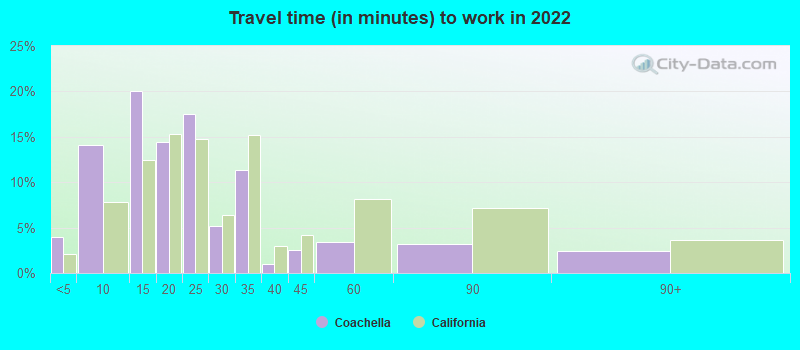
- Mean travel time to work (commute): 21.0 minutes
| Here: | 20.3 |
| California average: | 15.5 |


Graphs represent county-level data. Detailed 2008 Election Results
Religion statistics for Coachella, CA (based on Riverside County data)


| Religion | Adherents | Congregations |
|---|---|---|
| Catholic | 602,765 | 51 |
| Evangelical Protestant | 240,306 | 741 |
| Other | 77,581 | 194 |
| Mainline Protestant | 29,535 | 103 |
| Black Protestant | 19,170 | 40 |
| Orthodox | 3,647 | 11 |
| None | 1,216,637 | - |
Food Environment Statistics:
| Here: | 1.60 / 10,000 pop. |
| California: | 2.14 / 10,000 pop. |
| Riverside County: | 0.05 / 10,000 pop. |
| California: | 0.04 / 10,000 pop. |
| This county: | 0.44 / 10,000 pop. |
| California: | 0.62 / 10,000 pop. |
| Riverside County: | 1.51 / 10,000 pop. |
| California: | 1.49 / 10,000 pop. |
| This county: | 5.45 / 10,000 pop. |
| California: | 7.42 / 10,000 pop. |
| Here: | 7.7% |
| California: | 7.3% |
| Here: | 24.5% |
| California: | 21.3% |
| This county: | 15.2% |
| California: | 17.9% |
Health and Nutrition:
| Coachella: | 44.6% |
| California: | 49.4% |
| Here: | 44.1% |
| California: | 48.0% |
| Coachella: | 28.5 |
| State: | 28.1 |
| Coachella: | 23.8% |
| California: | 20.2% |
| Coachella: | 10.3% |
| State: | 11.2% |
| Coachella: | 6.7 |
| California: | 6.8 |
| This city: | 30.6% |
| California: | 31.5% |
| Coachella: | 52.1% |
| California: | 56.4% |
| Coachella: | 81.6% |
| State: | 80.9% |
More about Health and Nutrition of Coachella, CA Residents
| Local government employment and payroll (March 2022) | |||||
| Function | Full-time employees | Monthly full-time payroll | Average yearly full-time wage | Part-time employees | Monthly part-time payroll |
|---|---|---|---|---|---|
| Other and Unallocable | 10 | $103,558 | $124,270 | 0 | $0 |
| Financial Administration | 10 | $82,466 | $98,959 | 0 | $0 |
| Other Government Administration | 10 | $101,534 | $121,841 | 13 | $300 |
| Housing and Community Development (Local) | 8 | $62,825 | $94,238 | 1 | $1,039 |
| Water Supply | 7 | $50,657 | $86,841 | 0 | $0 |
| Parks and Recreation | 6 | $39,549 | $79,098 | 0 | $0 |
| Sewerage | 6 | $40,786 | $81,572 | 0 | $0 |
| Streets and Highways | 5 | $36,503 | $87,607 | 1 | $1,931 |
| Welfare | 2 | $11,475 | $68,850 | 0 | $0 |
| Solid Waste Management | 1 | $8,196 | $98,352 | 1 | $4,294 |
| Totals for Government | 65 | $537,549 | $99,240 | 16 | $7,565 |
Coachella government finances - Expenditure in 2017 (per resident):
- Construction - Regular Highways: $14,125,000 ($329.75)
Parks and Recreation: $5,358,000 ($125.08)
Sewerage: $4,535,000 ($105.87)
Housing and Community Development: $165,000 ($3.85)
- Current Operations - Police Protection: $8,177,000 ($190.90)
Central Staff Services: $6,706,000 ($156.55)
Water Utilities: $4,213,000 ($98.35)
Regular Highways: $4,074,000 ($95.11)
Sewerage: $3,204,000 ($74.80)
Parks and Recreation: $2,918,000 ($68.12)
Local Fire Protection: $2,794,000 ($65.23)
Protective Inspection and Regulation - Other: $502,000 ($11.72)
Financial Administration: $421,000 ($9.83)
Health - Other: $282,000 ($6.58)
- General - Interest on Debt: $1,157,000 ($27.01)
- Other Capital Outlay - Protective Inspection and Regulation - Other: $49,000 ($1.14)
- Total Salaries and Wages: $2,772,000 ($64.71)
- Water Utilities - Interest on Debt: $516,000 ($12.05)
Coachella government finances - Revenue in 2017 (per resident):
- Charges - Sewerage: $5,764,000 ($134.56)
Other: $2,832,000 ($66.11)
Regular Highways: $1,991,000 ($46.48)
- Federal Intergovernmental - Housing and Community Development: $433,000 ($10.11)
- Miscellaneous - General Revenue - Other: $629,000 ($14.68)
Fines and Forfeits: $603,000 ($14.08)
Special Assessments: $557,000 ($13.00)
Rents: $114,000 ($2.66)
Interest Earnings: $15,000 ($0.35)
- Revenue - Water Utilities: $6,977,000 ($162.88)
- State Intergovernmental - Other: $7,997,000 ($186.69)
Highways: $865,000 ($20.19)
General Local Government Support: $4,000 ($0.09)
- Tax - General Sales and Gross Receipts: $7,136,000 ($166.59)
Property: $5,816,000 ($135.78)
Public Utilities Sales: $3,243,000 ($75.71)
Other: $1,799,000 ($42.00)
Other License: $699,000 ($16.32)
Occupation and Business License - Other: $514,000 ($12.00)
Documentary and Stock Transfer: $63,000 ($1.47)
Coachella government finances - Debt in 2017 (per resident):
- Long Term Debt - Outstanding Unspecified Public Purpose: $93,277,000 ($2177.59)
Beginning Outstanding - Unspecified Public Purpose: $70,949,000 ($1656.33)
Issue, Unspecified Public Purpose: $25,500,000 ($595.31)
Retired Unspecified Public Purpose: $3,172,000 ($74.05)
Coachella government finances - Cash and Securities in 2017 (per resident):
- Other Funds - Cash and Securities: $38,058,000 ($888.48)
- Sinking Funds - Cash and Securities: $12,494,000 ($291.68)
7.19% of this county's 2021 resident taxpayers lived in other counties in 2020 ($71,521 average adjusted gross income)
| Here: | 7.19% |
| California average: | 5.19% |
0.03% of residents moved from foreign countries ($210 average AGI)
Riverside County: 0.03% California average: 0.03%
Top counties from which taxpayers relocated into this county between 2020 and 2021:
| from Los Angeles County, CA | |
| from San Bernardino County, CA | |
| from Orange County, CA |
6.28% of this county's 2020 resident taxpayers moved to other counties in 2021 ($64,593 average adjusted gross income)
| Here: | 6.28% |
| California average: | 6.14% |
0.02% of residents moved to foreign countries ($200 average AGI)
Riverside County: 0.02% California average: 0.02%
Top counties to which taxpayers relocated from this county between 2020 and 2021:
| to San Bernardino County, CA | |
| to Los Angeles County, CA | |
| to Orange County, CA |
| Businesses in Coachella, CA | ||||
| Name | Count | Name | Count | |
|---|---|---|---|---|
| 99 Cents Only Stores | 1 | Payless | 1 | |
| Arby's | 1 | Pizza Hut | 1 | |
| AutoZone | 1 | Quiznos | 1 | |
| CVS | 1 | RadioShack | 1 | |
| Carl\s Jr. | 2 | Rite Aid | 1 | |
| Domino's Pizza | 1 | Starbucks | 1 | |
| FedEx | 2 | Subway | 1 | |
| GameStop | 1 | T-Mobile | 1 | |
| Jack In The Box | 2 | Taco Bell | 1 | |
| KFC | 1 | U-Haul | 1 | |
| Kroger | 1 | UPS | 3 | |
| MasterBrand Cabinets | 2 | Vans | 1 | |
| McDonald's | 3 | Walgreens | 1 | |
| Nike | 1 | Wendy's | 1 | |
Strongest AM radio stations in Coachella:
- KNWZ (970 AM; 5 kW; COACHELLA, CA; Owner: MCC RADIO, LLC)
- KESQ (1400 AM; 1 kW; INDIO, CA; Owner: GULF-CALIFORNIA BROADCAST CO.)
- KNWQ (1140 AM; 10 kW; PALM SPRINGS, CA; Owner: MCC RADIO, LLC)
- KCMJ (1270 AM; 5 kW; THOUSAND PALMS, CA; Owner: MCC RADIO, LLC)
- KFMB (760 AM; 50 kW; SAN DIEGO, CA; Owner: MIDWEST TELEVISION, INC.)
- KPSI (920 AM; 5 kW; PALM SPRINGS, CA; Owner: R & R RADIO CORPORATION)
- KXPS (1010 AM; 4 kW; THOUSAND PALMS, CA; Owner: MCC RADIO, LLC)
- KPLS (830 AM; 50 kW; ORANGE, CA; Owner: CRN LICENSES, LLC)
- KCBQ (1170 AM; 50 kW; SAN DIEGO, CA; Owner: RADIO 1210, INC.)
- KLAC (570 AM; 50 kW; LOS ANGELES, CA; Owner: AMFM RADIO LICENSES, L.L.C.)
- KFI (640 AM; 50 kW; LOS ANGELES, CA; Owner: CAPSTAR TX LIMITED PARTNERSHIP)
- KTNQ (1020 AM; 50 kW; LOS ANGELES, CA; Owner: KTNQ-AM LICENSE CORP.)
- KXTA (1150 AM; 50 kW; LOS ANGELES, CA; Owner: CITICASTERS LICENSES, L.P.)
Strongest FM radio stations in Coachella:
- KCLB-FM (93.7 FM; COACHELLA, CA; Owner: MCC RADIO, LLC)
- KCRI (89.3 FM; INDIO, CA; Owner: SANTA MONICA COMMUNITY COLLEGE DIST.)
- KJJZ (102.3 FM; INDIO, CA; Owner: R M BROADCASTING L.L.C.)
- KUNA-FM (96.7 FM; LA QUINTA, CA; Owner: GULF-CALIFORNIA BROADCAST COMPANY)
- KRCK-FM (97.7 FM; MECCA, CA; Owner: PLAYA DEL SOL BROADCASTERS)
- KKUU (92.7 FM; INDIO, CA; Owner: MCC RADIO, LLC)
- KPSC (88.5 FM; PALM SPRINGS, CA; Owner: UNIVERSITY OF SOUTHERN CALIFORNIA)
- KLRD (90.1 FM; YUCAIPA, CA; Owner: EDUCATIONAL MEDIA FOUNDATION)
- KATY-FM (101.3 FM; IDYLLWILD, CA; Owner: ALL PRO BROADCASTING, INC.)
- K201AR (88.1 FM; BANNING, CA; Owner: KSGN, INC.)
- K232CX (94.3 FM; DESERT HOT SPRINGS, CA; Owner: MCC RADIO, LLC)
- KYOR (106.9 FM; YUCCA VALLEY, CA; Owner: MCC RADIO, LLC)
- KLVJ (100.1 FM; JULIAN, CA; Owner: EDUCATIONAL MEDIA FOUNDATION)
- KRTM (88.9 FM; TEMECULA, CA; Owner: PENFOLD COMMUNICATIONS, INC.)
- KZAL (105.5 FM; DESERT CENTER, CA; Owner: WORLDWIDE MULTI-MEDIA B/C CO.)
- KPLM (106.1 FM; PALM SPRINGS, CA; Owner: R M BROADCASTING L.L.C.)
- KLOB (94.7 FM; THOUSAND PALMS, CA; Owner: ENTRAVISION HOLDINGS, LLC)
- K280CV (103.9 FM; CATHEDRAL CITY, CA; Owner: MCC RADIO, LLC)
- KUOR-FM (89.1 FM; REDLANDS, CA; Owner: UNIVERSITY OF REDLANDS)
- KEZN (103.1 FM; PALM DESERT, CA; Owner: INFINITY RADIO SUBSIDIARY OPERATIONS INC.)
TV broadcast stations around Coachella:
- KESQ-TV (Channel 42; PALM SPRINGS, CA; Owner: GULF-CALIFORNIA BROADCAST COMPANY)
- K19DH (Channel 19; INDIO, CA; Owner: DESERT BROADCASTING, INC.)
- KYAV-LP (Channel 12; PALM SPRINGS, CA; Owner: JDF INVESTMENT CO. LLC)
- KEVC-CA (Channel 5; INDIO, CA; Owner: ENTRAVISION HOLDINGS, LLC)
- KDFX-CA (Channel 33; INDIO/PALM SPRINGS, CA; Owner: PACIFIC MEDIA CORPORATION)
- K06MB (Channel 6; INDIO, CA; Owner: PARK PLACE BROADCASTING COMPANY)
- KVER-CA (Channel 4; INDIO, CA; Owner: ENTRAVISION HOLDINGS, LLC)
- KODG-LP (Channel 17; PALM SPRINGS, CA; Owner: BILTMORE BROADCASTING CORPORATION)
- National Bridge Inventory (NBI) Statistics
- 27Number of bridges
- 410ft / 125mTotal length
- $5,542,000Total costs
- 362,709Total average daily traffic
- 89,196Total average daily truck traffic
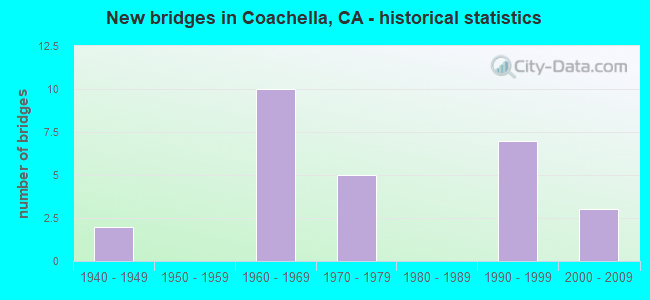
- New bridges - historical statistics
- 21940-1949
- 101960-1969
- 51970-1979
- 71990-1999
- 32000-2009
FCC Registered Antenna Towers:
93 (See the full list of FCC Registered Antenna Towers in Coachella)FCC Registered Commercial Land Mobile Towers:
2 (See the full list of FCC Registered Commercial Land Mobile Towers in Coachella, CA)FCC Registered Broadcast Land Mobile Towers:
16 (See the full list of FCC Registered Broadcast Land Mobile Towers)FCC Registered Microwave Towers:
46 (See the full list of FCC Registered Microwave Towers in this town)FCC Registered Amateur Radio Licenses:
16 (See the full list of FCC Registered Amateur Radio Licenses in Coachella)FAA Registered Aircraft:
6- Aircraft: RAYTHEON AIRCRAFT COMPANY A36 (Category: Land, Seats: 6, Weight: Up to 12,499 Pounds), Engine: CONT MOTOR IO-550 SERIES (300 HP) (Reciprocating)
N-Number: 3236Q, N3236Q, N-3236Q, Serial Number: E3110, Year manufactured: 1997, Airworthiness Date: 08/21/1997, Certificate Issue Date: 07/26/2013
Registrant (LLC): Ptv Aviation LLC, 86705 Avenue 54 Ste A, Coachella, CA 92236 - Aircraft: CESSNA AIRCRAFT CO LC41-550FG (Category: Land, Seats: 4, Weight: Up to 12,499 Pounds), Engine: CONT MOTOR TSIO-550-C (310 HP) (Reciprocating)
N-Number: 432JA, N432JA, N-432JA, Serial Number: 411046, Year manufactured: 2008, Airworthiness Date: 10/29/2013, Certificate Issue Date: 01/10/2014
Registrant (Individual): David Tottino, 52300 Enterprise Way, Coachella, CA 92236 - Aircraft: BEECH B-60 (Category: Land, Engines: 2, Seats: 6, Weight: Up to 12,499 Pounds, Speed: 112 mph), Engine: LYCOMING TI0-541 SER (310 HP) (Reciprocating)
N-Number: 717VS, N717VS, N-717VS, Serial Number: P-433, Year manufactured: 1977, Airworthiness Date: 07/11/1977, Certificate Issue Date: 09/21/2016
Registrant (LLC): Belk Farms LLC, Po Box 24, Coachella, CA 92236 - Aircraft: ODLUM B-8M (Category: Land, Weight: Up to 12,499 Pounds, Speed: 45 mph), Engine: MCCULLOCH 4318A&E/0-100 (72 HP) (Reciprocating)
N-Number: 8867, N8867, N-8867, Serial Number: 1, Year manufactured: 1970, Certificate Issue Date: 04/08/1974
Registrant (Individual): Kermit A Salyer, Sp56 49615 Hwy 86, Coachella, CA 92236 - Aircraft: CESSNA 550 (Category: Land, Engines: 2, Seats: 8, Weight: 12,500 - 19,999 Pounds), Engine: P&W CANADA PW530A (2887 Pounds of Thrust) (Turbo-fan)
N-Number: 942EB, N942EB, N-942EB, Serial Number: 550-1090, Year manufactured: 2004, Airworthiness Date: 01/31/2014, Certificate Issue Date: 03/10/2014
Registrant (Corporation): Ernie Ball Inc, 53-973 Polk St, Coachella, CA 92236 - Aircraft: BEECH C23 (Category: Land, Seats: 4, Weight: Up to 12,499 Pounds, Speed: 116 mph), Engine: LYCOMING O&VO-360 SER (180 HP) (Reciprocating)
N-Number: 24664, N24664, N-24664, Serial Number: M-1442, Year manufactured: 1973, Airworthiness Date: 04/03/1973, Certificate Issue Date: 08/30/2007
Registrant (Individual): Ronal W Brown, 84859 Avenue 48, Coachella, CA 92236
Deregistered: Cancel Date: 07/06/2017
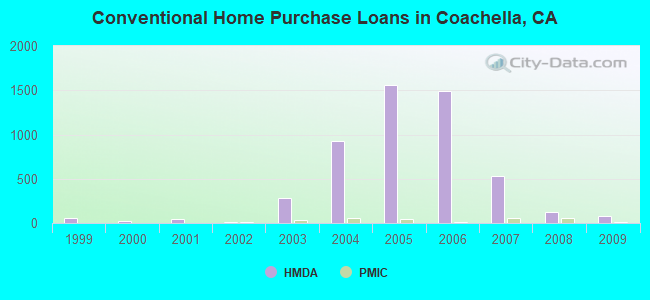
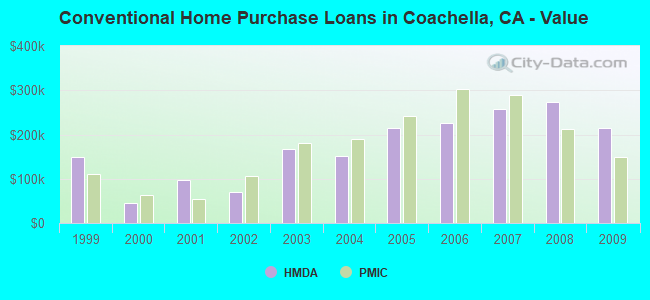
| Home Mortgage Disclosure Act Aggregated Statistics For Year 2009 (Based on 4 full and 3 partial tracts) | ||||||||||||||
| A) FHA, FSA/RHS & VA Home Purchase Loans | B) Conventional Home Purchase Loans | C) Refinancings | D) Home Improvement Loans | E) Loans on Dwellings For 5+ Families | F) Non-occupant Loans on < 5 Family Dwellings (A B C & D) | G) Loans On Manufactured Home Dwelling (A B C & D) | ||||||||
|---|---|---|---|---|---|---|---|---|---|---|---|---|---|---|
| Number | Average Value | Number | Average Value | Number | Average Value | Number | Average Value | Number | Average Value | Number | Average Value | Number | Average Value | |
| LOANS ORIGINATED | 328 | $148,350 | 82 | $213,750 | 130 | $257,453 | 6 | $131,330 | 1 | $945,000 | 71 | $302,291 | 1 | $49,030 |
| APPLICATIONS APPROVED, NOT ACCEPTED | 18 | $157,170 | 8 | $251,670 | 23 | $223,137 | 3 | $71,063 | 0 | $0 | 9 | $245,392 | 0 | $0 |
| APPLICATIONS DENIED | 67 | $152,615 | 21 | $204,459 | 109 | $207,352 | 19 | $51,528 | 0 | $0 | 31 | $256,922 | 1 | $26,410 |
| APPLICATIONS WITHDRAWN | 57 | $145,734 | 16 | $201,308 | 47 | $227,367 | 5 | $93,126 | 0 | $0 | 14 | $241,204 | 0 | $0 |
| FILES CLOSED FOR INCOMPLETENESS | 4 | $186,780 | 2 | $428,110 | 16 | $200,564 | 1 | $187,020 | 0 | $0 | 2 | $253,810 | 0 | $0 |
Detailed HMDA statistics for the following Tracts: 0452.03 , 0456.03, 0457.02, 0457.03, 0457.04, 0457.05, 0457.06
| Private Mortgage Insurance Companies Aggregated Statistics For Year 2009 (Based on 1 full and 3 partial tracts) | ||||
| A) Conventional Home Purchase Loans | B) Refinancings | |||
|---|---|---|---|---|
| Number | Average Value | Number | Average Value | |
| LOANS ORIGINATED | 7 | $148,659 | 2 | $93,510 |
| APPLICATIONS APPROVED, NOT ACCEPTED | 7 | $165,407 | 1 | $202,260 |
| APPLICATIONS DENIED | 1 | $202,370 | 0 | $0 |
| APPLICATIONS WITHDRAWN | 0 | $0 | 0 | $0 |
| FILES CLOSED FOR INCOMPLETENESS | 1 | $205,180 | 0 | $0 |
Detailed PMIC statistics for the following Tracts: 0452.03 , 0456.03, 0457.02, 0457.03, 0457.04, 0457.05, 0457.06
| Most common first names in Coachella, CA among deceased individuals | ||
| Name | Count | Lived (average) |
|---|---|---|
| Maria | 78 | 72.4 years |
| Jose | 64 | 66.3 years |
| Juan | 38 | 70.2 years |
| Manuel | 37 | 71.1 years |
| Jesus | 36 | 69.5 years |
| Mary | 28 | 72.5 years |
| Antonio | 26 | 74.2 years |
| Guadalupe | 24 | 63.5 years |
| John | 22 | 74.3 years |
| Ramon | 21 | 69.0 years |
| Most common last names in Coachella, CA among deceased individuals | ||
| Last name | Count | Lived (average) |
|---|---|---|
| Garcia | 42 | 66.9 years |
| Lopez | 42 | 68.8 years |
| Rodriguez | 41 | 70.1 years |
| Hernandez | 40 | 71.8 years |
| Sanchez | 32 | 71.0 years |
| Martinez | 32 | 70.3 years |
| Reyes | 29 | 73.0 years |
| Ramirez | 26 | 71.2 years |
| Gonzalez | 21 | 66.1 years |
| Mendoza | 17 | 67.3 years |
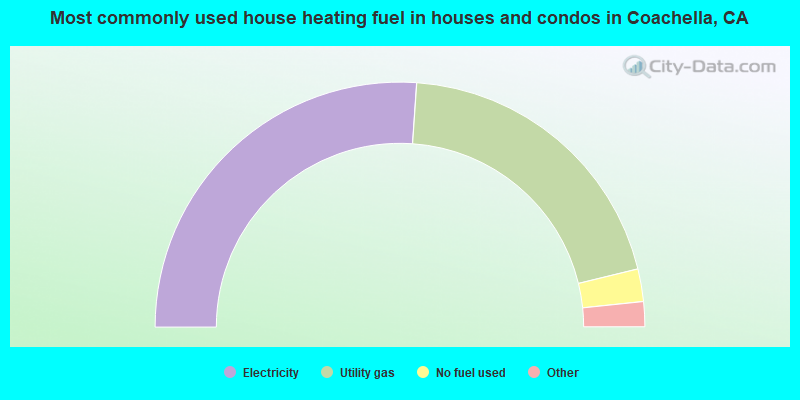
- 52.2%Electricity
- 40.2%Utility gas
- 4.3%No fuel used
- 2.6%Bottled, tank, or LP gas
- 0.6%Solar energy
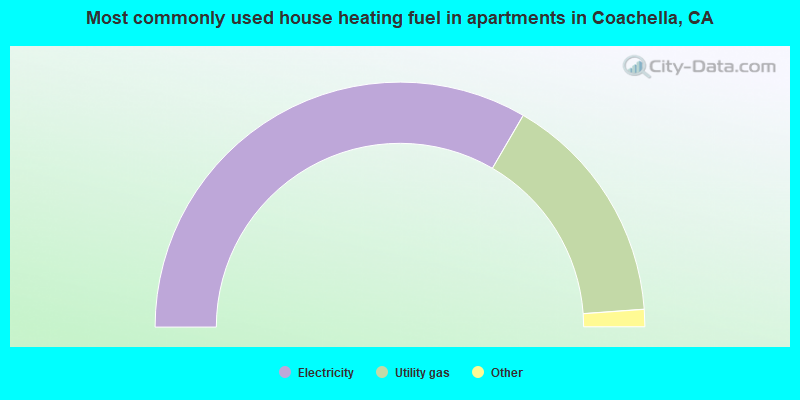
- 66.8%Electricity
- 30.9%Utility gas
- 1.9%No fuel used
- 0.4%Bottled, tank, or LP gas
Coachella compared to California state average:
- Median household income below state average.
- Median house value below state average.
- Black race population percentage significantly below state average.
- Hispanic race population percentage significantly above state average.
- Median age below state average.
- Foreign-born population percentage significantly above state average.
- Length of stay since moving in significantly above state average.
- House age significantly below state average.
- Percentage of population with a bachelor's degree or higher significantly below state average.
Coachella on our top lists:
- #14 on the list of "Top 101 cities with the highest percentage of family households, population 10,000+"
- #20 on the list of "Top 101 cities with the highest number of auto thefts per 100,000 residents, excludes tourist destinations and others with a lot of outsiders visiting based on city industries data (population 5,000+)"
- #30 on the list of "Top 101 cities with the least people having Master's or Doctorate degrees (population 5,000+)"
- #32 on the list of "Top 101 cities with largest percentage of males in occupations: building and grounds cleaning and maintenance occupations (population 5,000+)"
- #46 on the list of "Top 101 cities with the lowest percentage of English-only speaking households, population 5,000+"
- #62 on the list of "Top 101 cities with largest percentage of males in industries: arts, entertainment, and recreation (population 5,000+)"
- #63 on the list of "Top 101 cities with largest percentage of females in occupations: building and grounds cleaning and maintenance occupations (population 5,000+)"
- #66 on the list of "Top 101 cities with largest percentage of males in industries: administrative and support and waste management services (population 5,000+)"
- #73 on the list of "Top 101 cities with largest percentage of females in occupations: farming, fishing, and forestry occupations (population 5,000+)"
- #77 on the list of "Top 100 least-educated cities (pop. 5,000+)"
- #78 on the list of "Top 101 cities with the highest percentage of family households, population 1,000+"
- #81 on the list of "Top 101 cities with largest percentage of females in industries: agriculture, forestry, fishing and hunting (population 5,000+)"
- #85 on the list of "Top 100 least racially diverse cities (pop. 5,000+)"
- #29 (92236) on the list of "Top 101 zip codes with the lowest 2012 average taxable interest for individuals (pop 5,000+)"
- #38 (92236) on the list of "Top 101 zip codes with the smallest percentage of taxpayers reporting net capital gain/loss in 2012 (pop 5,000+)"
- #74 (92236) on the list of "Top 101 zip codes with the most casinos in 2005"
- #3 on the list of "Top 101 counties with the highest lead air pollution readings in 2012 (µg/m3)"
- #4 on the list of "Top 101 counties with the highest ground withdrawal of fresh water for public supply"
- #11 on the list of "Top 101 counties with the most Catholic adherents"
- #11 on the list of "Top 101 counties with the highest total withdrawal of fresh water for public supply"
- #12 on the list of "Top 101 counties with the highest carbon monoxide air pollution readings in 2012 (ppm)"

|
|
Total of 9 patent applications in 2008-2024.