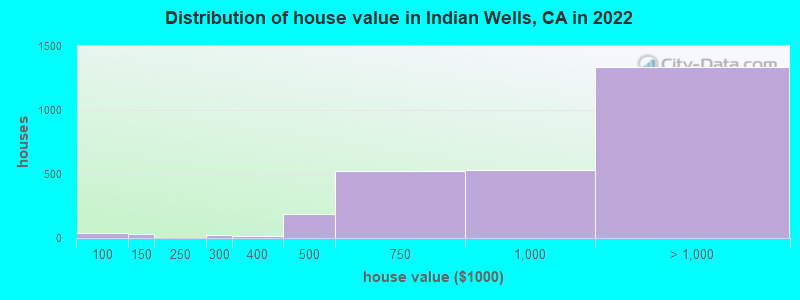
Estimated median house or condo value in 2022: over $1,000,000 (it was $387,100 in 2000)
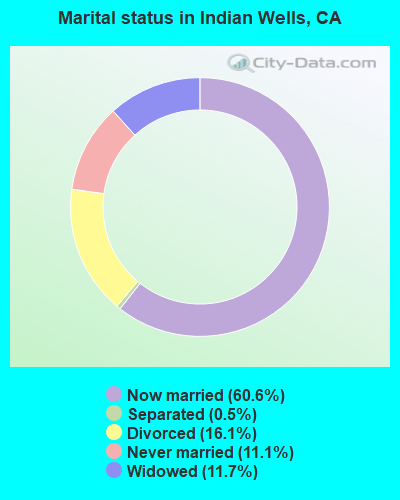
Indian Wells:
over $1,000,000
CA:
$715,900
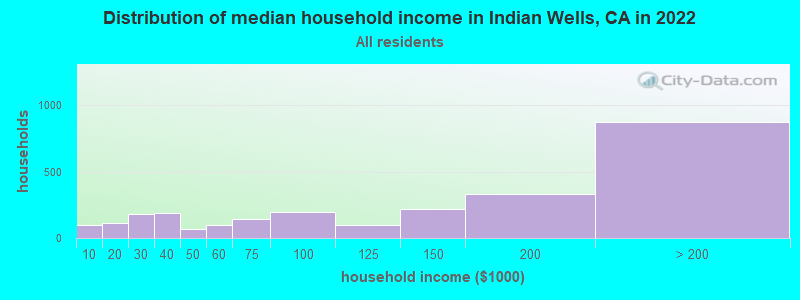
Mean prices in 2022:all housing units: $586,167; detached houses: $631,165; townhouses or other attached units: $625,082; in 2-unit structures: $464,831; in 3-to-4-unit structures: $482,529; in 5-or-more-unit structures: $526,423; mobile homes: $178,284; occupied boats, rvs, vans, etc.: $86,227
Median gross rent in 2022: $899.
March 2022 cost of living index in Indian Wells: 83.5 (less than average, U.S. average is 100)
Percentage of residents living in poverty in 2022: 4.7%
(4.5% for White Non-Hispanic residents, 17.8% for Hispanic or Latino residents, 13.0% for other race residents)
150.3%Native Hawaiian and Other Pacific Islander alone
110.2%Other race alone
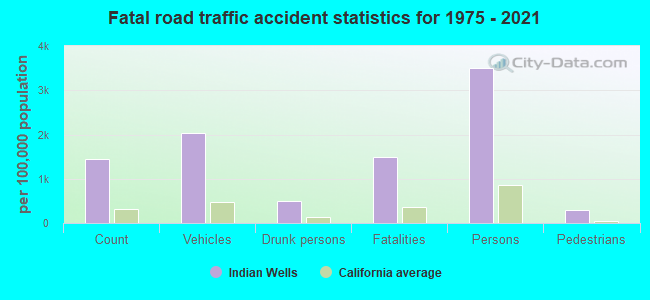
According to our research of California and other state lists, there was 1 registered sex offender living in Indian Wells, California as of April 27, 2024. The ratio of all residents to sex offenders in Indian Wells is 5,336 to 1. The ratio of registered sex offenders to all residents in this city is much lower than the state average.
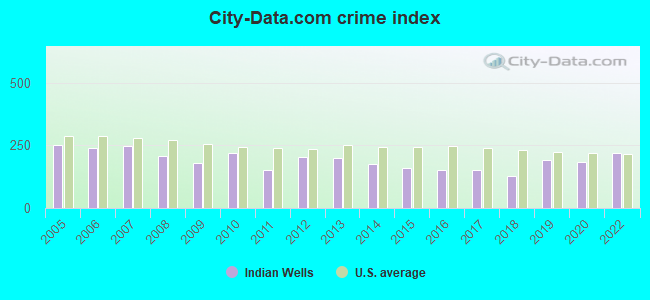
Crime rates in Indian Wells by year
Type
2009
2010
2011
2012
2013
2014
2015
2016
2017
2018
2019
2020
2022
Murders (per 100,000)
0 (0.0)
0 (0.0)
0 (0.0)
0 (0.0)
0 (0.0)
1 (19.2)
0 (0.0)
0 (0.0)
0 (0.0)
0 (0.0)
0 (0.0)
1 (18.1)
0 (0.0)
Rapes (per 100,000)
0 (0.0)
1 (20.2)
0 (0.0)
0 (0.0)
0 (0.0)
0 (0.0)
0 (0.0)
1 (18.7)
0 (0.0)
0 (0.0)
1 (18.2)
0 (0.0)
2 (40.7)
Robberies (per 100,000)
2 (37.6)
1 (20.2)
0 (0.0)
1 (19.5)
2 (38.7)
0 (0.0)
0 (0.0)
2 (37.4)
0 (0.0)
0 (0.0)
2 (36.4)
1 (18.1)
2 (40.7)
Assaults (per 100,000)
1 (18.8)
2 (40.3)
0 (0.0)
1 (19.5)
5 (96.6)
5 (96.0)
5 (94.7)
5 (93.4)
1 (18.5)
1 (18.3)
10 (181.8)
11 (199.0)
7 (142.5)
Burglaries (per 100,000)
58 (1,090)
67 (1,351)
47 (937.0)
58 (1,133)
48 (927.7)
40 (767.6)
33 (625.1)
38 (710.0)
51 (943.0)
28 (512.2)
44 (800.0)
25 (452.3)
32 (651.2)
Thefts (per 100,000)
105 (1,973)
105 (2,118)
102 (2,033)
141 (2,754)
116 (2,242)
78 (1,497)
105 (1,989)
68 (1,271)
103 (1,905)
90 (1,646)
89 (1,618)
76 (1,375)
97 (1,974)
Auto thefts (per 100,000)
7 (131.5)
5 (100.8)
2 (39.9)
4 (78.1)
8 (154.6)
2 (38.4)
12 (227.3)
4 (74.7)
5 (92.5)
14 (256.1)
5 (90.9)
10 (180.9)
13 (264.6)
Arson (per 100,000)
0 (0.0)
0 (0.0)
0 (0.0)
0 (0.0)
0 (0.0)
0 (0.0)
0 (0.0)
0 (0.0)
0 (0.0)
0 (0.0)
0 (0.0)
0 (0.0)
0 (0.0)
City-Data.com crime index
180.7
217.6
150.1
205.5
197.9
174.2
160.4
151.3
153.3
125.8
189.8
182.6
219.0
The City-Data.com crime index weighs serious crimes and violent crimes more heavily. Higher means more crime, U.S. average is 246.1. It adjusts for the number of visitors and daily workers commuting into cities.
Latest news from Indian Wells, CA collected exclusively by city-data.com from local newspapers, TV, and radio stations
Ancestries: English (14.4%), Irish (8.3%), Italian (7.0%), German (6.8%), American (6.6%), Scottish (5.5%).
Current Local Time: PST time zone
Land area: 13.2 square miles.
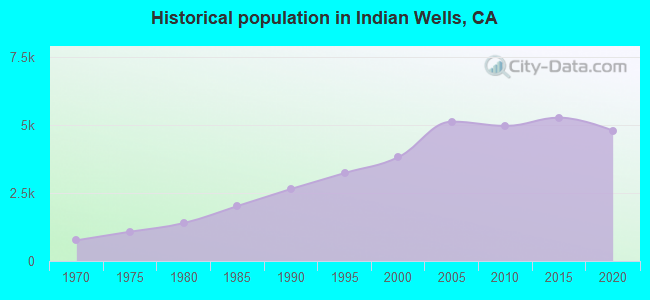
Population density: 367 people per square mile (very low).
402 residents are foreign born (2.6% Europe, 2.5% North America, 2.3% Asia).
This city:
8.2%
California:
26.5%
Median real estate property taxes paid for housing units with mortgages in 2022: $9,689 (0.9%) Median real estate property taxes paid for housing units with no mortgage in 2022: $10,616 (0.9%)
Nearest city with pop. 50,000+: Coachella Valley, CA (11.5 miles , pop. 118,932).
Nearest city with pop. 200,000+: Riverside, CA (62.7 miles , pop. 255,166).
Nearest city with pop. 1,000,000+: San Diego, CA (79.8 miles , pop. 1,223,400).
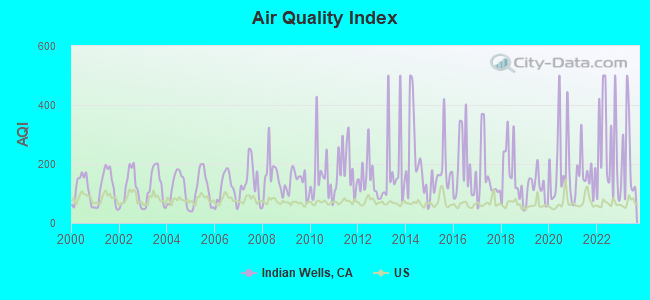
Air Quality Index (AQI) level in 2023 was 218. This is significantly worse than average.
City:
218
U.S.:
73
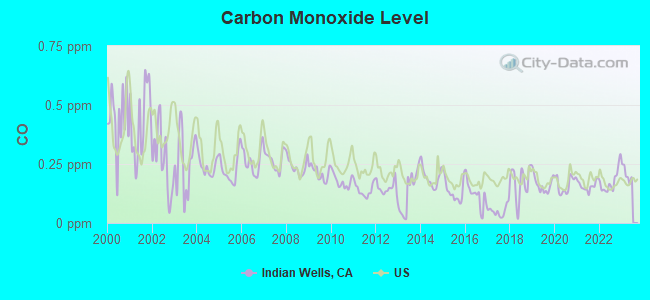
Carbon Monoxide (CO) [ppm] level in 2022 was 0.177. This is significantly better than average.Closest monitor was 6.9 miles away from the city center.
City:
0.177
U.S.:
0.251
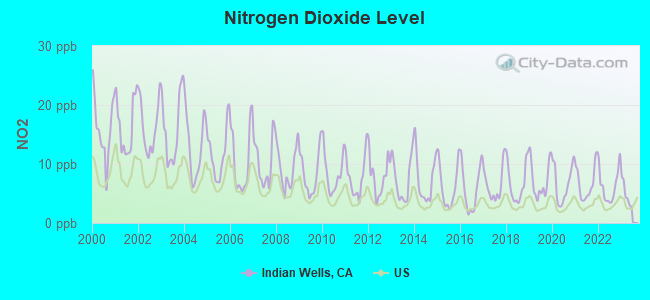
Nitrogen Dioxide (NO2) [ppb] level in 2022 was 6.26. This is worse than average.Closest monitor was 6.9 miles away from the city center.
City:
6.26
U.S.:
5.11
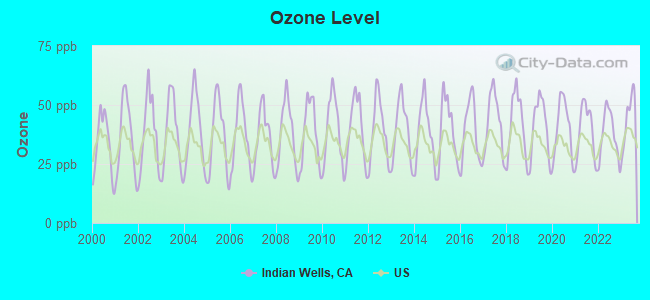
Ozone [ppb] level in 2023 was 44.4. This is worse than average.Closest monitor was 6.9 miles away from the city center.
City:
44.4
U.S.:
33.3
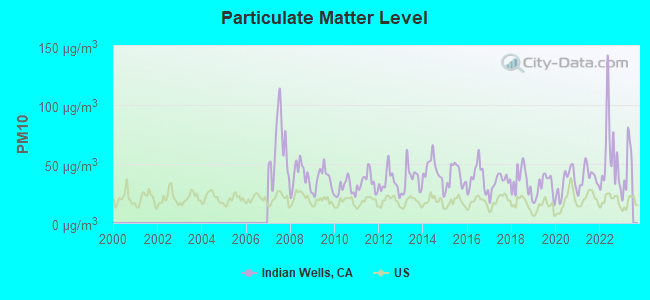
Particulate Matter (PM10) [µg/m3] level in 2022 was 55.7. This is significantly worse than average.Closest monitor was 7.3 miles away from the city center.
City:
55.7
U.S.:
19.2
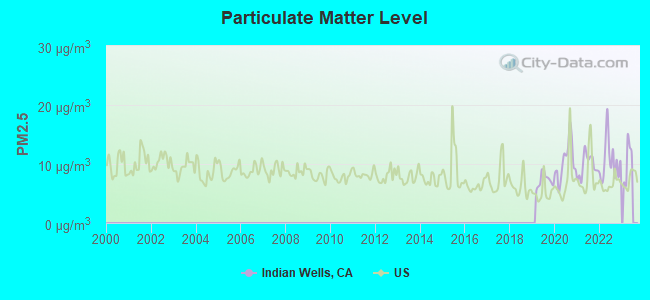
Particulate Matter (PM2.5) [µg/m3] level in 2022 was 10.5. This is worse than average.Closest monitor was 7.3 miles away from the city center.
City:
10.5
U.S.:
8.1
Earthquake activity:
Indian Wells-area historical earthquake activity is significantly above California state average. It is 6793% greater than the overall U.S. average.
On 6/28/1992 at 11:57:34, a magnitude 7.6 (6.2 MB, 7.6 MS, 7.3 MW, Depth: 0.7 mi, Class: Major, Intensity: VIII - XII) earthquake occurred 34.2 miles away from the city center, causing 3 deaths (1 shaking deaths, 2 other deaths) and 400 injuries, causing $100,000,000 total damage and $40,000,000 insured losses On 10/16/1999 at 09:46:44, a magnitude 7.4 (6.3 MB, 7.4 MS, 7.2 MW, 7.3 ML) earthquake occurred 55.5 miles away from the city center On 7/21/1952 at 11:52:14, a magnitude 7.7 (7.7 UK) earthquake occurred 175.9 miles away from Indian Wells center, causing $50,000,000 total damage On 5/19/1940 at 04:36:40, a magnitude 7.2 (7.2 UK) earthquake occurred 50.5 miles away from Indian Wells center, causing $33,000,000 total damage On 12/31/1934 at 18:45:56, a magnitude 7.1 (7.1 UK) earthquake occurred 78.8 miles away from Indian Wells center On 6/28/1992 at 15:05:30, a magnitude 6.9 (6.3 MB, 6.7 MS, 6.5 MW, 6.9 ME, Depth: 3.1 mi, Class: Strong, Intensity: VII - IX) earthquake occurred 48.1 miles away from the city center Magnitude types: body-wave magnitude (MB), energy magnitude (ME), local magnitude (ML), surface-wave magnitude (MS), moment magnitude (MW)
Natural disasters:
The number of natural disasters in Riverside County (46) is a lot greater than the US average (15). Major Disasters (Presidential) Declared: 27 Emergencies Declared: 1
Causes of natural disasters: Fires: 22, Floods: 20, Storms: 8, Winter Storms: 8, Landslides: 6, Mudslides: 5, Heavy Rains: 2, Earthquake: 1, Flash Flood: 1, Freeze: 1, Hurricane: 1, Tornado: 1, Tropical Storm: 1, Other: 1 (Note: some incidents may be assigned to more than one category).
Hospitals and medical centers near Indian Wells:
LA QUINTA KIDNEY CENTER, LLC (Dialysis Facility, about 3 miles away; LA QUINTA, CA)
COUNTRY VILLA RANCHO MIRAGE HEALTHCARE CTR (Nursing Home, about 5 miles away; RANCHO MIRAGE, CA)
KIDNEY INSTITUTE OF THE DESERT (Dialysis Facility, about 6 miles away; INDIO, CA)
MONTEREY PALMS HEALTHCARE CENTER (Nursing Home, about 7 miles away; PALM DESERT, CA)
CANYON SPRINGS (Hospital, about 9 miles away; CATHEDRAL CITY, CA)
CHARTER BHS OF SO CA PALM SPRINGS (Hospital, about 9 miles away; CATHEDRAL CITY, CA)
CATHEDRAL CITY DIALYSIS (Dialysis Facility, about 11 miles away; CATHEDRAL CITY, CA)
Amtrak stations near Indian Wells:
3 miles: PALM DESERT (MONTEREY AVE. & SAN GORGONIO WAY) - Bus Station . Services: fully wheelchair accessible, public payphones, snack bar, free short-term parking, call for taxi service, public transit connection.
7 miles: INDIO (45995 MONROE ST.) - Bus Station . Services: fully wheelchair accessible, public payphones, snack bar, free short-term parking, call for taxi service.
15 miles: PALM SPRINGS (300 N. INDIAN AVE.) - Bus Station . Services: fully wheelchair accessible, public payphones, free short-term parking, call for taxi service, public transit connection.
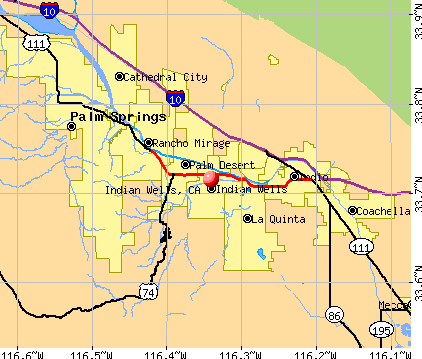
Notable locations in Indian Wells: Desert Horizons Country Club (A), Indian Wells Golf Resort (B), Indian Wells Country Club (C), Indian Wells Golf Course (D), El Dorado Golf Course (E), Indian Wells City Hall (F), Riverside County Fire Department Station 55 Indian Wells (G). Display/hide their locations on the map
Riverside County has a predicted average indoor radon screening level between 2 and 4 pCi/L (pico curies per liter) - Moderate Potential
Average household size:
This city:
1.8 people
California:
2.9 people
Percentage of family households:
This city:
60.1%
Whole state:
68.7%
Percentage of households with unmarried partners:
This city:
4.4%
Whole state:
7.2%
Likely homosexual households (counted as self-reported same-sex unmarried-partner households)
Lesbian couples: 0.3% of all households
Gay men: 1.0% of all households
6 people in group homes intended for adults in 2010
Banks with branches in Indian Wells (2011 data):
OneWest Bank, FSB: Indian Wells Branch at 74990 Hwy 111, branch established on 1989/12/01. Info updated 2011/07/21: Bank assets: $26,181.3 mil, Deposits: $15,408.4 mil, headquarters in Pasadena, CA, positive income, 79 total offices
Pacific Western Bank: Indian Wells Branch at 74-750 Highway 111, branch established on 1980/10/30. Info updated 2011/03/14: Bank assets: $5,513.1 mil, Deposits: $4,614.5 mil, headquarters in Los Angeles, CA, positive income, Commercial Lending Specialization, 78 total offices, Holding Company: Capgen Capital Group Ii Lp
Religion statistics for Indian Wells, CA (based on Riverside County data)
Religion
Adherents
Congregations
Catholic
602,765
51
Evangelical Protestant
240,306
741
Other
77,581
194
Mainline Protestant
29,535
103
Black Protestant
19,170
40
Orthodox
3,647
11
None
1,216,637
-
Source: Clifford Grammich, Kirk Hadaway, Richard Houseal, Dale E.Jones, Alexei Krindatch, Richie Stanley and Richard H.Taylor. 2012. 2010 U.S.Religion Census: Religious Congregations & Membership Study. Association of Statisticians of American Religious Bodies. Jones, Dale E., et al. 2002. Congregations and Membership in the United States 2000. Nashville, TN: Glenmary Research Center. Graphs represent county-level data
FAA Registered Aircraft Manufacturers and Dealers:
1
TROLL RAYMOND, 77420 Sky Mesa Ln, Indian Wells, CA 92210 Certificate: D004076 (Individual), Certificate Issue Date: 11/09/2009, Expiration Date: 11/08/2010
FAA Registered Aircraft:
4
Aircraft: CIRRUS DESIGN CORP SR20 (Category: Land, Seats: 4, Weight: Up to 12,499 Pounds), Engine: CONT MOTOR IO-360-ES (210 HP) (Reciprocating) N-Number: 28PF, N28PF, N-28PF, Serial Number: 2085, Year manufactured: 2011, Airworthiness Date: 05/31/2011, Certificate Issue Date: 04/16/2020 Registrant (LLC): All Square LLC, 75280 Hwy 111, Indian Wells, CA 92210
Aircraft: CCX-2300-0011 LLC LLC CCX-2300 (Category: Amphibian, Seats: 2, Weight: Up to 12,499 Pounds), Engine: LYCOMING IO-390 SER (210 HP) (Reciprocating) N-Number: 321SY, N321SY, N-321SY, Serial Number: CCX-2300-0011, Year manufactured: 2020, Airworthiness Date: 07/24/2020 Registrant (Individual): Pending Registration, 46428 War Bonnet Cir, Indian Wells, CA 92210
Aircraft: PIPER PA-24-250 (Category: Land, Seats: 4, Weight: Up to 12,499 Pounds, Speed: 135 mph), Engine: LYCOMING 0-540 SERIES (250 HP) (Reciprocating) N-Number: 6369P, N6369P, N-6369P, Serial Number: 24-1479, Year manufactured: 1959, Airworthiness Date: 10/29/1959, Certificate Issue Date: 06/07/1994 Registrant (Co-Owned): Cesar A Fernandez, 76845 Inca Dr, Indian Wells, CA 92210, Other Owners: Rita M Fernandez
Aircraft: RAYTHEON AIRCRAFT COMPANY A36 (Category: Land, Seats: 6, Weight: Up to 12,499 Pounds), Engine: Reciprocating N-Number: 654JH, N654JH, N-654JH, Serial Number: E-3545, Certificate Issue Date: 04/05/2010 Registrant (Co-Owned): William J Hammer, 45510 Cielito Dr, Indian Wells, CA 92210, Other Owners: Kim M Hammer
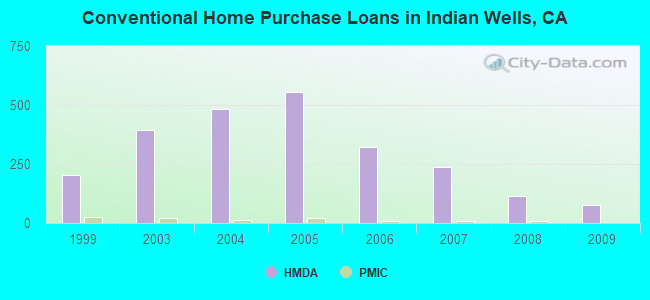
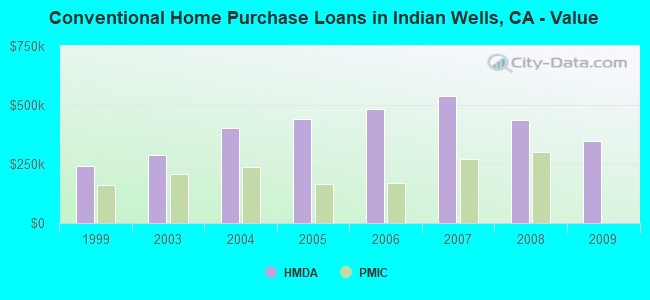
Home Mortgage Disclosure Act Aggregated Statistics For Year 2009 (Based on 4 partial tracts)
A) FHA, FSA/RHS & VA Home Purchase Loans
B) Conventional Home Purchase Loans
C) Refinancings
D) Home Improvement Loans
F) Non-occupant Loans on < 5 Family Dwellings (A B C & D)
G) Loans On Manufactured Home Dwelling (A B C & D)
Number
Average Value
Number
Average Value
Number
Average Value
Number
Average Value
Number
Average Value
Number
Average Value
LOANS ORIGINATED
15
$195,007
75
$346,040
255
$338,314
4
$157,308
143
$367,002
1
$345,930
APPLICATIONS APPROVED, NOT ACCEPTED
1
$178,960
11
$374,252
23
$328,217
1
$131,640
10
$422,961
0
$0
APPLICATIONS DENIED
6
$149,470
14
$370,267
78
$438,970
4
$245,660
37
$467,202
0
$0
APPLICATIONS WITHDRAWN
2
$209,020
18
$341,324
64
$375,313
3
$64,043
25
$403,956
0
$0
FILES CLOSED FOR INCOMPLETENESS
1
$170,500
1
$553,370
19
$363,093
0
$0
8
$342,616
0
$0
Aggregated Statistics For Year 2008 (Based on 4 partial tracts)
A) FHA, FSA/RHS & VA Home Purchase Loans
B) Conventional Home Purchase Loans
C) Refinancings
D) Home Improvement Loans
F) Non-occupant Loans on < 5 Family Dwellings (A B C & D)
G) Loans On Manufactured Home Dwelling (A B C & D)
Number
Average Value
Number
Average Value
Number
Average Value
Number
Average Value
Number
Average Value
Number
Average Value
LOANS ORIGINATED
8
$216,805
114
$437,579
112
$534,147
10
$264,396
113
$537,846
0
$0
APPLICATIONS APPROVED, NOT ACCEPTED
1
$300,860
14
$531,724
19
$526,157
2
$18,650
12
$660,822
0
$0
APPLICATIONS DENIED
2
$374,270
23
$540,505
66
$532,495
7
$164,093
25
$549,110
1
$37,840
APPLICATIONS WITHDRAWN
2
$216,385
16
$1,435,542
32
$486,942
3
$550,317
16
$474,274
0
$0
FILES CLOSED FOR INCOMPLETENESS
0
$0
4
$474,568
9
$543,892
1
$1,777,440
4
$734,920
0
$0
Aggregated Statistics For Year 2007 (Based on 4 partial tracts)
A) FHA, FSA/RHS & VA Home Purchase Loans
B) Conventional Home Purchase Loans
C) Refinancings
D) Home Improvement Loans
F) Non-occupant Loans on < 5 Family Dwellings (A B C & D)
G) Loans On Manufactured Home Dwelling (A B C & D)
Number
Average Value
Number
Average Value
Number
Average Value
Number
Average Value
Number
Average Value
Number
Average Value
LOANS ORIGINATED
2
$261,930
237
$539,215
255
$551,070
25
$486,684
209
$606,640
1
$84,540
APPLICATIONS APPROVED, NOT ACCEPTED
0
$0
45
$460,190
62
$477,559
7
$345,911
35
$475,309
0
$0
APPLICATIONS DENIED
0
$0
53
$413,532
112
$537,494
17
$262,117
37
$553,738
2
$91,005
APPLICATIONS WITHDRAWN
0
$0
31
$403,342
60
$524,114
6
$249,457
26
$614,003
0
$0
FILES CLOSED FOR INCOMPLETENESS
0
$0
4
$599,088
23
$483,506
2
$114,710
6
$296,893
0
$0
Aggregated Statistics For Year 2006 (Based on 4 partial tracts)
A) FHA, FSA/RHS & VA Home Purchase Loans
B) Conventional Home Purchase Loans
C) Refinancings
D) Home Improvement Loans
F) Non-occupant Loans on < 5 Family Dwellings (A B C & D)
G) Loans On Manufactured Home Dwelling (A B C & D)
Number
Average Value
Number
Average Value
Number
Average Value
Number
Average Value
Number
Average Value
Number
Average Value
LOANS ORIGINATED
2
$103,545
324
$484,721
311
$536,310
28
$439,752
241
$577,911
1
$78,180
APPLICATIONS APPROVED, NOT ACCEPTED
0
$0
50
$375,771
64
$427,317
2
$1,403,335
24
$432,994
1
$56,400
APPLICATIONS DENIED
0
$0
77
$480,658
101
$507,456
16
$395,916
41
$451,757
0
$0
APPLICATIONS WITHDRAWN
0
$0
40
$454,327
83
$524,548
5
$881,618
19
$447,373
0
$0
FILES CLOSED FOR INCOMPLETENESS
0
$0
8
$700,911
20
$299,994
1
$196,160
4
$503,470
0
$0
Aggregated Statistics For Year 2005 (Based on 4 partial tracts)
A) FHA, FSA/RHS & VA Home Purchase Loans
B) Conventional Home Purchase Loans
C) Refinancings
D) Home Improvement Loans
F) Non-occupant Loans on < 5 Family Dwellings (A B C & D)
G) Loans On Manufactured Home Dwelling (A B C & D)
Number
Average Value
Number
Average Value
Number
Average Value
Number
Average Value
Number
Average Value
Number
Average Value
LOANS ORIGINATED
3
$97,187
553
$439,575
353
$437,219
29
$294,426
360
$451,458
1
$97,750
APPLICATIONS APPROVED, NOT ACCEPTED
0
$0
67
$442,943
47
$394,368
3
$271,960
30
$322,679
1
$24,460
APPLICATIONS DENIED
0
$0
102
$466,641
81
$408,318
15
$253,281
44
$390,901
3
$149,443
APPLICATIONS WITHDRAWN
0
$0
89
$542,535
65
$387,127
4
$196,498
35
$402,953
0
$0
FILES CLOSED FOR INCOMPLETENESS
0
$0
19
$312,474
26
$410,544
0
$0
7
$284,586
0
$0
Aggregated Statistics For Year 2004 (Based on 4 partial tracts)
A) FHA, FSA/RHS & VA Home Purchase Loans
B) Conventional Home Purchase Loans
C) Refinancings
D) Home Improvement Loans
E) Loans on Dwellings For 5+ Families
F) Non-occupant Loans on < 5 Family Dwellings (A B C & D)
G) Loans On Manufactured Home Dwelling (A B C & D)
Number
Average Value
Number
Average Value
Number
Average Value
Number
Average Value
Number
Average Value
Number
Average Value
Number
Average Value
LOANS ORIGINATED
3
$131,353
485
$402,985
377
$348,680
26
$289,100
1
$599,450
315
$380,203
1
$53,270
APPLICATIONS APPROVED, NOT ACCEPTED
0
$0
53
$357,994
69
$273,392
3
$170,727
0
$0
31
$315,545
1
$52,790
APPLICATIONS DENIED
0
$0
67
$492,444
115
$316,036
15
$167,204
0
$0
37
$387,469
2
$72,440
APPLICATIONS WITHDRAWN
0
$0
48
$407,999
86
$312,809
5
$231,176
0
$0
29
$363,633
0
$0
FILES CLOSED FOR INCOMPLETENESS
0
$0
12
$678,258
30
$305,951
2
$76,875
0
$0
8
$477,475
0
$0
Aggregated Statistics For Year 2003 (Based on 4 partial tracts)
A) FHA, FSA/RHS & VA Home Purchase Loans
B) Conventional Home Purchase Loans
C) Refinancings
D) Home Improvement Loans
F) Non-occupant Loans on < 5 Family Dwellings (A B C & D)
Number
Average Value
Number
Average Value
Number
Average Value
Number
Average Value
Number
Average Value
LOANS ORIGINATED
7
$98,723
395
$286,523
800
$296,263
10
$68,592
401
$295,635
APPLICATIONS APPROVED, NOT ACCEPTED
0
$0
34
$336,769
93
$307,472
3
$83,297
37
$331,655
APPLICATIONS DENIED
0
$0
33
$234,098
113
$277,699
6
$115,547
26
$292,174
APPLICATIONS WITHDRAWN
1
$136,650
56
$254,419
108
$261,706
1
$703,240
33
$274,512
FILES CLOSED FOR INCOMPLETENESS
0
$0
5
$351,442
28
$273,837
0
$0
8
$262,019
Aggregated Statistics For Year 1999 (Based on 1 partial tract)
A) FHA, FSA/RHS & VA Home Purchase Loans
B) Conventional Home Purchase Loans
C) Refinancings
D) Home Improvement Loans
F) Non-occupant Loans on < 5 Family Dwellings (A B C & D)
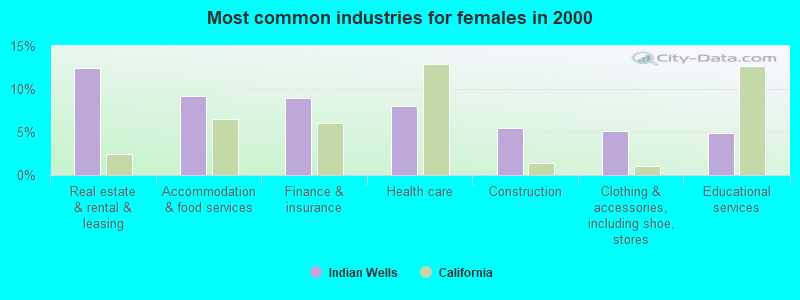
#5 on the list of "Top 101 cities with largest percentage of females in industries: real estate and rental and leasing (population 5,000+)"
#17 on the list of "Top 101 cities with the most residents born in Indonesia (population 500+)"
#19 on the list of "Top 101 cities with the highest percentage of workers working at home, population 5,000+"
#23 on the list of "Top 101 cities with largest percentage of males in industries: real estate and rental and leasing (population 5,000+)"
#32 on the list of "Top 101 cities with largest percentage of males in occupations: legal occupations (population 5,000+)"
#50 on the list of "Top 101 cities with the most residents born in Japan (population 500+)"
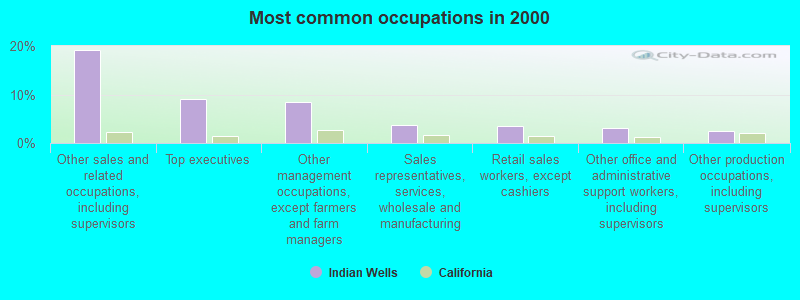
#54 on the list of "Top 101 cities with largest percentage of males in occupations: management occupations (population 5,000+)"
#58 on the list of "Top 101 cities with the largest percentage of likely gay men couples (counted as self-reported male-male unmarried-partner households) (population 5,000+)"
#61 on the list of "Top 101 cities with the most people taking a motorcycle to work (population 5,000+)"
#78 on the list of "Top 101 cities with largest percentage of females in industries: other services, except public administration (population 5,000+)"
#86 on the list of "Top 100 cities with oldest residents"
#14 (92210) on the list of "Top 101 zip codes with the smallest percentage of returns reporting salary or wage in 2012 (pop 1,000+)"
#24 (92210) on the list of "Top 101 zip codes with the largest percentage of taxpayers using charity contributions deductions in 2012 (pop 1,000+)"
#38 (92210) on the list of "Top 101 zip codes with the largest percentage of taxpayers reporting taxable interest in 2012 (pop 1,000+)"
#69 (92210) on the list of "Top 101 zip codes with the largest percentage of taxpayers reporting net capital gain/loss in 2012 (pop 1,000+)"
#95 (92210) on the list of "Top 101 zip codes with the highest 2012 average taxable interest for individuals (pop 1,000+)"
#3 on the list of "Top 101 counties with the highest lead air pollution readings in 2012 (µg/m3)"
#4 on the list of "Top 101 counties with the highest ground withdrawal of fresh water for public supply"
#11 on the list of "Top 101 counties with the most Catholic adherents"
#11 on the list of "Top 101 counties with the highest total withdrawal of fresh water for public supply"
#12 on the list of "Top 101 counties with the highest carbon monoxide air pollution readings in 2012 (ppm)"


 Recent articles from our blog. Our writers, many of them Ph.D. graduates or candidates, create easy-to-read articles on a wide variety of topics.

 (11.5 miles