Estimated zip code population in 2022: 51,532 Zip code population in 2010: 51,151 Zip code population in 2000: 43,129
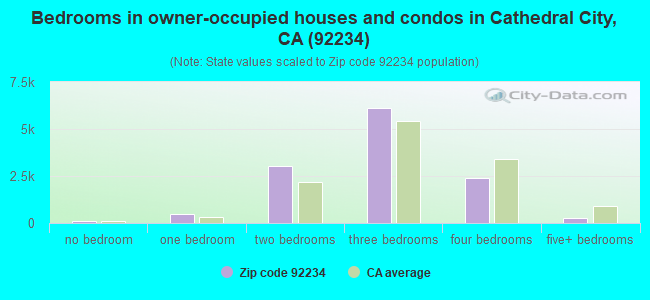
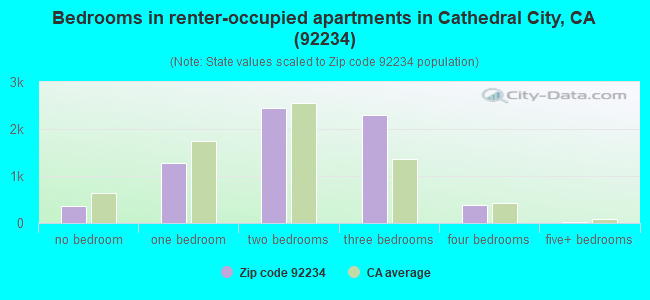
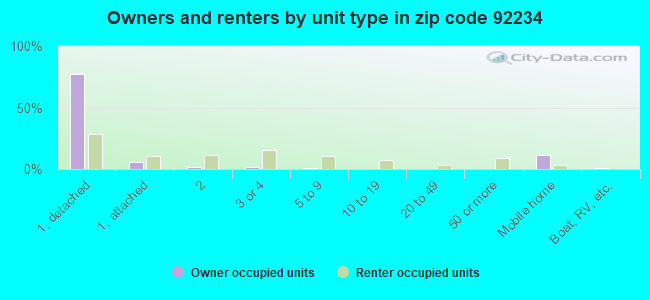
Houses and condos: 23,682 Renter-occupied apartments: 6,822
% of renters here:
36%
State:
44%
March 2022 cost of living index in zip code 92234: 82.2 (low, U.S. average is 100)
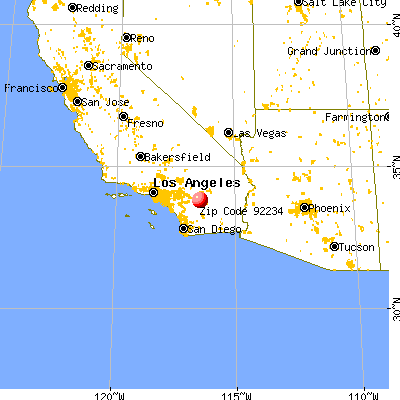
Land area: 15.7 sq. mi. Water area: 0.3 sq. mi.
Population density: 3,275 people per square mile
(average).
OSM Map
General Map
Google Map
MSN Map
OSM Map
General Map
Google Map
MSN Map
OSM Map
General Map
Google Map
MSN Map
OSM Map
General Map
Google Map
MSN Map
Please wait while loading the map...
Real estate property taxes paid for housing units in 2022:
This zip code:
0.9% ($3,614)
California:
0.7% ($4,831)
Median real estate property taxes paid for housing units with mortgages in 2022: $4,079 (0.9%) Median real estate property taxes paid for housing units with no mortgage in 2022: $2,920 (0.8%)
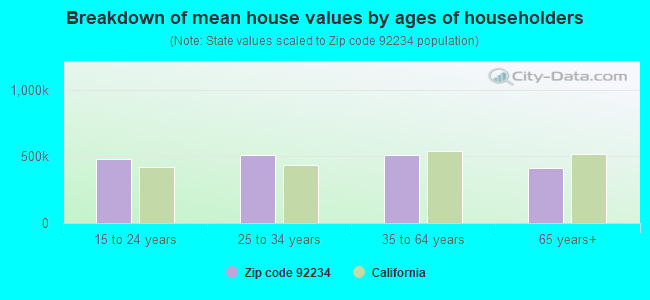
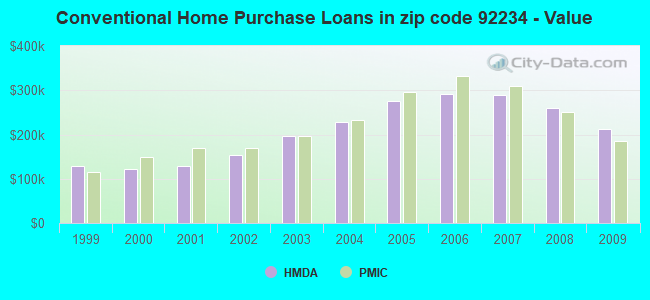
Estimated median house/condo value in 2022: $414,577
92234:
$414,577
California:
$715,900
According to our research of California and other state lists, there were 56 registered sex offenders living in 92234 zip code as of April 27, 2024. The ratio of all residents to sex offenders in zip code 92234 is 965 to 1. The ratio of registered sex offenders to all residents in this zip code is lower than the state average.
Median resident age:
This zip code:
41.2 years
California median age:
37.9 years
Average household size:
This zip code:
2.7 people
California:
2.8 people
Averages for the 2020 tax year for zip code 92234, filed in 2021:
Average Adjusted Gross Income (AGI) in 2020: $47,636 (Individual Income Tax Returns)
Here:
$47,636
State:
$95,910
Salary/wage: $40,535 (reported on 77.4% of returns)
Here:
$40,535
State:
$77,331
(% of AGI for various income ranges: 1215.8% for AGIs below $25k, 3645.4% for AGIs $25k-50k, 6996.3% for AGIs $50k-75k, 10210.4% for AGIs $75k-100k, 17806.2% for AGIs $100k-200k, 55825.0% for AGIs over 200k)
Taxable interest for individuals: $803 (reported on 27.0% of returns)
This zip code:
$803
California:
$2,294
(% of AGI for various income ranges: 12.9% for AGIs below $25k, 14.9% for AGIs $25k-50k, 33.6% for AGIs $50k-75k, 76.4% for AGIs $75k-100k, 137.9% for AGIs $100k-200k, 624.3% for AGIs over 200k)
Ordinary dividends: $4,148 (reported on 10.8% of returns)
Here:
$4,148
State:
$10,949
(% of AGI for various income ranges: 20.7% for AGIs below $25k, 24.5% for AGIs $25k-50k, 80.7% for AGIs $50k-75k, 168.1% for AGIs $75k-100k, 305.5% for AGIs $100k-200k, 1372.1% for AGIs over 200k)
Net capital gain/loss in AGI: +$10,921 (reported on 11.0% of returns)
Here:
+$10,921
State:
+$49,306
(% of AGI for various income ranges: 6.6% for AGIs below $25k, 32.4% for AGIs $25k-50k, 91.4% for AGIs $50k-75k, 218.9% for AGIs $75k-100k, 938.1% for AGIs $100k-200k, 9549.3% for AGIs over 200k)
Profit/loss from business: +$11,249 (reported on 21.1% of returns)
Here:
+$11,249
State:
+$15,671
(% of AGI for various income ranges: 258.9% for AGIs below $25k, 292.3% for AGIs $25k-50k, 429.6% for AGIs $50k-75k, 503.4% for AGIs $75k-100k, 829.5% for AGIs $100k-200k, 3515.0% for AGIs over 200k)
Taxable individual retirement arrangement distribution: $19,515 (reported on 6.2% of returns)
92234:
$19,515
California:
$23,505
(% of AGI for various income ranges: 43.6% for AGIs below $25k, 75.0% for AGIs $25k-50k, 208.6% for AGIs $50k-75k, 407.1% for AGIs $75k-100k, 949.4% for AGIs $100k-200k, 3330.7% for AGIs over 200k)
Self-employed (Keogh) retirement plans: $17,743 (reported on 0.3% of returns)
92234:
$17,743
California:
$30,163
(% of AGI for various income ranges: 14.1% for AGIs $50k-75k, 89.6% for AGIs $100k-200k)
Total itemized deductions: $28,037 (reported on 9.7% of returns)
Here:
$28,037
State:
$39,517
(% of AGI for various income ranges: 66.3% for AGIs below $25k, 177.1% for AGIs $25k-50k, 533.1% for AGIs $50k-75k, 983.5% for AGIs $75k-100k, 1921.3% for AGIs $100k-200k, 9177.1% for AGIs over 200k)
Charity contributions: $4,696 (reported on 7.4% of returns)
Here:
$4,696
State:
$12,598
(% of AGI for various income ranges: 3.9% for AGIs below $25k, 21.4% for AGIs $25k-50k, 58.5% for AGIs $50k-75k, 130.0% for AGIs $75k-100k, 288.9% for AGIs $100k-200k, 1197.9% for AGIs over 200k)
Taxes paid: $7,723 (reported on 9.7% of returns)
92234:
$7,723
State:
$8,807
(% of AGI for various income ranges: 14.2% for AGIs below $25k, 45.3% for AGIs $25k-50k, 163.2% for AGIs $50k-75k, 318.1% for AGIs $75k-100k, 618.2% for AGIs $100k-200k, 1537.9% for AGIs over 200k)
Earned income credit: $2,208 (reported on 20.3% of returns)
Here:
$2,208
State:
$2,074
(% of AGI for various income ranges: 104.9% for AGIs below $25k, 88.0% for AGIs $25k-50k, 2.5% for AGIs $50k-75k)
Percentage of individuals using paid preparers for their 2020 taxes: 90.9%
Here:
91%
State:
92%
(% for various income ranges: 88.1% for AGIs below $25k, 91.7% for AGIs $25k-50k, 93.0% for AGIs $50k-75k, 92.3% for AGIs $75k-100k, 94.1% for AGIs $100k-200k, 97.8% for AGIs over 200k)
Averages for the 2012 tax year for zip code 92234, filed in 2013:
Average Adjusted Gross Income (AGI) in 2012: $37,485 (Individual Income Tax Returns)
Here:
$37,485
State:
$72,726
Salary/wage: $33,926 (reported on 79.4% of returns)
Here:
$33,926
State:
$59,079
(% of AGI for various income ranges: 72.5% for AGIs below $25k, 79.1% for AGIs $25k-50k, 74.0% for AGIs $50k-75k, 73.5% for AGIs $75k-100k, 68.9% for AGIs $100k-200k, 46.3% for AGIs over 200k)
Taxable interest for individuals: $866 (reported on 26.4% of returns)
This zip code:
$866
California:
$2,146
(% of AGI for various income ranges: 0.7% for AGIs below $25k, 0.6% for AGIs $25k-50k, 0.6% for AGIs $50k-75k, 0.4% for AGIs $75k-100k, 0.6% for AGIs $100k-200k, 0.8% for AGIs over 200k)
Ordinary dividends: $3,678 (reported on 10.2% of returns)
Here:
$3,678
State:
$9,308
(% of AGI for various income ranges: 0.9% for AGIs below $25k, 0.9% for AGIs $25k-50k, 1.3% for AGIs $50k-75k, 1.0% for AGIs $75k-100k, 0.9% for AGIs $100k-200k, 1.0% for AGIs over 200k)
Net capital gain/loss in AGI: +$4,214 (reported on 9.4% of returns)
Here:
+$4,214
State:
+$30,460
(% of AGI for various income ranges: 0.4% for AGIs $50k-75k, 0.4% for AGIs $75k-100k, 1.8% for AGIs $100k-200k, 8.2% for AGIs over 200k)
Profit/loss from business: +$11,069 (reported on 20.1% of returns)
Here:
+$11,069
State:
+$17,064
(% of AGI for various income ranges: 15.0% for AGIs below $25k, 5.9% for AGIs $25k-50k, 3.4% for AGIs $50k-75k, 2.8% for AGIs $75k-100k, 2.8% for AGIs $100k-200k, 2.7% for AGIs over 200k)
Taxable individual retirement arrangement distribution: $13,321 (reported on 6.5% of returns)
92234:
$13,321
California:
$19,557
(% of AGI for various income ranges: 2.0% for AGIs below $25k, 1.9% for AGIs $25k-50k, 2.4% for AGIs $50k-75k, 2.8% for AGIs $75k-100k, 2.9% for AGIs $100k-200k, 2.0% for AGIs over 200k)
Self-employment retirement plans: $13,250 (reported on 0.2% of returns)
92234:
$13,250
California:
$24,530
Total itemized deductions: $20,528 (29% of AGI, reported on 27.6% of returns)
Here:
$20,528
State:
$34,004
Here:
29.0% of AGI
State:
22.7% of AGI
(% of AGI for various income ranges: 9.6% for AGIs below $25k, 12.9% for AGIs $25k-50k, 16.6% for AGIs $50k-75k, 18.3% for AGIs $75k-100k, 18.4% for AGIs $100k-200k, 18.6% for AGIs over 200k)
Charity contributions: $2,202 (reported on 21.0% of returns)
Here:
$2,202
State:
$4,659
(% of AGI for various income ranges: 0.5% for AGIs below $25k, 1.0% for AGIs $25k-50k, 1.4% for AGIs $50k-75k, 1.6% for AGIs $75k-100k, 2.0% for AGIs $100k-200k, 1.2% for AGIs over 200k)
Taxes paid: $6,158 (reported on 27.5% of returns)
92234:
$6,158
State:
$14,448
(% of AGI for various income ranges: 2.1% for AGIs below $25k, 3.1% for AGIs $25k-50k, 4.5% for AGIs $50k-75k, 5.9% for AGIs $75k-100k, 6.7% for AGIs $100k-200k, 7.2% for AGIs over 200k)
Earned income credit: $2,608 (reported on 28.4% of returns)
Here:
$2,608
State:
$2,286
(% of AGI for various income ranges: 8.2% for AGIs below $25k, 1.7% for AGIs $25k-50k)
Percentage of individuals using paid preparers for their 2012 taxes: 72.2%
Here:
72%
State:
64%
(% for various income ranges: 71.5% for AGIs below $25k, 73.1% for AGIs $25k-50k, 72.7% for AGIs $50k-75k, 69.6% for AGIs $75k-100k, 74.3% for AGIs $100k-200k, 83.3% for AGIs over 200k)
Averages for the 2004 tax year for zip code 92234, filed in 2005:
Average Adjusted Gross Income (AGI) in 2004: $36,836 (Individual Income Tax Returns)
Here:
$36,836
State:
$58,600
Salary/wage: $33,269 (reported on 81.2% of returns)
Here:
$33,269
State:
$49,455
(% of AGI for various income ranges: 184.8% for AGIs below $10k, 77.2% for AGIs $10k-25k, 80.2% for AGIs $25k-50k, 77.7% for AGIs $50k-75k, 78.7% for AGIs $75k-100k, 53.7% for AGIs over 100k)
Taxable interest for individuals: $1,530 (reported on 36.5% of returns)
This zip code:
$1,530
California:
$2,365
(% of AGI for various income ranges: 9.7% for AGIs below $10k, 1.6% for AGIs $10k-25k, 1.0% for AGIs $25k-50k, 1.3% for AGIs $50k-75k, 1.1% for AGIs $75k-100k, 2.1% for AGIs over 100k)
Taxable dividends: $2,742 (reported on 14.8% of returns)
Here:
$2,742
State:
$4,746
(% of AGI for various income ranges: 11.4% for AGIs below $10k, 1.2% for AGIs $10k-25k, 0.9% for AGIs $25k-50k, 0.8% for AGIs $50k-75k, 0.7% for AGIs $75k-100k, 1.3% for AGIs over 100k)
Net capital gain/loss: +$13,330 (reported on 14.3% of returns)
Here:
+$13,330
State:
+$23,418
(% of AGI for various income ranges: -6.3% for AGIs below $10k, -0.2% for AGIs $10k-25k, 0.6% for AGIs $25k-50k, 1.3% for AGIs $50k-75k, 1.8% for AGIs $75k-100k, 17.9% for AGIs over 100k)
Profit/loss from business: +$11,698 (reported on 19.4% of returns)
Here:
+$11,698
State:
+$16,826
(% of AGI for various income ranges: 3.1% for AGIs below $10k, 10.3% for AGIs $10k-25k, 6.4% for AGIs $25k-50k, 4.3% for AGIs $50k-75k, 4.6% for AGIs $75k-100k, 5.8% for AGIs over 100k)
IRA payment deduction: $2,909 (reported on 2.4% of returns)
92234:
$2,909
California:
$3,192
(% of AGI for various income ranges: 0.6% for AGIs below $10k, 0.2% for AGIs $10k-25k, 0.2% for AGIs $25k-50k, 0.2% for AGIs $50k-75k, 0.2% for AGIs $75k-100k, 0.2% for AGIs over 100k)
Self-employed pension: $11,562 (reported on 0.7% of returns)
Here:
$11,562
California:
$17,688
(% of AGI for various income ranges: 0.4% for AGIs below $10k, 0.1% for AGIs $25k-50k, 0.1% for AGIs $50k-75k, 0.3% for AGIs $75k-100k, 0.5% for AGIs over 100k)
Total itemized deductions: $19,598 (30% of AGI, reported on 37.0% of returns)
Here:
$19,598
State:
$28,113
Here:
30.4% of AGI
State:
25.3% of AGI
(% of AGI for various income ranges: 48.3% for AGIs below $10k, 13.2% for AGIs $10k-25k, 18.9% for AGIs $25k-50k, 22.9% for AGIs $50k-75k, 24.2% for AGIs $75k-100k, 18.4% for AGIs over 100k)
Charity contributions deductions: $2,175 (3% of AGI, reported on 30.4% of returns)
Here:
$2,175
State:
$3,923
Here:
3.2% of AGI
State:
3.3% of AGI
(% of AGI for various income ranges: 2.0% for AGIs below $10k, 0.9% for AGIs $10k-25k, 1.5% for AGIs $25k-50k, 2.1% for AGIs $50k-75k, 2.4% for AGIs $75k-100k, 2.1% for AGIs over 100k)
Total tax: $4,928 (reported on 68.7% of returns)
92234:
$4,928
State:
$10,761
(% of AGI for various income ranges: 10.0% for AGIs below $10k, 3.9% for AGIs $10k-25k, 5.7% for AGIs $25k-50k, 8.1% for AGIs $50k-75k, 10.1% for AGIs $75k-100k, 16.1% for AGIs over 100k)
Earned income credit: $1,956 (reported on 23.4% of returns)
Here:
$1,956
State:
$1,763
Percentage of individuals using paid preparers for their 2004 taxes: 74.8%
Here:
75%
State:
66%
(% for various income ranges: 68.1% for AGIs below $10k, 76.5% for AGIs $10k-25k, 76.2% for AGIs $25k-50k, 74.2% for AGIs $50k-75k, 74.1% for AGIs $75k-100k, 81.4% for AGIs over 100k)
Likely homosexual households (counted as self-reported same-sex unmarried-partner households)
Lesbian couples: 0.4% of all households
Gay men: 2.1% of all households
Household received Food Stamps/SNAP in the past 12 months: 2,786 Household did not receive Food Stamps/SNAP in the past 12 months: 16,486
Women who had a birth in the past 12 months: 791 (574 now married, 216 unmarried) Women who did not have a birth in the past 12 months: 10,347 (4,172 now married, 6,171 unmarried)
Housing units in zip code 92234 with a mortgage: 7,359 (416 second mortgage, 44 home equity loan, 277 both second mortgage and home equity loan) Houses without a mortgage: 220
Median monthly owner costs for units with a mortgage: $1,970 Median monthly owner costs for units without a mortgage: $795
Residents with income below the poverty level in 2022:
This zip code:
17.2%
Whole state:
12.2%
Residents with income below 50% of the poverty level in 2022:
This zip code:
11.2%
Whole state:
6.2%
Median number of rooms in houses and condos:
Here:
5.3
State:
6.0
Median number of rooms in apartments:
Here:
4.1
State:
3.9
Notable locations in this zip code not listed on our city pages
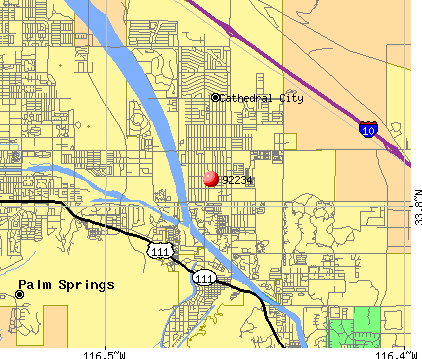
Notable locations in zip code 92234: McPherson Ranch (A), Outdoor Resorts of America Golf Course (B), Olympic Golf and Tennis Driving Range (C), Desert Princess Resort and Country Club (D), De Anza Country Club (E), Cathedral City Branch Riverside City and County Public Library (F), Cathedral City Fire Department Station 413 (G), Cathedral City Fire Department Station 411 (H), Cathedral City Fire Department Station 412 (I). Display/hide their locations on the map
Shopping Centers: Canyon Plaza Shopping Center (1), Date Palm Shopping Center (2), Century Plaza Shopping Center (3), Cathedral Village Shopping Center (4), Cathedral Plaza Shopping Center (5), Cathedral City Shopping Plaza Shopping Center (6), Cathedral City Marketplace Shopping Center (7). Display/hide their locations on the map
Parks in zip code 92234 include: Agua Caliente Park (1), Century Park (2), Panorama Park (3), Second Street Park (4). Display/hide their locations on the map
5,831 married couples with children.
2,302 single-parent households (627 men, 1,675 women).
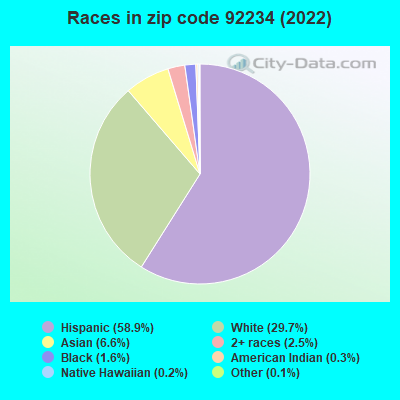
47.6% of residents of 92234 zip code speak English at home.
45.6% of residents speak Spanish at home (69% very well, 15% well, 13% not well, 4% not at all).
1.7% of residents speak other Indo-European language at home (78% very well, 14% well, 8% not well).
4.8% of residents speak Asian or Pacific Island language at home (53% very well, 37% well, 7% not well, 3% not at all).
0.3% of residents speak other language at home (89% very well, 11% well).
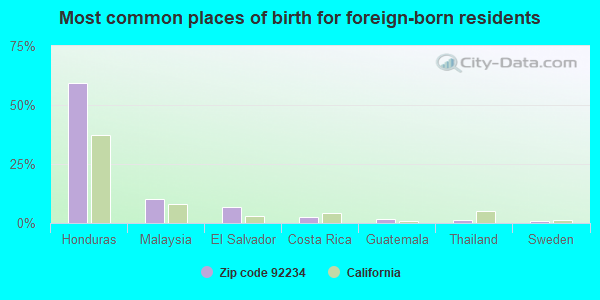
Foreign born population: 15,289 (29.7%) (53.5% of them are naturalized citizens)
This zip code:
29.7%
Whole state:
26.7%
59%Honduras
10%Malaysia
7%El Salvador
3%Costa Rica
1%Guatemala
1%Thailand
1%Sweden
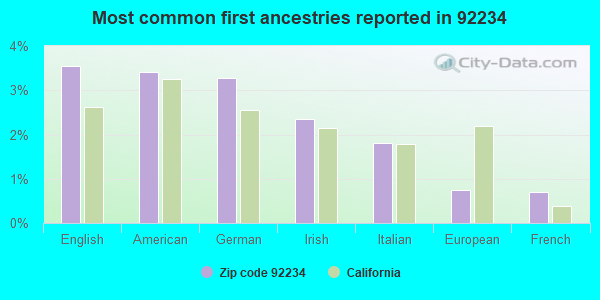
4%English
3%American
3%German
2%Irish
2%Italian
1%European
1%French
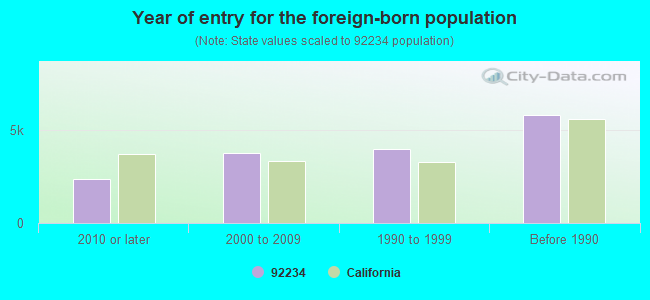
Year of entry for the foreign-born population
2,3502010 or later
3,7792000 to 2009
3,9531990 to 1999
5,802Before 1990
Major facilities with environmental interests located in this zip code:
CHAMPION MITSUBISHI (68130 KYLE RD in CATHEDRAL CITY, CA)
STATE MASTER (California - Hazardous Waste Tracking) - HAZARDOU WASTE PROGRAM Small Quantity Generators, between 100 kg and 1000 kg of hazardous waste/month (Resource Conservation and Recovery Act (tracking hazardous waste)) - notification Organizations: PALM SPRINGS MITSUBISHI (CONTACT/OPERATOR)
, PALM SPRINGS AUTOMOTIVE GROUP INC (CONTACT/OWNER)
AAMCO TRANSMISSION (68 680 RAMON RD STE 1 in CATHEDRAL CITY, CA)
STATE MASTER (California - Hazardous Waste Tracking) - HAZARDOU WASTE PROGRAM Small Quantity Generators, between 100 kg and 1000 kg of hazardous waste/month (Resource Conservation and Recovery Act (tracking hazardous waste)) - notification Organizations: L AND T TRANSMISSION DYNAMIC (CONTACT/OWNER)
EQUILON ENTERPRISES (67-455 E PALM CANYON in CATHEDRAL CITY, CA) . Federal Facility
STATE MASTER (California - Hazardous Waste Tracking) - HAZARDOU WASTE PROGRAM Small Quantity Generators, between 100 kg and 1000 kg of hazardous waste/month (Resource Conservation and Recovery Act (tracking hazardous waste)) - notification Alternative names: SHELL OIL CO
JESSUP AUTO PLAZA (68 111 E PALM CANYON DR in CATHEDRAL CITY, CA)
STATE MASTER (California - Hazardous Waste Tracking) - HAZARDOU WASTE PROGRAM Small Quantity Generators, between 100 kg and 1000 kg of hazardous waste/month (Resource Conservation and Recovery Act (tracking hazardous waste)) - notification Organizations: JESSUP AND DUTTON L L C (CONTACT/OWNER)
JIMMY EQUIPMENT (68361 KIELY RD in CATHEDRAL CITY, CA)
STATE MASTER (California - Hazardous Waste Tracking) - HAZARDOU WASTE PROGRAM Small Quantity Generators, between 100 kg and 1000 kg of hazardous waste/month (Resource Conservation and Recovery Act (tracking hazardous waste)) - notification Organizations: JAMES GARCIA (CONTACT/OWNER)
LANDAU ELEMENTARY (30310 LANDAU BLVD. in CATHEDRAL CITY, CA)
(National Center for Education Statistics) - STATE ID-6107601 Organizations: PALM SPRINGS UNIFIED (SCHOOL DISTRICT)
MOUNT SAN JACINTO HIGH (CONT.) (30800 LANDAU BLVD. in CATHEDRAL CITY, CA)
(National Center for Education Statistics) - STATE ID-3331121 Organizations: PALM SPRINGS UNIFIED (SCHOOL DISTRICT)
CATHEDRAL CITY ELEMENTARY (2ND & VAN FLEET STS. in CATHEDRAL CITY, CA)
(National Center for Education Statistics) - STATE ID-6032403 Organizations: PALM SPRINGS UNIFIED (SCHOOL DISTRICT)
CATHEDRAL CITY HIGH (69250 DINAH SHARE DR. in CATHEDRAL CITY, CA)
(National Center for Education Statistics) - STATE ID-3330578 Organizations: PALM SPRINGS UNIFIED (SCHOOL DISTRICT)
EXXONMOBIL OIL CORP. (68-990 RAMON RD in CATHEDRAL CITY, CA)
HAZARDOUS WASTE BIENNIAL REPORTER (Resource Conservation and Recovery Act (tracking hazardous waste)) Large Quantity Generators, more that 1000 kg of hazardous waste/month (Resource Conservation and Recovery Act (tracking hazardous waste)) Organizations: EXXONMOBIL OIL CORPORATION (CONTACT/OWNER)
MR ROGERS AUTO BODY (68 350 KIELEY in CATHEDRAL CITY, CA)
(Resource Conservation and Recovery Act (tracking hazardous waste)) Organizations: LARRY ROGERS (CONTACT/OWNER)
EDOM HILL DISPOSAL SITE (70-100 EDOM HILL ROAD in CATHEDRAL CITY, CA)
CRITERIA AND HAZARDOUS AIR POLLUTANT INVENTORY (Inventory of air pollution sources) REFUSE DISPOSAL (Solid waste facilities tracking) Business SIC classification: REFUSE SYSTEMS Business NAICS classification: SOLID WASTE LANDFILL. Organizations: COUNTY OF RIVERSIDE WASTE MGMT DEPT (CONTACT/OPERATOR)
ELITE CLEANERS (68 363 HWY 111 in CATHEDRAL CITY, CA)
Small Quantity Generators, between 100 kg and 1000 kg of hazardous waste/month (Resource Conservation and Recovery Act (tracking hazardous waste)) Organizations: SOOK LEE (CONTACT/OWNER)
Housing units lacking complete plumbing facilities: 0.5% Housing units lacking complete kitchen facilities: 0.5%
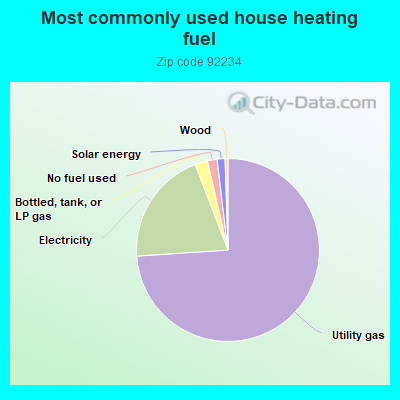
73.8%Utility gas
20.2%Electricity
2.2%Bottled, tank, or LP gas
1.7%No fuel used
1.4%Solar energy
0.5%Wood
Population in 1990: 29,640. Population change in the 1990s: +13,489 (+45.5%).
Place of birth for U.S.-born residents:
This state: 26,570
Northeast: 1,887
Midwest: 2,978
South: 2,205
West: 1,697
46% of the 92234 zip code residents lived in the same house 5 years ago. Out of people who lived in different houses, 68% lived in this county. Out of people who lived in different counties, 50% lived in California.
92% of the 92234 zip code residents lived in the same house 1 year ago. Out of people who lived in different houses, 46% moved from this county. Out of people who lived in different houses, 34% moved from different county within same state. Out of people who lived in different houses, 12% moved from different state. Out of people who lived in different houses, 11% moved from abroad.
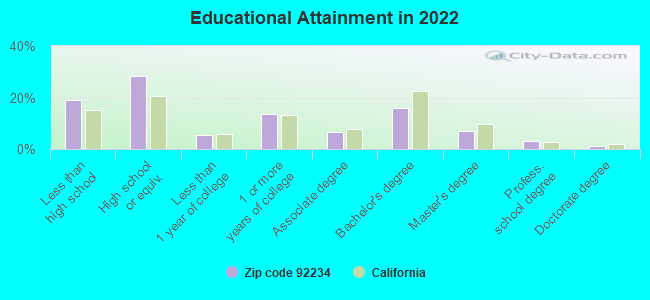
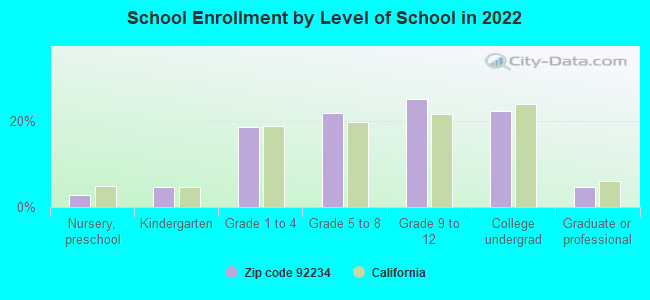
Private vs. public school enrollment:
Students in private schools in grades 1 to 8 (elementary and middle school): 196
Here:
4.5%
California:
10.5%
Students in private schools in grades 9 to 12 (high school): 126
Here:
4.6%
California:
8.5%
Students in private undergraduate colleges: 176
Here:
7.3%
California:
15.9%
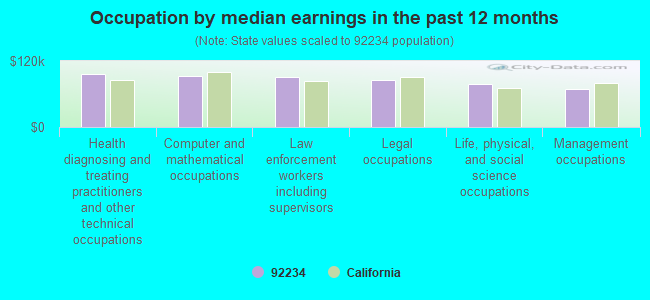
Occupation by median earnings in the past 12 months ($)
96,444Health diagnosing and treating practitioners and other technical occupations
92,345Computer and mathematical occupations
90,272Law enforcement workers including supervisors
85,347Legal occupations
77,928Life, physical, and social science occupations
68,476Management occupations
Companies with federal contracts located in this zip code:
AIRCRAFT GROUND EQUIPMENT (68015 EMPALMO RD in CATHEDRAL CITY, CA; small business) : $55,700 in 7 contractsin 2003
Contracts for Lease or Rental of Equipment -- Maintenance and Repair Shop Equipment, Lease or Rental of Equipment -- Miscellaneous by Air Force Signed by year:2000: $0; 2001: $0; 2002: $0; 2003: $55,700; 2004: $0; 2005: $0; 2006: $0.
Biggest contracts:
$21,000 with Air Force for Lease or Rental of Equipment -- Maintenance and Repair Shop Equipment. Signed on 2003-02-11. Completion date: 2003-04-08.
$13,700, same as above.Signed on 2003-04-04. Completion date: 2003-05-04.
$7,500, same as above.Signed on 2003-05-29. Completion date: 2003-06-05.
$7,500, same as above.Signed on 2003-06-11. Completion date: 2003-07-05.
BELLA LINDA INC (36805 CATHEDRAL CANYON DRI in CATHEDRAL CITY, CA; small business) : $49,026 in 2 contractsfrom 1999 to 2002
$51,615 with Navy for Maintenance, Repair and Rebuilding of Equipment -- Food Preparation and Serving Equipment. Signed on 1999-10-01. Completion date: 2004-09-30.
-$2,589 with Navy for Technical Representation Services -- Food Preparation and Serving Equipment. Signed on 2002-11-12. Completion date: 2001-09-30.
BIG LEAGUE DREAMS, LLC (33700 DATE PALM DR in CATHEDRAL CITY, CA; small business)
$3,330 with Navy for Other Photographic, Mapping, Printing, and Publication Services. Signed on 2003-03-04. Completion date: 2004-03-31.
Top industries in this zip code by the number of employees in 2005:
Other Services (except Public Administration): Other Similar Organizations (except Business, Professional, Labor, and Political Organizations) (50-99: 2, 20-49: 1, 1-4: 7)
2004 - 2018 National Fire Incident Reporting System (NFIRS) incidents
According to the data from the years 2004 - 2018 the average number of fires per year is 94. The highest number of fire incidents - 199 took place in 2017, and the least - 1 in 2005. The data has an increasing trend.
When looking into fire subcategories, the most incidents belonged to: Outside Fires (54.0%), and Mobile Property/Vehicle Fires (21.5%).
Fire incident types reported to NFIRS in Zip Code 92234


 Nearest zip codes: 92270, 92276, 92262, 92264, 92260, 92258.


 According to the data from the years 2004 - 2018 the average number of fires per year is 94. The highest number of fire incidents - 199 took place in 2017, and the least - 1 in 2005. The data has an increasing trend.
 When looking into fire subcategories, the most incidents belonged to: Outside Fires (54.0%), and Mobile Property/Vehicle Fires (21.5%).