Estimated zip code population in 2022: 25,641 Zip code population in 2010: 26,179 Zip code population in 2000: 24,906
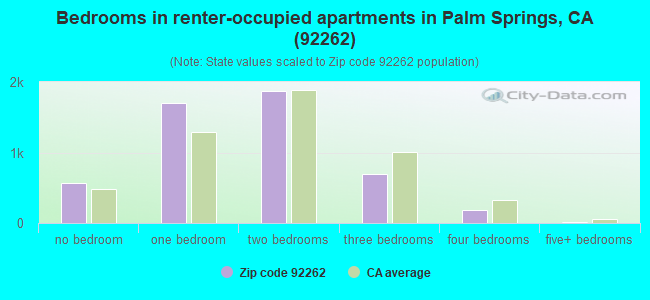
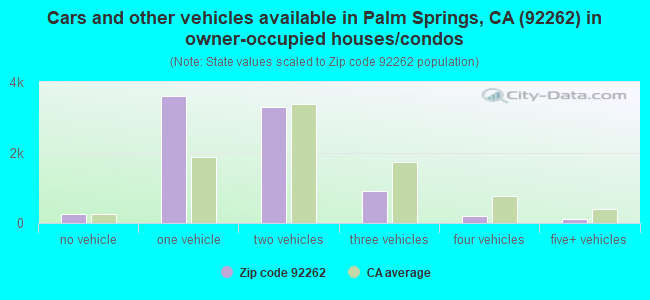
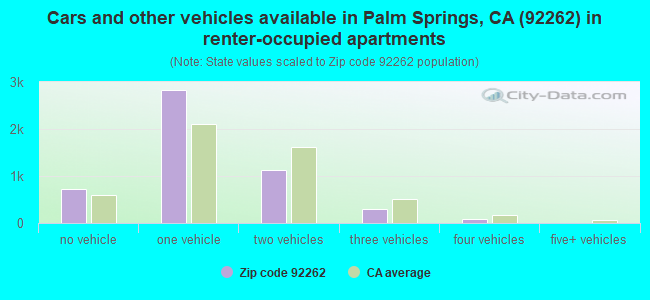
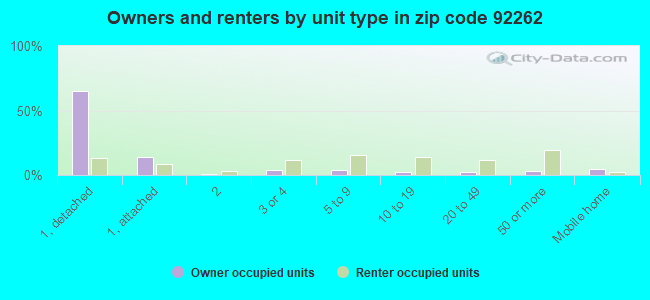
Houses and condos: 20,089 Renter-occupied apartments: 5,041
% of renters here:
38%
State:
44%
March 2022 cost of living index in zip code 92262: 83.6 (less than average, U.S. average is 100)
Land area: 36.6 sq. mi. Water area: 0.0 sq. mi.
Population density: 700 people per square mile
(low).
OSM Map
General Map
Google Map
MSN Map
OSM Map
General Map
Google Map
MSN Map
OSM Map
General Map
Google Map
MSN Map
OSM Map
General Map
Google Map
MSN Map
Please wait while loading the map...
Real estate property taxes paid for housing units in 2022:
This zip code:
0.7% ($4,376)
California:
0.7% ($4,831)
Median real estate property taxes paid for housing units with mortgages in 2022: $4,650 (0.8%) Median real estate property taxes paid for housing units with no mortgage in 2022: $4,168 (0.8%)
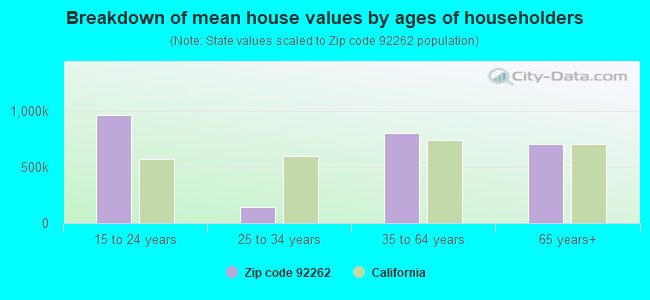
Estimated median house/condo value in 2022: $587,010
92262:
$587,010
California:
$715,900
According to our research of California and other state lists, there were 31 registered sex offenders living in 92262 zip code as of April 27, 2024. The ratio of all residents to sex offenders in zip code 92262 is 902 to 1. The ratio of registered sex offenders to all residents in this zip code is near the state average.
Median resident age:
This zip code:
55.2 years
California median age:
37.9 years
Average household size:
This zip code:
1.9 people
California:
2.8 people
Averages for the 2020 tax year for zip code 92262, filed in 2021:
Average Adjusted Gross Income (AGI) in 2020: $83,322 (Individual Income Tax Returns)
Here:
$83,322
State:
$95,910
Salary/wage: $64,769 (reported on 68.8% of returns)
Here:
$64,769
State:
$77,331
(% of AGI for various income ranges: 1116.0% for AGIs below $25k, 3420.9% for AGIs $25k-50k, 6578.1% for AGIs $50k-75k, 9045.7% for AGIs $75k-100k, 17231.7% for AGIs $100k-200k, 87619.6% for AGIs over 200k)
Taxable interest for individuals: $2,167 (reported on 38.9% of returns)
This zip code:
$2,167
California:
$2,294
(% of AGI for various income ranges: 27.2% for AGIs below $25k, 38.4% for AGIs $25k-50k, 102.7% for AGIs $50k-75k, 116.3% for AGIs $75k-100k, 299.9% for AGIs $100k-200k, 2026.8% for AGIs over 200k)
Ordinary dividends: $11,622 (reported on 24.5% of returns)
Here:
$11,622
State:
$10,949
(% of AGI for various income ranges: 62.0% for AGIs below $25k, 110.8% for AGIs $25k-50k, 235.4% for AGIs $50k-75k, 418.4% for AGIs $75k-100k, 803.6% for AGIs $100k-200k, 8135.4% for AGIs over 200k)
Net capital gain/loss in AGI: +$33,730 (reported on 24.3% of returns)
Here:
+$33,730
State:
+$49,306
(% of AGI for various income ranges: 22.1% for AGIs below $25k, 72.0% for AGIs $25k-50k, 289.2% for AGIs $50k-75k, 553.5% for AGIs $75k-100k, 1542.0% for AGIs $100k-200k, 31267.1% for AGIs over 200k)
Profit/loss from business: +$21,538 (reported on 22.0% of returns)
Here:
+$21,538
State:
+$15,671
(% of AGI for various income ranges: 208.2% for AGIs below $25k, 293.5% for AGIs $25k-50k, 592.3% for AGIs $50k-75k, 749.8% for AGIs $75k-100k, 1589.9% for AGIs $100k-200k, 10365.4% for AGIs over 200k)
Taxable individual retirement arrangement distribution: $26,097 (reported on 11.8% of returns)
92262:
$26,097
California:
$23,505
(% of AGI for various income ranges: 78.8% for AGIs below $25k, 155.2% for AGIs $25k-50k, 536.0% for AGIs $50k-75k, 962.5% for AGIs $75k-100k, 1734.9% for AGIs $100k-200k, 4263.6% for AGIs over 200k)
Self-employed (Keogh) retirement plans: $26,388 (reported on 1.3% of returns)
92262:
$26,388
California:
$30,163
(% of AGI for various income ranges: 45.8% for AGIs $50k-75k, 129.2% for AGIs $100k-200k, 1108.9% for AGIs over 200k)
Total itemized deductions: $35,425 (reported on 19.0% of returns)
Here:
$35,425
State:
$39,517
(% of AGI for various income ranges: 207.8% for AGIs below $25k, 288.9% for AGIs $25k-50k, 1053.6% for AGIs $50k-75k, 1461.0% for AGIs $75k-100k, 3007.9% for AGIs $100k-200k, 13077.1% for AGIs over 200k)
Charity contributions: $7,711 (reported on 15.4% of returns)
Here:
$7,711
State:
$12,598
(% of AGI for various income ranges: 10.8% for AGIs below $25k, 28.0% for AGIs $25k-50k, 104.0% for AGIs $50k-75k, 145.3% for AGIs $75k-100k, 378.1% for AGIs $100k-200k, 3590.4% for AGIs over 200k)
Taxes paid: $8,335 (reported on 18.9% of returns)
92262:
$8,335
State:
$8,807
(% of AGI for various income ranges: 38.4% for AGIs below $25k, 65.0% for AGIs $25k-50k, 260.4% for AGIs $50k-75k, 448.8% for AGIs $75k-100k, 910.1% for AGIs $100k-200k, 2394.6% for AGIs over 200k)
Earned income credit: $1,912 (reported on 14.4% of returns)
Here:
$1,912
State:
$2,074
(% of AGI for various income ranges: 83.6% for AGIs below $25k, 66.7% for AGIs $25k-50k)
Percentage of individuals using paid preparers for their 2020 taxes: 92.0%
Here:
92%
State:
92%
(% for various income ranges: 89.1% for AGIs below $25k, 92.2% for AGIs $25k-50k, 92.7% for AGIs $50k-75k, 93.9% for AGIs $75k-100k, 94.1% for AGIs $100k-200k, 96.5% for AGIs over 200k)
Averages for the 2012 tax year for zip code 92262, filed in 2013:
Average Adjusted Gross Income (AGI) in 2012: $54,367 (Individual Income Tax Returns)
Here:
$54,367
State:
$72,726
Salary/wage: $43,227 (reported on 70.7% of returns)
Here:
$43,227
State:
$59,079
(% of AGI for various income ranges: 64.9% for AGIs below $25k, 68.3% for AGIs $25k-50k, 59.8% for AGIs $50k-75k, 61.6% for AGIs $75k-100k, 60.4% for AGIs $100k-200k, 37.7% for AGIs over 200k)
Taxable interest for individuals: $1,750 (reported on 37.3% of returns)
This zip code:
$1,750
California:
$2,146
(% of AGI for various income ranges: 1.8% for AGIs below $25k, 1.2% for AGIs $25k-50k, 1.1% for AGIs $50k-75k, 1.8% for AGIs $75k-100k, 0.7% for AGIs $100k-200k, 1.2% for AGIs over 200k)
Ordinary dividends: $9,541 (reported on 21.0% of returns)
Here:
$9,541
State:
$9,308
(% of AGI for various income ranges: 3.0% for AGIs below $25k, 2.2% for AGIs $25k-50k, 2.5% for AGIs $50k-75k, 2.2% for AGIs $75k-100k, 2.4% for AGIs $100k-200k, 7.1% for AGIs over 200k)
Net capital gain/loss in AGI: +$17,184 (reported on 19.7% of returns)
Here:
+$17,184
State:
+$30,460
(% of AGI for various income ranges: 0.4% for AGIs $25k-50k, 1.6% for AGIs $50k-75k, 1.3% for AGIs $75k-100k, 3.7% for AGIs $100k-200k, 18.9% for AGIs over 200k)
Profit/loss from business: +$17,455 (reported on 20.6% of returns)
Here:
+$17,455
State:
+$17,064
(% of AGI for various income ranges: 13.9% for AGIs below $25k, 7.7% for AGIs $25k-50k, 5.5% for AGIs $50k-75k, 5.4% for AGIs $75k-100k, 4.4% for AGIs $100k-200k, 6.1% for AGIs over 200k)
Taxable individual retirement arrangement distribution: $21,511 (reported on 12.0% of returns)
92262:
$21,511
California:
$19,557
(% of AGI for various income ranges: 3.8% for AGIs below $25k, 4.0% for AGIs $25k-50k, 4.8% for AGIs $50k-75k, 5.1% for AGIs $75k-100k, 5.9% for AGIs $100k-200k, 4.4% for AGIs over 200k)
Self-employment retirement plans: $18,282 (reported on 1.0% of returns)
92262:
$18,282
California:
$24,530
(% of AGI for various income ranges: 0.3% for AGIs below $25k, 0.4% for AGIs $50k-75k, 0.4% for AGIs $100k-200k, 0.5% for AGIs over 200k)
Total itemized deductions: $26,585 (27% of AGI, reported on 38.5% of returns)
Here:
$26,585
State:
$34,004
Here:
26.8% of AGI
State:
22.7% of AGI
(% of AGI for various income ranges: 18.2% for AGIs below $25k, 16.0% for AGIs $25k-50k, 19.0% for AGIs $50k-75k, 20.8% for AGIs $75k-100k, 21.2% for AGIs $100k-200k, 17.9% for AGIs over 200k)
Charity contributions: $3,314 (reported on 30.2% of returns)
Here:
$3,314
State:
$4,659
(% of AGI for various income ranges: 0.8% for AGIs below $25k, 1.2% for AGIs $25k-50k, 1.5% for AGIs $50k-75k, 1.7% for AGIs $75k-100k, 2.1% for AGIs $100k-200k, 2.6% for AGIs over 200k)
Taxes paid: $9,274 (reported on 38.2% of returns)
92262:
$9,274
State:
$14,448
(% of AGI for various income ranges: 3.5% for AGIs below $25k, 3.5% for AGIs $25k-50k, 5.3% for AGIs $50k-75k, 6.9% for AGIs $75k-100k, 8.3% for AGIs $100k-200k, 8.6% for AGIs over 200k)
Earned income credit: $2,219 (reported on 19.8% of returns)
Here:
$2,219
State:
$2,286
(% of AGI for various income ranges: 6.3% for AGIs below $25k, 0.9% for AGIs $25k-50k)
Percentage of individuals using paid preparers for their 2012 taxes: 66.2%
Here:
66%
State:
64%
(% for various income ranges: 63.2% for AGIs below $25k, 65.2% for AGIs $25k-50k, 66.9% for AGIs $50k-75k, 67.1% for AGIs $75k-100k, 74.8% for AGIs $100k-200k, 84.2% for AGIs over 200k)
Averages for the 2004 tax year for zip code 92262, filed in 2005:
Average Adjusted Gross Income (AGI) in 2004: $44,767 (Individual Income Tax Returns)
Here:
$44,767
State:
$58,600
Salary/wage: $36,726 (reported on 72.7% of returns)
Here:
$36,726
State:
$49,455
(% of AGI for various income ranges: 70.7% for AGIs $10k-25k, 73.9% for AGIs $25k-50k, 67.4% for AGIs $50k-75k, 67.2% for AGIs $75k-100k, 39.5% for AGIs over 100k)
Taxable interest for individuals: $2,950 (reported on 44.8% of returns)
This zip code:
$2,950
California:
$2,365
(% of AGI for various income ranges: 3.2% for AGIs $10k-25k, 2.0% for AGIs $25k-50k, 2.1% for AGIs $50k-75k, 2.6% for AGIs $75k-100k, 3.0% for AGIs over 100k)
Taxable dividends: $5,592 (reported on 23.7% of returns)
Here:
$5,592
State:
$4,746
(% of AGI for various income ranges: 2.6% for AGIs $10k-25k, 1.7% for AGIs $25k-50k, 1.9% for AGIs $50k-75k, 1.9% for AGIs $75k-100k, 3.6% for AGIs over 100k)
Net capital gain/loss: +$21,764 (reported on 23.9% of returns)
Here:
+$21,764
State:
+$23,418
(% of AGI for various income ranges: 1.0% for AGIs $10k-25k, 1.3% for AGIs $25k-50k, 2.7% for AGIs $50k-75k, 4.7% for AGIs $75k-100k, 22.6% for AGIs over 100k)
Profit/loss from business: +$17,893 (reported on 21.5% of returns)
Here:
+$17,893
State:
+$16,826
(% of AGI for various income ranges: 10.5% for AGIs $10k-25k, 6.7% for AGIs $25k-50k, 7.9% for AGIs $50k-75k, 6.7% for AGIs $75k-100k, 8.6% for AGIs over 100k)
IRA payment deduction: $3,107 (reported on 3.2% of returns)
92262:
$3,107
California:
$3,192
(% of AGI for various income ranges: 0.2% for AGIs $10k-25k, 0.4% for AGIs $25k-50k, 0.2% for AGIs $50k-75k, 0.3% for AGIs $75k-100k, 0.1% for AGIs over 100k)
Self-employed pension: $17,478 (reported on 1.7% of returns)
Here:
$17,478
California:
$17,688
(% of AGI for various income ranges: 0.2% for AGIs $10k-25k, 0.2% for AGIs $25k-50k, 0.6% for AGIs $50k-75k, 0.4% for AGIs $75k-100k, 1.0% for AGIs over 100k)
Total itemized deductions: $24,000 (29% of AGI, reported on 40.7% of returns)
Here:
$24,000
State:
$28,113
Here:
28.6% of AGI
State:
25.3% of AGI
(% of AGI for various income ranges: 18.8% for AGIs $10k-25k, 18.8% for AGIs $25k-50k, 23.5% for AGIs $50k-75k, 24.3% for AGIs $75k-100k, 19.6% for AGIs over 100k)
Charity contributions deductions: $3,179 (4% of AGI, reported on 34.5% of returns)
Here:
$3,179
State:
$3,923
Here:
3.6% of AGI
State:
3.3% of AGI
(% of AGI for various income ranges: 1.4% for AGIs $10k-25k, 1.7% for AGIs $25k-50k, 2.2% for AGIs $50k-75k, 2.6% for AGIs $75k-100k, 2.9% for AGIs over 100k)
Total tax: $8,303 (reported on 73.2% of returns)
92262:
$8,303
State:
$10,761
(% of AGI for various income ranges: 4.5% for AGIs $10k-25k, 7.6% for AGIs $25k-50k, 11.0% for AGIs $50k-75k, 11.9% for AGIs $75k-100k, 18.4% for AGIs over 100k)
Earned income credit: $1,689 (reported on 17.7% of returns)
Here:
$1,689
State:
$1,763
Percentage of individuals using paid preparers for their 2004 taxes: 70.9%
Here:
71%
State:
66%
(% for various income ranges: 68.1% for AGIs below $10k, 70.8% for AGIs $10k-25k, 67.8% for AGIs $25k-50k, 71.7% for AGIs $50k-75k, 73.7% for AGIs $75k-100k, 83.1% for AGIs over 100k)
Likely homosexual households (counted as self-reported same-sex unmarried-partner households)
Lesbian couples: 0.3% of all households
Gay men: 4.1% of all households
Household received Food Stamps/SNAP in the past 12 months: 1,446 Household did not receive Food Stamps/SNAP in the past 12 months: 11,816
Women who had a birth in the past 12 months: 139 (43 now married, 97 unmarried) Women who did not have a birth in the past 12 months: 3,781 (1,255 now married, 2,536 unmarried)
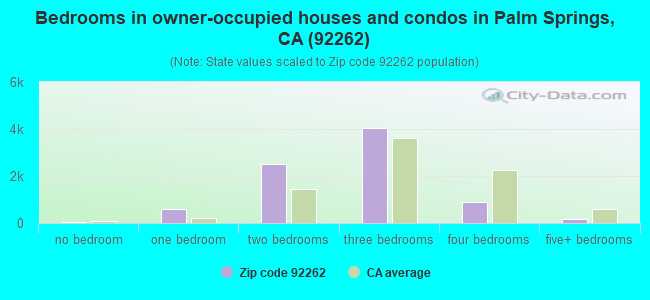
Housing units in zip code 92262 with a mortgage: 4,531 (276 second mortgage, 4 home equity loan, 248 both second mortgage and home equity loan) Houses without a mortgage: 65
Median monthly owner costs for units with a mortgage: $2,264 Median monthly owner costs for units without a mortgage: $896
Residents with income below the poverty level in 2022:
This zip code:
16.7%
Whole state:
12.2%
Residents with income below 50% of the poverty level in 2022:
This zip code:
6.0%
Whole state:
6.2%
Median number of rooms in houses and condos:
Here:
5.4
State:
6.0
Median number of rooms in apartments:
Here:
3.5
State:
3.9
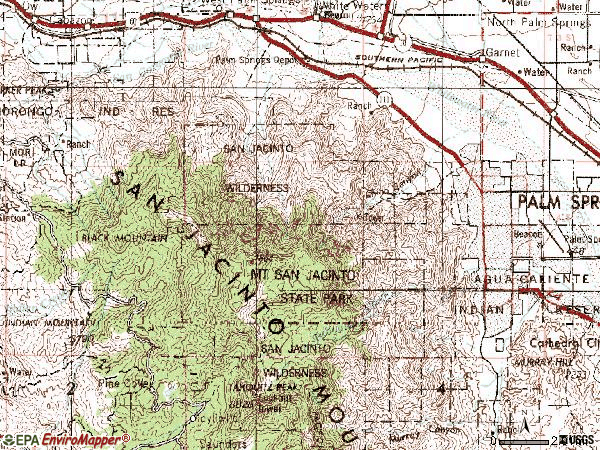
Notable locations in this zip code not listed on our city pages
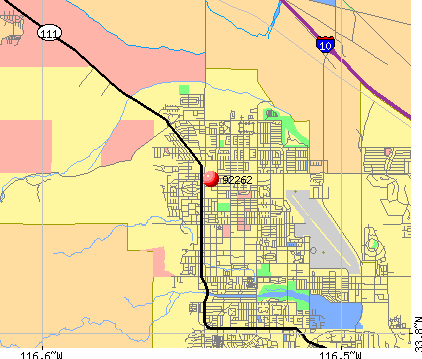
Notable locations in zip code 92262: Lazy C Ranch (A), Whitewater Country Club (B), Palm Springs Tennis Center (C), O'Donald Golf Course (D), American Medical Response Desert (E), Palm Springs Public Library (F), Palm Springs Desert Museum (G), Palm Springs Convention Center (H), Palm Springs City Hall (I), Palm Springs Fire Department Station 443 (J), Palm Springs Fire Department Station 441 (K), Palm Springs Fire Department Station 442 (L). Display/hide their locations on the map
Shopping Centers: The Vineyard Shopping Center (1), The Village Shopping Center (2), The Plaza at Sunrise Shopping Center (3), The Courtyard Shopping Center (4), Sunrise Square Shopping Center (5), Sunrise Marketplace Shopping Center (6), Plaza de las Flores Shopping Center (7), Palm Springs Mall Shopping Center (8), Desert Fashion Plaza Shopping Center (9). Display/hide their locations on the map
Parks in zip code 92262 include: Angels Stadium (1), Baristo Park (2), Desert Highland Park (3), Ruth Hardy Park (4), Sunrise Plaza (5), Victoria Park (6). Display/hide their locations on the map
1,239 married couples with children.
1,288 single-parent households (338 men, 950 women).
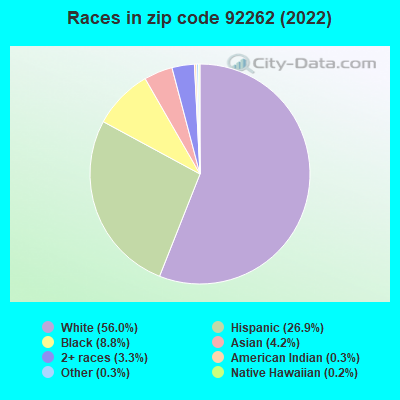
74.6% of residents of 92262 zip code speak English at home.
18.2% of residents speak Spanish at home (67% very well, 21% well, 11% not well, 2% not at all).
4.7% of residents speak other Indo-European language at home (87% very well, 11% well, 1% not at all).
2.0% of residents speak Asian or Pacific Island language at home (58% very well, 23% well, 18% not well, 1% not at all).
0.9% of residents speak other language at home (72% very well, 27% well, 1% not well).
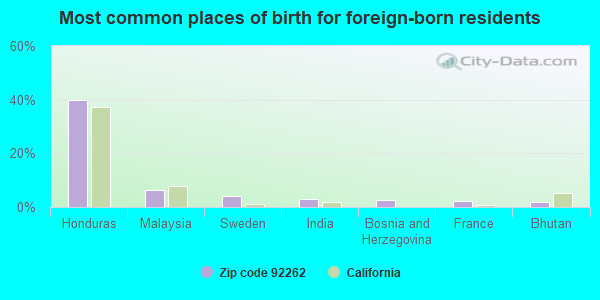
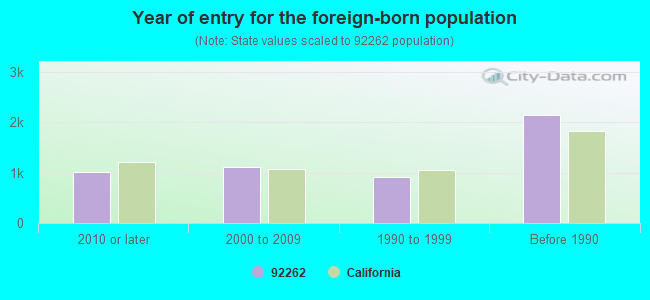
Foreign born population: 4,859 (19.0%) (59.8% of them are naturalized citizens)
Major facilities with environmental interests located in this zip code:
EQUILON ENTERPRISES (2796 N PALM CANYON in PALM SPRINGS, CA) . Federal Facility
STATE MASTER (California - Hazardous Waste Tracking) - HAZARDOU WASTE PROGRAM Small Quantity Generators, between 100 kg and 1000 kg of hazardous waste/month (Resource Conservation and Recovery Act (tracking hazardous waste)) - notification Organizations: EQUILON ENTERPRISES, LLC (CONTACT/OWNER)
Alternative names: SHELL OIL CO
MAC MAGRUDER CHEVROLET (999 S PALM CANYON DR in PALM SPRINGS, CA)
STATE MASTER (California - Hazardous Waste Tracking) - HAZARDOU WASTE PROGRAM Small Quantity Generators, between 100 kg and 1000 kg of hazardous waste/month (Resource Conservation and Recovery Act (tracking hazardous waste))
FINCHY (KATHERINE) ELEMENTARY (777 TACHEVAH DR. in PALM SPRINGS, CA)
(National Center for Education Statistics) - STATE ID-6032437 Organizations: PALM SPRINGS UNIFIED (SCHOOL DISTRICT)
AD TYPE & STATS (1750 E ARENAS #2 in PALM SPRINGS, CA)
(Resource Conservation and Recovery Act (tracking hazardous waste)) Business NAICS classification: PREPRESS SERVICES. Organizations: CHAPMAN BETTY (CONTACT/OWNER)
GATES STRIPPING SVC (4515 CAMOINO PAROCELA in PALM SPRINGS, CA)
Small Quantity Generators, between 100 kg and 1000 kg of hazardous waste/month (Resource Conservation and Recovery Act (tracking hazardous waste)) - notification Organizations: SHERCOCK ROBERT (CONTACT/OWNER)
GTE CA (PALM SPRINGS C.O.) (369 NORTH PALM CANYON DRIVE in PALM SPRINGS, CA)
(Resource Conservation and Recovery Act (tracking hazardous waste))
GTE CALIFORNIA (295 NORTH SUNRISE WAY in PALM SPRINGS, CA)
(Resource Conservation and Recovery Act (tracking hazardous waste)) Alternative names: GTE CA (PALM SPRINGS C.O./TFC)
H & H AUTOMOTIVE REPAIR (145 OASIS RD in PALM SPRINGS, CA)
Small Quantity Generators, between 100 kg and 1000 kg of hazardous waste/month (Resource Conservation and Recovery Act (tracking hazardous waste))
HERTZ EQUIPT RENTAL (27650 EXECUTIVE DR in PALM SPRINGS, CA) . Tribal Land
Small Quantity Generators, between 100 kg and 1000 kg of hazardous waste/month (Resource Conservation and Recovery Act (tracking hazardous waste)) Organizations: RALPH COOMBER (CONTACT/OWNER)
CHRYSLER PLYMOUTH (4057 E PALM CANYON in PALM SPRINGS, CA) . Tribal Land
Small Quantity Generators, between 100 kg and 1000 kg of hazardous waste/month (Resource Conservation and Recovery Act (tracking hazardous waste)) - notification Organizations: PERRY BRANDT (CONTACT/OWNER)
KATSU LAWNMOWER (1105 GENE AUTRY TRAIL in PALM SPRINGS, CA)
Small Quantity Generators, between 100 kg and 1000 kg of hazardous waste/month (Resource Conservation and Recovery Act (tracking hazardous waste))
KENT CLEANERS (2400 N PALM CANYON in PALM SPRINGS, CA)
Small Quantity Generators, between 100 kg and 1000 kg of hazardous waste/month (Resource Conservation and Recovery Act (tracking hazardous waste))
KWIK KLEEN OF THE DESERT (19345 N INDIANA AVE in PALM SPRINGS, CA)
Small Quantity Generators, between 100 kg and 1000 kg of hazardous waste/month (Resource Conservation and Recovery Act (tracking hazardous waste)) Organizations: CHRISTINE CRUZ (CONTACT/OWNER)
Housing units lacking complete plumbing facilities: 0.3% Housing units lacking complete kitchen facilities: 2.0%
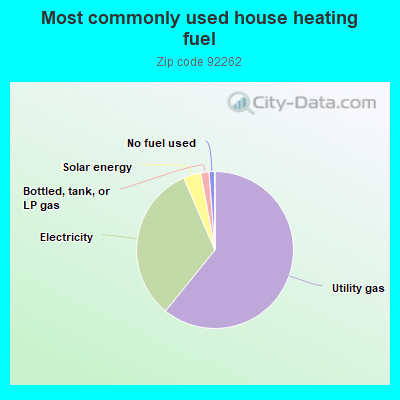
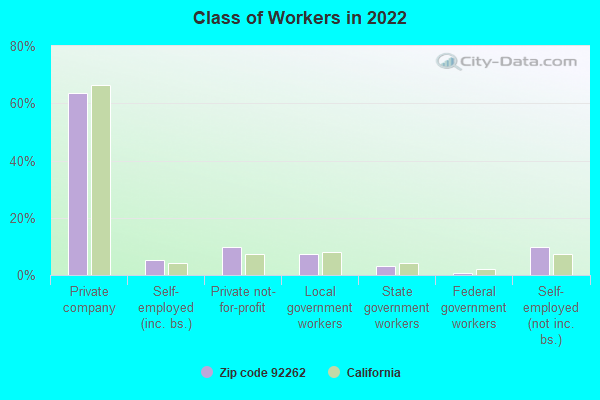
60.8%Utility gas
32.6%Electricity
3.6%Solar energy
1.7%Bottled, tank, or LP gas
1.1%No fuel used
Population in 1990: 22,808. Population change in the 1990s: +2,098 (+9.2%).
Place of birth for U.S.-born residents:
This state: 10,537
Northeast: 2,323
Midwest: 3,711
South: 2,063
West: 1,524
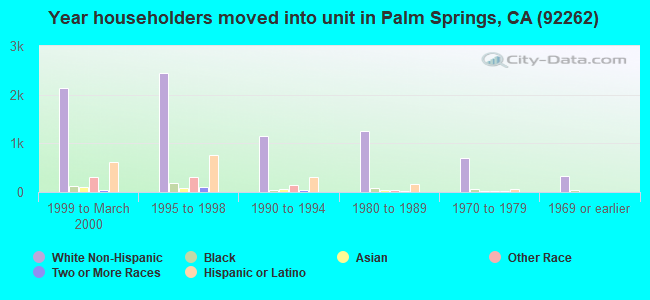
48% of the 92262 zip code residents lived in the same house 5 years ago. Out of people who lived in different houses, 54% lived in this county. Out of people who lived in different counties, 50% lived in California.
86% of the 92262 zip code residents lived in the same house 1 year ago. Out of people who lived in different houses, 43% moved from this county. Out of people who lived in different houses, 30% moved from different county within same state. Out of people who lived in different houses, 21% moved from different state. Out of people who lived in different houses, 6% moved from abroad.
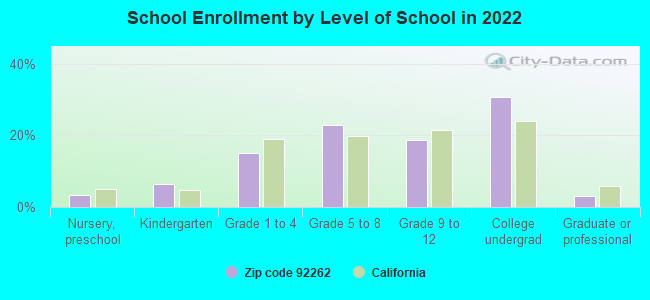
Private vs. public school enrollment:
Students in private schools in grades 1 to 8 (elementary and middle school): 137
Here:
10.5%
California:
10.5%
Students in private schools in grades 9 to 12 (high school): 67
Here:
10.6%
California:
8.5%
Students in private undergraduate colleges: 117
Here:
11.2%
California:
15.9%
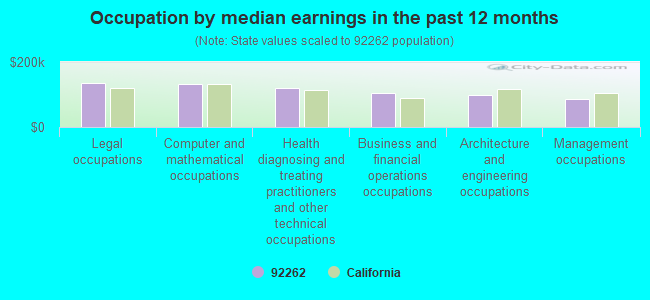
Occupation by median earnings in the past 12 months ($)
134,400Legal occupations
129,958Computer and mathematical occupations
120,126Health diagnosing and treating practitioners and other technical occupations
104,637Business and financial operations occupations
98,440Architecture and engineering occupations
85,177Management occupations
Companies with federal contracts located in this zip code (PALM SPRINGS, CA):
SIGNATURE FLIGHT SUPPORT CORPO (210 N EL CIELO RD) : $2,476,898 in 2 contractsfrom 2003 to 2006
$2,441,678 with Defense Logistics Agency for Liquid Propellants and Fuels, Petroleum Base. Signed on 2006-04-26. Completion date: 2010-09-30.
$35,220 with Bureau of Immigration and Customs Enforcement for Lease or Rental of Facilities -- Other Airfield Structures. Signed on 2003-10-01. Completion date: 2004-09-30.
BEAR MEDICAL SYSTEMS INC (1100 BIRD CENTER DR) : $335,178 in 6 contractsfrom 2000 to 2001
Contracts for Hospital Furniture, Equipment, Utensils, and Supplies, Medical and Surgical Instruments, Equipment, and Supplies by Defense Logistics Agency, Air Force Signed by year:2000: $27,800; 2001: $307,378; 2002: $0; 2003: $0; 2004: $0; 2005: $0; 2006: $0.
Biggest contracts:
$104,250 with Defense Logistics Agency for Hospital Furniture, Equipment, Utensils, and Supplies. Signed on 2001-03-22. Completion date: 2001-06-19.
$64,128 with Air Force for Medical and Surgical Instruments, Equipment, and Supplies. Taking place in TX. Signed on 2001-10-18. Completion date: 2001-12-03.
$55,600 with Defense Logistics Agency for Hospital Furniture, Equipment, Utensils, and Supplies. Signed on 2001-01-10. Completion date: 2001-04-09.
$55,600, same as above.Signed on 2001-03-22. Completion date: 2001-06-19.
COUNTY OF RIVERSIDE (3133 MISSION INN PKWY; small business) : $50,000 in 11 contractsfrom 2002 to 2003
Contracts for Lease or Rental of Facilities -- Office Buildings by Public Buildings Service Signed by year:2000: $0; 2001: $0; 2002: $12,000; 2003: $38,000; 2004: $0; 2005: $0; 2006: $0.
Biggest contracts:
$6,000 with Public Buildings Service for Lease or Rental of Facilities -- Office Buildings. Signed on 2003-06-15. Completion date: 2003-06-15.
$6,000, same as above.Signed on 2002-12-15. Completion date: 2002-12-15.
$6,000, same as above.Signed on 2003-09-15. Completion date: 2003-09-15.
$6,000, same as above.Signed on 2003-09-15. Completion date: 2003-09-15.
AMERICAN LEAK DETECTION, INC (888 RESEARCH DRIVE, STE. 1; small business) : $0 in 2 contractsin 2000
$55,000 with Navy for Other Non-Building Structures. Taking place in HI. Signed on 2000-08-11. Completion date: 2001-08-10.
-$55,000, same as above.Signed on 2000-09-01. Completion date: 2000-09-01.
Top industries in this zip code by the number of employees in 2005:
2005 - 2018 National Fire Incident Reporting System (NFIRS) incidents
Based on the data from the years 2005 - 2018 the average number of fires per year is 189. The highest number of fire incidents - 287 took place in 2005, and the least - 1 in 2015. The data has a dropping trend.
When looking into fire subcategories, the most reports belonged to: Outside Fires (49.2%), and Structure Fires (24.6%).
Fire incident types reported to NFIRS in Zip Code 92262

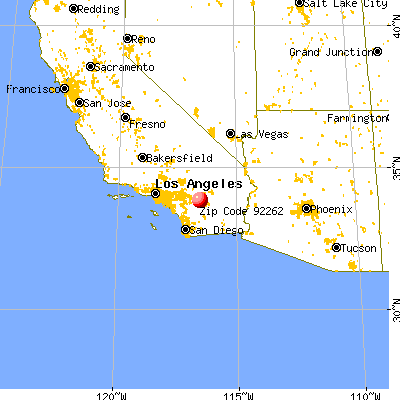


 Nearest zip codes: 92258, 92240, 92234, 92270, 92282, 92264.


 . Federal Facility

 Based on the data from the years 2005 - 2018 the average number of fires per year is 189. The highest number of fire incidents - 287 took place in 2005, and the least - 1 in 2015. The data has a dropping trend.
 When looking into fire subcategories, the most reports belonged to: Outside Fires (49.2%), and Structure Fires (24.6%).