Estimated zip code population in 2022: 77,490 Zip code population in 2010: 53,892 Zip code population in 2000: 18,303
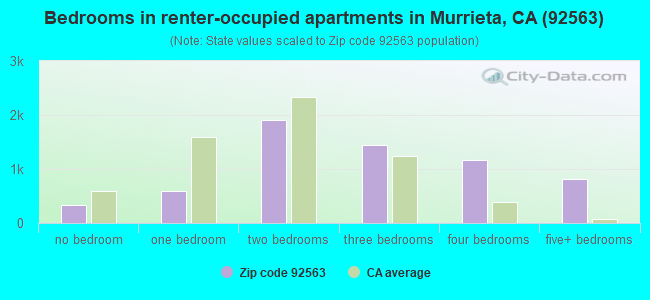
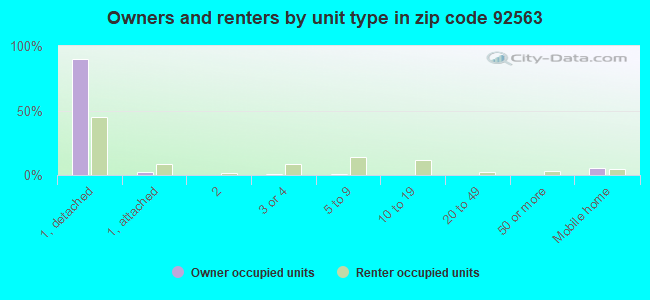
Houses and condos: 23,741 Renter-occupied apartments: 6,210
% of renters here:
27%
State:
44%
March 2022 cost of living index in zip code 92563: 82.6 (low, U.S. average is 100)
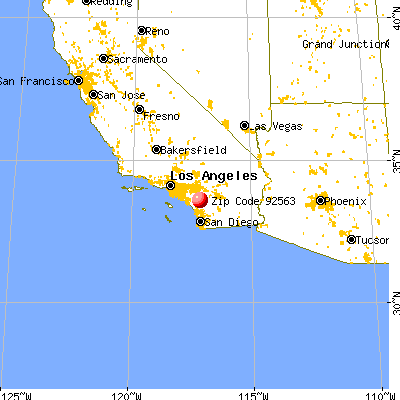
Land area: 20.3 sq. mi. Water area: 0.0 sq. mi.
Population density: 3,809 people per square mile
(average).
OSM Map
General Map
Google Map
MSN Map
OSM Map
General Map
Google Map
MSN Map
OSM Map
General Map
Google Map
MSN Map
OSM Map
General Map
Google Map
MSN Map
Please wait while loading the map...
Real estate property taxes paid for housing units in 2022:
This zip code:
1.0% ($6,344)
California:
0.7% ($4,831)
Median real estate property taxes paid for housing units with mortgages in 2022: $6,663 (1.0%) Median real estate property taxes paid for housing units with no mortgage in 2022: $5,005 (0.9%)
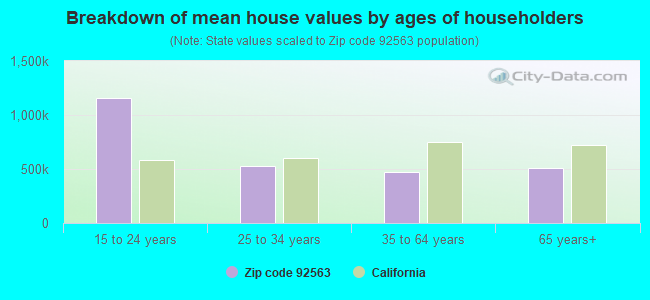
Estimated median house/condo value in 2022: $634,461
92563:
$634,461
California:
$715,900
According to our research of California and other state lists, there were 42 registered sex offenders living in 92563 zip code as of April 26, 2024. The ratio of all residents to sex offenders in zip code 92563 is 1,465 to 1. The ratio of registered sex offenders to all residents in this zip code is lower than the state average.
Median resident age:
This zip code:
35.3 years
California median age:
37.9 years
Average household size:
This zip code:
3.4 people
California:
2.8 people
Averages for the 2020 tax year for zip code 92563, filed in 2021:
Average Adjusted Gross Income (AGI) in 2020: $73,306 (Individual Income Tax Returns)
Here:
$73,306
State:
$95,910
Salary/wage: $67,142 (reported on 83.1% of returns)
Here:
$67,142
State:
$77,331
(% of AGI for various income ranges: 1119.2% for AGIs below $25k, 3510.6% for AGIs $25k-50k, 6789.6% for AGIs $50k-75k, 10221.1% for AGIs $75k-100k, 20811.3% for AGIs $100k-200k, 63339.6% for AGIs over 200k)
Taxable interest for individuals: $607 (reported on 39.8% of returns)
This zip code:
$607
California:
$2,294
(% of AGI for various income ranges: 15.2% for AGIs below $25k, 18.8% for AGIs $25k-50k, 28.1% for AGIs $50k-75k, 38.2% for AGIs $75k-100k, 67.2% for AGIs $100k-200k, 307.1% for AGIs over 200k)
Ordinary dividends: $2,474 (reported on 13.4% of returns)
Here:
$2,474
State:
$10,949
(% of AGI for various income ranges: 18.2% for AGIs below $25k, 20.5% for AGIs $25k-50k, 34.9% for AGIs $50k-75k, 54.4% for AGIs $75k-100k, 75.4% for AGIs $100k-200k, 645.6% for AGIs over 200k)
Net capital gain/loss in AGI: +$12,392 (reported on 14.6% of returns)
Here:
+$12,392
State:
+$49,306
(% of AGI for various income ranges: 8.5% for AGIs below $25k, 18.3% for AGIs $25k-50k, 54.5% for AGIs $50k-75k, 103.1% for AGIs $75k-100k, 331.3% for AGIs $100k-200k, 7903.3% for AGIs over 200k)
Profit/loss from business: +$9,547 (reported on 18.2% of returns)
Here:
+$9,547
State:
+$15,671
(% of AGI for various income ranges: 91.2% for AGIs below $25k, 184.5% for AGIs $25k-50k, 207.5% for AGIs $50k-75k, 280.3% for AGIs $75k-100k, 487.0% for AGIs $100k-200k, 1879.8% for AGIs over 200k)
Taxable individual retirement arrangement distribution: $19,623 (reported on 5.9% of returns)
92563:
$19,623
California:
$23,505
(% of AGI for various income ranges: 39.1% for AGIs below $25k, 74.7% for AGIs $25k-50k, 145.7% for AGIs $50k-75k, 216.5% for AGIs $75k-100k, 384.6% for AGIs $100k-200k, 1405.0% for AGIs over 200k)
Self-employed (Keogh) retirement plans: $15,200 (reported on 0.3% of returns)
92563:
$15,200
California:
$30,163
(% of AGI for various income ranges: 7.0% for AGIs $50k-75k, 11.3% for AGIs $100k-200k, 140.2% for AGIs over 200k)
Total itemized deductions: $31,156 (reported on 19.2% of returns)
Here:
$31,156
State:
$39,517
(% of AGI for various income ranges: 88.9% for AGIs below $25k, 268.3% for AGIs $25k-50k, 717.4% for AGIs $50k-75k, 1220.6% for AGIs $75k-100k, 2291.6% for AGIs $100k-200k, 7244.4% for AGIs over 200k)
Charity contributions: $5,745 (reported on 15.7% of returns)
Here:
$5,745
State:
$12,598
(% of AGI for various income ranges: 5.0% for AGIs below $25k, 23.1% for AGIs $25k-50k, 76.4% for AGIs $50k-75k, 143.2% for AGIs $75k-100k, 349.8% for AGIs $100k-200k, 1725.2% for AGIs over 200k)
Taxes paid: $8,912 (reported on 19.1% of returns)
92563:
$8,912
State:
$8,807
(% of AGI for various income ranges: 21.3% for AGIs below $25k, 70.0% for AGIs $25k-50k, 209.1% for AGIs $50k-75k, 388.5% for AGIs $75k-100k, 700.0% for AGIs $100k-200k, 1648.5% for AGIs over 200k)
Earned income credit: $2,093 (reported on 12.4% of returns)
Here:
$2,093
State:
$2,074
(% of AGI for various income ranges: 68.3% for AGIs below $25k, 75.2% for AGIs $25k-50k, 2.3% for AGIs $50k-75k)
Percentage of individuals using paid preparers for their 2020 taxes: 94.1%
Here:
94%
State:
92%
(% for various income ranges: 93.3% for AGIs below $25k, 94.1% for AGIs $25k-50k, 94.0% for AGIs $50k-75k, 93.5% for AGIs $75k-100k, 95.1% for AGIs $100k-200k, 95.6% for AGIs over 200k)
Averages for the 2012 tax year for zip code 92563, filed in 2013:
Average Adjusted Gross Income (AGI) in 2012: $59,477 (Individual Income Tax Returns)
Here:
$59,477
State:
$72,726
Salary/wage: $56,498 (reported on 85.4% of returns)
Here:
$56,498
State:
$59,079
(% of AGI for various income ranges: 71.8% for AGIs below $25k, 78.7% for AGIs $25k-50k, 83.0% for AGIs $50k-75k, 84.9% for AGIs $75k-100k, 85.1% for AGIs $100k-200k, 63.5% for AGIs over 200k)
Taxable interest for individuals: $566 (reported on 39.0% of returns)
This zip code:
$566
California:
$2,146
(% of AGI for various income ranges: 1.0% for AGIs below $25k, 0.5% for AGIs $25k-50k, 0.5% for AGIs $50k-75k, 0.2% for AGIs $75k-100k, 0.2% for AGIs $100k-200k, 0.2% for AGIs over 200k)
Ordinary dividends: $2,016 (reported on 12.1% of returns)
Here:
$2,016
State:
$9,308
(% of AGI for various income ranges: 0.9% for AGIs below $25k, 0.4% for AGIs $25k-50k, 0.5% for AGIs $50k-75k, 0.3% for AGIs $75k-100k, 0.3% for AGIs $100k-200k, 0.5% for AGIs over 200k)
Net capital gain/loss in AGI: +$3,934 (reported on 11.1% of returns)
Here:
+$3,934
State:
+$30,460
(% of AGI for various income ranges: 0.1% for AGIs $50k-75k, 0.2% for AGIs $75k-100k, 0.6% for AGIs $100k-200k, 5.7% for AGIs over 200k)
Profit/loss from business: +$11,095 (reported on 17.6% of returns)
Here:
+$11,095
State:
+$17,064
(% of AGI for various income ranges: 11.0% for AGIs below $25k, 5.6% for AGIs $25k-50k, 2.7% for AGIs $50k-75k, 1.7% for AGIs $75k-100k, 1.8% for AGIs $100k-200k, 4.6% for AGIs over 200k)
Taxable individual retirement arrangement distribution: $16,656 (reported on 7.2% of returns)
92563:
$16,656
California:
$19,557
(% of AGI for various income ranges: 2.7% for AGIs below $25k, 2.2% for AGIs $25k-50k, 1.8% for AGIs $50k-75k, 1.6% for AGIs $75k-100k, 1.9% for AGIs $100k-200k, 2.8% for AGIs over 200k)
Self-employment retirement plans: $24,980 (reported on 0.2% of returns)
92563:
$24,980
California:
$24,530
Total itemized deductions: $25,445 (28% of AGI, reported on 47.5% of returns)
Here:
$25,445
State:
$34,004
Here:
28.2% of AGI
State:
22.7% of AGI
(% of AGI for various income ranges: 15.3% for AGIs below $25k, 18.6% for AGIs $25k-50k, 20.8% for AGIs $50k-75k, 21.7% for AGIs $75k-100k, 21.2% for AGIs $100k-200k, 19.1% for AGIs over 200k)
Charity contributions: $2,759 (reported on 38.8% of returns)
Here:
$2,759
State:
$4,659
(% of AGI for various income ranges: 0.9% for AGIs below $25k, 1.4% for AGIs $25k-50k, 1.7% for AGIs $50k-75k, 1.8% for AGIs $75k-100k, 2.1% for AGIs $100k-200k, 2.0% for AGIs over 200k)
Taxes paid: $8,344 (reported on 47.4% of returns)
92563:
$8,344
State:
$14,448
(% of AGI for various income ranges: 3.6% for AGIs below $25k, 4.8% for AGIs $25k-50k, 6.1% for AGIs $50k-75k, 7.0% for AGIs $75k-100k, 7.6% for AGIs $100k-200k, 8.1% for AGIs over 200k)
Earned income credit: $2,247 (reported on 16.4% of returns)
Here:
$2,247
State:
$2,286
(% of AGI for various income ranges: 6.4% for AGIs below $25k, 1.5% for AGIs $25k-50k)
Percentage of individuals using paid preparers for their 2012 taxes: 60.1%
Here:
60%
State:
64%
(% for various income ranges: 53.8% for AGIs below $25k, 59.1% for AGIs $25k-50k, 61.8% for AGIs $50k-75k, 64.6% for AGIs $75k-100k, 66.4% for AGIs $100k-200k, 75.0% for AGIs over 200k)
Averages for the 2004 tax year for zip code 92563, filed in 2005:
Average Adjusted Gross Income (AGI) in 2004: $53,955 (Individual Income Tax Returns)
Here:
$53,955
State:
$58,600
Salary/wage: $51,052 (reported on 85.5% of returns)
Here:
$51,052
State:
$49,455
(% of AGI for various income ranges: 145.5% for AGIs below $10k, 73.9% for AGIs $10k-25k, 81.5% for AGIs $25k-50k, 84.7% for AGIs $50k-75k, 86.9% for AGIs $75k-100k, 74.4% for AGIs over 100k)
Taxable interest for individuals: $906 (reported on 53.0% of returns)
This zip code:
$906
California:
$2,365
(% of AGI for various income ranges: 7.0% for AGIs below $10k, 2.4% for AGIs $10k-25k, 1.1% for AGIs $25k-50k, 0.8% for AGIs $50k-75k, 0.5% for AGIs $75k-100k, 0.7% for AGIs over 100k)
Taxable dividends: $1,274 (reported on 17.6% of returns)
Here:
$1,274
State:
$4,746
(% of AGI for various income ranges: 3.5% for AGIs below $10k, 1.3% for AGIs $10k-25k, 0.5% for AGIs $25k-50k, 0.3% for AGIs $50k-75k, 0.2% for AGIs $75k-100k, 0.3% for AGIs over 100k)
Net capital gain/loss: +$11,438 (reported on 16.9% of returns)
Here:
+$11,438
State:
+$23,418
(% of AGI for various income ranges: -1.0% for AGIs below $10k, -0.2% for AGIs $10k-25k, 0.3% for AGIs $25k-50k, 0.6% for AGIs $50k-75k, 1.2% for AGIs $75k-100k, 8.9% for AGIs over 100k)
Profit/loss from business: +$11,698 (reported on 19.7% of returns)
Here:
+$11,698
State:
+$16,826
(% of AGI for various income ranges: 3.0% for AGIs below $10k, 8.8% for AGIs $10k-25k, 5.7% for AGIs $25k-50k, 3.3% for AGIs $50k-75k, 2.9% for AGIs $75k-100k, 4.3% for AGIs over 100k)
IRA payment deduction: $2,975 (reported on 2.4% of returns)
92563:
$2,975
California:
$3,192
(% of AGI for various income ranges: 0.6% for AGIs below $10k, 0.1% for AGIs $10k-25k, 0.2% for AGIs $25k-50k, 0.1% for AGIs $50k-75k, 0.1% for AGIs $75k-100k, 0.1% for AGIs over 100k)
Self-employed pension: $13,664 (reported on 0.7% of returns)
Here:
$13,664
California:
$17,688
(% of AGI for various income ranges: 0.1% for AGIs $25k-50k, 0.1% for AGIs $50k-75k, 0.1% for AGIs $75k-100k, 0.3% for AGIs over 100k)
Total itemized deductions: $26,829 (35% of AGI, reported on 58.3% of returns)
Here:
$26,829
State:
$28,113
Here:
35.2% of AGI
State:
25.3% of AGI
(% of AGI for various income ranges: 49.5% for AGIs below $10k, 24.8% for AGIs $10k-25k, 30.8% for AGIs $25k-50k, 32.0% for AGIs $50k-75k, 31.0% for AGIs $75k-100k, 25.4% for AGIs over 100k)
Charity contributions deductions: $2,590 (3% of AGI, reported on 50.8% of returns)
Here:
$2,590
State:
$3,923
Here:
3.3% of AGI
State:
3.3% of AGI
(% of AGI for various income ranges: 2.2% for AGIs below $10k, 1.8% for AGIs $10k-25k, 2.3% for AGIs $25k-50k, 2.5% for AGIs $50k-75k, 2.7% for AGIs $75k-100k, 2.4% for AGIs over 100k)
Total tax: $6,134 (reported on 76.8% of returns)
92563:
$6,134
State:
$10,761
(% of AGI for various income ranges: 5.9% for AGIs below $10k, 4.4% for AGIs $10k-25k, 5.4% for AGIs $25k-50k, 6.0% for AGIs $50k-75k, 7.3% for AGIs $75k-100k, 13.4% for AGIs over 100k)
Earned income credit: $1,655 (reported on 11.0% of returns)
Here:
$1,655
State:
$1,763
Percentage of individuals using paid preparers for their 2004 taxes: 66.6%
Here:
67%
State:
66%
(% for various income ranges: 55.9% for AGIs below $10k, 62.2% for AGIs $10k-25k, 68.7% for AGIs $25k-50k, 70.8% for AGIs $50k-75k, 71.0% for AGIs $75k-100k, 71.1% for AGIs over 100k)
Likely homosexual households (counted as self-reported same-sex unmarried-partner households)
Lesbian couples: 0.3% of all households
Gay men: 0.3% of all households
Household received Food Stamps/SNAP in the past 12 months: 1,596 Household did not receive Food Stamps/SNAP in the past 12 months: 20,771
Women who had a birth in the past 12 months: 843 (569 now married, 274 unmarried) Women who did not have a birth in the past 12 months: 19,243 (9,629 now married, 9,531 unmarried)
Housing units in zip code 92563 with a mortgage: 13,002 (1,109 second mortgage, 45 home equity loan, 854 both second mortgage and home equity loan) Houses without a mortgage: 117
Median monthly owner costs for units with a mortgage: $2,703 Median monthly owner costs for units without a mortgage: $780
Residents with income below the poverty level in 2022:
This zip code:
5.4%
Whole state:
12.2%
Residents with income below 50% of the poverty level in 2022:
This zip code:
2.1%
Whole state:
6.2%
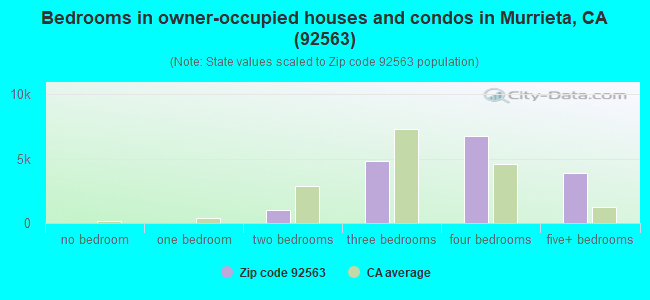
Median number of rooms in houses and condos:
Here:
7.3
State:
6.0
Median number of rooms in apartments:
Here:
5.1
State:
3.9
Notable locations in this zip code not listed on our city pages
Notable locations in zip code 92563: Temecula Hot Springs (A), Rolling Hills Ranch (B), Canyon Chabusco Horse Area (C), Rancho California Country Club (D), French Valley Vineyards (E), American Medical Response Murrieta (F), American Medical Response Unit 302 (G), Murrieta Fire Department Station 4 (H), Murrieta Fire Department Station 3 (I), Riverside County Fire Department Station 83 - French Valley (J). Display/hide their locations on the map
Parks in zip code 92563 include: Alta Murrieta Sports Park (1), Park E (2), Park F (3), Pond Park (4), Rancho Acacias Park (5). Display/hide their locations on the map
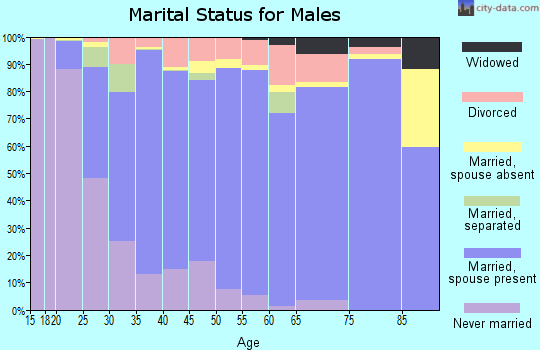
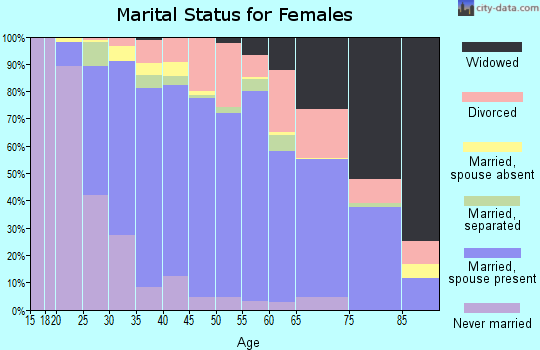
15,704 married couples with children.
3,070 single-parent households (1,433 men, 1,637 women).
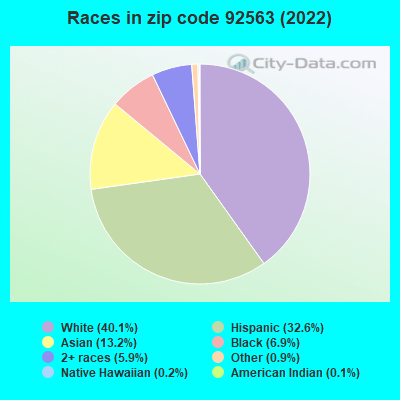
71.0% of residents of 92563 zip code speak English at home.
16.3% of residents speak Spanish at home (76% very well, 13% well, 8% not well, 3% not at all).
2.3% of residents speak other Indo-European language at home (79% very well, 10% well, 4% not well, 7% not at all).
9.2% of residents speak Asian or Pacific Island language at home (59% very well, 30% well, 8% not well, 3% not at all).
0.8% of residents speak other language at home (53% very well, 27% well, 6% not well, 15% not at all).
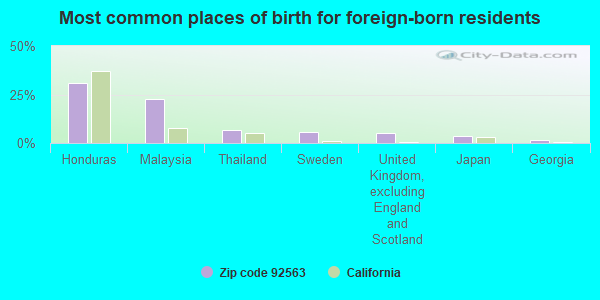
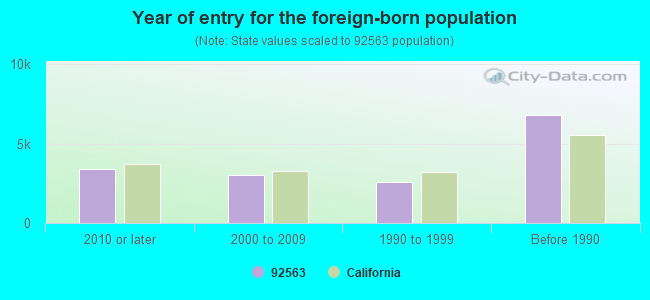
Foreign born population: 13,982 (18.0%) (71.5% of them are naturalized citizens)
This zip code:
18.0%
Whole state:
26.7%
31%Honduras
23%Malaysia
7%Thailand
6%Sweden
5%United Kingdom, excluding England and Scotland
4%Japan
2%Georgia
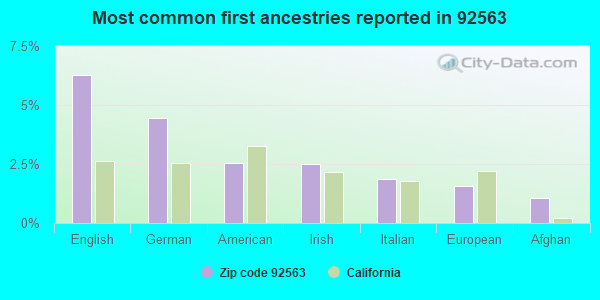
6%English
4%German
3%American
3%Irish
2%Italian
2%European
1%Afghan
Year of entry for the foreign-born population
3,3862010 or later
3,0272000 to 2009
2,6041990 to 1999
6,806Before 1990
Facilities with environmental interests located in this zip code:
EXOTIC ELECTRO OPTICS (36570 BRIGGS RD in MURRIETA, CA)
Large Quantity Generators, more that 1000 kg of hazardous waste/month (Resource Conservation and Recovery Act (tracking hazardous waste)) Large Quantity Generators, more that 1000 kg of hazardous waste/month (Resource Conservation and Recovery Act (tracking hazardous waste)) Business NAICS classification: OPTICAL INSTRUMENT AND LENS MANUFACTURING. Organizations: EXOTIC MATERIALS, INC. (CONTACT/OPERATOR)
, REISUNG ENTERPRISES INC (CONTACT/OWNER)
Alternative names: EXOTIC MATERIALS INC
ALTA MURRIETA ELEMENTARY (39475 WHITEWOOD ROAD in MURRIETA, CA)
(National Center for Education Statistics) - STATE ID-6107841 Organizations: MURRIETA VALLEY UNIFIED (SCHOOL DISTRICT)
CHEVRON 210409 (39440 MURRIETA HOT SPRINGS RD in MURRIETA, CA)
Small Quantity Generators, between 100 kg and 1000 kg of hazardous waste/month (Resource Conservation and Recovery Act (tracking hazardous waste)) Organizations: CHEVRON USA INC (CONTACT/OPERATOR)
NORTH ORANGE COAST PAINTING (WINCHESTER ROAD FRENCH VALLEY 1 MI EAST OF HWY in MURRIETA, CA)
Small Quantity Generators, between 100 kg and 1000 kg of hazardous waste/month (Resource Conservation and Recovery Act (tracking hazardous waste)) - notification
EASTERN MUNICIPAL WATER DISTRI (30980 AULD ROAD in MURRIETA HOT SPRINGS, CA)
CRITERIA AND HAZARDOUS AIR POLLUTANT INVENTORY (Inventory of air pollution sources) Business SIC classification: WATER SUPPLY
FRENCH VALLEY (30195 AULD ROAD in MURRIETA, CA)
CRITERIA AND HAZARDOUS AIR POLLUTANT INVENTORY (Inventory of air pollution sources) Business SIC classification: AIRPORTS, FLYING FIELDS, AND AIRPORT TERMINAL SERVICES
Housing units lacking complete plumbing facilities: 0.1% Housing units lacking complete kitchen facilities: 0.2%
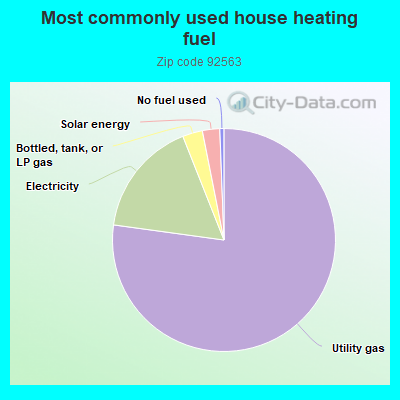
77.1%Utility gas
16.8%Electricity
2.9%Bottled, tank, or LP gas
2.5%Solar energy
0.6%No fuel used
Population in 1990: 22,649.
Place of birth for U.S.-born residents:
This state: 47,875
Northeast: 2,740
Midwest: 3,307
South: 3,765
West: 3,777
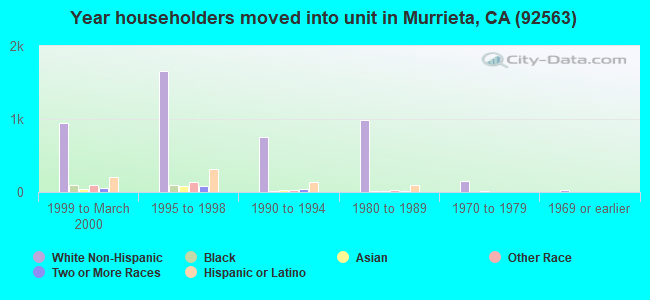
41% of the 92563 zip code residents lived in the same house 5 years ago. Out of people who lived in different houses, 47% lived in this county. Out of people who lived in different counties, 50% lived in California.
87% of the 92563 zip code residents lived in the same house 1 year ago. Out of people who lived in different houses, 43% moved from this county. Out of people who lived in different houses, 46% moved from different county within same state. Out of people who lived in different houses, 9% moved from different state. Out of people who lived in different houses, 2% moved from abroad.
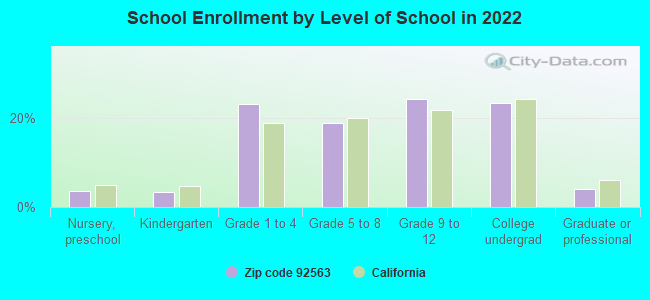
Private vs. public school enrollment:
Students in private schools in grades 1 to 8 (elementary and middle school): 436
Here:
4.5%
California:
10.5%
Students in private schools in grades 9 to 12 (high school): 482
Here:
8.6%
California:
8.5%
Students in private undergraduate colleges: 1,176
Here:
21.7%
California:
15.9%
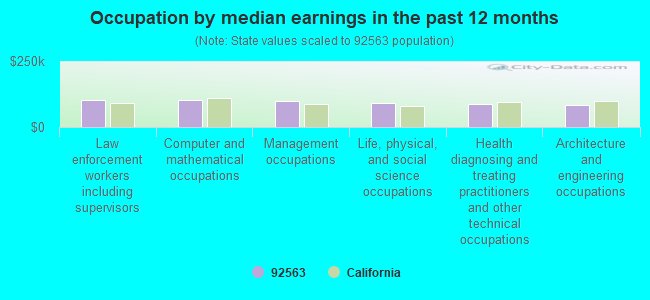
Occupation by median earnings in the past 12 months ($)
103,540Law enforcement workers including supervisors
100,864Computer and mathematical occupations
99,315Management occupations
90,966Life, physical, and social science occupations
87,499Health diagnosing and treating practitioners and other technical occupations
82,186Architecture and engineering occupations
Companies with federal contracts located in this zip code (MURRIETA, CA):
EXOTIC ELECTRO-OPTICS, INC (36570 BRIGGS RD) : $23,066,362 in 67 contractsfrom 1999 to 2006
Contracts for Optical Sighting and Ranging Equipment, Plastics Fabricated Materials, Optical Instruments, Test Equipment, Components and Accessories, Other Defense -- Advanced Development (R&D), and moreby Army, Navy, Defense Logistics Agency, Air Force, and others Signed by year:2000: $801,234; 2001: $1,537,083; 2002: $2,061,795; 2003: $8,346,738; 2004: $2,405,440; 2005: $7,082,727; 2006: $553,025.
Biggest contracts:
$4,099,793 with Army for Optical Sighting and Ranging Equipment. Signed on 2003-12-18. Completion date: 2006-12-31.
$2,918,585 with Army for Plastics Fabricated Materials. Signed on 2005-09-15. Completion date: 2009-01-31.
$1,363,500 with Army for Optical Sighting and Ranging Equipment. Signed on 2002-11-13. Completion date: 2004-04-30.
$1,318,599 with Army for Optical Instruments, Test Equipment, Components and Accessories. Signed on 2005-09-30. Completion date: 2008-12-31.
ROAD BUILDERS, INC (38040 BOREL ROAD; small business) : $13,562,287 in 49 contractsfrom 2001 to 2006
Contracts for Maintenance, Repair or Alteration of Real Property -- Highways, Roads, Streets, Bridges, and Railways (includes resurfacing), Maintenance, Repair or Alteration of Real Property -- Other Airfield Structures, Maintenance, Repair or Alteration of Real Property -- Water Supply Facilities, Maintenance, Repair or Alteration of Real Property -- Sewage and Waste Facilities, and moreby Air Force Signed by year:2000: $0; 2001: $1,800,000; 2002: $4,686,703; 2003: $4,173,359; 2004: $2,323,621; 2005: $373,275; 2006: $205,329.
Biggest contracts:
$4,169,321 with Air Force for Maintenance, Repair or Alteration of Real Property -- Highways, Roads, Streets, Bridges, and Railways (includes resurfacing). Taking place in AZ. Signed on 2002-09-30. Completion date: 2003-03-30.
$2,816,302, same as above.Signed on 2003-09-12. Completion date: 2003-03-30.
$1,800,000, same as above.Signed on 2001-09-30. Completion date: 2002-09-29.
$496,670 with Air Force for Maintenance, Repair or Alteration of Real Property -- Other Airfield Structures. Taking place in AZ. Signed on 2003-07-21. Completion date: 2003-12-21.
PRECISE SURFACE FINISHING (39533 VIA TEMPRANO; small business) : $1,530,992 in 4 contractsfrom 2002 to 2005
$681,992 with Air Force for Miscellaneous Defense Hard Goods -- Management and Support (R&D). Signed on 2005-05-26. Completion date: 2006-07-17.
$375,000, same as above.Signed on 2003-03-17. Completion date: 2005-07-29.
$374,000, same as above.Signed on 2004-02-03. Completion date: 2005-07-29.
$100,000 with Air Force for Other Defense -- Management and Support (R&D). Signed on 2002-04-15. Completion date: 2002-12-30.
G&P TEST ENGINEERING & DESIGN (26345 PLUMERIA LANE; small business) : $354,868 in 19 contractsfrom 2000 to 2006
Contracts for Other Professional Services, Combination and Miscellaneous Instruments, Maintenance, Repair and Rebuilding of Equipment -- Instruments and Laboratory Equipment by Navy Signed by year:2000: $53,187; 2001: $122,328; 2002: $58,702; 2003: $79,101; 2004: $19,189; 2005: $22,361; 2006: $0.
Biggest contracts:
$95,615 with Navy for Other Professional Services. Signed on 2001-11-07. Completion date: 2002-06-22.
$58,702 with Navy for Combination and Miscellaneous Instruments. Signed on 2002-11-21. Completion date: 2003-04-21.
$53,187 with Navy for Maintenance, Repair and Rebuilding of Equipment -- Instruments and Laboratory Equipment. Signed on 2000-09-20. Completion date: 2004-09-30.
$26,713, same as above.Signed on 2001-08-28. Completion date: 2002-09-30.
KNOWLEDGE UNITED INC (38770 SKY CANYON DR STE C; small business) : $12,490 in 2 contractsin 2005
$6,500 with Navy for Education Services. Signed on 2005-02-10. Completion date: 2005-02-24.
$5,990 with Air Force for Training/Curriculum Development. Signed on 2005-12-16. Completion date: 2005-12-23.
AUJU SPORTSWEAR (33608 CARNATION AVE; small business)
$10,544 with Army for Athletic and Sporting Equipment. Signed on 2006-01-12. Completion date: 2006-01-31.
SHOT BLASTERS INC (38069 CYPRESS POINT DRIVE; small business) : $8,017 in 2 contractsin 2004
$4,897 with Navy for Maintenance, Repair and Rebuilding of Equipment -- Construction and Building Materials. Signed on 2004-04-08. Completion date: 2004-04-09.
$3,120 with Navy for Airframe Structural Components. Signed on 2004-02-03. Completion date: 2004-02-17.
ONE EYE GRAPHICS (40228 BANYAN ST; small business)
$6,628 with Navy for Outerwear, Men's. Signed on 2005-09-30. Completion date: 2005-10-17.
HARD, SUZANNE (30355 CARMENET CIRCLE; small business)
$3,600 with Navy for Education Services. Signed on 2005-02-09. Completion date: 2005-05-24.
Top industries in this zip code by the number of employees in 2005:
2006 - 2018 National Fire Incident Reporting System (NFIRS) incidents
Based on the data from the years 2006 - 2018 the average number of fire incidents per year is 19. The highest number of fires - 35 took place in 2018, and the least - 3 in 2006. The data has an increasing trend.
When looking into fire subcategories, the most incidents belonged to: Outside Fires (54.6%), and Mobile Property/Vehicle Fires (20.1%).
Fire incident types reported to NFIRS in Zip Code 92563


 Nearest zip codes: 92591, 92584, 92595, 92592, 92590, 92596.


 Based on the data from the years 2006 - 2018 the average number of fire incidents per year is 19. The highest number of fires - 35 took place in 2018, and the least - 3 in 2006. The data has an increasing trend.
 When looking into fire subcategories, the most incidents belonged to: Outside Fires (54.6%), and Mobile Property/Vehicle Fires (20.1%).