Murrieta, California
Murrieta: Warm Springs Middle School - 39245 Calle De Fortuna
Murrieta: Sun Flower by Walmart at Madison Avenue, Murrieta
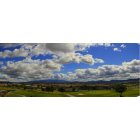
Murrieta: Rancho California Golf Club Murrieta California
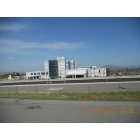
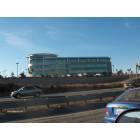
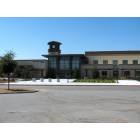
Murrieta: Constrution nearing completion for the Loma Linda University Medical Center Murrieta, as seen from I-215
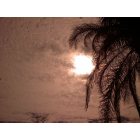
Murrieta: Even in the city, it can be beautiful
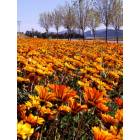
Murrieta: Sun Flower by Walmart at Madison Avenue, Murrieta
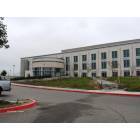
Murrieta: University of Phoenix Bldg, Murrieta CA
Murrieta: Southwest Justice Center
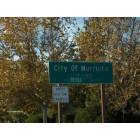
Murrieta: Murrieta, CA sign on northbound Jefferson Ave, leaving Temecula
Murrieta: Murrieta City Hall - Jefferson Ave & Kalima
- add
your
Submit your own pictures of this city and show them to the world
- OSM Map
- General Map
- Google Map
- MSN Map
Population change since 2000: +157.0%
| Males: 55,378 | |
| Females: 58,405 |
| Median resident age: | 35.8 years |
| California median age: | 37.9 years |
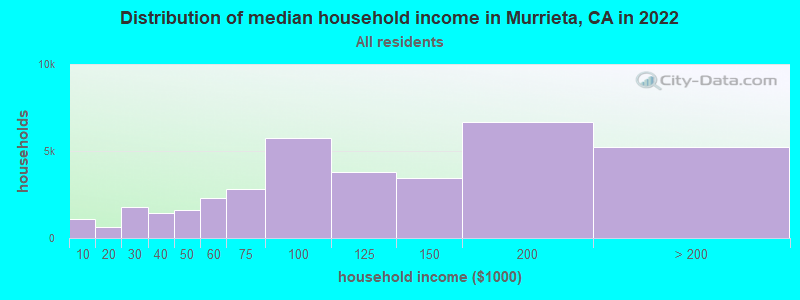
| Murrieta: | $106,709 |
| CA: | $91,551 |
Estimated per capita income in 2022: $42,093 (it was $23,290 in 2000)
Murrieta city income, earnings, and wages data
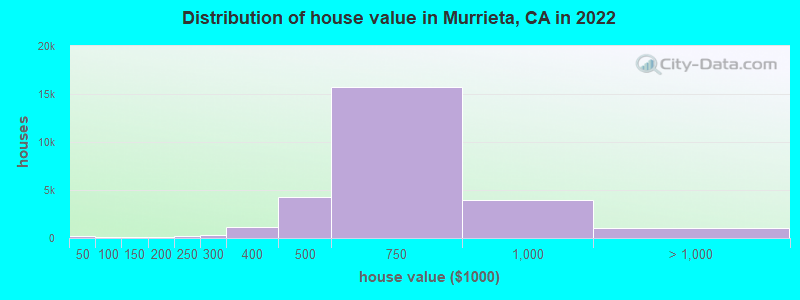
Estimated median house or condo value in 2022: $648,600 (it was $190,300 in 2000)
| Murrieta: | $648,600 |
| CA: | $715,900 |
Mean prices in 2022: all housing units: $668,063; detached houses: $683,383; townhouses or other attached units: $622,226; in 3-to-4-unit structures: $838,558; in 5-or-more-unit structures: $359,849; mobile homes: $334,888
Median gross rent in 2022: $2,216.
(6.8% for White Non-Hispanic residents, 4.3% for Black residents, 4.5% for Hispanic or Latino residents, 17.4% for American Indian residents, 9.3% for Native Hawaiian and other Pacific Islander residents, 4.4% for other race residents, 6.0% for two or more races residents)
Detailed information about poverty and poor residents in Murrieta, CA


Compare current foreclosures in Murrieta, CA:
| Photo | Address | Area | Beds / Baths | Price | Details |
|---|---|---|---|---|---|

|
#1
Avenida Bonita
Murrieta, CA 92562
|
3,359 sq. feet
|
4 baths 4 beds |
show details | |

|
#2
Via Las Laderas
Murrieta, CA 92562
|
2,102 sq. feet
|
2 baths 3 beds |
show details | |

|
#3
Cottonwood St
Murrieta, CA 92563
|
2,797 sq. feet
|
3 baths 4 beds |
show details | |

|
#4
Sonata Dr
Murrieta, CA 92562
|
3,028 sq. feet
|
3 baths 5 beds |
show details | |

|
#5
Calle Arrebol
Murrieta, CA 92563
|
1,810 sq. feet
|
2 baths 2 beds |
show details | |

|
#6
Pearl Dr
Murrieta, CA 92563
|
1,904 sq. feet
|
3 baths 4 beds |
show details | |

|
#7
Sweet Magnolia Way
Murrieta, CA 92563
|
3,732 sq. feet
|
4 baths 4 beds |
show details | |

|
#8
Mahonia Way
Murrieta, CA 92562
|
2,854 sq. feet
|
3 baths 5 beds |
show details | |

|
#9
3rd Ave
Murrieta, CA 92562
|
840 sq. feet
|
2 baths 2 beds |
show details | |

|
#10
Millstream Rd
Murrieta, CA 92563
|
2,037 sq. feet
|
2 baths 4 beds |
show details |
| Photo | Address | Area | Beds / Baths | Price | Details |
|---|---|---|---|---|---|

|
#11
Underwood Cir
Murrieta, CA 92562
|
3,470 sq. feet
|
2 baths 4 beds |
show details | |

|
#12
Stargazer Way
Murrieta, CA 92563
|
1,747 sq. feet
|
3 baths 4 beds |
show details | |

|
#13
Wheatley Dr
Murrieta, CA 92563
|
2,268 sq. feet
|
3 baths 4 beds |
show details | |

|
#14
Via Magnolia
Murrieta, CA 92563
|
1,776 sq. feet
|
2 baths 2 beds |
show details | |

|
#15
Monaco Way
Murrieta, CA 92563
|
1,555 sq. feet
|
2 baths 4 beds |
show details | |

|
#16
Arboretum Way Unit 504
Murrieta, CA 92563
|
1,896 sq. feet
|
2 baths 3 beds |
show details | |

|
#17
Sundrop Ave
Murrieta, CA 92563
|
3,113 sq. feet
|
2 baths 4 beds |
show details | |

|
#18
Meadowgate Ct
Murrieta, CA 92562
|
2,405 sq. feet
|
3 baths 4 beds |
show details | |

|
#19
Palomera Ln
Murrieta, CA 92563
|
3,301 sq. feet
|
2 baths 4 beds |
show details | |

|
#20
Khepera Ct
Murrieta, CA 92563
|
2,706 sq. feet
|
4 baths 7 beds |
show details |
| Photo | Address | Area | Beds / Baths | Price | Details |
|---|---|---|---|---|---|

|
#21
Lemon Grass Way
Murrieta, CA 92562
|
3,306 sq. feet
|
3 baths 4 beds |
show details | |

|
#22
Hawkeye St
Murrieta, CA 92563
|
2,860 sq. feet
|
3 baths 5 beds |
show details | |

|
#23
Hydrangea St
Murrieta, CA 92563
|
3,113 sq. feet
|
2 baths 4 beds |
show details | |

|
#24
Willow Haven Ln Unit 103
Murrieta, CA 92563
|
1,246 sq. feet
|
2 baths 2 beds |
show details | |

|
#25
Via La Rueda
Murrieta, CA 92563
|
1,248 sq. feet
|
2 baths 2 beds |
show details | |

|
#26
Socorro St Unit 81
Murrieta, CA 92563
|
1,472 sq. feet
|
2 baths 3 beds |
show details | |

|
#27
Day Lily Dr
Murrieta, CA 92563
|
2,310 sq. feet
|
2 baths 3 beds |
show details | |

|
#28
Avenida La Cresta
Murrieta, CA 92562
|
3,908 sq. feet
|
3 baths 5 beds |
show details | |

|
#29
The Trails Cir
Murrieta, CA 92562
|
4,430 sq. feet
|
3 baths 5 beds |
show details | |

|
#30
Saint Ives Ct
Murrieta, CA 92563
|
1,740 sq. feet
|
2 baths 4 beds |
show details |
| Photo | Address | Area | Beds / Baths | Price | Details |
|---|---|---|---|---|---|

|
#31
Calle Potro
Murrieta, CA 92563
|
1,680 sq. feet
|
2 baths 3 beds |
show details | |

|
#32
Tuscola Cir
Murrieta, CA 92562
|
1,562 sq. feet
|
4 baths 3 beds |
show details | |

|
#33
Savanna Way
Murrieta, CA 92563
|
3,127 sq. feet
|
4 baths 6 beds |
show details | |

|
#34
Avenida De Arboles
Murrieta, CA 92562
|
5,773 sq. feet
|
7 baths 8 beds |
show details | |

|
#35
Maxmillian Ave
Murrieta, CA 92563
|
3,923 sq. feet
|
4 baths 6 beds |
show details | |

|
#36
Ariel Hope Way
Murrieta, CA 92563
|
4,063 sq. feet
|
4 baths 5 beds |
show details | |

|
#37
Desert Oak Ln
Murrieta, CA 92562
|
2,375 sq. feet
|
2 baths 5 beds |
show details | |

|
#38
Mountain Song Loop
Murrieta, CA 92562
|
3,270 sq. feet
|
3 baths 3 beds |
show details | |

|
#39
Nice Ave
Murrieta, CA 92562
|
2,262 sq. feet
|
2 baths 4 beds |
show details | |

|
#40
Morella Cir
Murrieta, CA 92562
|
1,591 sq. feet
|
2 baths 3 beds |
show details |
| Photo | Address | Area | Beds / Baths | Price | Details |
|---|---|---|---|---|---|

|
#41
New Haven Dr
Murrieta, CA 92562
|
1,828 sq. feet
|
2 baths 4 beds |
show details | |

|
#42
Via Careza
Murrieta, CA 92563
|
1,680 sq. feet
|
3 baths 4 beds |
show details | |

|
#43
Ash Ct
Murrieta, CA 92562
|
3,165 sq. feet
|
3 baths 4 beds |
show details | |

|
#44
Longbranch Ave
Murrieta, CA 92563
|
3,312 sq. feet
|
4 baths 5 beds |
show details | |

|
#45
Ellison Ln Unit 3
Murrieta, CA 92562
|
1,761 sq. feet
|
3 baths 3 beds |
show details | |

|
#46
Green Side Ct
Murrieta, CA 92563
|
2,154 sq. feet
|
3 baths 3 beds |
show details | |

|
#47
Hayes Ave
Murrieta, CA 92562
|
3,186 sq. feet
|
4 baths 5 beds |
show details | |

|
#48
Via La Rueda
Murrieta, CA 92563
|
1,440 sq. feet
|
2 baths 3 beds |
show details | |

|
#49
Magnolia Pt
Murrieta, CA 92563
|
1,956 sq. feet
|
2 baths 3 beds |
show details | |

|
Check over 1 million property listings on Foreclosure.com!
|
browse all offers | |||


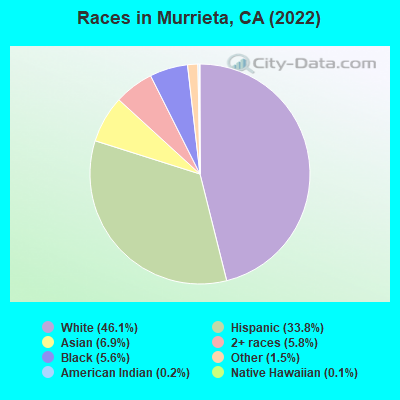
- 52,46346.1%White alone
- 38,47033.8%Hispanic
- 7,8726.9%Asian alone
- 6,5685.8%Two or more races
- 6,3685.6%Black alone
- 1,6541.5%Other race alone
- 2420.2%American Indian alone
- 1370.1%Native Hawaiian and Other
Pacific Islander alone
According to our research of California and other state lists, there were 76 registered sex offenders living in Murrieta, California as of April 27, 2024.
The ratio of all residents to sex offenders in Murrieta is 1,470 to 1.
The ratio of registered sex offenders to all residents in this city is lower than the state average.
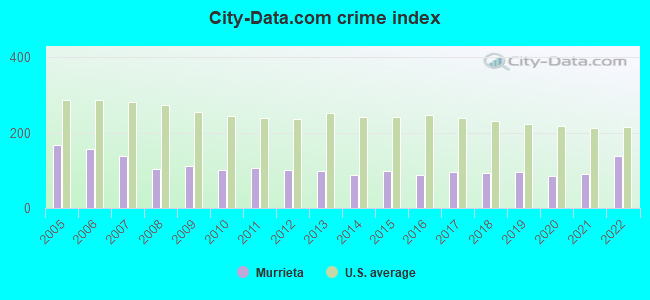
The City-Data.com crime index weighs serious crimes and violent crimes more heavily. Higher means more crime, U.S. average is 246.1. It adjusts for the number of visitors and daily workers commuting into cities.
- means the value is smaller than the state average.- means the value is about the same as the state average.
Crime rate in Murrieta detailed stats: murders, rapes, robberies, assaults, burglaries, thefts, arson
Full-time law enforcement employees in 2021, including police officers: 159 (102 officers - 94 male; 8 female).
| Officers per 1,000 residents here: | 0.87 |
| California average: | 2.30 |
 Recent articles from our blog. Our writers, many of them Ph.D. graduates or candidates, create easy-to-read articles on a wide variety of topics.


Latest news from Murrieta, CA collected exclusively by city-data.com from local newspapers, TV, and radio stations
Ancestries: English (5.9%), German (4.9%), Irish (4.1%), American (3.7%), Italian (3.1%), European (3.1%).
Current Local Time: PST time zone
Elevation: 1093 feet
Land area: 28.4 square miles.
Population density: 4,008 people per square mile (average).
17,756 residents are foreign born (7.3% Latin America, 5.8% Asia).
| This city: | 15.6% |
| California: | 26.5% |
Median real estate property taxes paid for housing units with mortgages in 2022: $6,094 (0.9%)
Median real estate property taxes paid for housing units with no mortgage in 2022: $4,508 (0.7%)
Nearest city with pop. 50,000+: Temecula, CA  (6.5 miles , pop. 57,716).
Nearest city with pop. 200,000+: Riverside, CA (28.5 miles , pop. 255,166).
Nearest city with pop. 1,000,000+: San Diego, CA (54.7 miles , pop. 1,223,400).
Nearest cities:
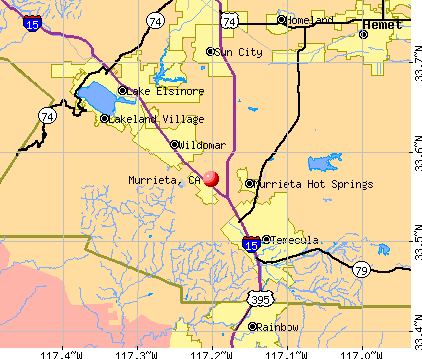
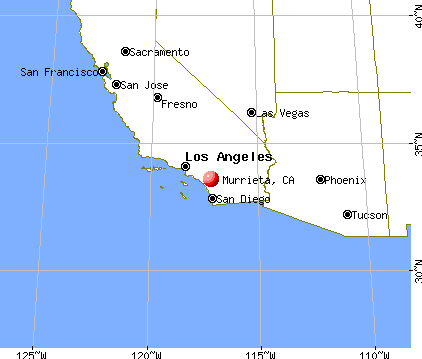
), ), Latitude: 33.57 N, Longitude: 117.20 W
Daytime population change due to commuting: -14,983 (-13.2%)
Workers who live and work in this city: 18,635 (34.7%)
Area code: 909
Murrieta, California accommodation & food services, waste management - Economy and Business Data
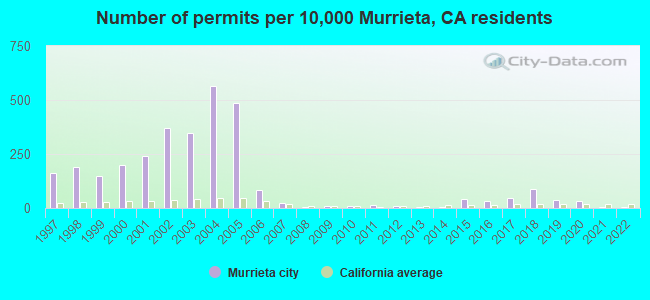
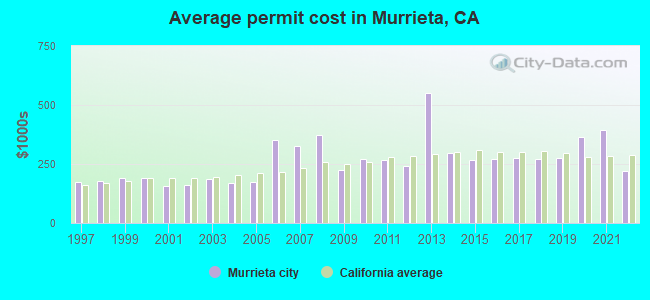
Single-family new house construction building permits:
- 2022: 18 buildings, average cost: $220,400
- 2021: 25 buildings, average cost: $394,000
- 2020: 136 buildings, average cost: $366,000
- 2019: 162 buildings, average cost: $275,500
- 2018: 397 buildings, average cost: $270,800
- 2017: 200 buildings, average cost: $274,000
- 2016: 143 buildings, average cost: $271,300
- 2015: 182 buildings, average cost: $266,500
- 2014: 16 buildings, average cost: $297,500
- 2013: 13 buildings, average cost: $550,100
- 2012: 35 buildings, average cost: $240,700
- 2011: 67 buildings, average cost: $267,300
- 2010: 40 buildings, average cost: $270,100
- 2009: 42 buildings, average cost: $223,300
- 2008: 15 buildings, average cost: $375,100
- 2007: 93 buildings, average cost: $328,000
- 2006: 377 buildings, average cost: $351,600
- 2005: 2147 buildings, average cost: $173,000
- 2004: 2509 buildings, average cost: $170,700
- 2003: 1530 buildings, average cost: $188,200
- 2002: 1648 buildings, average cost: $158,500
- 2001: 1069 buildings, average cost: $155,300
- 2000: 886 buildings, average cost: $190,400
- 1999: 653 buildings, average cost: $189,900
- 1998: 833 buildings, average cost: $177,000
- 1997: 713 buildings, average cost: $173,900
| Here: | 4.2% |
| California: | 5.1% |
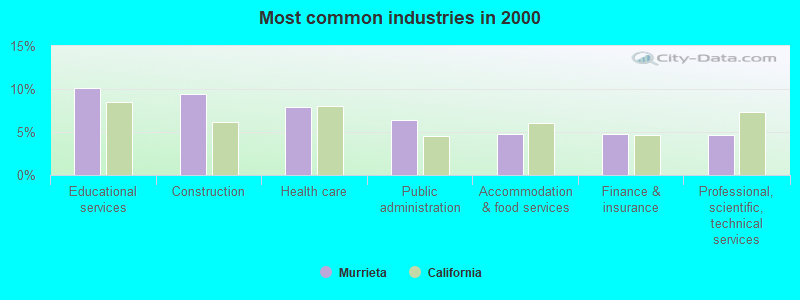
- Educational services (10.1%)
- Construction (9.4%)
- Health care (7.9%)
- Public administration (6.4%)
- Accommodation & food services (4.8%)
- Finance & insurance (4.8%)
- Professional, scientific, technical services (4.7%)
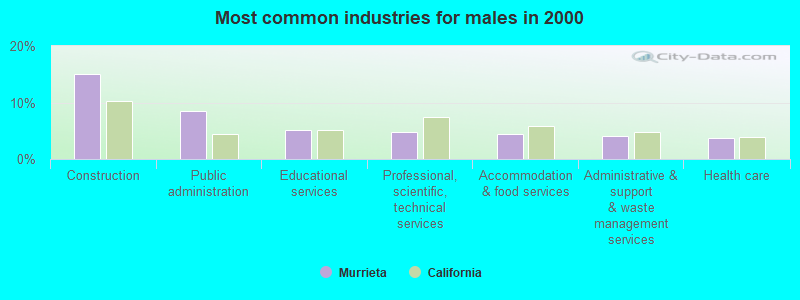
- Construction (15.0%)
- Public administration (8.5%)
- Educational services (5.1%)
- Professional, scientific, technical services (4.8%)
- Accommodation & food services (4.4%)
- Administrative & support & waste management services (4.1%)
- Health care (3.7%)
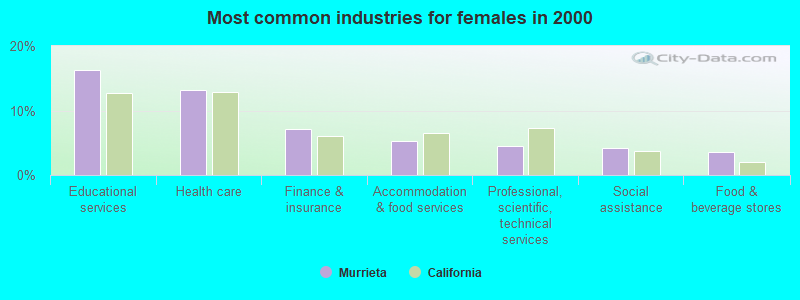
- Educational services (16.3%)
- Health care (13.1%)
- Finance & insurance (7.1%)
- Accommodation & food services (5.3%)
- Professional, scientific, technical services (4.5%)
- Social assistance (4.2%)
- Food & beverage stores (3.6%)
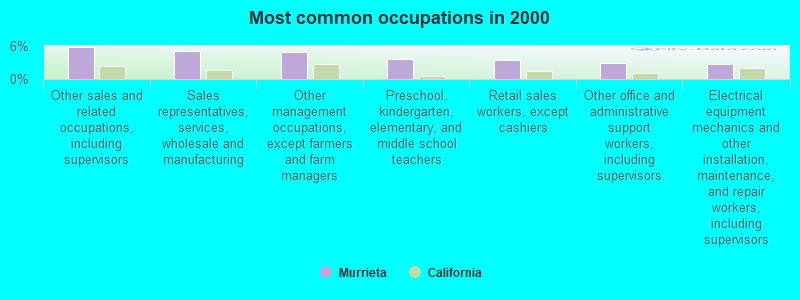
- Other sales and related occupations, including supervisors (5.8%)
- Sales representatives, services, wholesale and manufacturing (5.1%)
- Other management occupations, except farmers and farm managers (4.9%)
- Preschool, kindergarten, elementary, and middle school teachers (3.7%)
- Retail sales workers, except cashiers (3.4%)
- Other office and administrative support workers, including supervisors (3.0%)
- Electrical equipment mechanics and other installation, maintenance, and repair workers, including supervisors (2.8%)
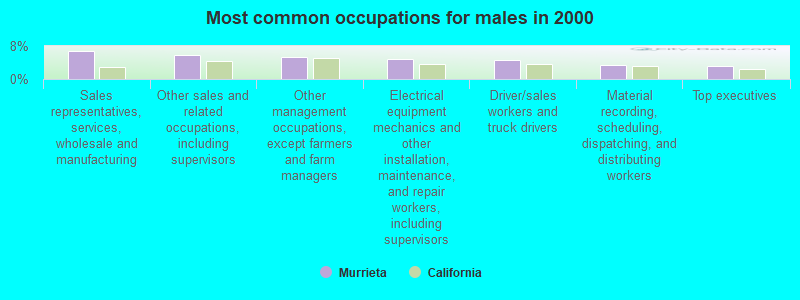
- Sales representatives, services, wholesale and manufacturing (6.7%)
- Other sales and related occupations, including supervisors (5.7%)
- Other management occupations, except farmers and farm managers (5.3%)
- Electrical equipment mechanics and other installation, maintenance, and repair workers, including supervisors (4.8%)
- Driver/sales workers and truck drivers (4.6%)
- Material recording, scheduling, dispatching, and distributing workers (3.3%)
- Top executives (3.1%)
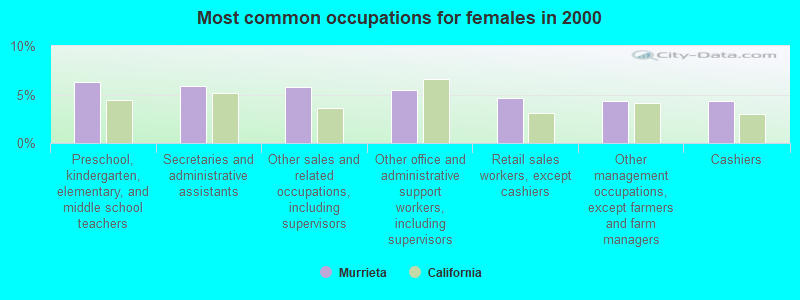
- Preschool, kindergarten, elementary, and middle school teachers (6.3%)
- Secretaries and administrative assistants (5.9%)
- Other sales and related occupations, including supervisors (5.8%)
- Other office and administrative support workers, including supervisors (5.4%)
- Retail sales workers, except cashiers (4.6%)
- Other management occupations, except farmers and farm managers (4.4%)
- Cashiers (4.3%)
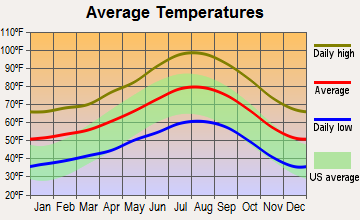
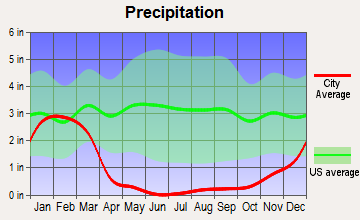
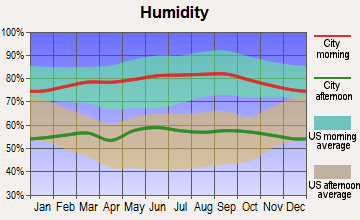
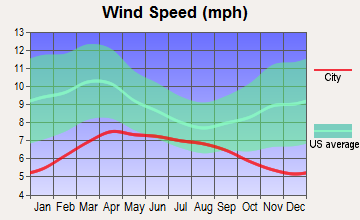
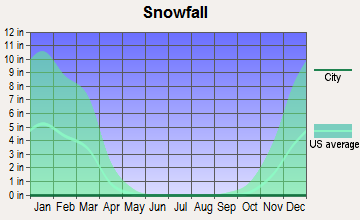
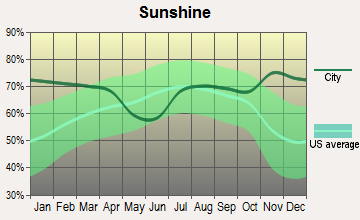
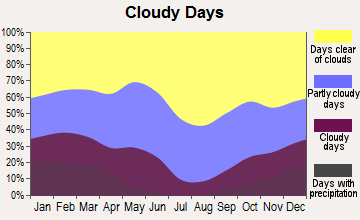
Average climate in Murrieta, California
Based on data reported by over 4,000 weather stations
|
|

(lower is better)
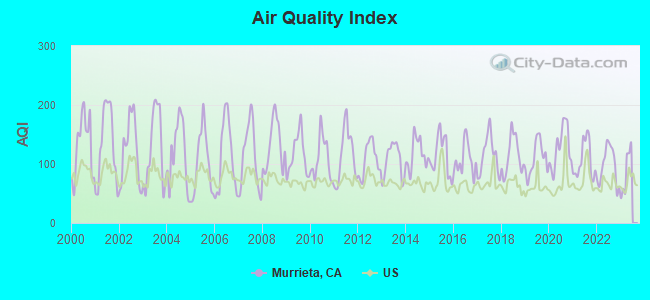
Air Quality Index (AQI) level in 2022 was 96.9. This is worse than average.
| City: | 96.9 |
| U.S.: | 72.6 |
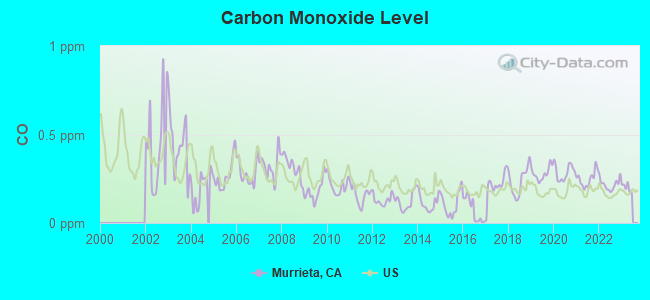
Carbon Monoxide (CO) [ppm] level in 2022 was 0.218. This is about average. Closest monitor was 6.3 miles away from the city center.
| City: | 0.218 |
| U.S.: | 0.251 |
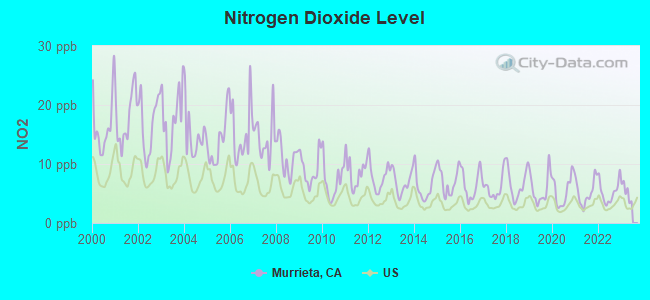
Nitrogen Dioxide (NO2) [ppb] level in 2022 was 5.25. This is about average. Closest monitor was 6.3 miles away from the city center.
| City: | 5.25 |
| U.S.: | 5.11 |
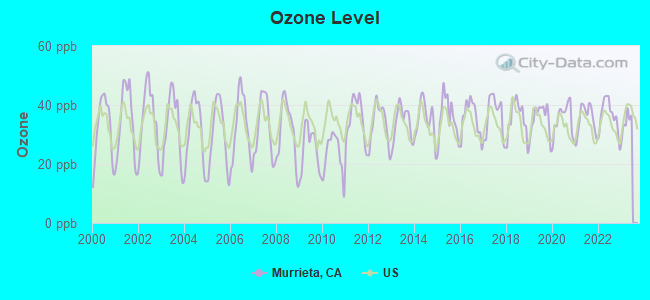
Ozone [ppb] level in 2022 was 36.3. This is about average. Closest monitor was 6.3 miles away from the city center.
| City: | 36.3 |
| U.S.: | 33.3 |
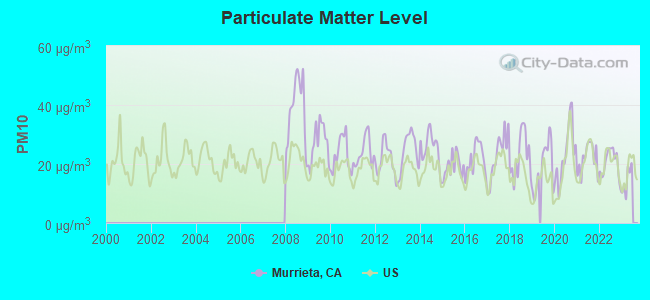
Particulate Matter (PM10) [µg/m3] level in 2022 was 20.2. This is about average. Closest monitor was 6.3 miles away from the city center.
| City: | 20.2 |
| U.S.: | 19.2 |
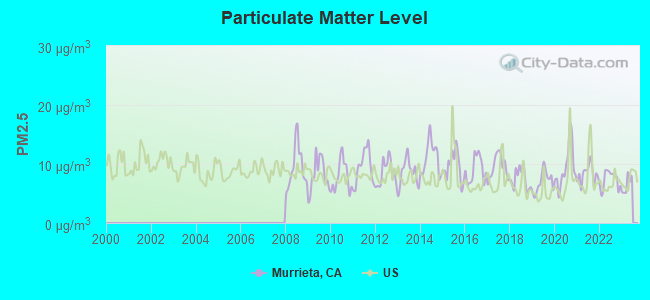
Particulate Matter (PM2.5) [µg/m3] level in 2022 was 7.28. This is about average. Closest monitor was 10.7 miles away from the city center.
| City: | 7.28 |
| U.S.: | 8.11 |
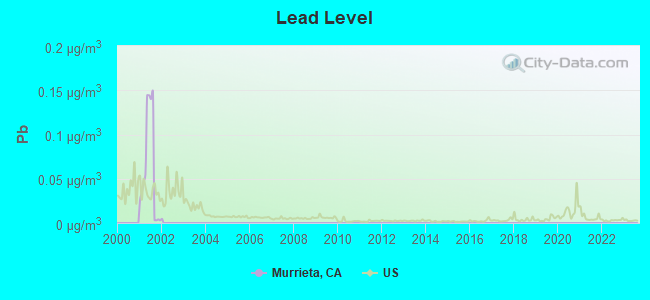
Lead (Pb) [µg/m3] level in 2001 was 0.0627. This is significantly worse than average. Closest monitor was 15.3 miles away from the city center.
| City: | 0.0627 |
| U.S.: | 0.0093 |
Earthquake activity:
Murrieta-area historical earthquake activity is significantly above California state average. It is 6842% greater than the overall U.S. average.On 6/28/1992 at 11:57:34, a magnitude 7.6 (6.2 MB, 7.6 MS, 7.3 MW, Depth: 0.7 mi, Class: Major, Intensity: VIII - XII) earthquake occurred 57.3 miles away from the city center, causing 3 deaths (1 shaking deaths, 2 other deaths) and 400 injuries, causing $100,000,000 total damage and $40,000,000 insured losses
On 7/21/1952 at 11:52:14, a magnitude 7.7 (7.7 UK) earthquake occurred 142.6 miles away from the city center, causing $50,000,000 total damage
On 10/16/1999 at 09:46:44, a magnitude 7.4 (6.3 MB, 7.4 MS, 7.2 MW, 7.3 ML) earthquake occurred 78.8 miles away from Murrieta center
On 5/19/1940 at 04:36:40, a magnitude 7.2 (7.2 UK) earthquake occurred 90.2 miles away from the city center, causing $33,000,000 total damage
On 4/21/1918 at 22:32:30, a magnitude 6.8 (6.8 UK, Class: Strong, Intensity: VII - IX) earthquake occurred 21.6 miles away from Murrieta center
On 12/31/1934 at 18:45:56, a magnitude 7.1 (7.1 UK) earthquake occurred 103.5 miles away from Murrieta center
Magnitude types: body-wave magnitude (MB), local magnitude (ML), surface-wave magnitude (MS), moment magnitude (MW)
Natural disasters:
The number of natural disasters in Riverside County (46) is a lot greater than the US average (15).Major Disasters (Presidential) Declared: 27
Emergencies Declared: 1
Causes of natural disasters: Fires: 22, Floods: 20, Storms: 8, Winter Storms: 8, Landslides: 6, Mudslides: 5, Heavy Rains: 2, Earthquake: 1, Flash Flood: 1, Freeze: 1, Hurricane: 1, Tornado: 1, Tropical Storm: 1, Other: 1 (Note: some incidents may be assigned to more than one category).

Hospitals and medical centers in Murrieta:
- LOMA LINDA UNIVERSITY MEDICAL CENTER-MURRIETA (Proprietary, provides emergency services, 28062 BAXTER ROAD)
- SOUTHWEST HEALTHCARE SYSTEM (Proprietary, 25500 MEDICAL CENTER DRIVE)
- COUNTRY VILLA MURRIETA HEALTHCARE CENTER (24100 MONROE AVENUE)
- RANCHO SPRINGS MEDICAL CENTER D/P SNF (25500 MEDICAL CENTER DRIVE)
- DAVITA-MURRIETA (25100 HANCOCK AVENUE, SUITE 101-103)
Airports and heliports located in Murrieta:
See details about Airports and heliports located in Murrieta, CACollege/University in Murrieta:
Colleges/universities with over 2000 students nearest to Murrieta:
- Mt San Jacinto Community College District (about 22 miles; San Jacinto, CA; Full-time enrollment: 8,426)
- Moreno Valley College (about 22 miles; Moreno Valley, CA; FT enrollment: 4,650)
- Saddleback College (about 27 miles; Mission Viejo, CA; FT enrollment: 13,716)
- MiraCosta College (about 27 miles; Oceanside, CA; FT enrollment: 11,189)
- California Baptist University (about 28 miles; Riverside, CA; FT enrollment: 6,085)
- La Sierra University (about 29 miles; Riverside, CA; FT enrollment: 2,205)
- Palomar College (about 30 miles; San Marcos, CA; FT enrollment: 15,037)
Public high schools in Murrieta:
- VISTA MURRIETA HIGH (Students: 2,559, Location: 28251 CLINTON KEITH RD., Grades: 9-12)
- MURRIETA VALLEY HIGH (Students: 2,268, Location: 42200 NIGHTHAWK WAY, Grades: 9-12)
- MURRIETA MESA HIGH (Students: 427, Location: 24801 MONROE AVE., Grades: 9-12)
- TENAJA CANYON ACADEMY (Students: 30, Location: 24150 HAYES AVE., Grades: KG-12)
Private high schools in Murrieta:
Biggest public elementary/middle schools in Murrieta:
- SHIVELA MIDDLE (Students: 1,555, Location: 24515 LINCOLN AVE., Grades: 6-8)
- WARM SPRINGS MIDDLE (Students: 1,289, Location: 39245 CALLE DE FORTUNA, Grades: 6-8)
- BELLA VISTA MIDDLE (Students: 1,219, Location: 31650 BROWNING ST., Grades: 6-8)
- LISA J. MAILS ELEMENTARY (Students: 868, Location: 35185 BRIGGS RD., Grades: KG-7)
- DOROTHY MCELHINNEY MIDDLE (Students: 740, Location: 35185 BRIGGS RD., Grades: 6-8)
- DANIEL N. BUCHANAN ELEMENTARY (Students: 695, Location: 40121 TORREY PINES RD., Grades: KG-5)
- MURRIETA ELEMENTARY (Students: 614, Location: 24725 ADAMS AVE., Grades: KG-5)
- ANTELOPE HILLS ELEMENTARY (Students: 551, Location: 36105 MURRIETA OAKS AVE., Grades: KG-5)
- MONTE VISTA ELEMENTARY (Students: 548, Location: 37420 VIA MIRA MOSA, Grades: KG-5)
- TOVASHAL ELEMENTARY (Students: 504, Location: 23801 VIA SANTEE, Grades: KG-5)
User-submitted facts and corrections:
- There are two additional medical facilities: Rancho Springs Medical Center and Inland Valley Medical Center.
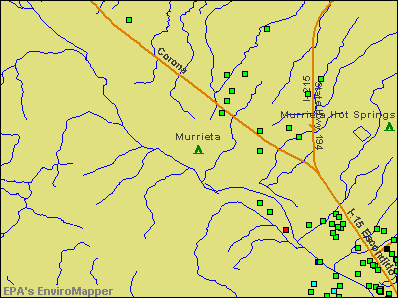
Points of interest:
Notable locations in Murrieta: Temecula Hot Springs (A), The Colony Golf Course (B), Bear Creek Golf and Country Club (C), Riverside County Bear Creek Forest Service Station (D), Murrieta Town Hall (E), Murrieta Chamber of Commerce (F), American Medical Response Unit 302 (G), American Medical Response Murrieta Station 2 (H), Riverside County Fire Department Station 75 - Bear Creek (I), Murrieta Fire Department Station 4 (J), Murrieta Fire Department Station 2 (K), Murrieta Fire Department Station 3 (L), Murrieta Fire Department Station 1 (M). Display/hide their locations on the map
Shopping Center: Murrieta Town Center Shopping Center (1). Display/hide its location on the map
Churches in Murrieta include: Peoples Church of the Valley (A), United Church of the Valley (B). Display/hide their locations on the map
Cemetery: Laurel Cemetery (1). Display/hide its location on the map
Creek: Warm Springs Creek (A). Display/hide its location on the map
Parks in Murrieta include: Alta Murrieta Sports Park (1), California Oaks Sports Park (2), Meadow Ridge Park (3), Park F (4), Pond Park (5), Rancho Acacias Park (6), Willowglen Park (7). Display/hide their locations on the map
Tourist attractions: A.C. World Travel (29995 Technology Dr. Suite #303) (1), Brunswick Recreation Centers (Brunswick Cal Oaks B) (2). Display/hide their approximate locations on the map
Birthplace of: Rickie Fowler - Professional golfer, Ambyr Childers - Soap opera actor, Daniel Fleming - College basketball player (UC Riverside Highlanders), Federico Lopez (fighter) - Martial artist, Ike Williams - College basketball player (UCLA Bruins).
| This city: | 3.1 people |
| California: | 2.9 people |
| This city: | 79.5% |
| Whole state: | 68.7% |
| This city: | 5.6% |
| Whole state: | 7.2% |
Likely homosexual households (counted as self-reported same-sex unmarried-partner households)
- Lesbian couples: 0.4% of all households
- Gay men: 0.2% of all households
People in group quarters in Murrieta in 2010:
- 143 people in college/university student housing
- 96 people in workers' group living quarters and job corps centers
- 76 people in residential treatment centers for juveniles (non-correctional)
- 56 people in nursing facilities/skilled-nursing facilities
- 52 people in group homes intended for adults
- 6 people in in-patient hospice facilities
People in group quarters in Murrieta in 2000:
- 73 people in other group homes
- 63 people in nursing homes
- 50 people in other noninstitutional group quarters
Banks with most branches in Murrieta (2011 data):
- Bank of America, National Association: Murrieta Branch, Clinton Keith Branch, West Murrieta Branch, Winchester Branch. Info updated 2009/11/18: Bank assets: $1,451,969.3 mil, Deposits: $1,077,176.8 mil, headquarters in Charlotte, NC, positive income, 5782 total offices, Holding Company: Bank Of America Corporation
- Wells Fargo Bank, National Association: Silverhawk Branch, Cal-Oaks Plaza Branch, Murrieta Branch, Heritage Marketplace. Info updated 2011/04/05: Bank assets: $1,161,490.0 mil, Deposits: $905,653.0 mil, headquarters in Sioux Falls, SD, positive income, 6395 total offices, Holding Company: Wells Fargo & Company
- U.S. Bank National Association: Temecula Albertsons Branch, Murrieta & Winchester Vons Branch, Murrieta Ralphs Branch, Murrieta Stater Brothers. Info updated 2012/01/30: Bank assets: $330,470.8 mil, Deposits: $236,091.5 mil, headquarters in Cincinnati, OH, positive income, 3121 total offices, Holding Company: U.S. Bancorp
- JPMorgan Chase Bank, National Association: Murrieta Albertsons Branch at 28047 Scott Rd, branch established on 2010/09/22; Murrieta Branch at 40655 California Oaks Road, branch established on 1990/05/29. Info updated 2011/11/10: Bank assets: $1,811,678.0 mil, Deposits: $1,190,738.0 mil, headquarters in Columbus, OH, positive income, International Specialization, 5577 total offices, Holding Company: Jpmorgan Chase & Co.
- Commerce Bank of Temecula Valley: Commerce Bank Of Temecula Valley at 25220 Hancock Avenue, Suite #140, branch established on 2007/09/17. Info updated 2011/09/07: Bank assets: $46.0 mil, Deposits: $36.6 mil, local headquarters, negative income in the last year, Commercial Lending Specialization, 1 total offices
- First-Citizens Bank & Trust Company: Murrieta Branch at 41500 Ivy Street, branch established on 2001/01/11. Info updated 2011/10/11: Bank assets: $20,566.4 mil, Deposits: $17,596.8 mil, headquarters in Raleigh, NC, positive income, Commercial Lending Specialization, 433 total offices, Holding Company: First Citizens Bancshares, Inc.
- Rabobank, National Association: Murrieta Branch at 40723 Murrieta Hot Springs Rd., branch established on 2007/07/01. Info updated 2011/01/27: Bank assets: $11,745.0 mil, Deposits: $8,446.0 mil, headquarters in Roseville, CA, positive income, Agricultural Specialization, 124 total offices, Holding Company: Cooperatieve Centrale Raiffeisen-Boerenleenbank B.A., "rabobank Nederland
- Compass Bank: Murrieta Branch at 40780 California Oaks Road, branch established on 1991/03/01. Info updated 2011/02/24: Bank assets: $63,107.0 mil, Deposits: $46,232.4 mil, headquarters in Birmingham, AL, negative income in the last year, Commercial Lending Specialization, 720 total offices, Holding Company: Banco Bilbao Vizcaya Argentaria, S.A.
- Pacific Western Bank: Murrieta Branch Office at 41381 Kalmia Avenue, branch established on 2004/10/04. Info updated 2011/03/14: Bank assets: $5,513.1 mil, Deposits: $4,614.5 mil, headquarters in Los Angeles, CA, positive income, Commercial Lending Specialization, 78 total offices, Holding Company: Capgen Capital Group Ii Lp
For population 15 years and over in Murrieta:
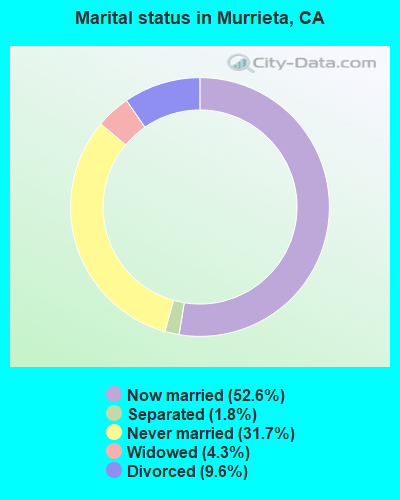
- Never married: 31.7%
- Now married: 52.6%
- Separated: 1.8%
- Widowed: 4.3%
- Divorced: 9.6%
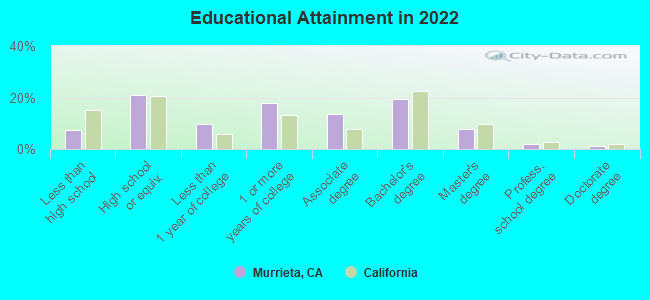
For population 25 years and over in Murrieta:
- High school or higher: 92.7%
- Bachelor's degree or higher: 30.7%
- Graduate or professional degree: 11.1%
- Unemployed: 4.6%
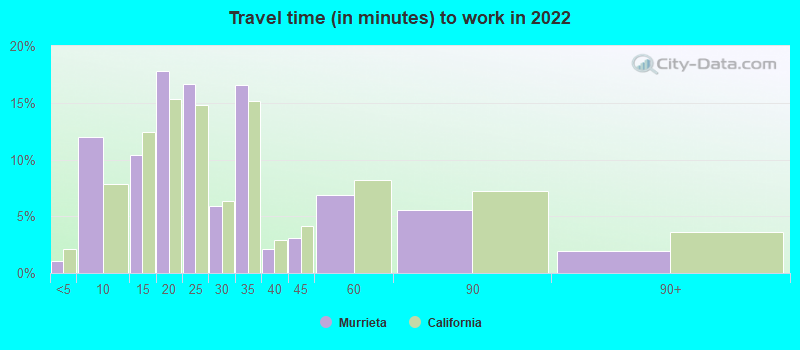
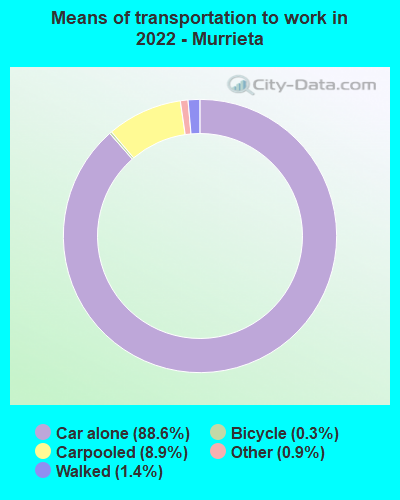
- Mean travel time to work (commute): 27.6 minutes
| Here: | 10.2 |
| California average: | 15.5 |


Graphs represent county-level data. Detailed 2008 Election Results
Religion statistics for Murrieta, CA (based on Riverside County data)


| Religion | Adherents | Congregations |
|---|---|---|
| Catholic | 602,765 | 51 |
| Evangelical Protestant | 240,306 | 741 |
| Other | 77,581 | 194 |
| Mainline Protestant | 29,535 | 103 |
| Black Protestant | 19,170 | 40 |
| Orthodox | 3,647 | 11 |
| None | 1,216,637 | - |
Food Environment Statistics:
| This county: | 1.60 / 10,000 pop. |
| California: | 2.14 / 10,000 pop. |
| This county: | 0.05 / 10,000 pop. |
| California: | 0.04 / 10,000 pop. |
| Here: | 0.44 / 10,000 pop. |
| State: | 0.62 / 10,000 pop. |
| This county: | 1.51 / 10,000 pop. |
| California: | 1.49 / 10,000 pop. |
| This county: | 5.45 / 10,000 pop. |
| California: | 7.42 / 10,000 pop. |
| This county: | 7.7% |
| California: | 7.3% |
| This county: | 24.5% |
| California: | 21.3% |
| Here: | 15.2% |
| California: | 17.9% |
Health and Nutrition:
| Here: | 51.2% |
| California: | 49.4% |
| Murrieta: | 49.9% |
| State: | 48.0% |
| Murrieta: | 28.5 |
| California: | 28.1 |
| Here: | 20.6% |
| California: | 20.2% |
| This city: | 10.1% |
| California: | 11.2% |
| Murrieta: | 6.8 |
| California: | 6.8 |
| Here: | 34.9% |
| California: | 31.5% |
| Here: | 57.8% |
| California: | 56.4% |
| Here: | 80.2% |
| California: | 80.9% |
More about Health and Nutrition of Murrieta, CA Residents
| Local government employment and payroll (March 2022) | |||||
| Function | Full-time employees | Monthly full-time payroll | Average yearly full-time wage | Part-time employees | Monthly part-time payroll |
|---|---|---|---|---|---|
| Police Protection - Officers | 126 | $1,125,072 | $107,150 | 0 | $0 |
| Firefighters | 66 | $615,257 | $111,865 | 0 | $0 |
| Police - Other | 31 | $131,314 | $50,831 | 8 | $12,723 |
| Parks and Recreation | 30 | $217,827 | $87,131 | 11 | $19,534 |
| Other and Unallocable | 26 | $168,501 | $77,770 | 1 | $2,881 |
| Streets and Highways | 19 | $167,834 | $106,000 | 0 | $0 |
| Other Government Administration | 18 | $157,382 | $104,921 | 2 | $3,855 |
| Financial Administration | 18 | $118,266 | $78,844 | 4 | $20,549 |
| Local Libraries | 17 | $137,592 | $97,124 | 14 | $30,172 |
| Fire - Other | 6 | $50,766 | $101,532 | 1 | $2,834 |
| Totals for Government | 357 | $2,889,810 | $97,136 | 41 | $92,548 |
Murrieta government finances - Expenditure in 2017 (per resident):
- Construction - Regular Highways: $23,160,000 ($203.55)
Housing and Community Development: $6,893,000 ($60.58)
Police Protection: $928,000 ($8.16)
Protective Inspection and Regulation - Other: $462,000 ($4.06)
Parks and Recreation: $23,000 ($0.20)
- Current Operations - Police Protection: $24,845,000 ($218.35)
Parks and Recreation: $10,408,000 ($91.47)
Central Staff Services: $9,804,000 ($86.16)
Protective Inspection and Regulation - Other: $4,460,000 ($39.20)
Regular Highways: $3,695,000 ($32.47)
Libraries: $2,114,000 ($18.58)
Financial Administration: $1,882,000 ($16.54)
Housing and Community Development: $1,828,000 ($16.07)
Health - Other: $515,000 ($4.53)
- General - Interest on Debt: $2,652,000 ($23.31)
- Other Capital Outlay - Police Protection: $859,000 ($7.55)
General - Other: $823,000 ($7.23)
Regular Highways: $444,000 ($3.90)
Central Staff Services: $111,000 ($0.98)
Housing and Community Development: $37,000 ($0.33)
Murrieta government finances - Revenue in 2017 (per resident):
- Charges - Other: $4,344,000 ($38.18)
Parks and Recreation: $798,000 ($7.01)
- Federal Intergovernmental - Other: $1,570,000 ($13.80)
Housing and Community Development: $73,000 ($0.64)
- Local Intergovernmental - Other: $698,000 ($6.13)
- Miscellaneous - Special Assessments: $8,465,000 ($74.40)
Sale of Property: $857,000 ($7.53)
Fines and Forfeits: $562,000 ($4.94)
General Revenue - Other: $355,000 ($3.12)
Interest Earnings: $224,000 ($1.97)
Rents: $199,000 ($1.75)
- State Intergovernmental - Highways: $2,157,000 ($18.96)
Other: $1,178,000 ($10.35)
General Local Government Support: $99,000 ($0.87)
- Tax - Property: $20,557,000 ($180.67)
General Sales and Gross Receipts: $17,901,000 ($157.33)
Other License: $4,450,000 ($39.11)
Public Utilities Sales: $3,558,000 ($31.27)
Occupation and Business License - Other: $753,000 ($6.62)
Other Selective Sales: $589,000 ($5.18)
Documentary and Stock Transfer: $588,000 ($5.17)
Murrieta government finances - Debt in 2017 (per resident):
- Long Term Debt - Beginning Outstanding - Unspecified Public Purpose: $54,318,000 ($477.38)
Outstanding Unspecified Public Purpose: $52,069,000 ($457.62)
Retired Unspecified Public Purpose: $2,249,000 ($19.77)
Murrieta government finances - Cash and Securities in 2017 (per resident):
- Bond Funds - Cash and Securities: $7,913,000 ($69.54)
- Other Funds - Cash and Securities: $101,356,000 ($890.78)
- Sinking Funds - Cash and Securities: $20,930,000 ($183.95)
7.19% of this county's 2021 resident taxpayers lived in other counties in 2020 ($71,521 average adjusted gross income)
| Here: | 7.19% |
| California average: | 5.19% |
0.03% of residents moved from foreign countries ($210 average AGI)
Riverside County: 0.03% California average: 0.03%
Top counties from which taxpayers relocated into this county between 2020 and 2021:
| from Los Angeles County, CA | |
| from San Bernardino County, CA | |
| from Orange County, CA |
6.28% of this county's 2020 resident taxpayers moved to other counties in 2021 ($64,593 average adjusted gross income)
| Here: | 6.28% |
| California average: | 6.14% |
0.02% of residents moved to foreign countries ($200 average AGI)
Riverside County: 0.02% California average: 0.02%
Top counties to which taxpayers relocated from this county between 2020 and 2021:
| to San Bernardino County, CA | |
| to Los Angeles County, CA | |
| to Orange County, CA |
| Businesses in Murrieta, CA | ||||
| Name | Count | Name | Count | |
|---|---|---|---|---|
| 24 Hour Fitness | 1 | KFC | 1 | |
| 7-Eleven | 3 | Kohl's | 1 | |
| 99 Cents Only Stores | 1 | Kroger | 3 | |
| AT&T | 1 | Lane Furniture | 2 | |
| Albertsons | 3 | Little Caesars Pizza | 2 | |
| Applebee's | 1 | Lowe's | 1 | |
| Arby's | 1 | MasterBrand Cabinets | 5 | |
| Ashley Furniture | 1 | McDonald's | 4 | |
| AutoZone | 1 | Nike | 5 | |
| BMW | 1 | Office Depot | 1 | |
| Bed Bath & Beyond | 1 | OfficeMax | 1 | |
| Big O Tires | 1 | Panda Express | 2 | |
| Blockbuster | 2 | Payless | 1 | |
| Brunswick Bowling & Billiards | 1 | Penske | 1 | |
| Buffalo Wild Wings | 1 | PetSmart | 1 | |
| Burger King | 1 | Pizza Hut | 1 | |
| Burlington Coat Factory | 1 | Popeyes | 1 | |
| CVS | 3 | Quiznos | 1 | |
| Carl\s Jr. | 4 | RadioShack | 1 | |
| Chick-Fil-A | 1 | Rite Aid | 2 | |
| Chuck E. Cheese's | 1 | SONIC Drive-In | 1 | |
| Circle K | 2 | Sam's Club | 1 | |
| Cold Stone Creamery | 1 | Sears | 1 | |
| Comfort Inn | 1 | Sprint Nextel | 1 | |
| DHL | 1 | Staples | 1 | |
| Dairy Queen | 1 | Starbucks | 8 | |
| Decora Cabinetry | 1 | T-Mobile | 6 | |
| Dennys | 1 | Taco Bell | 2 | |
| Discount Tire | 1 | Target | 2 | |
| Domino's Pizza | 1 | The Room Place | 1 | |
| El Pollo Loco | 1 | Toys"R"Us | 2 | |
| Famous Footwear | 1 | U-Haul | 1 | |
| Fashion Bug | 1 | UPS | 10 | |
| FedEx | 7 | Verizon Wireless | 2 | |
| Goodwill | 1 | Volkswagen | 1 | |
| H&R Block | 2 | Vons | 1 | |
| Home Depot | 1 | Walgreens | 4 | |
| IHOP | 1 | Walmart | 1 | |
| Jack In The Box | 4 | Wendy's | 1 | |
| Jones New York | 2 | |||
Strongest AM radio stations in Murrieta:
- KPLS (830 AM; 50 kW; ORANGE, CA; Owner: CRN LICENSES, LLC)
- KFI (640 AM; 50 kW; LOS ANGELES, CA; Owner: CAPSTAR TX LIMITED PARTNERSHIP)
- KFMB (760 AM; 50 kW; SAN DIEGO, CA; Owner: MIDWEST TELEVISION, INC.)
- KLAC (570 AM; 50 kW; LOS ANGELES, CA; Owner: AMFM RADIO LICENSES, L.L.C.)
- KTNQ (1020 AM; 50 kW; LOS ANGELES, CA; Owner: KTNQ-AM LICENSE CORP.)
- KCBQ (1170 AM; 50 kW; SAN DIEGO, CA; Owner: RADIO 1210, INC.)
- KXTA (1150 AM; 50 kW; LOS ANGELES, CA; Owner: CITICASTERS LICENSES, L.P.)
- KPRZ (1210 AM; 20 kW; SAN MARCOS, CA; Owner: RADIO 1210, INC.)
- KDIS (1110 AM; 50 kW; PASADENA, CA; Owner: ABC,INC.)
- KFWB (980 AM; 50 kW; LOS ANGELES, CA; Owner: INFINITY BROADCASTING OPERATIONS, INC.)
- KSPN (710 AM; 50 kW; LOS ANGELES, CA; Owner: KABC-AM RADIO, INC.)
- KNX (1070 AM; 50 kW; LOS ANGELES, CA; Owner: INFINITY BROADCASTING OPERATIONS, INC.)
- KMPC (1540 AM; 50 kW; LOS ANGELES, CA; Owner: ROSE CITY RADIO CORPORATION)
Strongest FM radio stations in Murrieta:
- KRTM (88.9 FM; TEMECULA, CA; Owner: PENFOLD COMMUNICATIONS, INC.)
- KXFG (92.9 FM; SUN CITY, CA; Owner: INFINITY RADIO OPERATIONS INC.)
- KGBB (103.3 FM; TEMECULA, CA; Owner: CLEAR CHANNEL BROADCASTING LICENSES, INC.)
- KMYT (94.5 FM; TEMECULA, CA; Owner: CLEAR CHANNEL BROADCASTING LICENSES, INC.)
- KWVE (107.9 FM; SAN CLEMENTE, CA; Owner: CALVARY CHAPEL OF COSTA MESA)
- KLRD (90.1 FM; YUCAIPA, CA; Owner: EDUCATIONAL MEDIA FOUNDATION)
- K252BF (98.3 FM; TEMECULA, CA; Owner: ENTRAVISION HOLDINGS, LLC)
- KUOR-FM (89.1 FM; REDLANDS, CA; Owner: UNIVERSITY OF REDLANDS)
- KWRP (96.1 FM; SAN JACINTO, CA; Owner: MAGIC BROADCASTING, INC.)
- KXRS (105.7 FM; HEMET, CA; Owner: LAZER BROADCASTING CORPORATION)
- KPLM-FM2 (106.1 FM; SAN JACINTO, CA; Owner: RM BROADCASTING L.L.C.)
- KATY-FM (101.3 FM; IDYLLWILD, CA; Owner: ALL PRO BROADCASTING, INC.)
- KOLA (99.9 FM; SAN BERNARDINO, CA; Owner: INLAND EMPIRE BROADCASTING CORP.)
- KVCR (91.9 FM; SAN BERNARDINO, CA; Owner: SAN BERNARDINO COMMUNITY COLLEGE DISTRICT)
- KUCR (88.3 FM; RIVERSIDE, CA; Owner: THE REGENTS OF THE UNIV. OF CA)
- K201AR (88.1 FM; BANNING, CA; Owner: KSGN, INC.)
- K232CX (94.3 FM; DESERT HOT SPRINGS, CA; Owner: MCC RADIO, LLC)
- KCXX (103.9 FM; LAKE ARROWHEAD, CA; Owner: ALL-PRO BROADCASTING, INC.)
- KLVJ (100.1 FM; JULIAN, CA; Owner: EDUCATIONAL MEDIA FOUNDATION)
- K295AI (106.9 FM; MUSCOY, CA; Owner: ASSOCIATION FOR COMMUNITY EDUCATION, INC.)
TV broadcast stations around Murrieta:
- K47FL (Channel 47; FALLBROOK, CA; Owner: CHANNEL 51 OF SAN DIEGO, INC.)
- KDIG-LP (Channel 67; ENCINITAS, CA; Owner: STEPHEN M. CILURZO tr/as BRIMARC BROADCASTING)
- National Bridge Inventory (NBI) Statistics
- 43Number of bridges
- 495ft / 151mTotal length
- 1,346,471Total average daily traffic
- 84,645Total average daily truck traffic
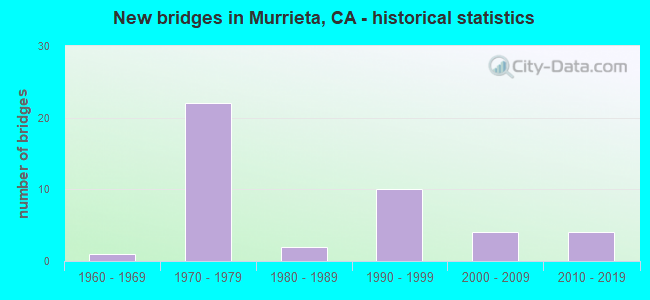
- New bridges - historical statistics
- 11960-1969
- 221970-1979
- 21980-1989
- 101990-1999
- 42000-2009
- 42010-2019
FCC Registered Antenna Towers: 184 (See the full list of FCC Registered Antenna Towers)
FCC Registered Private Land Mobile Towers: 5 (See the full list of FCC Registered Private Land Mobile Towers in Murrieta, CA)
FCC Registered Broadcast Land Mobile Towers: 33 (See the full list of FCC Registered Broadcast Land Mobile Towers)
FCC Registered Microwave Towers: 32 (See the full list of FCC Registered Microwave Towers in this town)
FCC Registered Paging Towers: 5 (See the full list of FCC Registered Paging Towers)
FCC Registered Maritime Coast & Aviation Ground Towers: 2 (See the full list of FCC Registered Maritime Coast & Aviation Ground Towers)
FCC Registered Amateur Radio Licenses: 638 (See the full list of FCC Registered Amateur Radio Licenses in Murrieta)
FAA Registered Aircraft Manufacturers and Dealers: 5 (See the full list of FAA Registered Manufacturers and Dealers in Murrieta)
FAA Registered Aircraft: 109 (See the full list of FAA Registered Aircraft)
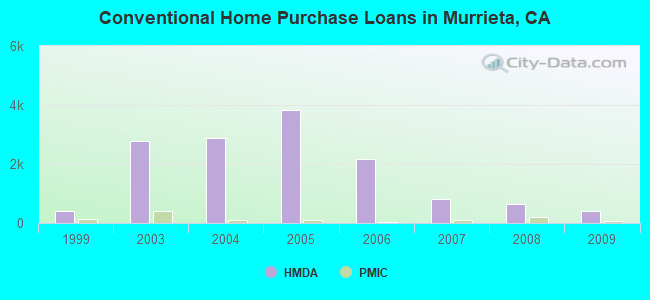
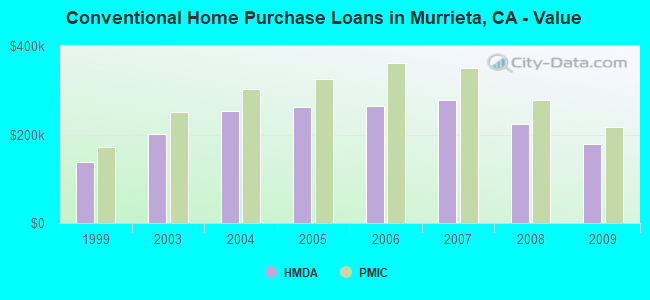
| Home Mortgage Disclosure Act Aggregated Statistics For Year 2009 (Based on 3 full and 6 partial tracts) | ||||||||||||
| A) FHA, FSA/RHS & VA Home Purchase Loans | B) Conventional Home Purchase Loans | C) Refinancings | D) Home Improvement Loans | F) Non-occupant Loans on < 5 Family Dwellings (A B C & D) | G) Loans On Manufactured Home Dwelling (A B C & D) | |||||||
|---|---|---|---|---|---|---|---|---|---|---|---|---|
| Number | Average Value | Number | Average Value | Number | Average Value | Number | Average Value | Number | Average Value | Number | Average Value | |
| LOANS ORIGINATED | 670 | $227,805 | 411 | $178,858 | 718 | $221,485 | 33 | $104,210 | 186 | $159,385 | 18 | $154,515 |
| APPLICATIONS APPROVED, NOT ACCEPTED | 46 | $231,989 | 55 | $178,580 | 94 | $251,649 | 5 | $70,644 | 27 | $164,038 | 2 | $88,855 |
| APPLICATIONS DENIED | 127 | $232,491 | 113 | $171,627 | 323 | $244,429 | 18 | $96,533 | 84 | $168,234 | 9 | $107,222 |
| APPLICATIONS WITHDRAWN | 97 | $236,008 | 61 | $182,379 | 217 | $231,609 | 9 | $145,937 | 38 | $159,887 | 6 | $169,517 |
| FILES CLOSED FOR INCOMPLETENESS | 20 | $209,711 | 19 | $169,356 | 58 | $225,814 | 3 | $41,093 | 9 | $155,268 | 1 | $24,480 |
Detailed mortgage data for all 9 tracts in Murrieta, CA
| Private Mortgage Insurance Companies Aggregated Statistics For Year 2009 (Based on 3 full and 6 partial tracts) | ||||||||
| A) Conventional Home Purchase Loans | B) Refinancings | C) Non-occupant Loans on < 5 Family Dwellings (A & B) | D) Loans On Manufactured Home Dwelling (A & B) | |||||
|---|---|---|---|---|---|---|---|---|
| Number | Average Value | Number | Average Value | Number | Average Value | Number | Average Value | |
| LOANS ORIGINATED | 52 | $217,530 | 5 | $224,796 | 5 | $181,278 | 0 | $0 |
| APPLICATIONS APPROVED, NOT ACCEPTED | 31 | $211,331 | 4 | $271,370 | 2 | $112,405 | 1 | $159,360 |
| APPLICATIONS DENIED | 11 | $204,489 | 2 | $264,790 | 0 | $0 | 0 | $0 |
| APPLICATIONS WITHDRAWN | 3 | $270,427 | 2 | $189,500 | 1 | $116,950 | 0 | $0 |
| FILES CLOSED FOR INCOMPLETENESS | 7 | $262,377 | 1 | $251,970 | 0 | $0 | 0 | $0 |
2007 - 2018 National Fire Incident Reporting System (NFIRS) incidents
- Fire incident types reported to NFIRS in Murrieta, CA
- 24750.3%Outside Fires
- 11924.2%Structure Fires
- 9218.7%Mobile Property/Vehicle Fires
- 336.7%Other
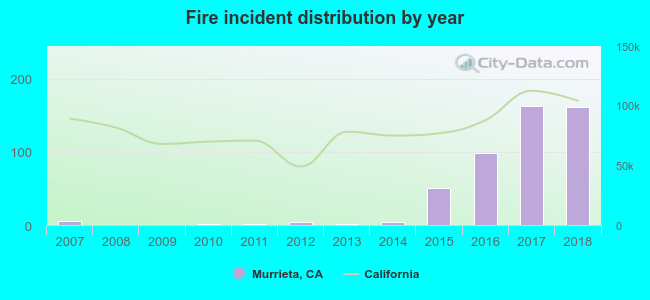 According to the data from the years 2007 - 2018 the average number of fires per year is 41. The highest number of reported fire incidents - 163 took place in 2017, and the least - 0 in 2008. The data has a rising trend.
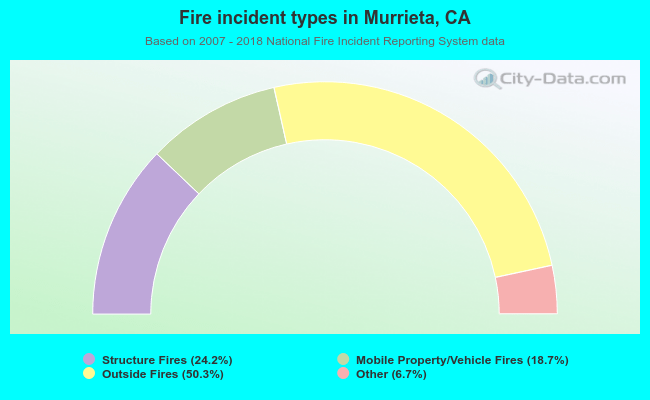 When looking into fire subcategories, the most incidents belonged to: Outside Fires (50.3%), and Structure Fires (24.2%).
Fire-safe hotels and motels in Murrieta, California:
- Residence Inn by Marriott, 25407 Madison Ave, Murrieta, California 92562 , Phone: (951) 698-6300, Fax: (951) 698-6330
- Hampton Inn & Suites Murrieta, 25140 Hancock Ave, Murrieta, California 92562 , Phone: (951) 691-8820
- Courtyard by Marriott Temecula Murrieta, 25419 Madison Ave, Murrieta, California 92562 , Phone: (888) 236-2476
| Most common first names in Murrieta, CA among deceased individuals | ||
| Name | Count | Lived (average) |
|---|---|---|
| Robert | 126 | 75.1 years |
| William | 117 | 76.8 years |
| John | 102 | 77.4 years |
| James | 88 | 76.9 years |
| Mary | 87 | 80.3 years |
| Richard | 60 | 74.6 years |
| Helen | 60 | 83.1 years |
| Donald | 55 | 74.6 years |
| Charles | 55 | 78.7 years |
| George | 54 | 76.3 years |
| Most common last names in Murrieta, CA among deceased individuals | ||
| Last name | Count | Lived (average) |
|---|---|---|
| Smith | 46 | 78.3 years |
| Miller | 34 | 80.2 years |
| Johnson | 29 | 77.9 years |
| Brown | 21 | 79.0 years |
| Williams | 19 | 72.3 years |
| Anderson | 18 | 81.1 years |
| Taylor | 15 | 76.4 years |
| Jones | 14 | 76.4 years |
| Martin | 14 | 77.2 years |
| Nelson | 13 | 81.0 years |
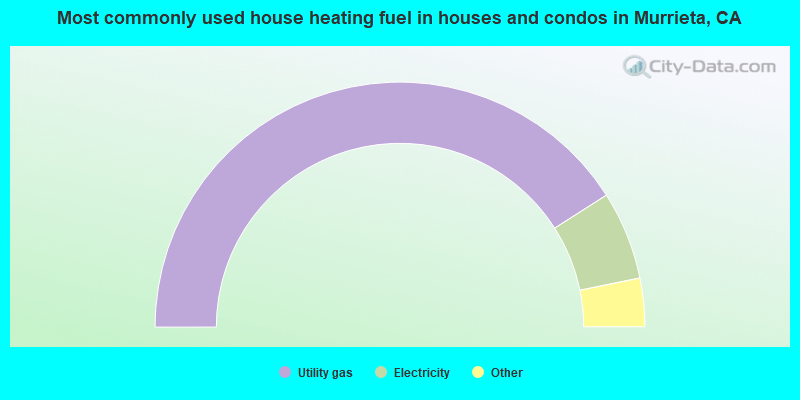
- 82.0%Utility gas
- 11.7%Electricity
- 3.0%Bottled, tank, or LP gas
- 2.3%Solar energy
- 0.8%No fuel used
- 0.4%Wood
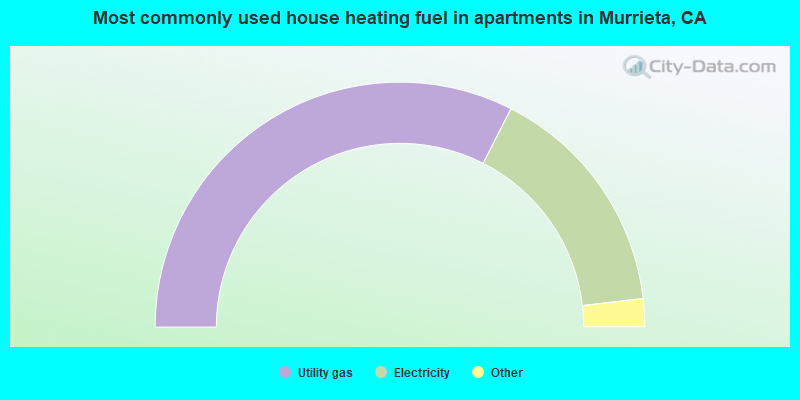
- 65.0%Utility gas
- 31.3%Electricity
- 1.9%Bottled, tank, or LP gas
- 1.4%No fuel used
- 0.2%Solar energy
Murrieta compared to California state average:
- Unemployed percentage significantly below state average.
- Black race population percentage above state average.
- Hispanic race population percentage above state average.
- Length of stay since moving in significantly below state average.
- Number of rooms per house above state average.
- House age significantly below state average.
- Number of college students above state average.
Murrieta, CA compared to other similar cities:
Murrieta on our top lists:
- #6 on the list of "Top 101 cities with the largest differences between daily high and daily low temperatures (population 50,000+)"
- #9 on the list of "Top 101 cities with the lowest number of police officers per 1000 residents (population 50,000+)"
- #16 on the list of "Top 101 cities with the lowest number of arson incidents per 100,000 residents (population 50,000+)"
- #17 on the list of "Top 101 cities with largest percentage of females in occupations: food preparation and serving related occupations (population 50,000+)"
- #22 on the list of "Top 101 cities with largest percentage of males in occupations: personal care and service occupations (population 50,000+)"
- #23 on the list of "Top 100 fastest growing cities from 2000 to 2014 (pop. 50,000+)"
- #28 on the list of "Top 101 cities with the highest percentage of family households, population 100,000+"
- #28 on the list of "Top 100 cities with newest houses (pop. 50,000+)"
- #38 on the list of "Top 101 cities with largest percentage of males in industries: other services, except public administration (population 50,000+)"
- #39 on the list of "Top 101 cities with the highest daily high temperatures (population 50,000+)"
- #41 on the list of "Top 101 cities with largest percentage of males in industries: arts, entertainment, and recreation (population 50,000+)"
- #41 on the list of "Top 101 cities with the smallest percentage of high school students in private schools (3,000+ students)"
- #43 on the list of "Top 100 cities with highest median household income and median resident age less than 35 (pop. 50,000+)"
- #52 on the list of "Top 101 cities with the highest percentage of workers working at home, population 50,000+"
- #55 on the list of "Top 101 cities with largest percentage of males in occupations: management occupations (population 50,000+)"
- #61 on the list of "Top 100 cities with biggest houses (pop. 50,000+)"
- #63 on the list of "Top 101 cities with the least people below 50% of the poverty level (population 50,000+)"
- #65 on the list of "Top 101 cities with largest percentage of males in occupations: installation, maintenance, and repair occupations (population 50,000+)"
- #65 on the list of "Top 101 cities with the lowest number of assaults per 100,000 residents (population 50,000+)"
- #68 on the list of "Top 101 cities with largest percentage of females in occupations: sales and related occupations (population 50,000+)"
- #3 on the list of "Top 101 counties with the highest lead air pollution readings in 2012 (µg/m3)"
- #4 on the list of "Top 101 counties with the highest ground withdrawal of fresh water for public supply"
- #11 on the list of "Top 101 counties with the most Catholic adherents"
- #11 on the list of "Top 101 counties with the highest total withdrawal of fresh water for public supply"
- #12 on the list of "Top 101 counties with the highest carbon monoxide air pollution readings in 2012 (ppm)"

|
|
Total of 707 patent applications in 2008-2024.