Estimated zip code population in 2022: 34,409 Zip code population in 2010: 29,851 Zip code population in 2000: 19,359
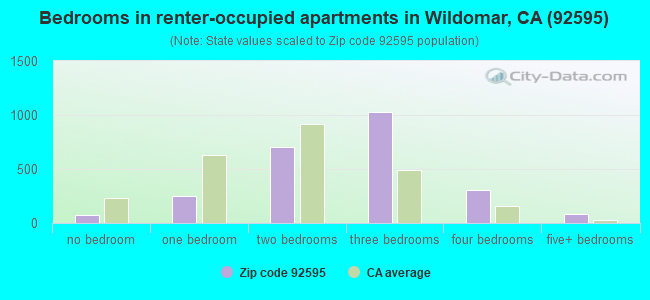
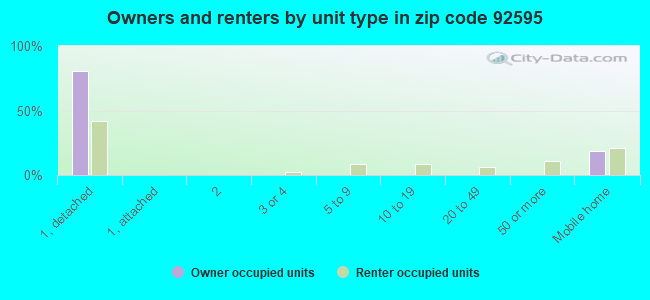
Houses and condos: 10,716 Renter-occupied apartments: 2,451
% of renters here:
24%
State:
44%
March 2022 cost of living index in zip code 92595: 82.2 (low, U.S. average is 100)
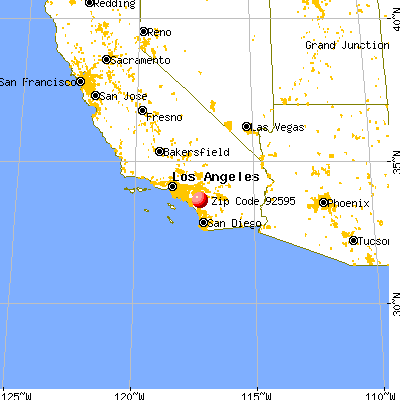
Land area: 21.1 sq. mi. Water area: 0.0 sq. mi.
Population density: 1,634 people per square mile
(low).
OSM Map
General Map
Google Map
MSN Map
OSM Map
General Map
Google Map
MSN Map
OSM Map
General Map
Google Map
MSN Map
OSM Map
General Map
Google Map
MSN Map
Please wait while loading the map...
Real estate property taxes paid for housing units in 2022:
This zip code:
0.7% ($3,829)
California:
0.7% ($4,831)
Median real estate property taxes paid for housing units with mortgages in 2022: $4,367 (0.8%) Median real estate property taxes paid for housing units with no mortgage in 2022: $2,392 (0.5%)
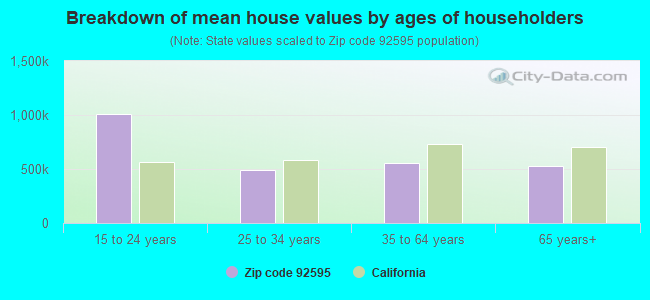
Estimated median house/condo value in 2022: $523,813
92595:
$523,813
California:
$715,900
According to our research of California and other state lists, there were 32 registered sex offenders living in 92595 zip code as of April 27, 2024. The ratio of all residents to sex offenders in zip code 92595 is 1,000 to 1. The ratio of registered sex offenders to all residents in this zip code is lower than the state average.
Median resident age:
This zip code:
36.5 years
California median age:
37.9 years
Average household size:
This zip code:
3.3 people
California:
2.8 people
Averages for the 2020 tax year for zip code 92595, filed in 2021:
Average Adjusted Gross Income (AGI) in 2020: $61,268 (Individual Income Tax Returns)
Here:
$61,268
State:
$95,910
Salary/wage: $56,855 (reported on 80.9% of returns)
Here:
$56,855
State:
$77,331
(% of AGI for various income ranges: 1130.8% for AGIs below $25k, 3691.7% for AGIs $25k-50k, 7094.8% for AGIs $50k-75k, 10436.3% for AGIs $75k-100k, 21024.0% for AGIs $100k-200k, 65971.3% for AGIs over 200k)
Taxable interest for individuals: $578 (reported on 33.7% of returns)
This zip code:
$578
California:
$2,294
(% of AGI for various income ranges: 10.5% for AGIs below $25k, 15.1% for AGIs $25k-50k, 29.4% for AGIs $50k-75k, 57.3% for AGIs $75k-100k, 57.9% for AGIs $100k-200k, 346.0% for AGIs over 200k)
Ordinary dividends: $2,869 (reported on 9.7% of returns)
Here:
$2,869
State:
$10,949
(% of AGI for various income ranges: 11.9% for AGIs below $25k, 15.7% for AGIs $25k-50k, 35.9% for AGIs $50k-75k, 36.8% for AGIs $75k-100k, 72.7% for AGIs $100k-200k, 1149.3% for AGIs over 200k)
Net capital gain/loss in AGI: +$10,057 (reported on 11.2% of returns)
Here:
+$10,057
State:
+$49,306
(% of AGI for various income ranges: 2.5% for AGIs below $25k, 15.6% for AGIs $25k-50k, 92.4% for AGIs $50k-75k, 112.8% for AGIs $75k-100k, 359.5% for AGIs $100k-200k, 7036.0% for AGIs over 200k)
Profit/loss from business: +$10,460 (reported on 18.8% of returns)
Here:
+$10,460
State:
+$15,671
(% of AGI for various income ranges: 179.6% for AGIs below $25k, 246.1% for AGIs $25k-50k, 335.5% for AGIs $50k-75k, 372.4% for AGIs $75k-100k, 480.1% for AGIs $100k-200k, 1894.0% for AGIs over 200k)
Taxable individual retirement arrangement distribution: $17,795 (reported on 4.9% of returns)
92595:
$17,795
California:
$23,505
(% of AGI for various income ranges: 35.5% for AGIs below $25k, 55.5% for AGIs $25k-50k, 124.6% for AGIs $50k-75k, 193.7% for AGIs $75k-100k, 379.7% for AGIs $100k-200k, 1560.7% for AGIs over 200k)
Self-employed (Keogh) retirement plans: $12,833 (reported on 0.2% of returns)
92595:
$12,833
California:
$30,163
(% of AGI for various income ranges: 36.7% for AGIs $75k-100k)
Total itemized deductions: $31,179 (reported on 15.1% of returns)
Here:
$31,179
State:
$39,517
(% of AGI for various income ranges: 64.4% for AGIs below $25k, 217.1% for AGIs $25k-50k, 620.6% for AGIs $50k-75k, 1115.4% for AGIs $75k-100k, 2337.5% for AGIs $100k-200k, 10497.3% for AGIs over 200k)
Charity contributions: $5,777 (reported on 12.3% of returns)
Here:
$5,777
State:
$12,598
(% of AGI for various income ranges: 2.2% for AGIs below $25k, 22.9% for AGIs $25k-50k, 75.8% for AGIs $50k-75k, 147.2% for AGIs $75k-100k, 393.7% for AGIs $100k-200k, 1942.7% for AGIs over 200k)
Taxes paid: $8,309 (reported on 15.1% of returns)
92595:
$8,309
State:
$8,807
(% of AGI for various income ranges: 15.0% for AGIs below $25k, 51.9% for AGIs $25k-50k, 167.3% for AGIs $50k-75k, 351.5% for AGIs $75k-100k, 711.4% for AGIs $100k-200k, 1775.3% for AGIs over 200k)
Earned income credit: $2,088 (reported on 15.6% of returns)
Here:
$2,088
State:
$2,074
(% of AGI for various income ranges: 87.1% for AGIs below $25k, 73.6% for AGIs $25k-50k, 2.3% for AGIs $50k-75k)
Percentage of individuals using paid preparers for their 2020 taxes: 93.5%
Here:
93%
State:
92%
(% for various income ranges: 92.4% for AGIs below $25k, 94.4% for AGIs $25k-50k, 93.0% for AGIs $50k-75k, 94.5% for AGIs $75k-100k, 93.9% for AGIs $100k-200k, 93.9% for AGIs over 200k)
Averages for the 2012 tax year for zip code 92595, filed in 2013:
Average Adjusted Gross Income (AGI) in 2012: $50,318 (Individual Income Tax Returns)
Here:
$50,318
State:
$72,726
Salary/wage: $47,177 (reported on 82.4% of returns)
Here:
$47,177
State:
$59,079
(% of AGI for various income ranges: 69.0% for AGIs below $25k, 77.0% for AGIs $25k-50k, 80.2% for AGIs $50k-75k, 81.2% for AGIs $75k-100k, 81.9% for AGIs $100k-200k, 55.2% for AGIs over 200k)
Taxable interest for individuals: $727 (reported on 34.8% of returns)
This zip code:
$727
California:
$2,146
(% of AGI for various income ranges: 0.9% for AGIs below $25k, 0.5% for AGIs $25k-50k, 0.4% for AGIs $50k-75k, 0.3% for AGIs $75k-100k, 0.5% for AGIs $100k-200k, 0.6% for AGIs over 200k)
Ordinary dividends: $2,128 (reported on 10.3% of returns)
Here:
$2,128
State:
$9,308
(% of AGI for various income ranges: 0.6% for AGIs below $25k, 0.4% for AGIs $25k-50k, 0.2% for AGIs $50k-75k, 0.4% for AGIs $75k-100k, 0.4% for AGIs $100k-200k, 0.9% for AGIs over 200k)
Net capital gain/loss in AGI: +$8,530 (reported on 8.5% of returns)
Here:
+$8,530
State:
+$30,460
(% of AGI for various income ranges: 0.2% for AGIs $50k-75k, 0.3% for AGIs $75k-100k, 0.6% for AGIs $100k-200k, 15.2% for AGIs over 200k)
Profit/loss from business: +$10,214 (reported on 19.2% of returns)
Here:
+$10,214
State:
+$17,064
(% of AGI for various income ranges: 12.7% for AGIs below $25k, 5.8% for AGIs $25k-50k, 3.5% for AGIs $50k-75k, 1.6% for AGIs $75k-100k, 2.1% for AGIs $100k-200k, 1.5% for AGIs over 200k)
Taxable individual retirement arrangement distribution: $14,039 (reported on 6.1% of returns)
92595:
$14,039
California:
$19,557
(% of AGI for various income ranges: 1.9% for AGIs below $25k, 1.8% for AGIs $25k-50k, 1.4% for AGIs $50k-75k, 1.9% for AGIs $75k-100k, 1.6% for AGIs $100k-200k, 2.2% for AGIs over 200k)
Self-employment retirement plans: $15,000 (reported on 0.2% of returns)
92595:
$15,000
California:
$24,530
Total itemized deductions: $23,704 (28% of AGI, reported on 40.0% of returns)
Here:
$23,704
State:
$34,004
Here:
28.3% of AGI
State:
22.7% of AGI
(% of AGI for various income ranges: 11.7% for AGIs below $25k, 15.9% for AGIs $25k-50k, 19.7% for AGIs $50k-75k, 21.3% for AGIs $75k-100k, 21.2% for AGIs $100k-200k, 17.7% for AGIs over 200k)
Charity contributions: $2,918 (reported on 32.4% of returns)
Here:
$2,918
State:
$4,659
(% of AGI for various income ranges: 0.7% for AGIs below $25k, 1.3% for AGIs $25k-50k, 1.8% for AGIs $50k-75k, 2.2% for AGIs $75k-100k, 2.4% for AGIs $100k-200k, 2.1% for AGIs over 200k)
Taxes paid: $7,091 (reported on 39.9% of returns)
92595:
$7,091
State:
$14,448
(% of AGI for various income ranges: 2.3% for AGIs below $25k, 3.5% for AGIs $25k-50k, 5.1% for AGIs $50k-75k, 6.2% for AGIs $75k-100k, 7.3% for AGIs $100k-200k, 8.1% for AGIs over 200k)
Earned income credit: $2,284 (reported on 20.6% of returns)
Here:
$2,284
State:
$2,286
(% of AGI for various income ranges: 6.9% for AGIs below $25k, 1.5% for AGIs $25k-50k)
Percentage of individuals using paid preparers for their 2012 taxes: 63.6%
Here:
64%
State:
64%
(% for various income ranges: 58.5% for AGIs below $25k, 63.4% for AGIs $25k-50k, 68.6% for AGIs $50k-75k, 66.4% for AGIs $75k-100k, 70.3% for AGIs $100k-200k, 80.0% for AGIs over 200k)
Averages for the 2004 tax year for zip code 92595, filed in 2005:
Average Adjusted Gross Income (AGI) in 2004: $45,529 (Individual Income Tax Returns)
Here:
$45,529
State:
$58,600
Salary/wage: $42,883 (reported on 84.4% of returns)
Here:
$42,883
State:
$49,455
(% of AGI for various income ranges: 105.7% for AGIs below $10k, 72.3% for AGIs $10k-25k, 81.1% for AGIs $25k-50k, 84.1% for AGIs $50k-75k, 87.2% for AGIs $75k-100k, 70.9% for AGIs over 100k)
Taxable interest for individuals: $889 (reported on 45.9% of returns)
This zip code:
$889
California:
$2,365
(% of AGI for various income ranges: 4.1% for AGIs below $10k, 1.6% for AGIs $10k-25k, 1.0% for AGIs $25k-50k, 0.6% for AGIs $50k-75k, 0.5% for AGIs $75k-100k, 1.0% for AGIs over 100k)
Taxable dividends: $1,201 (reported on 14.2% of returns)
Here:
$1,201
State:
$4,746
(% of AGI for various income ranges: 2.8% for AGIs below $10k, 0.6% for AGIs $10k-25k, 0.4% for AGIs $25k-50k, 0.3% for AGIs $50k-75k, 0.2% for AGIs $75k-100k, 0.3% for AGIs over 100k)
Net capital gain/loss: +$11,066 (reported on 13.8% of returns)
Here:
+$11,066
State:
+$23,418
(% of AGI for various income ranges: -3.3% for AGIs below $10k, 0.4% for AGIs $10k-25k, 0.4% for AGIs $25k-50k, 1.0% for AGIs $50k-75k, 1.5% for AGIs $75k-100k, 9.6% for AGIs over 100k)
Profit/loss from business: +$11,205 (reported on 19.1% of returns)
Here:
+$11,205
State:
+$16,826
(% of AGI for various income ranges: 11.3% for AGIs below $10k, 10.2% for AGIs $10k-25k, 5.5% for AGIs $25k-50k, 4.1% for AGIs $50k-75k, 2.3% for AGIs $75k-100k, 4.2% for AGIs over 100k)
IRA payment deduction: $2,917 (reported on 2.3% of returns)
92595:
$2,917
California:
$3,192
(% of AGI for various income ranges: 0.2% for AGIs $10k-25k, 0.2% for AGIs $25k-50k, 0.1% for AGIs $50k-75k, 0.2% for AGIs $75k-100k, 0.1% for AGIs over 100k)
Self-employed pension: $9,178 (reported on 0.5% of returns)
Here:
$9,178
California:
$17,688
Total itemized deductions: $23,449 (33% of AGI, reported on 49.7% of returns)
Here:
$23,449
State:
$28,113
Here:
33.1% of AGI
State:
25.3% of AGI
(% of AGI for various income ranges: 27.1% for AGIs below $10k, 18.2% for AGIs $10k-25k, 26.1% for AGIs $25k-50k, 28.4% for AGIs $50k-75k, 27.9% for AGIs $75k-100k, 23.8% for AGIs over 100k)
Charity contributions deductions: $2,621 (4% of AGI, reported on 43.2% of returns)
Here:
$2,621
State:
$3,923
Here:
3.6% of AGI
State:
3.3% of AGI
(% of AGI for various income ranges: 1.2% for AGIs below $10k, 1.3% for AGIs $10k-25k, 2.2% for AGIs $25k-50k, 2.7% for AGIs $50k-75k, 2.7% for AGIs $75k-100k, 2.8% for AGIs over 100k)
Total tax: $5,208 (reported on 75.1% of returns)
92595:
$5,208
State:
$10,761
(% of AGI for various income ranges: 4.5% for AGIs below $10k, 4.6% for AGIs $10k-25k, 5.6% for AGIs $25k-50k, 6.7% for AGIs $50k-75k, 7.7% for AGIs $75k-100k, 14.0% for AGIs over 100k)
Earned income credit: $1,814 (reported on 14.2% of returns)
Here:
$1,814
State:
$1,763
Percentage of individuals using paid preparers for their 2004 taxes: 68.7%
Here:
69%
State:
66%
(% for various income ranges: 56.0% for AGIs below $10k, 66.3% for AGIs $10k-25k, 71.8% for AGIs $25k-50k, 74.3% for AGIs $50k-75k, 73.1% for AGIs $75k-100k, 76.6% for AGIs over 100k)
Likely homosexual households (counted as self-reported same-sex unmarried-partner households)
Lesbian couples: 0.0% of all households
Gay men: 0.3% of all households
Household received Food Stamps/SNAP in the past 12 months: 972 Household did not receive Food Stamps/SNAP in the past 12 months: 9,269
Women who had a birth in the past 12 months: 498 (353 now married, 145 unmarried) Women who did not have a birth in the past 12 months: 7,614 (3,300 now married, 4,302 unmarried)
Housing units in zip code 92595 with a mortgage: 5,929 (354 second mortgage, 21 home equity loan, 261 both second mortgage and home equity loan) Houses without a mortgage: 131
Median monthly owner costs for units with a mortgage: $2,423 Median monthly owner costs for units without a mortgage: $563
Residents with income below the poverty level in 2022:
This zip code:
9.7%
Whole state:
12.2%
Residents with income below 50% of the poverty level in 2022:
This zip code:
4.9%
Whole state:
6.2%
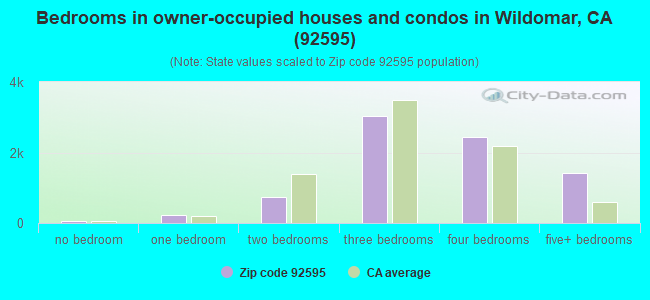
Median number of rooms in houses and condos:
Here:
6.7
State:
6.0
Median number of rooms in apartments:
Here:
5.0
State:
3.9
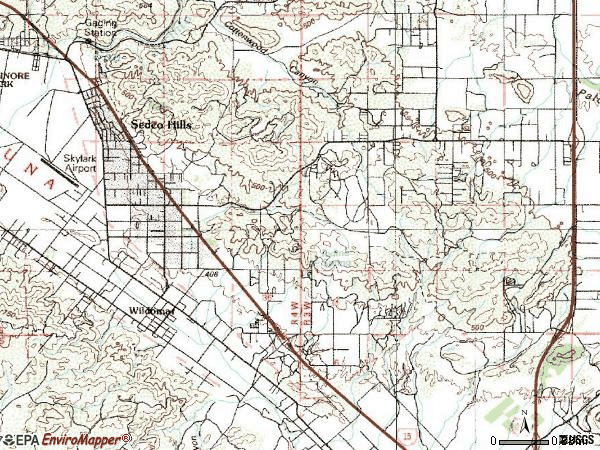
Notable locations in this zip code not listed on our city pages
Notable locations in zip code 92595: Oak Springs Ranch (A), American Medical Response Wildomar (B), Riverside County Fire Department Station 61 Wildomar (C). Display/hide their locations on the map
In group quarters: 109 (-1 institutionalized population)
Size of family households: 2,839 2-persons, 1,791 3-persons, 1,756 4-persons, 1,236 5-persons, 389 6-persons, 407 7-or-more-persons
Size of nonfamily households: 1,334 1-person, 435 2-persons, 63 3-persons
5,291 married couples with children.
1,218 single-parent households (449 men, 769 women).
69.0% of residents of 92595 zip code speak English at home.
23.8% of residents speak Spanish at home (66% very well, 16% well, 14% not well, 4% not at all).
1.8% of residents speak other Indo-European language at home (65% very well, 25% well, 5% not well, 5% not at all).
4.2% of residents speak Asian or Pacific Island language at home (46% very well, 22% well, 19% not well, 14% not at all).
0.6% of residents speak other language at home (42% very well, 43% well, 15% not well).
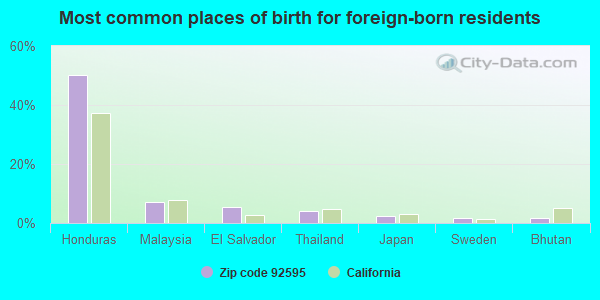
Foreign born population: 5,878 (17.1%) (57.6% of them are naturalized citizens)
This zip code:
17.1%
Whole state:
26.7%
50%Honduras
7%Malaysia
5%El Salvador
4%Thailand
2%Japan
2%Sweden
2%Bhutan
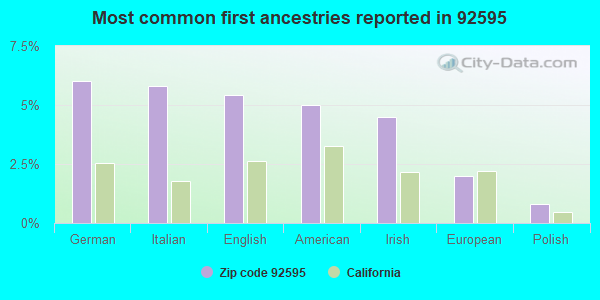
6%German
6%Italian
5%English
5%American
4%Irish
2%European
1%Polish
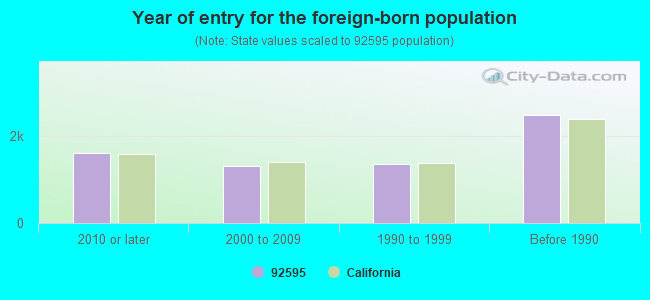
Year of entry for the foreign-born population
1,5962010 or later
1,3062000 to 2009
1,3601990 to 1999
2,476Before 1990
Facilities with environmental interests located in this zip code:
ELSINORE HIGH (21800 CANYON DR. in WILDOMAR, CA)
(National Center for Education Statistics) - STATE ID-3332350 Organizations: LAKE ELSINORE UNIFIED (SCHOOL DISTRICT)
GRAHAM (DONALD) ELEMENTARY (35450 FREDERICK ST. in WILDOMAR, CA)
(National Center for Education Statistics) - STATE ID-6111090 Organizations: LAKE ELSINORE UNIFIED (SCHOOL DISTRICT)
HAYMAN (JEAN) ELEMENTARY (21-440 LEMON ST. in WILDOMAR, CA)
(National Center for Education Statistics) - STATE ID-6104442 Organizations: LAKE ELSINORE UNIFIED (SCHOOL DISTRICT)
Housing units lacking complete plumbing facilities: 1.1% Housing units lacking complete kitchen facilities: 3.2%
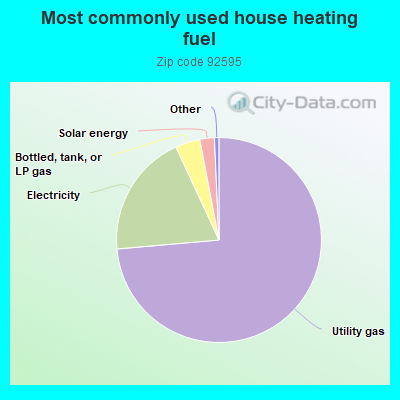
73.6%Utility gas
19.5%Electricity
3.9%Bottled, tank, or LP gas
2.3%Solar energy
Population in 1990: 4,758. Population change in the 1990s: +14,601 (+306.9%).
Place of birth for U.S.-born residents:
This state: 22,247
Northeast: 954
Midwest: 1,905
South: 1,407
West: 1,115
56% of the 92595 zip code residents lived in the same house 5 years ago. Out of people who lived in different houses, 54% lived in this county. Out of people who lived in different counties, 50% lived in California.
88% of the 92595 zip code residents lived in the same house 1 year ago. Out of people who lived in different houses, 41% moved from this county. Out of people who lived in different houses, 51% moved from different county within same state. Out of people who lived in different houses, 5% moved from different state. Out of people who lived in different houses, 2% moved from abroad.
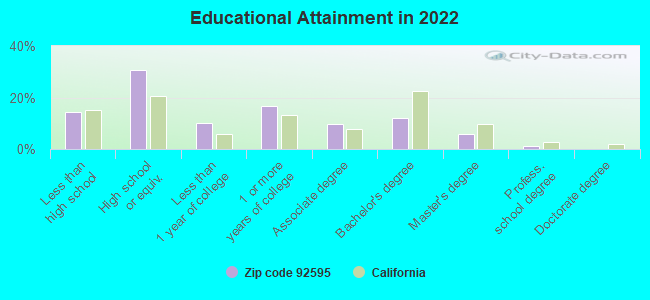
Private vs. public school enrollment:
Students in private schools in grades 1 to 8 (elementary and middle school): 516
Here:
15.8%
California:
10.5%
Students in private schools in grades 9 to 12 (high school): 131
Here:
6.8%
California:
8.5%
Students in private undergraduate colleges: 547
Here:
29.5%
California:
15.9%
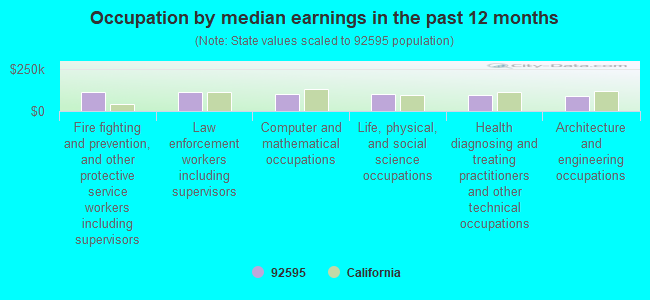
Occupation by median earnings in the past 12 months ($)
115,677Fire fighting and prevention, and other protective service workers including supervisors
111,484Law enforcement workers including supervisors
102,247Computer and mathematical occupations
101,397Life, physical, and social science occupations
96,997Health diagnosing and treating practitioners and other technical occupations
88,330Architecture and engineering occupations
Companies with federal contracts located in this zip code:
UNITED STATES RAILROAD SERVICE (35233 GATU CT in WILDOMAR, CA; small business) : $116,882 in 6 contractsfrom 2002 to 2005
Contracts for Maintenance, Repair and Rebuilding of Equipment -- Railway Equipment by Navy Signed by year:2000: $0; 2001: $0; 2002: $83,272; 2003: $16,955; 2004: $0; 2005: $16,655; 2006: $0.
Biggest contracts:
$31,905 with Navy for Maintenance, Repair and Rebuilding of Equipment -- Railway Equipment. Signed on 2002-03-22. Completion date: 2002-04-21.
$19,940, same as above.Signed on 2002-03-07. Completion date: 2002-03-21.
$16,955, same as above.Signed on 2003-06-09. Completion date: 2003-07-18.
$16,655, same as above.Signed on 2005-08-26. Completion date: 2005-09-26.
COLLINS, JASON (36108 BLACKSTONE CR in WILDOMAR, CA; small business) : $59,242 in 4 contractsfrom 2004 to 2006
$34,920 with Army for Pharmacology Services. Taking place in KY. Signed on 2004-08-23. Completion date: 2005-08-22.
$19,080, same as above.Signed on 2005-08-16. Completion date: 2005-08-22.
$8,100, same as above.Signed on 2006-06-01. Effective on 2006-06-02. Completion date: 2006-08-22.
-$2,858, same as above.Signed on 2005-09-22. Completion date: 2005-08-22.
ELECTRIC ATTITUDE INC (33365 WINDING WAY in WILDOMAR, CA; small business)
$19,675 with Department of Defense for Electric Services. Signed on 2002-03-28. Completion date: 2002-04-08.
Top industries in this zip code by the number of employees in 2005:
Health Care and Social Assistance: General Medical and Surgical Hospitals (500-999 employees: 1 establishment)
2006 - 2018 National Fire Incident Reporting System (NFIRS) incidents
Based on the data from the years 2006 - 2018 the average number of fires per year is 55. The highest number of fire incidents - 79 took place in 2011, and the least - 12 in 2006. The data has an increasing trend.
When looking into fire subcategories, the most incidents belonged to: Outside Fires (54.8%), and Mobile Property/Vehicle Fires (19.4%).
Fire incident types reported to NFIRS in Zip Code 92595


 Nearest zip codes: 92587, 92532, 92584, 92586, 92562, 92530.


 Based on the data from the years 2006 - 2018 the average number of fires per year is 55. The highest number of fire incidents - 79 took place in 2011, and the least - 12 in 2006. The data has an increasing trend.
 When looking into fire subcategories, the most incidents belonged to: Outside Fires (54.8%), and Mobile Property/Vehicle Fires (19.4%).