Lake Elsinore, California Submit your own pictures of this city and show them to the world
OSM Map
General Map
Google Map
MSN Map
OSM Map
General Map
Google Map
MSN Map
OSM Map
General Map
Google Map
MSN Map
OSM Map
General Map
Google Map
MSN Map
Please wait while loading the map...
Population in 2022: 71,898 (97% urban, 3% rural). Population change since 2000: +148.5%Males: 36,531 Females: 35,367
March 2022 cost of living index in Lake Elsinore: 82.3 (low, U.S. average is 100) Percentage of residents living in poverty in 2022: 8.7%for White Non-Hispanic residents , 12.7% for Black residents , 12.8% for Hispanic or Latino residents , 4.7% for American Indian residents , 13.4% for other race residents , 12.5% for two or more races residents )
Profiles of local businesses
Business Search - 14 Million verified businesses
Data:
Median household income ($)
Median household income (% change since 2000)
Household income diversity
Ratio of average income to average house value (%)
Ratio of average income to average rent
Median household income ($) - White
Median household income ($) - Black or African American
Median household income ($) - Asian
Median household income ($) - Hispanic or Latino
Median household income ($) - American Indian and Alaska Native
Median household income ($) - Multirace
Median household income ($) - Other Race
Median household income for houses/condos with a mortgage ($)
Median household income for apartments without a mortgage ($)
Races - White alone (%)
Races - White alone (% change since 2000)
Races - Black alone (%)
Races - Black alone (% change since 2000)
Races - American Indian alone (%)
Races - American Indian alone (% change since 2000)
Races - Asian alone (%)
Races - Asian alone (% change since 2000)
Races - Hispanic (%)
Races - Hispanic (% change since 2000)
Races - Native Hawaiian and Other Pacific Islander alone (%)
Races - Native Hawaiian and Other Pacific Islander alone (% change since 2000)
Races - Two or more races (%)
Races - Two or more races (% change since 2000)
Races - Other race alone (%)
Races - Other race alone (% change since 2000)
Racial diversity
Unemployment (%)
Unemployment (% change since 2000)
Unemployment (%) - White
Unemployment (%) - Black or African American
Unemployment (%) - Asian
Unemployment (%) - Hispanic or Latino
Unemployment (%) - American Indian and Alaska Native
Unemployment (%) - Multirace
Unemployment (%) - Other Race
Population density (people per square mile)
Population - Males (%)
Population - Females (%)
Population - Males (%) - White
Population - Males (%) - Black or African American
Population - Males (%) - Asian
Population - Males (%) - Hispanic or Latino
Population - Males (%) - American Indian and Alaska Native
Population - Males (%) - Multirace
Population - Males (%) - Other Race
Population - Females (%) - White
Population - Females (%) - Black or African American
Population - Females (%) - Asian
Population - Females (%) - Hispanic or Latino
Population - Females (%) - American Indian and Alaska Native
Population - Females (%) - Multirace
Population - Females (%) - Other Race
Coronavirus confirmed cases (Apr 27, 2024)
Deaths caused by coronavirus (Apr 27, 2024)
Coronavirus confirmed cases (per 100k population) (Apr 27, 2024)
Deaths caused by coronavirus (per 100k population) (Apr 27, 2024)
Daily increase in number of cases (Apr 27, 2024)
Weekly increase in number of cases (Apr 27, 2024)
Cases doubled (in days) (Apr 27, 2024)
Hospitalized patients (Apr 18, 2022)
Negative test results (Apr 18, 2022)
Total test results (Apr 18, 2022)
COVID Vaccine doses distributed (per 100k population) (Sep 19, 2023)
COVID Vaccine doses administered (per 100k population) (Sep 19, 2023)
COVID Vaccine doses distributed (Sep 19, 2023)
COVID Vaccine doses administered (Sep 19, 2023)
Likely homosexual households (%)
Likely homosexual households (% change since 2000)
Likely homosexual households - Lesbian couples (%)
Likely homosexual households - Lesbian couples (% change since 2000)
Likely homosexual households - Gay men (%)
Likely homosexual households - Gay men (% change since 2000)
Cost of living index
Median gross rent ($)
Median contract rent ($)
Median monthly housing costs ($)
Median house or condo value ($)
Median house or condo value ($ change since 2000)
Mean house or condo value by units in structure - 1, detached ($)
Mean house or condo value by units in structure - 1, attached ($)
Mean house or condo value by units in structure - 2 ($)
Mean house or condo value by units in structure by units in structure - 3 or 4 ($)
Mean house or condo value by units in structure - 5 or more ($)
Mean house or condo value by units in structure - Boat, RV, van, etc. ($)
Mean house or condo value by units in structure - Mobile home ($)
Median house or condo value ($) - White
Median house or condo value ($) - Black or African American
Median house or condo value ($) - Asian
Median house or condo value ($) - Hispanic or Latino
Median house or condo value ($) - American Indian and Alaska Native
Median house or condo value ($) - Multirace
Median house or condo value ($) - Other Race
Median resident age
Resident age diversity
Median resident age - Males
Median resident age - Females
Median resident age - White
Median resident age - Black or African American
Median resident age - Asian
Median resident age - Hispanic or Latino
Median resident age - American Indian and Alaska Native
Median resident age - Multirace
Median resident age - Other Race
Median resident age - Males - White
Median resident age - Males - Black or African American
Median resident age - Males - Asian
Median resident age - Males - Hispanic or Latino
Median resident age - Males - American Indian and Alaska Native
Median resident age - Males - Multirace
Median resident age - Males - Other Race
Median resident age - Females - White
Median resident age - Females - Black or African American
Median resident age - Females - Asian
Median resident age - Females - Hispanic or Latino
Median resident age - Females - American Indian and Alaska Native
Median resident age - Females - Multirace
Median resident age - Females - Other Race
Commute - mean travel time to work (minutes)
Travel time to work - Less than 5 minutes (%)
Travel time to work - Less than 5 minutes (% change since 2000)
Travel time to work - 5 to 9 minutes (%)
Travel time to work - 5 to 9 minutes (% change since 2000)
Travel time to work - 10 to 19 minutes (%)
Travel time to work - 10 to 19 minutes (% change since 2000)
Travel time to work - 20 to 29 minutes (%)
Travel time to work - 20 to 29 minutes (% change since 2000)
Travel time to work - 30 to 39 minutes (%)
Travel time to work - 30 to 39 minutes (% change since 2000)
Travel time to work - 40 to 59 minutes (%)
Travel time to work - 40 to 59 minutes (% change since 2000)
Travel time to work - 60 to 89 minutes (%)
Travel time to work - 60 to 89 minutes (% change since 2000)
Travel time to work - 90 or more minutes (%)
Travel time to work - 90 or more minutes (% change since 2000)
Marital status - Never married (%)
Marital status - Now married (%)
Marital status - Separated (%)
Marital status - Widowed (%)
Marital status - Divorced (%)
Median family income ($)
Median family income (% change since 2000)
Median non-family income ($)
Median non-family income (% change since 2000)
Median per capita income ($)
Median per capita income (% change since 2000)
Median family income ($) - White
Median family income ($) - Black or African American
Median family income ($) - Asian
Median family income ($) - Hispanic or Latino
Median family income ($) - American Indian and Alaska Native
Median family income ($) - Multirace
Median family income ($) - Other Race
Median year house/condo built
Median year apartment built
Year house built - Built 2005 or later (%)
Year house built - Built 2000 to 2004 (%)
Year house built - Built 1990 to 1999 (%)
Year house built - Built 1980 to 1989 (%)
Year house built - Built 1970 to 1979 (%)
Year house built - Built 1960 to 1969 (%)
Year house built - Built 1950 to 1959 (%)
Year house built - Built 1940 to 1949 (%)
Year house built - Built 1939 or earlier (%)
Average household size
Household density (households per square mile)
Average household size - White
Average household size - Black or African American
Average household size - Asian
Average household size - Hispanic or Latino
Average household size - American Indian and Alaska Native
Average household size - Multirace
Average household size - Other Race
Occupied housing units (%)
Vacant housing units (%)
Owner occupied housing units (%)
Renter occupied housing units (%)
Vacancy status - For rent (%)
Vacancy status - For sale only (%)
Vacancy status - Rented or sold, not occupied (%)
Vacancy status - For seasonal, recreational, or occasional use (%)
Vacancy status - For migrant workers (%)
Vacancy status - Other vacant (%)
Residents with income below the poverty level (%)
Residents with income below 50% of the poverty level (%)
Children below poverty level (%)
Poor families by family type - Married-couple family (%)
Poor families by family type - Male, no wife present (%)
Poor families by family type - Female, no husband present (%)
Poverty status for native-born residents (%)
Poverty status for foreign-born residents (%)
Poverty among high school graduates not in families (%)
Poverty among people who did not graduate high school not in families (%)
Residents with income below the poverty level (%) - White
Residents with income below the poverty level (%) - Black or African American
Residents with income below the poverty level (%) - Asian
Residents with income below the poverty level (%) - Hispanic or Latino
Residents with income below the poverty level (%) - American Indian and Alaska Native
Residents with income below the poverty level (%) - Multirace
Residents with income below the poverty level (%) - Other Race
Air pollution - Air Quality Index (AQI)
Air pollution - CO
Air pollution - NO2
Air pollution - SO2
Air pollution - Ozone
Air pollution - PM10
Air pollution - PM25
Air pollution - Pb
Crime - Murders per 100,000 population
Crime - Rapes per 100,000 population
Crime - Robberies per 100,000 population
Crime - Assaults per 100,000 population
Crime - Burglaries per 100,000 population
Crime - Thefts per 100,000 population
Crime - Auto thefts per 100,000 population
Crime - Arson per 100,000 population
Crime - City-data.com crime index
Crime - Violent crime index
Crime - Property crime index
Crime - Murders per 100,000 population (5 year average)
Crime - Rapes per 100,000 population (5 year average)
Crime - Robberies per 100,000 population (5 year average)
Crime - Assaults per 100,000 population (5 year average)
Crime - Burglaries per 100,000 population (5 year average)
Crime - Thefts per 100,000 population (5 year average)
Crime - Auto thefts per 100,000 population (5 year average)
Crime - Arson per 100,000 population (5 year average)
Crime - City-data.com crime index (5 year average)
Crime - Violent crime index (5 year average)
Crime - Property crime index (5 year average)
1996 Presidential Elections Results (%) - Democratic Party (Clinton)
1996 Presidential Elections Results (%) - Republican Party (Dole)
1996 Presidential Elections Results (%) - Other
2000 Presidential Elections Results (%) - Democratic Party (Gore)
2000 Presidential Elections Results (%) - Republican Party (Bush)
2000 Presidential Elections Results (%) - Other
2004 Presidential Elections Results (%) - Democratic Party (Kerry)
2004 Presidential Elections Results (%) - Republican Party (Bush)
2004 Presidential Elections Results (%) - Other
2008 Presidential Elections Results (%) - Democratic Party (Obama)
2008 Presidential Elections Results (%) - Republican Party (McCain)
2008 Presidential Elections Results (%) - Other
2012 Presidential Elections Results (%) - Democratic Party (Obama)
2012 Presidential Elections Results (%) - Republican Party (Romney)
2012 Presidential Elections Results (%) - Other
2016 Presidential Elections Results (%) - Democratic Party (Clinton)
2016 Presidential Elections Results (%) - Republican Party (Trump)
2016 Presidential Elections Results (%) - Other
2020 Presidential Elections Results (%) - Democratic Party (Biden)
2020 Presidential Elections Results (%) - Republican Party (Trump)
2020 Presidential Elections Results (%) - Other
Ancestries Reported - Arab (%)
Ancestries Reported - Czech (%)
Ancestries Reported - Danish (%)
Ancestries Reported - Dutch (%)
Ancestries Reported - English (%)
Ancestries Reported - French (%)
Ancestries Reported - French Canadian (%)
Ancestries Reported - German (%)
Ancestries Reported - Greek (%)
Ancestries Reported - Hungarian (%)
Ancestries Reported - Irish (%)
Ancestries Reported - Italian (%)
Ancestries Reported - Lithuanian (%)
Ancestries Reported - Norwegian (%)
Ancestries Reported - Polish (%)
Ancestries Reported - Portuguese (%)
Ancestries Reported - Russian (%)
Ancestries Reported - Scotch-Irish (%)
Ancestries Reported - Scottish (%)
Ancestries Reported - Slovak (%)
Ancestries Reported - Subsaharan African (%)
Ancestries Reported - Swedish (%)
Ancestries Reported - Swiss (%)
Ancestries Reported - Ukrainian (%)
Ancestries Reported - United States (%)
Ancestries Reported - Welsh (%)
Ancestries Reported - West Indian (%)
Ancestries Reported - Other (%)
Educational Attainment - No schooling completed (%)
Educational Attainment - Less than high school (%)
Educational Attainment - High school or equivalent (%)
Educational Attainment - Less than 1 year of college (%)
Educational Attainment - 1 or more years of college (%)
Educational Attainment - Associate degree (%)
Educational Attainment - Bachelor's degree (%)
Educational Attainment - Master's degree (%)
Educational Attainment - Professional school degree (%)
Educational Attainment - Doctorate degree (%)
School Enrollment - Nursery, preschool (%)
School Enrollment - Kindergarten (%)
School Enrollment - Grade 1 to 4 (%)
School Enrollment - Grade 5 to 8 (%)
School Enrollment - Grade 9 to 12 (%)
School Enrollment - College undergrad (%)
School Enrollment - Graduate or professional (%)
School Enrollment - Not enrolled in school (%)
School enrollment - Public schools (%)
School enrollment - Private schools (%)
School enrollment - Not enrolled (%)
Median number of rooms in houses and condos
Median number of rooms in apartments
Housing units lacking complete plumbing facilities (%)
Housing units lacking complete kitchen facilities (%)
Density of houses
Urban houses (%)
Rural houses (%)
Households with people 60 years and over (%)
Households with people 65 years and over (%)
Households with people 75 years and over (%)
Households with one or more nonrelatives (%)
Households with no nonrelatives (%)
Population in households (%)
Family households (%)
Nonfamily households (%)
Population in families (%)
Family households with own children (%)
Median number of bedrooms in owner occupied houses
Mean number of bedrooms in owner occupied houses
Median number of bedrooms in renter occupied houses
Mean number of bedrooms in renter occupied houses
Median number of vehichles in owner occupied houses
Mean number of vehichles in owner occupied houses
Median number of vehichles in renter occupied houses
Mean number of vehichles in renter occupied houses
Mortgage status - with mortgage (%)
Mortgage status - with second mortgage (%)
Mortgage status - with home equity loan (%)
Mortgage status - with both second mortgage and home equity loan (%)
Mortgage status - without a mortgage (%)
Average family size
Average family size - White
Average family size - Black or African American
Average family size - Asian
Average family size - Hispanic or Latino
Average family size - American Indian and Alaska Native
Average family size - Multirace
Average family size - Other Race
Geographical mobility - Same house 1 year ago (%)
Geographical mobility - Moved within same county (%)
Geographical mobility - Moved from different county within same state (%)
Geographical mobility - Moved from different state (%)
Geographical mobility - Moved from abroad (%)
Place of birth - Born in state of residence (%)
Place of birth - Born in other state (%)
Place of birth - Native, outside of US (%)
Place of birth - Foreign born (%)
Housing units in structures - 1, detached (%)
Housing units in structures - 1, attached (%)
Housing units in structures - 2 (%)
Housing units in structures - 3 or 4 (%)
Housing units in structures - 5 to 9 (%)
Housing units in structures - 10 to 19 (%)
Housing units in structures - 20 to 49 (%)
Housing units in structures - 50 or more (%)
Housing units in structures - Mobile home (%)
Housing units in structures - Boat, RV, van, etc. (%)
House/condo owner moved in on average (years ago)
Renter moved in on average (years ago)
Year householder moved into unit - Moved in 1999 to March 2000 (%)
Year householder moved into unit - Moved in 1995 to 1998 (%)
Year householder moved into unit - Moved in 1990 to 1994 (%)
Year householder moved into unit - Moved in 1980 to 1989 (%)
Year householder moved into unit - Moved in 1970 to 1979 (%)
Year householder moved into unit - Moved in 1969 or earlier (%)
Means of transportation to work - Drove car alone (%)
Means of transportation to work - Carpooled (%)
Means of transportation to work - Public transportation (%)
Means of transportation to work - Bus or trolley bus (%)
Means of transportation to work - Streetcar or trolley car (%)
Means of transportation to work - Subway or elevated (%)
Means of transportation to work - Railroad (%)
Means of transportation to work - Ferryboat (%)
Means of transportation to work - Taxicab (%)
Means of transportation to work - Motorcycle (%)
Means of transportation to work - Bicycle (%)
Means of transportation to work - Walked (%)
Means of transportation to work - Other means (%)
Working at home (%)
Industry diversity
Most Common Industries - Agriculture, forestry, fishing and hunting, and mining (%)
Most Common Industries - Agriculture, forestry, fishing and hunting (%)
Most Common Industries - Mining, quarrying, and oil and gas extraction (%)
Most Common Industries - Construction (%)
Most Common Industries - Manufacturing (%)
Most Common Industries - Wholesale trade (%)
Most Common Industries - Retail trade (%)
Most Common Industries - Transportation and warehousing, and utilities (%)
Most Common Industries - Transportation and warehousing (%)
Most Common Industries - Utilities (%)
Most Common Industries - Information (%)
Most Common Industries - Finance and insurance, and real estate and rental and leasing (%)
Most Common Industries - Finance and insurance (%)
Most Common Industries - Real estate and rental and leasing (%)
Most Common Industries - Professional, scientific, and management, and administrative and waste management services (%)
Most Common Industries - Professional, scientific, and technical services (%)
Most Common Industries - Management of companies and enterprises (%)
Most Common Industries - Administrative and support and waste management services (%)
Most Common Industries - Educational services, and health care and social assistance (%)
Most Common Industries - Educational services (%)
Most Common Industries - Health care and social assistance (%)
Most Common Industries - Arts, entertainment, and recreation, and accommodation and food services (%)
Most Common Industries - Arts, entertainment, and recreation (%)
Most Common Industries - Accommodation and food services (%)
Most Common Industries - Other services, except public administration (%)
Most Common Industries - Public administration (%)
Occupation diversity
Most Common Occupations - Management, business, science, and arts occupations (%)
Most Common Occupations - Management, business, and financial occupations (%)
Most Common Occupations - Management occupations (%)
Most Common Occupations - Business and financial operations occupations (%)
Most Common Occupations - Computer, engineering, and science occupations (%)
Most Common Occupations - Computer and mathematical occupations (%)
Most Common Occupations - Architecture and engineering occupations (%)
Most Common Occupations - Life, physical, and social science occupations (%)
Most Common Occupations - Education, legal, community service, arts, and media occupations (%)
Most Common Occupations - Community and social service occupations (%)
Most Common Occupations - Legal occupations (%)
Most Common Occupations - Education, training, and library occupations (%)
Most Common Occupations - Arts, design, entertainment, sports, and media occupations (%)
Most Common Occupations - Healthcare practitioners and technical occupations (%)
Most Common Occupations - Health diagnosing and treating practitioners and other technical occupations (%)
Most Common Occupations - Health technologists and technicians (%)
Most Common Occupations - Service occupations (%)
Most Common Occupations - Healthcare support occupations (%)
Most Common Occupations - Protective service occupations (%)
Most Common Occupations - Fire fighting and prevention, and other protective service workers including supervisors (%)
Most Common Occupations - Law enforcement workers including supervisors (%)
Most Common Occupations - Food preparation and serving related occupations (%)
Most Common Occupations - Building and grounds cleaning and maintenance occupations (%)
Most Common Occupations - Personal care and service occupations (%)
Most Common Occupations - Sales and office occupations (%)
Most Common Occupations - Sales and related occupations (%)
Most Common Occupations - Office and administrative support occupations (%)
Most Common Occupations - Natural resources, construction, and maintenance occupations (%)
Most Common Occupations - Farming, fishing, and forestry occupations (%)
Most Common Occupations - Construction and extraction occupations (%)
Most Common Occupations - Installation, maintenance, and repair occupations (%)
Most Common Occupations - Production, transportation, and material moving occupations (%)
Most Common Occupations - Production occupations (%)
Most Common Occupations - Transportation occupations (%)
Most Common Occupations - Material moving occupations (%)
People in Group quarters - Institutionalized population (%)
People in Group quarters - Correctional institutions (%)
People in Group quarters - Federal prisons and detention centers (%)
People in Group quarters - Halfway houses (%)
People in Group quarters - Local jails and other confinement facilities (including police lockups) (%)
People in Group quarters - Military disciplinary barracks (%)
People in Group quarters - State prisons (%)
People in Group quarters - Other types of correctional institutions (%)
People in Group quarters - Nursing homes (%)
People in Group quarters - Hospitals/wards, hospices, and schools for the handicapped (%)
People in Group quarters - Hospitals/wards and hospices for chronically ill (%)
People in Group quarters - Hospices or homes for chronically ill (%)
People in Group quarters - Military hospitals or wards for chronically ill (%)
People in Group quarters - Other hospitals or wards for chronically ill (%)
People in Group quarters - Hospitals or wards for drug/alcohol abuse (%)
People in Group quarters - Mental (Psychiatric) hospitals or wards (%)
People in Group quarters - Schools, hospitals, or wards for the mentally retarded (%)
People in Group quarters - Schools, hospitals, or wards for the physically handicapped (%)
People in Group quarters - Institutions for the deaf (%)
People in Group quarters - Institutions for the blind (%)
People in Group quarters - Orthopedic wards and institutions for the physically handicapped (%)
People in Group quarters - Wards in general hospitals for patients who have no usual home elsewhere (%)
People in Group quarters - Wards in military hospitals for patients who have no usual home elsewhere (%)
People in Group quarters - Juvenile institutions (%)
People in Group quarters - Long-term care (%)
People in Group quarters - Homes for abused, dependent, and neglected children (%)
People in Group quarters - Residential treatment centers for emotionally disturbed children (%)
People in Group quarters - Training schools for juvenile delinquents (%)
People in Group quarters - Short-term care, detention or diagnostic centers for delinquent children (%)
People in Group quarters - Type of juvenile institution unknown (%)
People in Group quarters - Noninstitutionalized population (%)
People in Group quarters - College dormitories (includes college quarters off campus) (%)
People in Group quarters - Military quarters (%)
People in Group quarters - On base (%)
People in Group quarters - Barracks, unaccompanied personnel housing (UPH), (Enlisted/Officer), ;and similar group living quarters for military personnel (%)
People in Group quarters - Transient quarters for temporary residents (%)
People in Group quarters - Military ships (%)
People in Group quarters - Group homes (%)
People in Group quarters - Homes or halfway houses for drug/alcohol abuse (%)
People in Group quarters - Homes for the mentally ill (%)
People in Group quarters - Homes for the mentally retarded (%)
People in Group quarters - Homes for the physically handicapped (%)
People in Group quarters - Other group homes (%)
People in Group quarters - Religious group quarters (%)
People in Group quarters - Dormitories (%)
People in Group quarters - Agriculture workers' dormitories on farms (%)
People in Group quarters - Job Corps and vocational training facilities (%)
People in Group quarters - Other workers' dormitories (%)
People in Group quarters - Crews of maritime vessels (%)
People in Group quarters - Other nonhousehold living situations (%)
People in Group quarters - Other noninstitutional group quarters (%)
Residents speaking English at home (%)
Residents speaking English at home - Born in the United States (%)
Residents speaking English at home - Native, born elsewhere (%)
Residents speaking English at home - Foreign born (%)
Residents speaking Spanish at home (%)
Residents speaking Spanish at home - Born in the United States (%)
Residents speaking Spanish at home - Native, born elsewhere (%)
Residents speaking Spanish at home - Foreign born (%)
Residents speaking other language at home (%)
Residents speaking other language at home - Born in the United States (%)
Residents speaking other language at home - Native, born elsewhere (%)
Residents speaking other language at home - Foreign born (%)
Class of Workers - Employee of private company (%)
Class of Workers - Self-employed in own incorporated business (%)
Class of Workers - Private not-for-profit wage and salary workers (%)
Class of Workers - Local government workers (%)
Class of Workers - State government workers (%)
Class of Workers - Federal government workers (%)
Class of Workers - Self-employed workers in own not incorporated business and Unpaid family workers (%)
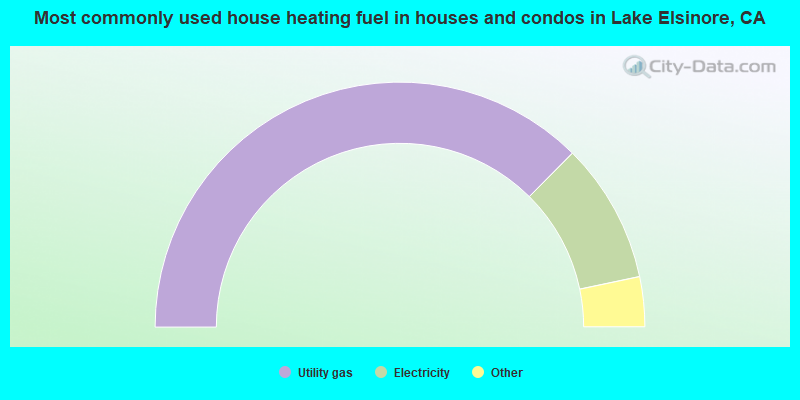
House heating fuel used in houses and condos - Utility gas (%)
House heating fuel used in houses and condos - Bottled, tank, or LP gas (%)
House heating fuel used in houses and condos - Electricity (%)
House heating fuel used in houses and condos - Fuel oil, kerosene, etc. (%)
House heating fuel used in houses and condos - Coal or coke (%)
House heating fuel used in houses and condos - Wood (%)
House heating fuel used in houses and condos - Solar energy (%)
House heating fuel used in houses and condos - Other fuel (%)
House heating fuel used in houses and condos - No fuel used (%)
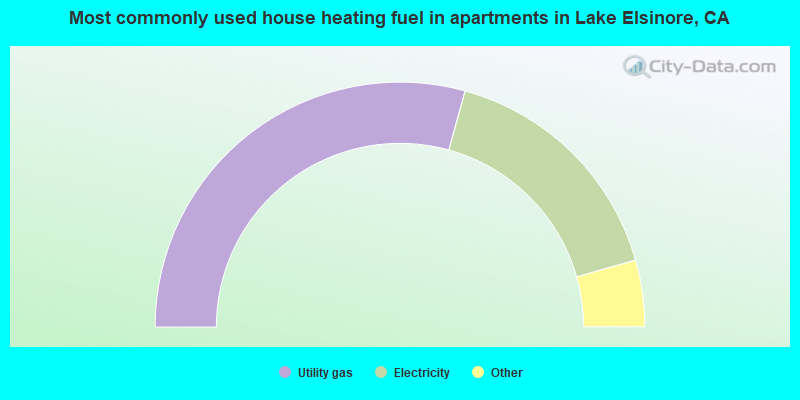
House heating fuel used in apartments - Utility gas (%)
House heating fuel used in apartments - Bottled, tank, or LP gas (%)
House heating fuel used in apartments - Electricity (%)
House heating fuel used in apartments - Fuel oil, kerosene, etc. (%)
House heating fuel used in apartments - Coal or coke (%)
House heating fuel used in apartments - Wood (%)
House heating fuel used in apartments - Solar energy (%)
House heating fuel used in apartments - Other fuel (%)
House heating fuel used in apartments - No fuel used (%)
Armed forces status - In Armed Forces (%)
Armed forces status - Civilian (%)
Armed forces status - Civilian - Veteran (%)
Armed forces status - Civilian - Nonveteran (%)
Fatal accidents locations in years 2005-2021
Fatal accidents locations in 2005
Fatal accidents locations in 2006
Fatal accidents locations in 2007
Fatal accidents locations in 2008
Fatal accidents locations in 2009
Fatal accidents locations in 2010
Fatal accidents locations in 2011
Fatal accidents locations in 2012
Fatal accidents locations in 2013
Fatal accidents locations in 2014
Fatal accidents locations in 2015
Fatal accidents locations in 2016
Fatal accidents locations in 2017
Fatal accidents locations in 2018
Fatal accidents locations in 2019
Fatal accidents locations in 2020
Fatal accidents locations in 2021
Alcohol use - People drinking some alcohol every month (%)
Alcohol use - People not drinking at all (%)
Alcohol use - Average days/month drinking alcohol
Alcohol use - Average drinks/week
Alcohol use - Average days/year people drink much
Audiometry - Average condition of hearing (%)
Audiometry - People that can hear a whisper from across a quiet room (%)
Audiometry - People that can hear normal voice from across a quiet room (%)
Audiometry - Ears ringing, roaring, buzzing (%)
Audiometry - Had a job exposure to loud noise (%)
Audiometry - Had off-work exposure to loud noise (%)
Blood Pressure & Cholesterol - Has high blood pressure (%)
Blood Pressure & Cholesterol - Checking blood pressure at home (%)
Blood Pressure & Cholesterol - Frequently checking blood cholesterol (%)
Blood Pressure & Cholesterol - Has high cholesterol level (%)
Consumer Behavior - Money monthly spent on food at supermarket/grocery store
Consumer Behavior - Money monthly spent on food at other stores
Consumer Behavior - Money monthly spent on eating out
Consumer Behavior - Money monthly spent on carryout/delivered foods
Consumer Behavior - Income spent on food at supermarket/grocery store (%)
Consumer Behavior - Income spent on food at other stores (%)
Consumer Behavior - Income spent on eating out (%)
Consumer Behavior - Income spent on carryout/delivered foods (%)
Current Health Status - General health condition (%)
Current Health Status - Blood donors (%)
Current Health Status - Has blood ever tested for HIV virus (%)
Current Health Status - Left-handed people (%)
Dermatology - People using sunscreen (%)
Diabetes - Diabetics (%)
Diabetes - Had a blood test for high blood sugar (%)
Diabetes - People taking insulin (%)
Diet Behavior & Nutrition - Diet health (%)
Diet Behavior & Nutrition - Milk product consumption (# of products/month)
Diet Behavior & Nutrition - Meals not home prepared (#/week)
Diet Behavior & Nutrition - Meals from fast food or pizza place (#/week)
Diet Behavior & Nutrition - Ready-to-eat foods (#/month)
Diet Behavior & Nutrition - Frozen meals/pizza (#/month)
Drug Use - People that ever used marijuana or hashish (%)
Drug Use - Ever used hard drugs (%)
Drug Use - Ever used any form of cocaine (%)
Drug Use - Ever used heroin (%)
Drug Use - Ever used methamphetamine (%)
Health Insurance - People covered by health insurance (%)
Kidney Conditions-Urology - Avg. # of times urinating at night
Medical Conditions - People with asthma (%)
Medical Conditions - People with anemia (%)
Medical Conditions - People with psoriasis (%)
Medical Conditions - People with overweight (%)
Medical Conditions - Elderly people having difficulties in thinking or remembering (%)
Medical Conditions - People who ever received blood transfusion (%)
Medical Conditions - People having trouble seeing even with glass/contacts (%)
Medical Conditions - People with arthritis (%)
Medical Conditions - People with gout (%)
Medical Conditions - People with congestive heart failure (%)
Medical Conditions - People with coronary heart disease (%)
Medical Conditions - People with angina pectoris (%)
Medical Conditions - People who ever had heart attack (%)
Medical Conditions - People who ever had stroke (%)
Medical Conditions - People with emphysema (%)
Medical Conditions - People with thyroid problem (%)
Medical Conditions - People with chronic bronchitis (%)
Medical Conditions - People with any liver condition (%)
Medical Conditions - People who ever had cancer or malignancy (%)
Mental Health - People who have little interest in doing things (%)
Mental Health - People feeling down, depressed, or hopeless (%)
Mental Health - People who have trouble sleeping or sleeping too much (%)
Mental Health - People feeling tired or having little energy (%)
Mental Health - People with poor appetite or overeating (%)
Mental Health - People feeling bad about themself (%)
Mental Health - People who have trouble concentrating on things (%)
Mental Health - People moving or speaking slowly or too fast (%)
Mental Health - People having thoughts they would be better off dead (%)
Oral Health - Average years since last visit a dentist
Oral Health - People embarrassed because of mouth (%)
Oral Health - People with gum disease (%)
Oral Health - General health of teeth and gums (%)
Oral Health - Average days a week using dental floss/device
Oral Health - Average days a week using mouthwash for dental problem
Oral Health - Average number of teeth
Pesticide Use - Households using pesticides to control insects (%)
Pesticide Use - Households using pesticides to kill weeds (%)
Physical Activity - People doing vigorous-intensity work activities (%)
Physical Activity - People doing moderate-intensity work activities (%)
Physical Activity - People walking or bicycling (%)
Physical Activity - People doing vigorous-intensity recreational activities (%)
Physical Activity - People doing moderate-intensity recreational activities (%)
Physical Activity - Average hours a day doing sedentary activities
Physical Activity - Average hours a day watching TV or videos
Physical Activity - Average hours a day using computer
Physical Functioning - People having limitations keeping them from working (%)
Physical Functioning - People limited in amount of work they can do (%)
Physical Functioning - People that need special equipment to walk (%)
Physical Functioning - People experiencing confusion/memory problems (%)
Physical Functioning - People requiring special healthcare equipment (%)
Prescription Medications - Average number of prescription medicines taking
Preventive Aspirin Use - Adults 40+ taking low-dose aspirin (%)
Reproductive Health - Vaginal deliveries (%)
Reproductive Health - Cesarean deliveries (%)
Reproductive Health - Deliveries resulted in a live birth (%)
Reproductive Health - Pregnancies resulted in a delivery (%)
Reproductive Health - Women breastfeeding newborns (%)
Reproductive Health - Women that had a hysterectomy (%)
Reproductive Health - Women that had both ovaries removed (%)
Reproductive Health - Women that have ever taken birth control pills (%)
Reproductive Health - Women taking birth control pills (%)
Reproductive Health - Women that have ever used Depo-Provera or injectables (%)
Reproductive Health - Women that have ever used female hormones (%)
Sexual Behavior - People 18+ that ever had sex (vaginal, anal, or oral) (%)
Sexual Behavior - Males 18+ that ever had vaginal sex with a woman (%)
Sexual Behavior - Males 18+ that ever performed oral sex on a woman (%)
Sexual Behavior - Males 18+ that ever had anal sex with a woman (%)
Sexual Behavior - Males 18+ that ever had any sex with a man (%)
Sexual Behavior - Females 18+ that ever had vaginal sex with a man (%)
Sexual Behavior - Females 18+ that ever performed oral sex on a man (%)
Sexual Behavior - Females 18+ that ever had anal sex with a man (%)
Sexual Behavior - Females 18+ that ever had any kind of sex with a woman (%)
Sexual Behavior - Average age people first had sex
Sexual Behavior - Average number of female sex partners in lifetime (males 18+)
Sexual Behavior - Average number of female vaginal sex partners in lifetime (males 18+)
Sexual Behavior - Average age people first performed oral sex on a woman (18+)
Sexual Behavior - Average number of woman performed oral sex on in lifetime (18+)
Sexual Behavior - Average number of male sex partners in lifetime (males 18+)
Sexual Behavior - Average number of male anal sex partners in lifetime (males 18+)
Sexual Behavior - Average age people first performed oral sex on a man (18+)
Sexual Behavior - Average number of male oral sex partners in lifetime (18+)
Sexual Behavior - People using protection when performing oral sex (%)
Sexual Behavior - Average number of times people have vaginal or anal sex a year
Sexual Behavior - People having sex without condom (%)
Sexual Behavior - Average number of male sex partners in lifetime (females 18+)
Sexual Behavior - Average number of male vaginal sex partners in lifetime (females 18+)
Sexual Behavior - Average number of female sex partners in lifetime (females 18+)
Sexual Behavior - Circumcised males 18+ (%)
Sleep Disorders - Average hours sleeping at night
Sleep Disorders - People that has trouble sleeping (%)
Smoking-Cigarette Use - People smoking cigarettes (%)
Taste & Smell - People 40+ having problems with smell (%)
Taste & Smell - People 40+ having problems with taste (%)
Taste & Smell - People 40+ that ever had wisdom teeth removed (%)
Taste & Smell - People 40+ that ever had tonsils teeth removed (%)
Taste & Smell - People 40+ that ever had a loss of consciousness because of a head injury (%)
Taste & Smell - People 40+ that ever had a broken nose or other serious injury to face or skull (%)
Taste & Smell - People 40+ that ever had two or more sinus infections (%)
Weight - Average height (inches)
Weight - Average weight (pounds)
Weight - Average BMI
Weight - People that are obese (%)
Weight - People that ever were obese (%)
Weight - People trying to lose weight (%)
43,214 60.1% Hispanic 18,556 25.8% White alone 5,200 7.2% Asian alone 2,389 3.3% Two or more races 2,055 2.9% Black alone 352 0.5% Other race alone 81 0.1% Native Hawaiian and Other 58 0.08% American Indian alone
The City-Data.com crime index weighs serious crimes and violent crimes more heavily. Higher means more crime, U.S. average is 246.1. It adjusts for the number of visitors and daily workers commuting into cities.
- means the value is smaller than the state average.
- means the value is about the same as the state average.
- means the value is bigger than the state average.
- means the value is much bigger than the state average.
Crime rate in Lake Elsinore detailed stats: murders, rapes, robberies, assaults, burglaries, thefts, arson Officers per 1,000 residents here:
0.02California average:
1.98
Latest news from Lake Elsinore, CA collected exclusively by city-data.com from local newspapers, TV, and radio stations
Ancestries: American (4.9%), German (3.0%), English (2.4%), Italian (1.8%), Irish (1.6%).
Current Local Time:
Land area: 33.8 square miles.
Population density: 2,127 people per square mile (low).
15,856 residents are foreign born (15.1% Latin America , 4.7% Asia ).
This city:
22.2%California:
26.5%
Median real estate property taxes paid for housing units with mortgages in 2022: $5,354 (0.9%)Median real estate property taxes paid for housing units with no mortgage in 2022: $2,771 (0.5%)
Nearest city with pop. 50,000+: Elsinore Valley, CA (2.4 miles
Nearest city with pop. 200,000+: Riverside, CA
Nearest city with pop. 1,000,000+: San Diego, CA
Nearest cities:
Latitude: 33.68 N, Longitude: 117.35 W
Daytime population change due to commuting: -15,300 (-21.3%)Workers who live and work in this city: 9,101 (26.6%)
Single-family new house construction building permits:
2022: 311 buildings , average cost: $347,0002021: 221 buildings , average cost: $283,0002020: 447 buildings , average cost: $187,5002019: 314 buildings , average cost: $249,7002018: 408 buildings , average cost: $297,0002017: 564 buildings , average cost: $289,2002016: 585 buildings , average cost: $273,6002015: 452 buildings , average cost: $193,5002014: 491 buildings , average cost: $184,4002013: 649 buildings , average cost: $187,5002012: 409 buildings , average cost: $177,8002011: 67 buildings , average cost: $181,6002010: 318 buildings , average cost: $180,9002009: 105 buildings , average cost: $176,9002008: 81 buildings , average cost: $208,5002007: 490 buildings , average cost: $201,2002006: 1362 buildings , average cost: $207,3002005: 1376 buildings , average cost: $199,3002004: 768 buildings , average cost: $196,6002003: 555 buildings , average cost: $171,2002002: 844 buildings , average cost: $189,5002001: 301 buildings , average cost: $193,7002000: 275 buildings , average cost: $186,2001999: 304 buildings , average cost: $199,0001998: 284 buildings , average cost: $177,7001997: 347 buildings , average cost: $162,400Unemployment in December 2023:
Population change in the 1990s: +8,848 (+44.1%).
Most common occupations in Lake Elsinore, CA (%)
Both Males Females
Other sales and related occupations, including supervisors (5.0%)
Retail sales workers, except cashiers (4.5%)
Other management occupations, except farmers and farm managers (4.2%)
Building and grounds cleaning and maintenance occupations (3.8%)
Other production occupations, including supervisors (3.7%)
Material recording, scheduling, dispatching, and distributing workers (3.3%)
Other office and administrative support workers, including supervisors (3.1%)
Driver/sales workers and truck drivers (5.1%)
Other production occupations, including supervisors (4.9%)
Other sales and related occupations, including supervisors (4.8%)
Vehicle and mobile equipment mechanics, installers, and repairers (4.8%)
Building and grounds cleaning and maintenance occupations (4.7%)
Other management occupations, except farmers and farm managers (4.6%)
Electrical equipment mechanics and other installation, maintenance, and repair workers, including supervisors (4.5%)
Information and record clerks, except customer service representatives (5.6%)
Other office and administrative support workers, including supervisors (5.5%)
Other sales and related occupations, including supervisors (5.3%)
Retail sales workers, except cashiers (5.1%)
Secretaries and administrative assistants (5.0%)
Cashiers (4.9%)
Preschool, kindergarten, elementary, and middle school teachers (4.0%)
Earthquake activity:
Lake Elsinore-area historical earthquake activity is significantly above California state average. It is 6948% greater than the overall U.S. average. On 6/28/1992 at 11:57:34, a magnitude 7.6 (6.2 MB, 7.6 MS, 7.3 MW, Depth: 0.7 mi, Class: Major, Intensity: VIII - XII) earthquake occurred 58.2 miles away from the city center, causing 3 deaths ( 1 shaking deaths, 2 other deaths) and 400 injuries, causing $100,000,000 total damage and $40,000,000 insured lossesOn 7/21/1952 at 11:52:14, a magnitude 7.7 (7.7 UK) earthquake occurred 131.3 miles away from Lake Elsinore center, causing $50,000,000 total damage On 10/16/1999 at 09:46:44, a magnitude 7.4 (6.3 MB, 7.4 MS, 7.2 MW, 7.3 ML) earthquake occurred 77.7 miles away from the city center On 5/19/1940 at 04:36:40, a magnitude 7.2 (7.2 UK) earthquake occurred 100.3 miles away from the city center, causing $33,000,000 total damage On 4/21/1918 at 22:32:30, a magnitude 6.8 (6.8 UK, Class: Strong, Intensity: VII - IX) earthquake occurred 10.5 miles away from Lake Elsinore center On 6/28/1992 at 15:05:30, a magnitude 6.9 (6.3 MB, 6.7 MS, 6.5 MW, 6.9 ME, Depth: 3.1 mi) earthquake occurred 51.8 miles away from Lake Elsinore center Magnitude types: body-wave magnitude (MB), energy magnitude (ME), local magnitude (ML), surface-wave magnitude (MS), moment magnitude (MW) Natural disasters: The number of natural disasters in Riverside County (46) is a lot greater than the US average (15).Major Disasters (Presidential) Declared: 27Emergencies Declared: 1Fires: 22, Floods: 20, Storms: 8, Winter Storms: 8, Landslides: 6, Mudslides: 5, Heavy Rains: 2, Earthquake: 1, Flash Flood: 1, Freeze: 1, Hurricane: 1, Tornado: 1, Tropical Storm: 1, Other: 1 (Note: some incidents may be assigned to more than one category). Hospitals and medical centers in Lake Elsinore: DAVITA-LAKE ELSINORE DIALYSIS CENTER (32291 MISSION TRAIL)
Other hospitals and medical centers near Lake Elsinore: HOSPICE OF THE VALLEYS (Hospital, about 10 miles away; SUN CITY, CA)
LIFE CARE CENTER OF MENIFEE (Nursing Home, about 10 miles away; SUN CITY, CA)
GENTIVA HEALTH SERVICES (PARENT) (Home Health Center, about 10 miles away; MENIFEE, CA)
HOPE HOSPICE AND HEALTHCARE, INC (Hospital, about 10 miles away; SUN CITY, CA)
LOMA LINDA UNIVERSITY MEDICAL CENTER-MURRIETA (about 12 miles away; MURRIETA, CA)
CENTINELA GRAND INC (Nursing Home, about 12 miles away; PERRIS, CA)
COUNTRY VILLA MURRIETA HEALTHCARE CENTER (Nursing Home, about 12 miles away; MURRIETA, CA)
Amtrak stations near Lake Elsinore: 11 miles: PERRIS (B.W. PERRIS INN, 480 REDLANDS AVE.) - Bus Station 17 miles: MORENO VALLEY (ARCO MINI MART, 2624 E. ALESSANDRO BLVD.) - Bus Station Services: public payphones.
Colleges/universities with over 2000 students nearest to Lake Elsinore:
Moreno Valley College (about 17 miles; Moreno Valley, CA ; Full-time enrollment: 4,650)
California Baptist University (about 18 miles; Riverside, CA ; FT enrollment: 6,085)
La Sierra University (about 18 miles; Riverside, CA ; FT enrollment: 2,205)
Riverside City College (about 21 miles; Riverside, CA ; FT enrollment: 10,661)
University of California-Riverside (about 21 miles; Riverside, CA ; FT enrollment: 20,647)
Saddleback College (about 21 miles; Mission Viejo, CA ; FT enrollment: 13,716)
Norco College (about 21 miles; Norco, CA ; FT enrollment: 4,916)
Public high schools in Lake Elsinore: LAKESIDE HIGH Students: 1,431, Location: 32593 RIVERSIDE DR., Grades: 9-12)TEMESCAL CANYON HIGH Students: 1,277, Location: 28755 EL TORO RD., Grades: 9-12)ORTEGA HIGH Students: 45, Location: 520 CHANEY ST., BLDG. 100, Grades: 9-12)KEITH MCCARTHY ACADEMY Students: 29, Location: 520 CHANEY ST., Grades: 9-12)SOUTHERN CALIFORNIA ONLINE ACADEMY Location: 1405 ED WAY, Grades: KG-12, Charter school )
Biggest public elementary/middle schools in Lake Elsinore: CANYON LAKE MIDDLE Students: 1,095, Location: 33005 CANYON HILLS RD., Grades: 6-8)TERRA COTTA MIDDLE Students: 1,070, Location: 29291 LAKE ST., Grades: 6-8)ELSINORE MIDDLE Students: 745, Location: 1203 W. GRAHAM AVE., Grades: 6-8)LAKELAND VILLAGE Students: 555, Location: 18730 GRAND AVE., Grades: KG-8)COTTONWOOD CANYON ELEMENTARY Students: 525, Location: 32100 LOST RD., Grades: KG-5)RICE CANYON ELEMENTARY Students: 477, Location: 29535 W.WIND DR., Grades: KG-5)WITHROW ELEMENTARY Students: 379, Location: 30100 AUDELO ST., Grades: KG-5)TUSCANY HILLS ELEMENTARY Students: 378, Location: 23 PONTE RUSSO, Grades: KG-5)EARL WARREN ELEMENTARY Students: 344, Location: 41221 ROSETTA CANYON RD., Grades: KG-5)MACHADO ELEMENTARY Students: 340, Location: 15150 JOY ST., Grades: KG-5)See full list of schools located in Lake Elsinore
Notable locations in Lake Elsinore: (A) , Hammack Ranch (B) , Durant Siding (C) , American Medical Response South Elsinore (D) , Lake Elsinore City Hall (E) , Lake Elsinore Chamber of Commerce (F) , Riverside County Fire Department Station 94 - Canyon Hills (G) , Lake Elsinore Branch Riverside City and County Public Library (H) , Lake Community Center (I) , Riverside County Fire Department Station 85 McVicker Park (J) , Riverside County Fire Department Station 10 Elsinore (K) , A Small World for Little People Day Care Center (L) . Display/hide their locations on the map
Shopping Centers: (1) , Lake Elsinore Town Center Shopping Center (2) , Lake Elsinore Square Shopping Center (3) , Shoppers Square Shopping Center (4) . Display/hide their locations on the map
Churches in Lake Elsinore include: (A) , Elsinore Christian Center (B) , Faith Tabernacle (C) , First Christian Church (D) , First Lutheran Church (E) , Independent Church (F) , Lake Elsinore Baptist Church (G) , Saint Andrews Episcopal Church (H) , Saint Francis of Rome Catholic Church (I) . Display/hide their locations on the map
Cemetery: (1) . Display/hide its location on the map
Lake: (A) . Display/hide its location on the map
River: (A) . Display/hide its location on the map
Parks in Lake Elsinore include: (1) , Lakepoint Park (2) , Summerhill Park (3) , Swick and Matich Park (4) , Yarborough Park (5) , Lake Elsinore Diamond Stadium (6) , Machado Park (7) , McVicker Park (8) , Oak Tree Park (9) . Display/hide their locations on the map
Birthplace of: Tom Malone (American football) - Football player, April Matson - Actor, Erron Maxey - Basketball player, Mauricio Herrera - Boxer.
Riverside County has a predicted average indoor radon screening level between 2 and 4 pCi/L (pico curies per liter) - Moderate Potential Drinking water stations with addresses in Lake Elsinore and their reported violations in the past:
LOOKOUT ROADHOUSE (Population served: 50, Groundwater):
Past monitoring violations:
One regular monitoring violation
Average household size: This city:
3.5 peopleCalifornia:
2.9 people
Percentage of family households: This city:
80.9%Whole state:
68.7%
Percentage of households with unmarried partners: This city:
8.8%Whole state:
7.2%
Likely homosexual households (counted as self-reported same-sex unmarried-partner households)
Lesbian couples: 0.5% of all households Gay men: 0.5% of all households
People in group quarters in Lake Elsinore in 2010:
145 people in state prisons
135 people in other noninstitutional facilities
89 people in workers' group living quarters and job corps centers
63 people in residential schools for people with disabilities
people in other noninstitutional group quarters in 2000Banks with branches in Lake Elsinore (2011 data):
Bank of America, National Association: Lake Elsinore Branch, North Lake Elsinore, Canyon Hills Branch. Info updated 2009/11/18: Bank assets: $1,451,969.3 mil, Deposits: $1,077,176.8 mil, headquarters in Charlotte, NC, positive income , 5782 total offices , Holding Company: Bank Of America Corporation
U.S. Bank National Association: North Lake Elsinore Albertsons Branc at 30901 Riverside Dr, branch established on 1999/02/04; Lake Elsinore Stater Brothers at 32281 Mission Trail, branch established on 2012/02/22. Info updated 2012/01/30: Bank assets: $330,470.8 mil, Deposits: $236,091.5 mil, headquarters in Cincinnati, OH, positive income , 3121 total offices , Holding Company: U.S. Bancorp
JPMorgan Chase Bank, National Association: Lake Elsinore Branch at 31575 Canyon Estates, branch established on 1957/11/29; Lake Elsinore Stater Bros Banking Ce at 29995 Canyon Hills Drive, branch established on 2010/03/08. Info updated 2011/11/10: Bank assets: $1,811,678.0 mil, Deposits: $1,190,738.0 mil, headquarters in Columbus, OH, positive income , International Specialization, 5577 total offices , Holding Company: Jpmorgan Chase & Co.
Wells Fargo Bank, National Association: Lake Elsinore Branch at 29265 Central Avenue, branch established on 2006/02/21; Lake Elsinore City at 31600 Grape Street, branch established on 1912/01/01. Info updated 2011/04/05: Bank assets: $1,161,490.0 mil, Deposits: $905,653.0 mil, headquarters in Sioux Falls, SD, positive income , 6395 total offices , Holding Company: Wells Fargo & Company
Mission Oaks National Bank: Lake Elsinore Branch at 600 Central Avenue, branch established on 2008/12/15. Info updated 2007/03/29: Bank assets: $137.7 mil, Deposits: $124.0 mil, headquarters in Temecula, CA, negative income in the last year , Commercial Lending Specialization, 3 total offices , Holding Company: Mission Oaks Bancorp
For population 15 years and over in Lake Elsinore:
Never married: 33.3%Now married: 54.3%Separated: 2.3%Widowed: 1.3%Divorced: 8.9% For population 25 years and over in Lake Elsinore:
High school or higher: 78.3%Bachelor's degree or higher: 20.1%Graduate or professional degree: 7.4%Unemployed: 4.5%Mean travel time to work (commute): 39.8 minutes
Education Gini index (Inequality in education) Here:
16.5California average:
15.5
Religion statistics for Lake Elsinore, CA (based on Riverside County data)
Religion Adherents Congregations Catholic 602,765 51 Evangelical Protestant 240,306 741 Other 77,581 194 Mainline Protestant 29,535 103 Black Protestant 19,170 40 Orthodox 3,647 11 None 1,216,637 -
Source: Clifford Grammich, Kirk Hadaway, Richard Houseal, Dale E.Jones, Alexei Krindatch, Richie Stanley and Richard H.Taylor. 2012. 2010 U.S.Religion Census: Religious Congregations & Membership Study. Association of Statisticians of American Religious Bodies. Jones, Dale E., et al. 2002. Congregations and Membership in the United States 2000. Nashville, TN: Glenmary Research Center. Graphs represent county-level data
Food Environment Statistics: Number of grocery stores : 330Riverside County :
1.60 / 10,000 pop.State :
2.14 / 10,000 pop.
Number of supercenters and club stores : 11Riverside County :
0.05 / 10,000 pop.State :
0.04 / 10,000 pop.
Number of convenience stores (no gas) : 91Riverside County :
0.44 / 10,000 pop.State :
0.62 / 10,000 pop.
Number of convenience stores (with gas) : 311This county :
1.51 / 10,000 pop.State :
1.49 / 10,000 pop.
Number of full-service restaurants : 1,125This county :
5.45 / 10,000 pop.State :
7.42 / 10,000 pop.
Adult diabetes rate : Riverside County :
7.7%State :
7.3%
Adult obesity rate : Riverside County :
24.5%California :
21.3%
Low-income preschool obesity rate : This county :
15.2%State :
17.9%
Health and Nutrition: Healthy diet rate : Lake Elsinore:
47.5%California:
49.4%
Average overall health of teeth and gums : This city:
46.8%California:
48.0%
People feeling badly about themselves : This city:
22.0%California:
20.2%
People not drinking alcohol at all : This city:
10.6%State:
11.2%
Average hours sleeping at night : General health condition : This city:
55.9%California:
56.4%
Average condition of hearing : Here:
81.3%California:
80.9%
More about Health and Nutrition of Lake Elsinore, CA Residents
Local government employment and payroll (March 2022)
Function
Full-time employees
Monthly full-time payroll
Average yearly full-time wage
Part-time employees
Monthly part-time payroll
Streets and Highways
36 $193,951 $64,650 0 $0 Other Government Administration
19 $159,552 $100,770 0 $0 Other and Unallocable
17 $114,261 $80,655 0 $0 Parks and Recreation
16 $99,534 $74,651 22 $40,124 Financial Administration
12 $103,208 $103,208 0 $0 Fire - Other
1 $8,930 $107,160 0 $0
Totals for Government
101 $679,437 $80,725 22 $40,124
Lake Elsinore government finances - Expenditure in 2017 (per resident):
Construction - Parks and Recreation: $8,143,000 ($113.26)
Protective Inspection and Regulation - Other: $1,414,000 ($19.67)Housing and Community Development: $757,000 ($10.53)General - Other: $432,000 ($6.01)Central Staff Services: $221,000 ($3.07)Regular Highways: $176,000 ($2.45)Current Operations - Police Protection: $11,705,000 ($162.80)
Local Fire Protection: $8,239,000 ($114.59)Parks and Recreation: $7,907,000 ($109.98)Housing and Community Development: $7,894,000 ($109.79)Central Staff Services: $7,396,000 ($102.87)Protective Inspection and Regulation - Other: $3,568,000 ($49.63)Regular Highways: $937,000 ($13.03)Financial Administration: $919,000 ($12.78)Health - Other: $807,000 ($11.22)General - Other: $503,000 ($7.00)Libraries: $40,000 ($0.56)General - Interest on Debt: $11,352,000 ($157.89)
Other Capital Outlay - Central Staff Services: $140,000 ($1.95)
General - Other: $67,000 ($0.93)Financial Administration: $18,000 ($0.25)
Lake Elsinore government finances - Revenue in 2017 (per resident):
Charges - Other: $6,276,000 ($87.29)
Parks and Recreation: $1,765,000 ($24.55)Regular Highways: $283,000 ($3.94)Federal Intergovernmental - Housing and Community Development: $340,000 ($4.73)
Miscellaneous - General Revenue - Other: $12,413,000 ($172.65)
Interest Earnings: $10,411,000 ($144.80)Special Assessments: $2,074,000 ($28.85)Fines and Forfeits: $1,027,000 ($14.28)Donations From Private Sources: $959,000 ($13.34)Rents: $289,000 ($4.02)State Intergovernmental - Other: $4,489,000 ($62.44)
Highways: $1,161,000 ($16.15)General Local Government Support: $28,000 ($0.39)Tax - General Sales and Gross Receipts: $10,645,000 ($148.06)
Property: $7,645,000 ($106.33)Other License: $4,469,000 ($62.16)Other: $3,689,000 ($51.31)Public Utilities Sales: $2,344,000 ($32.60)Other Selective Sales: $566,000 ($7.87)Documentary and Stock Transfer: $375,000 ($5.22)Occupation and Business License - Other: $356,000 ($4.95)
Lake Elsinore government finances - Debt in 2017 (per resident):
Long Term Debt - Beginning Outstanding - Unspecified Public Purpose: $250,755,000 ($3487.65)
Outstanding Unspecified Public Purpose: $242,005,000 ($3365.95)Retired Unspecified Public Purpose: $8,750,000 ($121.70)Beginning Outstanding - Public Debt for Private Purpose: $4,321,000 ($60.10)Outstanding Nonguaranteed - Industrial Revenue: $4,217,000 ($58.65)Retired Nonguaranteed - Public Debt for Private Purpose: $104,000 ($1.45)
Lake Elsinore government finances - Cash and Securities in 2017 (per resident):
Bond Funds - Cash and Securities: $31,485,000 ($437.91)
Other Funds - Cash and Securities: $68,097,000 ($947.13)
Sinking Funds - Cash and Securities: $210,031,000 ($2921.24)
7.19% of this county's 2021 resident taxpayers lived in other counties in 2020 ($71,521 average adjusted gross income )
Here:
7.19%California average:
5.19%
0.03% of residents moved from foreign countries ($210 average AGI )Riverside County:
0.03%California average:
0.03%
Top counties from which taxpayers relocated into this county between 2020 and 2021:
6.28% of this county's 2020 resident taxpayers moved to other counties in 2021 ($64,593 average adjusted gross income )
Here:
6.28%California average:
6.14%
0.02% of residents moved to foreign countries ($200 average AGI )Riverside County:
0.02%California average:
0.02%
Top counties to which taxpayers relocated from this county between 2020 and 2021:
Businesses in Lake Elsinore, CA
Name Count Name Count
99 Cents Only Stores 1 KFC 2 AT&T 1 LA Fitness 1 Albertsons 2 Levi Strauss & Co. 1 AutoZone 2 Little Caesars Pizza 1 Baskin-Robbins 1 Lowe's 1 Bath & Body Works 1 MasterBrand Cabinets 2 Bed Bath & Beyond 1 McDonald's 3 Best Western 1 Nike 2 Big O Tires 1 Old Navy 1 Burger King 1 Pac Sun 1 CVS 2 Panda Express 2 Carl\s Jr. 2 Payless 2 Casual Male XL 1 Penske 1 Chevrolet 1 PetSmart 1 Circle K 6 Pizza Hut 1 Costco 1 RadioShack 2 Curves 1 Rite Aid 2 Dairy Queen 1 Rue21 1 Dennys 1 SAS Shoes 1 Domino's Pizza 1 Skechers USA 1 DressBarn 1 Staples 1 Dressbarn 1 Starbucks 5 El Pollo Loco 2 T-Mobile 5 Famous Footwear 1 Taco Bell 2 FedEx 7 Target 1 Firestone Complete Auto Care 1 Toys"R"Us 1 GNC 2 U-Haul 4 GameStop 1 UPS 7 Gap 1 Vans 1 Gymboree 1 Vons 1 H&R Block 2 Walgreens 1 Holiday Inn 1 Walmart 1 Home Depot 1 Wendy's 1 IHOP 1
Strongest AM radio stations in Lake Elsinore:
KPLS (830 AM; 50 kW; ORANGE, CA; Owner: CRN LICENSES, LLC)
KFI (640 AM; 50 kW; LOS ANGELES, CA; Owner: CAPSTAR TX LIMITED PARTNERSHIP)
KLAC (570 AM; 50 kW; LOS ANGELES, CA; Owner: AMFM RADIO LICENSES, L.L.C.)
KTNQ (1020 AM; 50 kW; LOS ANGELES, CA; Owner: KTNQ-AM LICENSE CORP.)
KXTA (1150 AM; 50 kW; LOS ANGELES, CA; Owner: CITICASTERS LICENSES, L.P.)
KDIS (1110 AM; 50 kW; PASADENA, CA; Owner: ABC,INC.)
KFMB (760 AM; 50 kW; SAN DIEGO, CA; Owner: MIDWEST TELEVISION, INC.)
KFWB (980 AM; 50 kW; LOS ANGELES, CA; Owner: INFINITY BROADCASTING OPERATIONS, INC.)
KSPN (710 AM; 50 kW; LOS ANGELES, CA; Owner: KABC-AM RADIO, INC.)
KNX (1070 AM; 50 kW; LOS ANGELES, CA; Owner: INFINITY BROADCASTING OPERATIONS, INC.)
KWRM (1370 AM; 5 kW; CORONA, CA; Owner: MAJOR MARKET STATIONS, INC.)
KCBQ (1170 AM; 50 kW; SAN DIEGO, CA; Owner: RADIO 1210, INC.)
KMPC (1540 AM; 50 kW; LOS ANGELES, CA; Owner: ROSE CITY RADIO CORPORATION)
Strongest FM radio stations in Lake Elsinore:
KRTM (88.9 FM; TEMECULA, CA; Owner: PENFOLD COMMUNICATIONS, INC.)
KWVE (107.9 FM; SAN CLEMENTE, CA; Owner: CALVARY CHAPEL OF COSTA MESA)
KLRD (90.1 FM; YUCAIPA, CA; Owner: EDUCATIONAL MEDIA FOUNDATION)
KUOR-FM (89.1 FM; REDLANDS, CA; Owner: UNIVERSITY OF REDLANDS)
KOLA (99.9 FM; SAN BERNARDINO, CA; Owner: INLAND EMPIRE BROADCASTING CORP.)
KUCR (88.3 FM; RIVERSIDE, CA; Owner: THE REGENTS OF THE UNIV. OF CA)
KVCR (91.9 FM; SAN BERNARDINO, CA; Owner: SAN BERNARDINO COMMUNITY COLLEGE DISTRICT)
KXFG (92.9 FM; SUN CITY, CA; Owner: INFINITY RADIO OPERATIONS INC.)
KWRP (96.1 FM; SAN JACINTO, CA; Owner: MAGIC BROADCASTING, INC.)
KPLM-FM2 (106.1 FM; SAN JACINTO, CA; Owner: RM BROADCASTING L.L.C.)
K201AR (88.1 FM; BANNING, CA; Owner: KSGN, INC.)
K232CX (94.3 FM; DESERT HOT SPRINGS, CA; Owner: MCC RADIO, LLC)
KCXX (103.9 FM; LAKE ARROWHEAD, CA; Owner: ALL-PRO BROADCASTING, INC.)
KGBB (103.3 FM; TEMECULA, CA; Owner: CLEAR CHANNEL BROADCASTING LICENSES, INC.)
KMYT (94.5 FM; TEMECULA, CA; Owner: CLEAR CHANNEL BROADCASTING LICENSES, INC.)
K295AI (106.9 FM; MUSCOY, CA; Owner: ASSOCIATION FOR COMMUNITY EDUCATION, INC.)
KCBS-FM (93.1 FM; LOS ANGELES, CA; Owner: INFINITY BROADCASTING OPERATIONS, INC.)
KATY-FM (101.3 FM; IDYLLWILD, CA; Owner: ALL PRO BROADCASTING, INC.)
KXRS (105.7 FM; HEMET, CA; Owner: LAZER BROADCASTING CORPORATION)
K264AF (100.7 FM; GUASTI, CA; Owner: EDUCATIONAL MEDIA FOUNDATION)
TV broadcast stations around Lake Elsinore:
KTRO-LP (Channel 50; LANCASTER, CA; Owner: ROBERT D. ADELMAN)
KHIZ (Channel 64; BARSTOW, CA; Owner: SUNBELT TELEVISION, INC.)
KVCR-TV (Channel 24; SAN BERNARDINO, CA; Owner: SAN BERNARDINO COMMUNITY COLLEGE DISTRICT)
K47FL (Channel 47; FALLBROOK, CA; Owner: CHANNEL 51 OF SAN DIEGO, INC.)
National Bridge Inventory (NBI) Statistics 46 Number of bridges495ft / 151m Total length $663,000 Total costs1,241,449 Total average daily traffic121,699 Total average daily truck traffic
New bridges - historical statistics
1 1940-1949 1 1950-1959 24 1980-1989 13 1990-1999 5 2000-2009 2 2010-2019
See full National Bridge Inventory statistics for Lake Elsinore, CA
Home Mortgage Disclosure Act Aggregated Statistics For Year 2009(Based on 4 full and 7 partial tracts) A) FHA, FSA/RHS & VA B) Conventional C) Refinancings D) Home Improvement Loans E) Loans on Dwellings For 5+ Families F) Non-occupant Loans on G) Loans On Manufactured Number Average Value Number Average Value Number Average Value Number Average Value Number Average Value Number Average Value Number Average Value
LOANS ORIGINATED 595 $194,188 333 $142,086 297 $208,882 9 $87,578 0 $0 142 $127,194 20 $144,000 APPLICATIONS APPROVED, NOT ACCEPTED 55 $185,965 47 $163,161 64 $195,443 4 $59,505 1 $19,547,000 24 $126,127 2 $213,250 APPLICATIONS DENIED 155 $191,124 100 $165,451 231 $212,189 17 $61,528 0 $0 59 $152,723 11 $135,875 APPLICATIONS WITHDRAWN 88 $180,656 73 $157,532 100 $217,088 6 $61,120 1 $108,000 27 $145,661 7 $142,259 FILES CLOSED FOR INCOMPLETENESS 15 $200,962 13 $145,303 39 $207,521 4 $81,455 0 $0 11 $143,697 1 $233,700
Aggregated Statistics For Year 2008(Based on 4 full and 7 partial tracts) A) FHA, FSA/RHS & VA B) Conventional C) Refinancings D) Home Improvement Loans E) Loans on Dwellings For 5+ Families F) Non-occupant Loans on G) Loans On Manufactured Number Average Value Number Average Value Number Average Value Number Average Value Number Average Value Number Average Value Number Average Value
LOANS ORIGINATED 463 $242,316 449 $190,557 237 $226,995 36 $67,304 3 $566,830 163 $171,031 34 $151,390 APPLICATIONS APPROVED, NOT ACCEPTED 46 $229,684 101 $213,963 85 $285,103 9 $45,732 0 $0 24 $170,784 6 $137,978 APPLICATIONS DENIED 112 $251,827 182 $209,945 499 $273,530 74 $92,296 1 $106,920 108 $173,835 33 $157,965 APPLICATIONS WITHDRAWN 66 $244,623 105 $202,862 139 $253,405 8 $134,705 1 $3,072,000 31 $183,489 6 $220,745 FILES CLOSED FOR INCOMPLETENESS 14 $238,937 28 $226,775 45 $273,398 7 $107,731 0 $0 10 $186,093 3 $77,250
Aggregated Statistics For Year 2007(Based on 4 full and 7 partial tracts) A) FHA, FSA/RHS & VA B) Conventional C) Refinancings D) Home Improvement Loans E) Loans on Dwellings For 5+ Families F) Non-occupant Loans on G) Loans On Manufactured Number Average Value Number Average Value Number Average Value Number Average Value Number Average Value Number Average Value Number Average Value
LOANS ORIGINATED 38 $304,691 1,139 $246,228 1,238 $264,789 180 $156,836 2 $520,000 234 $247,363 69 $181,027 APPLICATIONS APPROVED, NOT ACCEPTED 7 $256,290 351 $247,061 406 $275,360 57 $126,228 0 $0 58 $274,914 22 $166,790 APPLICATIONS DENIED 33 $303,304 607 $284,906 1,432 $301,071 227 $144,829 1 $100,000 178 $275,011 72 $173,087 APPLICATIONS WITHDRAWN 12 $310,758 299 $272,395 499 $296,505 47 $196,464 0 $0 60 $289,175 17 $195,901 FILES CLOSED FOR INCOMPLETENESS 0 $0 57 $292,064 202 $323,165 13 $217,331 0 $0 21 $274,297 12 $172,826
Aggregated Statistics For Year 2006(Based on 4 full and 7 partial tracts) A) FHA, FSA/RHS & VA B) Conventional C) Refinancings D) Home Improvement Loans E) Loans on Dwellings For 5+ Families F) Non-occupant Loans on G) Loans On Manufactured Number Average Value Number Average Value Number Average Value Number Average Value Number Average Value Number Average Value Number Average Value
LOANS ORIGINATED 20 $276,849 2,836 $237,180 2,166 $268,081 301 $158,994 5 $588,000 376 $243,888 95 $177,275 APPLICATIONS APPROVED, NOT ACCEPTED 2 $241,845 684 $238,202 552 $271,876 62 $143,095 0 $0 103 $255,510 28 $151,919 APPLICATIONS DENIED 3 $206,840 976 $258,180 1,431 $293,749 257 $133,181 1 $715,000 173 $278,816 86 $198,528 APPLICATIONS WITHDRAWN 6 $251,183 634 $249,062 854 $298,637 87 $175,742 0 $0 106 $254,625 25 $190,286 FILES CLOSED FOR INCOMPLETENESS 0 $0 139 $255,844 233 $291,937 21 $167,596 0 $0 26 $244,730 3 $206,227
Aggregated Statistics For Year 2005(Based on 4 full and 7 partial tracts) A) FHA, FSA/RHS & VA B) Conventional C) Refinancings D) Home Improvement Loans E) Loans on Dwellings For 5+ Families F) Non-occupant Loans on G) Loans On Manufactured Number Average Value Number Average Value Number Average Value Number Average Value Number Average Value Number Average Value Number Average Value
LOANS ORIGINATED 20 $232,598 2,236 $234,848 2,401 $252,895 321 $161,736 6 $1,572,833 437 $225,524 107 $170,504 APPLICATIONS APPROVED, NOT ACCEPTED 1 $152,910 508 $226,875 416 $251,839 71 $127,148 0 $0 99 $206,418 32 $121,628 APPLICATIONS DENIED 5 $249,904 757 $229,680 1,181 $259,176 248 $136,124 2 $1,380,000 156 $230,044 86 $164,939 APPLICATIONS WITHDRAWN 3 $230,323 570 $250,975 961 $255,367 125 $186,553 0 $0 111 $224,156 34 $167,180 FILES CLOSED FOR INCOMPLETENESS 1 $135,280 122 $262,336 336 $269,895 24 $210,275 0 $0 35 $256,717 14 $165,096
Aggregated Statistics For Year 2004(Based on 4 full and 7 partial tracts) A) FHA, FSA/RHS & VA B) Conventional C) Refinancings D) Home Improvement Loans E) Loans on Dwellings For 5+ Families F) Non-occupant Loans on G) Loans On Manufactured Number Average Value Number Average Value Number Average Value Number Average Value Number Average Value Number Average Value Number Average Value
LOANS ORIGINATED 38 $192,888 1,716 $208,173 2,711 $212,873 319 $148,055 5 $1,542,608 374 $192,360 116 $152,686 APPLICATIONS APPROVED, NOT ACCEPTED 5 $153,126 337 $207,741 518 $206,219 57 $123,229 0 $0 74 $197,579 49 $144,927 APPLICATIONS DENIED 11 $189,648 423 $209,226 1,048 $207,195 227 $102,228 2 $214,000 107 $196,951 72 $140,923 APPLICATIONS WITHDRAWN 7 $173,111 425 $223,327 866 $210,492 85 $114,574 1 $268,670 77 $215,969 31 $151,217 FILES CLOSED FOR INCOMPLETENESS 3 $161,697 75 $213,493 332 $206,727 17 $93,658 1 $3,529,000 18 $207,587 7 $148,764
Aggregated Statistics For Year 2003(Based on 4 full and 7 partial tracts) A) FHA, FSA/RHS & VA B) Conventional C) Refinancings D) Home Improvement Loans E) Loans on Dwellings For 5+ Families F) Non-occupant Loans on Number Average Value Number Average Value Number Average Value Number Average Value Number Average Value Number Average Value
LOANS ORIGINATED 125 $156,197 1,409 $176,595 3,142 $162,508 105 $67,371 10 $774,858 324 $138,217 APPLICATIONS APPROVED, NOT ACCEPTED 17 $162,485 263 $178,317 567 $169,268 28 $54,460 0 $0 55 $171,654 APPLICATIONS DENIED 28 $159,640 327 $157,698 1,065 $161,750 136 $44,993 0 $0 84 $147,189 APPLICATIONS WITHDRAWN 14 $167,956 276 $193,870 950 $165,821 33 $70,134 0 $0 42 $136,203 FILES CLOSED FOR INCOMPLETENESS 4 $161,935 76 $208,634 180 $159,038 14 $59,356 0 $0 13 $143,275
Aggregated Statistics For Year 1999(Based on 1 partial tract) A) FHA, FSA/RHS & VA B) Conventional C) Refinancings D) Home Improvement Loans E) Loans on Dwellings For 5+ Families F) Non-occupant Loans on Number Average Value Number Average Value Number Average Value Number Average Value Number Average Value Number Average Value
LOANS ORIGINATED 236 $119,775 258 $126,913 356 $98,638 99 $29,129 11 $2,144,787 48 $78,248 APPLICATIONS APPROVED, NOT ACCEPTED 14 $109,483 31 $123,223 87 $101,727 51 $28,261 1 $154,310 7 $93,073 APPLICATIONS DENIED 29 $123,740 79 $126,019 294 $78,954 106 $24,316 2 $108,870 18 $75,692 APPLICATIONS WITHDRAWN 26 $110,717 94 $157,989 161 $97,705 9 $31,116 0 $0 5 $60,464 FILES CLOSED FOR INCOMPLETENESS 8 $117,729 9 $113,220 57 $103,542 2 $19,145 1 $1,405,890 3 $68,770
Detailed mortgage data for all 11 tracts in Lake Elsinore, CA
Private Mortgage Insurance Companies Aggregated Statistics For Year 2009(Based on 4 full and 6 partial tracts) A) Conventional B) Refinancings C) Non-occupant Loans on Number Average Value Number Average Value Number Average Value
LOANS ORIGINATED 35 $178,783 1 $117,330 1 $229,090 APPLICATIONS APPROVED, NOT ACCEPTED 26 $228,987 2 $191,920 1 $217,340 APPLICATIONS DENIED 9 $205,346 1 $228,380 2 $212,040 APPLICATIONS WITHDRAWN 1 $153,400 0 $0 0 $0 FILES CLOSED FOR INCOMPLETENESS 2 $232,010 1 $285,000 1 $332,760
Aggregated Statistics For Year 2008(Based on 4 full and 7 partial tracts) A) Conventional B) Refinancings C) Non-occupant Loans on D) Loans On Manufactured Number Average Value Number Average Value Number Average Value Number Average Value
LOANS ORIGINATED 172 $242,359 20 $304,236 8 $237,015 0 $0 APPLICATIONS APPROVED, NOT ACCEPTED 102 $303,845 50 $338,980 9 $249,822 1 $204,340 APPLICATIONS DENIED 29 $247,538 3 $201,933 4 $311,945 0 $0 APPLICATIONS WITHDRAWN 12 $196,687 0 $0 0 $0 0 $0 FILES CLOSED FOR INCOMPLETENESS 4 $279,302 0 $0 0 $0 0 $0
Aggregated Statistics For Year 2007(Based on 4 full and 7 partial tracts) A) Conventional B) Refinancings C) Non-occupant Loans on D) Loans On Manufactured Number Average Value Number Average Value Number Average Value Number Average Value
LOANS ORIGINATED 117 $334,915 68 $382,109 10 $312,576 1 $299,760 APPLICATIONS APPROVED, NOT ACCEPTED 29 $329,366 27 $387,535 2 $282,640 0 $0 APPLICATIONS DENIED 9 $334,011 9 $367,513 1 $398,910 0 $0 APPLICATIONS WITHDRAWN 8 $309,292 14 $359,702 1 $264,000 0 $0 FILES CLOSED FOR INCOMPLETENESS 0 $0 1 $230,430 0 $0 0 $0
Aggregated Statistics For Year 2006(Based on 4 full and 7 partial tracts) A) Conventional B) Refinancings C) Non-occupant Loans on D) Loans On Manufactured Number Average Value Number Average Value Number Average Value Number Average Value
LOANS ORIGINATED 30 $333,659 35 $357,653 4 $292,398 2 $177,465 APPLICATIONS APPROVED, NOT ACCEPTED 13 $275,508 18 $370,109 1 $261,420 4 $193,500 APPLICATIONS DENIED 0 $0 5 $339,788 0 $0 0 $0 APPLICATIONS WITHDRAWN 4 $320,748 10 $331,929 0 $0 0 $0 FILES CLOSED FOR INCOMPLETENESS 0 $0 0 $0 0 $0 0 $0
Aggregated Statistics For Year 2005(Based on 4 full and 7 partial tracts) A) Conventional B) Refinancings C) Non-occupant Loans on D) Loans On Manufactured Number Average Value Number Average Value Number Average Value Number Average Value
LOANS ORIGINATED 41 $298,929 44 $314,620 6 $274,218 2 $182,250 APPLICATIONS APPROVED, NOT ACCEPTED 22 $265,223 11 $297,095 10 $232,792 0 $0 APPLICATIONS DENIED 1 $369,600 7 $367,960 0 $0 0 $0 APPLICATIONS WITHDRAWN 6 $368,252 4 $346,720 3 $335,077 0 $0 FILES CLOSED FOR INCOMPLETENESS 0 $0 1 $392,230 0 $0 0 $0
Aggregated Statistics For Year 2004(Based on 4 full and 7 partial tracts) A) Conventional B) Refinancings C) Non-occupant Loans on D) Loans On Manufactured Number Average Value Number Average Value Number Average Value Number Average Value
LOANS ORIGINATED 90 $254,598 50 $241,222 15 $188,687 5 $198,306 APPLICATIONS APPROVED, NOT ACCEPTED 28 $235,093 36 $211,907 4 $216,322 1 $217,480 APPLICATIONS DENIED 2 $237,900 3 $208,310 2 $144,380 0 $0 APPLICATIONS WITHDRAWN 7 $237,226 3 $238,490 0 $0 0 $0 FILES CLOSED FOR INCOMPLETENESS 0 $0 2 $136,610 0 $0 0 $0
Aggregated Statistics For Year 2003(Based on 4 full and 7 partial tracts) A) Conventional B) Refinancings C) Non-occupant Loans on Number Average Value Number Average Value Number Average Value
LOANS ORIGINATED 222 $203,584 147 $198,251 27 $158,842 APPLICATIONS APPROVED, NOT ACCEPTED 63 $223,789 48 $201,749 7 $189,643 APPLICATIONS DENIED 5 $202,068 3 $180,450 1 $288,510 APPLICATIONS WITHDRAWN 4 $226,035 10 $237,927 0 $0 FILES CLOSED FOR INCOMPLETENESS 2 $268,205 0 $0 0 $0
Aggregated Statistics For Year 1999(Based on 1 partial tract) A) Conventional B) Refinancings C) Non-occupant Loans on Number Average Value Number Average Value Number Average Value
LOANS ORIGINATED 83 $146,545 61 $138,162 6 $71,628 APPLICATIONS APPROVED, NOT ACCEPTED 6 $128,873 12 $133,827 1 $143,450 APPLICATIONS DENIED 6 $144,113 4 $140,875 1 $129,160 APPLICATIONS WITHDRAWN 3 $203,453 2 $132,875 0 $0 FILES CLOSED FOR INCOMPLETENESS 2 $140,305 0 $0 0 $0
Fire-safe hotels and motels in Lake Elsinore, California:
Quality Inn, 31808 Casino Dr, Lake Elsinore, California 92530 Phone: (951) 674-9694, Fax: (951) 245-9249
Holiday Inn Express Hotel & Suites Lake Elsinore, 31573 Cyn Estates Dr, Lake Elsinore, California 92532 Phone: (951) 674-4333, Fax: (951) 674-3111
Best Western Lake View Inn & Suites, 31781 Casino Dr, Lake Elsinore, California 92530 Phone: (951) 674-3131, Fax: (951) 674-1719
Econolodge, 20930 Malaga Rd, Lake Elsinore, California 92530 Phone: (951) 674-3101, Fax: (951) 674-4071
All 4 fire-safe hotels and motels in Lake Elsinore, California
Most common first names in Lake Elsinore, CA among deceased individuals Name Count Lived (average)
John 92 71.4 years Robert 90 71.1 years William 79 73.5 years James 66 72.0 years Mary 64 77.3 years Charles 62 74.5 years George 47 76.8 years Richard 46 66.4 years Donald 42 69.2 years Helen 39 80.8 years
Most common last names in Lake Elsinore, CA among deceased individuals Last name Count Lived (average)
Johnson 38 73.8 years Smith 36 72.3 years Williams 22 68.7 years Davis 20 75.5 years Wilson 17 75.6 years White 17 74.6 years Martin 17 74.2 years Jones 16 80.6 years Miller 15 76.1 years Rodriguez 15 60.0 years
Lake Elsinore compared to California state average:
Unemployed percentage significantly below state average. Hispanic race population percentage significantly above state average. Foreign-born population percentage above state average. Length of stay since moving in significantly below state average. House age significantly below state average. Lake Elsinore on our top lists :
#3 on the list of "Top 100 cities with longest commuting times (pop. 50,000+)"
#15 on the list of "Top 101 cities with the largest differences between daily high and daily low temperatures (population 50,000+)"
#19 on the list of "Top 101 cities with most building permits per 10,000 residents (population 50,000+)"
#21 on the list of "Top 101 cities with largest percentage of males in industries: construction (population 50,000+)"
#23 on the list of "Top 101 cities with largest percentage of females in occupations: personal care and service occupations (population 50,000+)"
#25 on the list of "Top 101 cities with largest percentage of females in industries: wholesale trade (population 50,000+)"
#26 on the list of "Top 101 cities with the largest percentage population increase from 2000 (population 50,000+)"
#29 on the list of "Top 100 low-educated but high-earning cities (pop. 50,000+)"
#36 on the list of "Top 100 fastest growing cities from 2000 to 2014 (pop. 50,000+)"
#37 on the list of "Top 101 cities with largest percentage of females in occupations: sales and related occupations (population 50,000+)"
#38 on the list of "Top 101 cities with the highest daily high temperatures (population 50,000+)"
#41 on the list of "Top 101 cities with the least people having Doctorate degrees (population 50,000+)"
#43 on the list of "Top 101 cities with the lowest average snowfall in a year (population 50,000+)"
#46 on the list of "Top 101 cities with the smallest percentage of elementary and middle school students in private schools (5,000+ students)"
#47 on the list of "Top 101 cities with largest percentage of females in industries: real estate and rental and leasing (population 50,000+)"
#48 on the list of "Top 101 cities with the highest number of auto thefts per 100,000 residents, excludes tourist destinations and others with a lot of outsiders visiting based on city industries data (population 50,000+)"
#53 on the list of "Top 100 cities with newest houses (pop. 50,000+)"
#62 on the list of "Top 101 cities with largest percentage of males in industries: utilities (population 50,000+)"
#68 on the list of "Top 101 cities with largest percentage population increases in the 1990s) (population 50,000+)"
#75 on the list of "Top 101 cities with the most users submitting photos to our site per 10,000 residents (population 50,000+)"
#3 on the list of "Top 101 counties with the highest lead air pollution readings in 2012 (µg/m3 )"
#4 on the list of "Top 101 counties with the highest ground withdrawal of fresh water for public supply"
#11 on the list of "Top 101 counties with the most Catholic adherents"
#11 on the list of "Top 101 counties with the highest total withdrawal of fresh water for public supply"
#12 on the list of "Top 101 counties with the highest carbon monoxide air pollution readings in 2012 (ppm)"
Top Patent Applicants
Daniel Brian Cregg (12)
Jason Phillips (5)
Michael A. Stetson (5)
Aaron J. Gifford (5)
David Robbins Asbury (5)
Michel Laurin (4)
Peter Mortensen (4)
Eugen Bogos (4)
Samuel Dale Frias (3)
John T. Sorensen (3)
Total of 154 patent applications in 2008-2024.
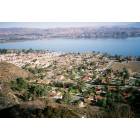
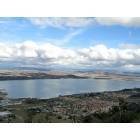
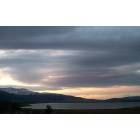
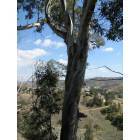
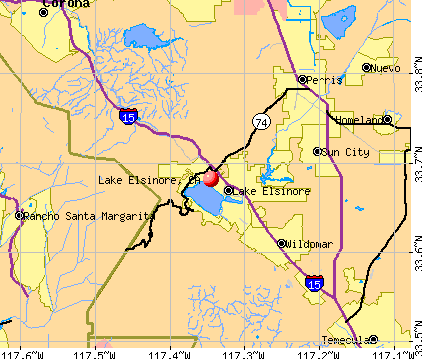


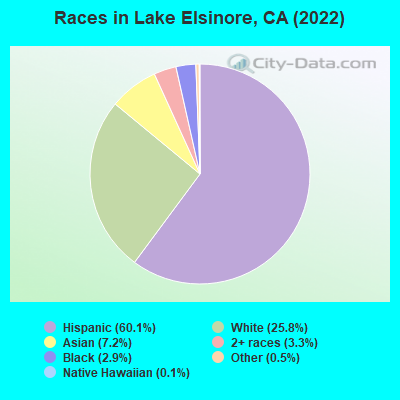
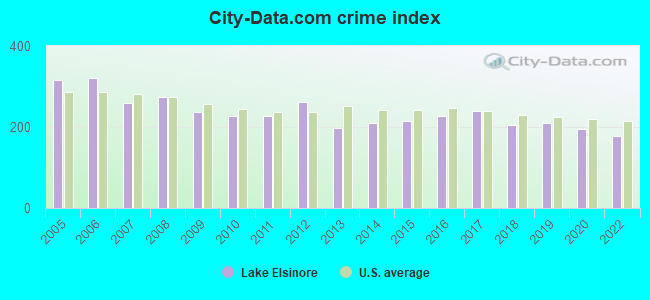
 Recent articles from our blog. Our writers, many of them Ph.D. graduates or candidates, create easy-to-read articles on a wide variety of topics.

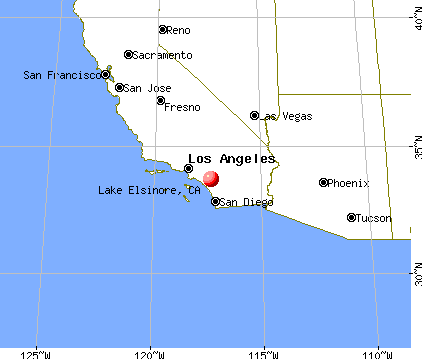
 , pop. 70,763).
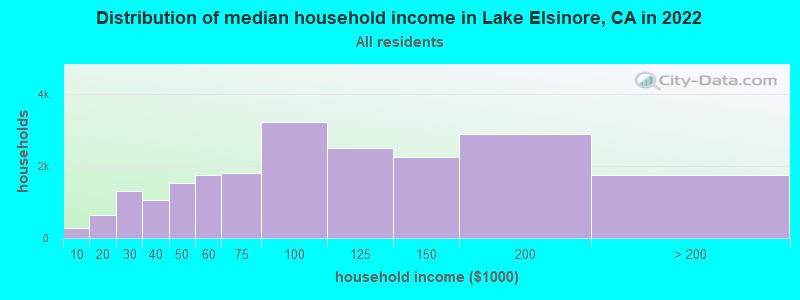
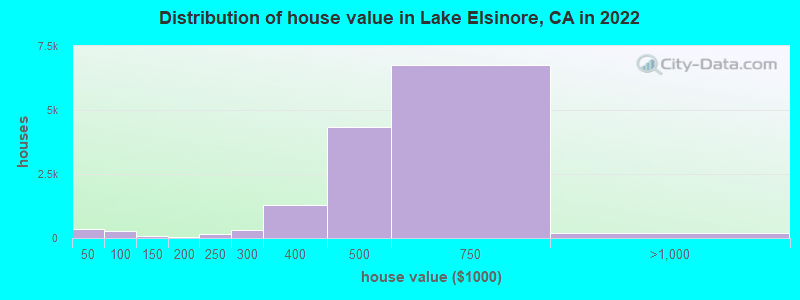
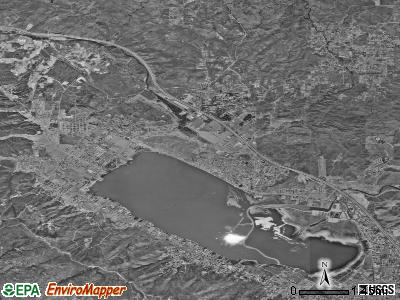
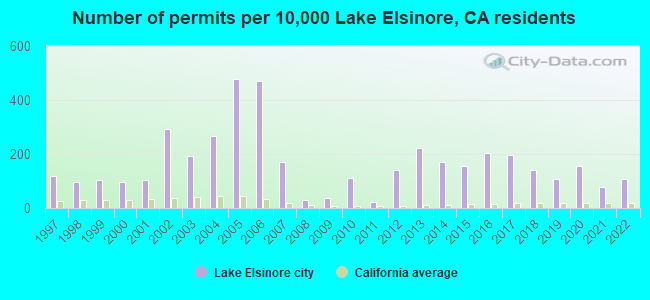
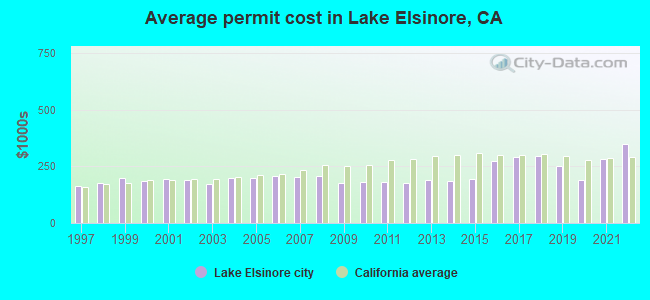
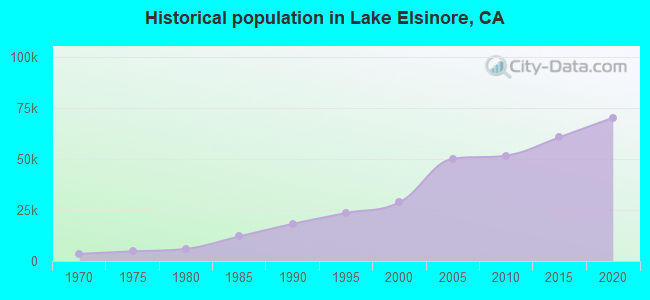
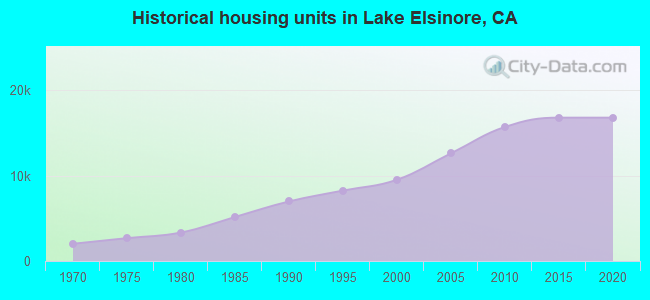
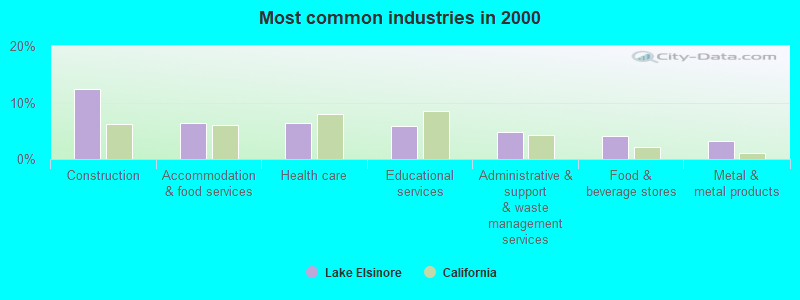
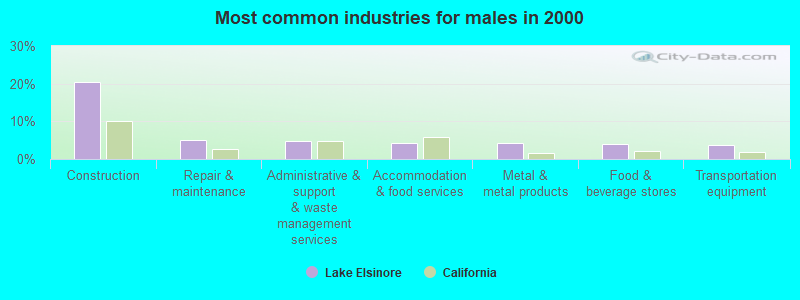
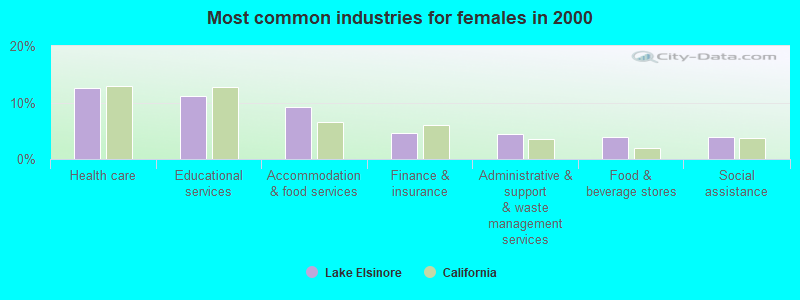
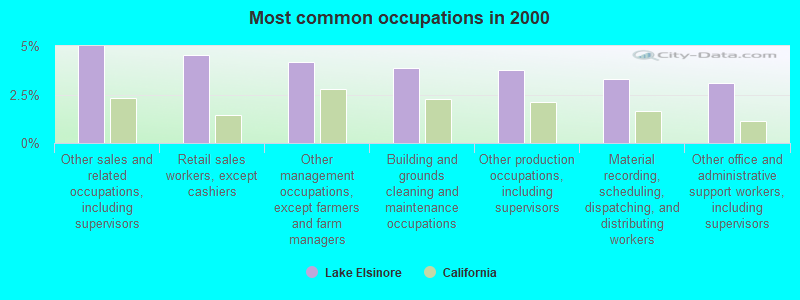
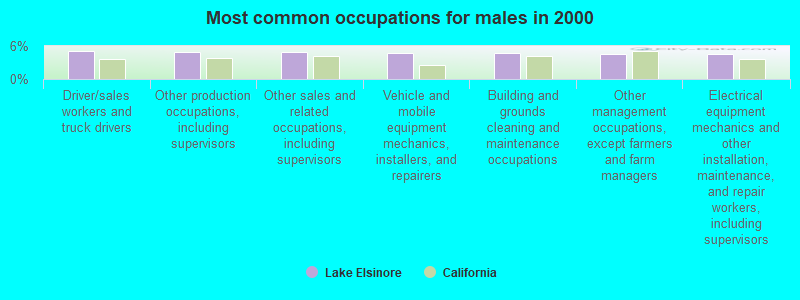
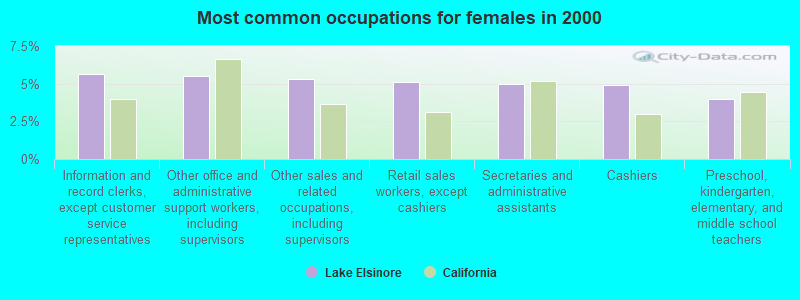
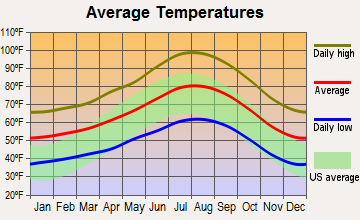
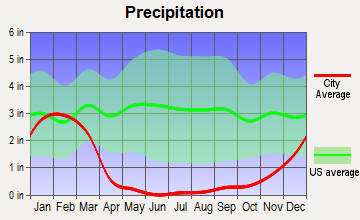
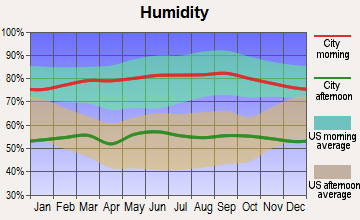
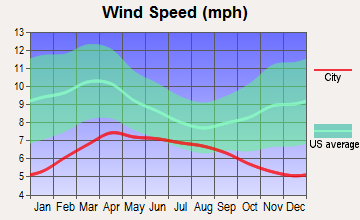
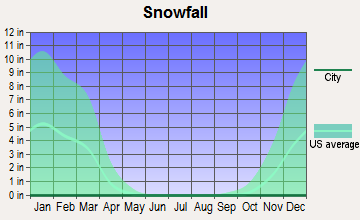
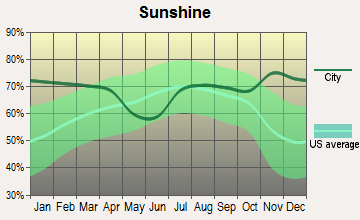
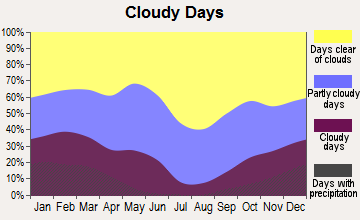
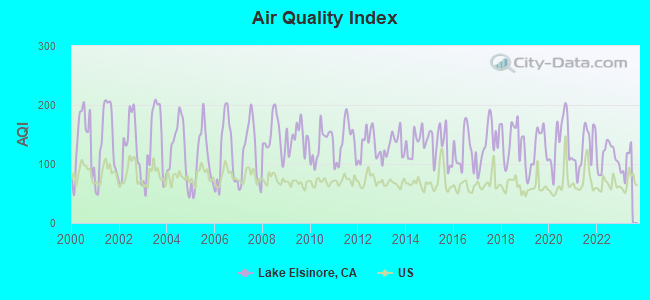
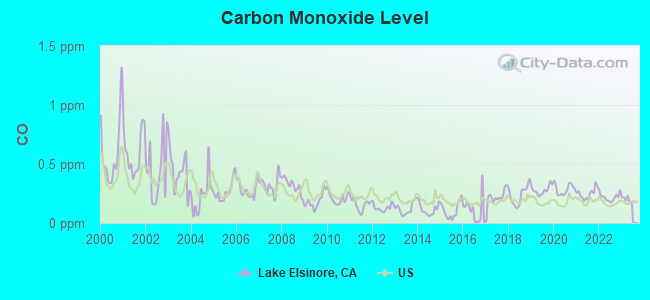
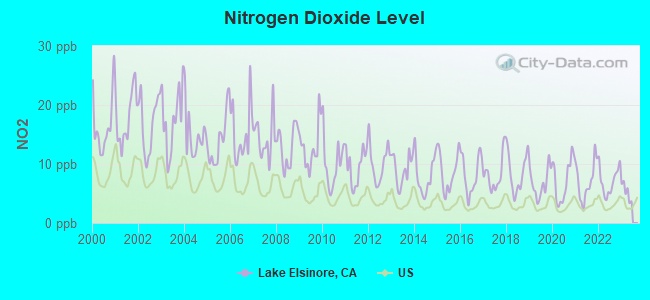
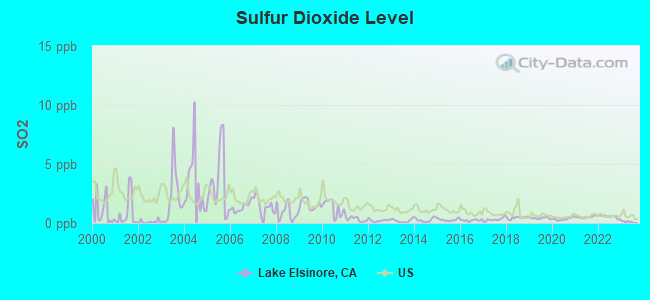
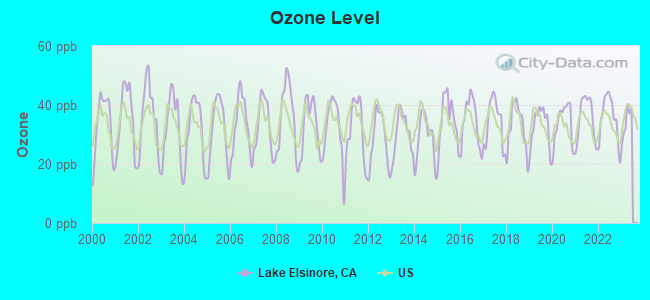
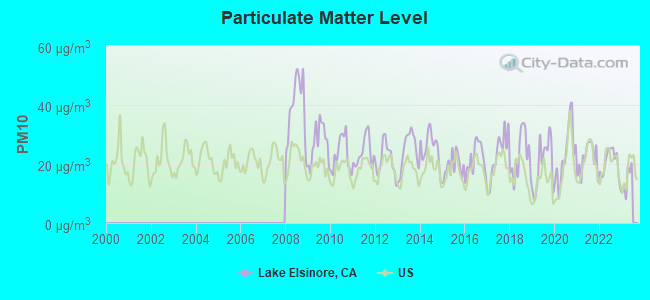
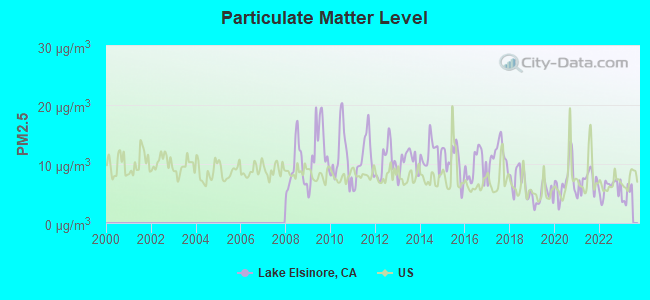
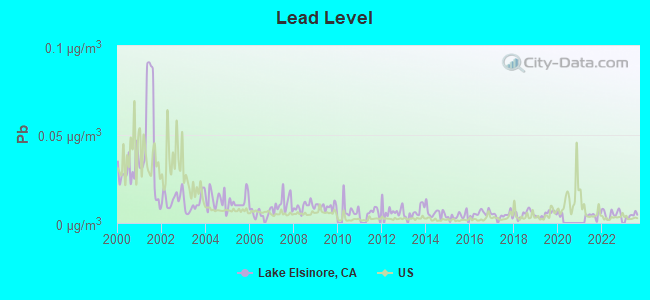
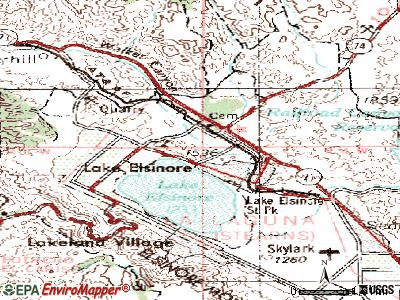
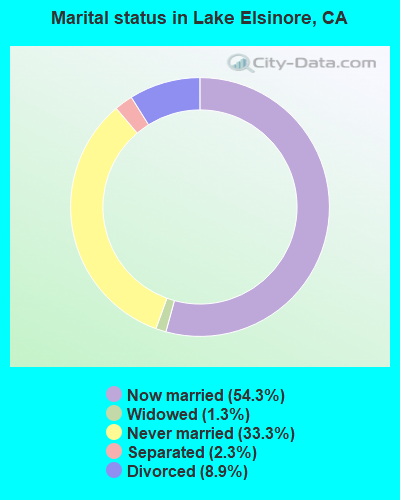
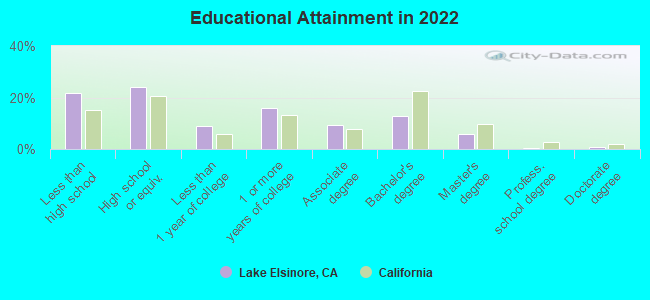
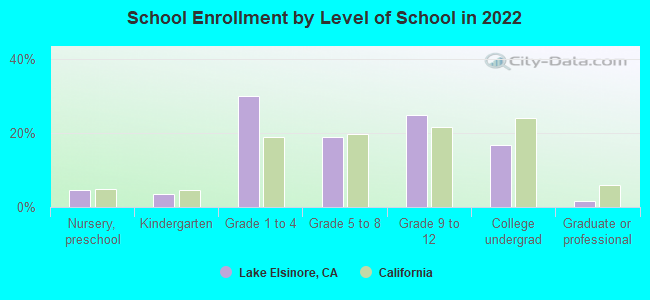
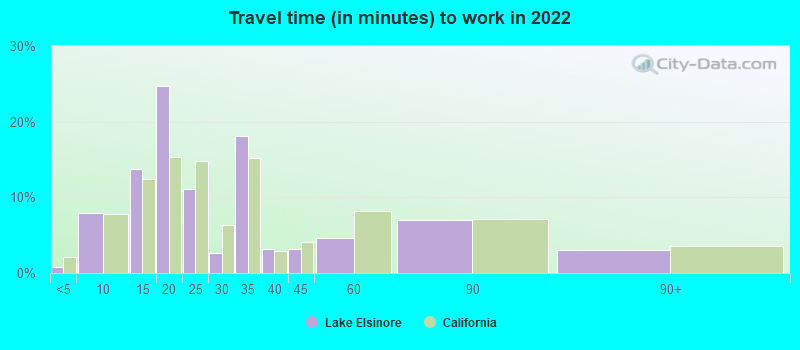
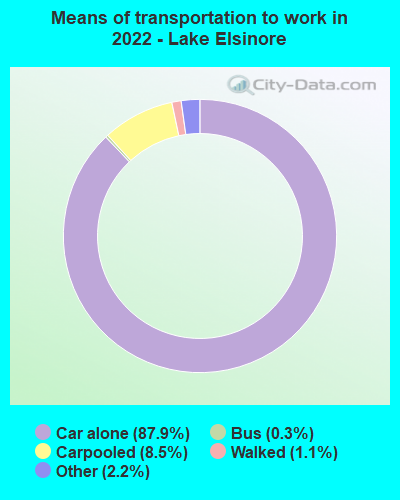


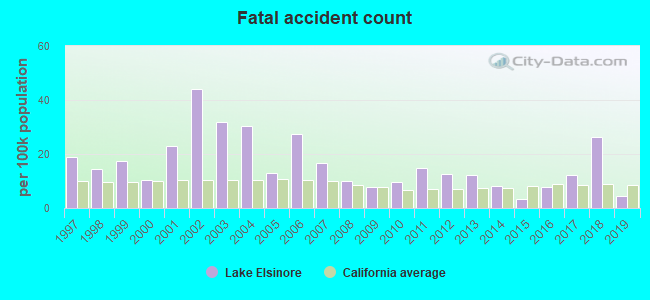
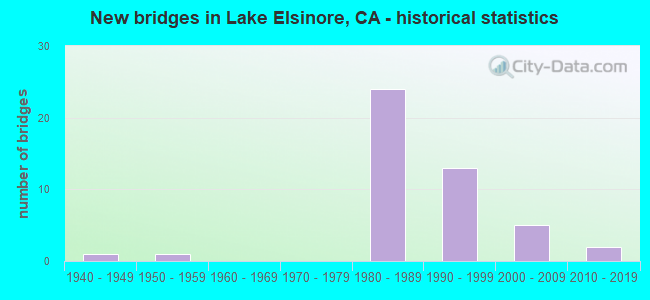
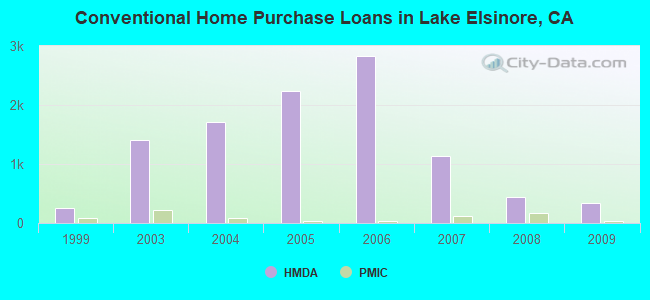
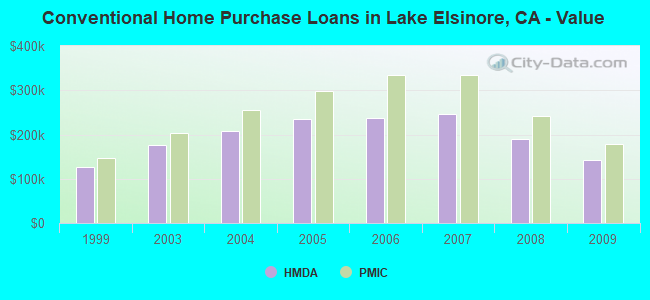
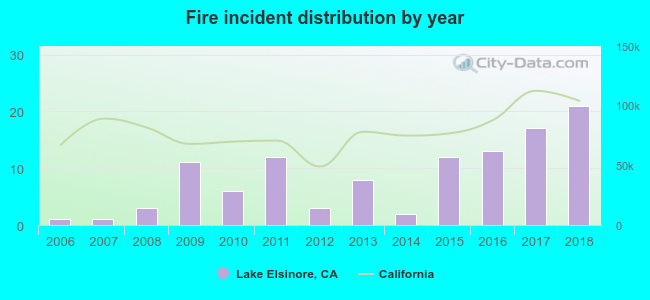 Based on the data from the years 2006 - 2018 the average number of fire incidents per year is 8. The highest number of reported fire incidents - 21 took place in 2018, and the least - 1 in 2006. The data has a growing trend.
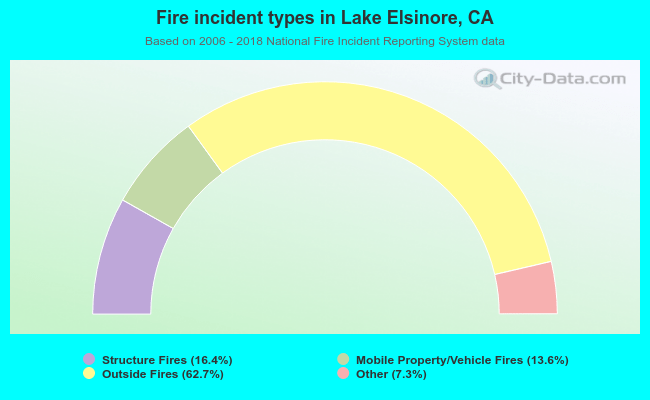 When looking into fire subcategories, the most reports belonged to: Outside Fires (62.7%), and Structure Fires (16.4%).