Estimated zip code population in 2022: 37,744 Zip code population in 2010: 37,296 Zip code population in 2000: 38,869
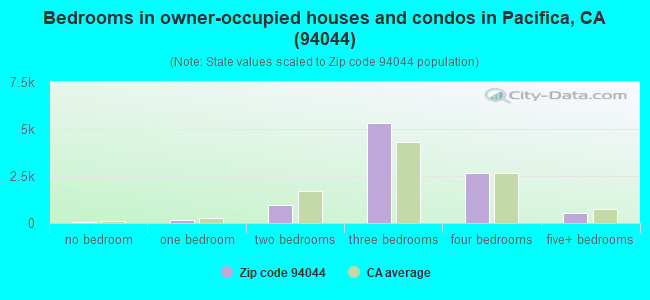
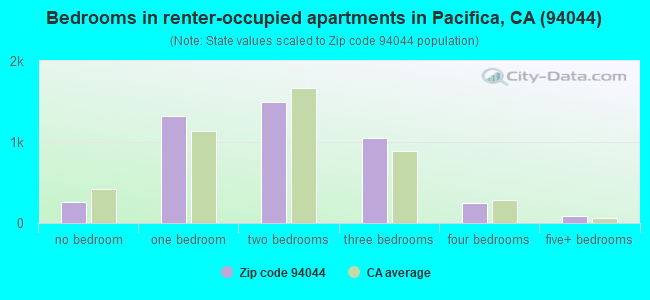
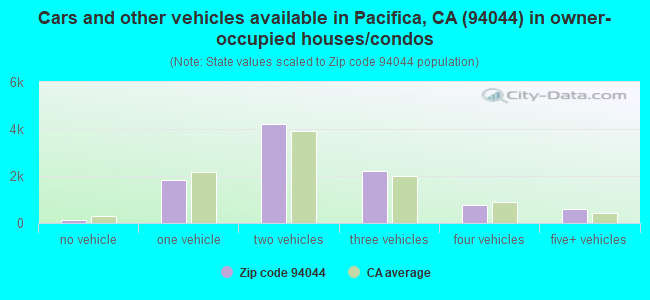
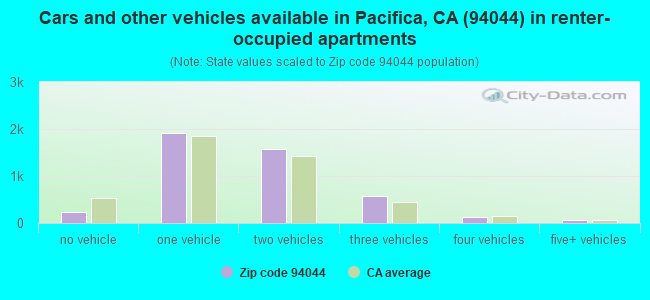
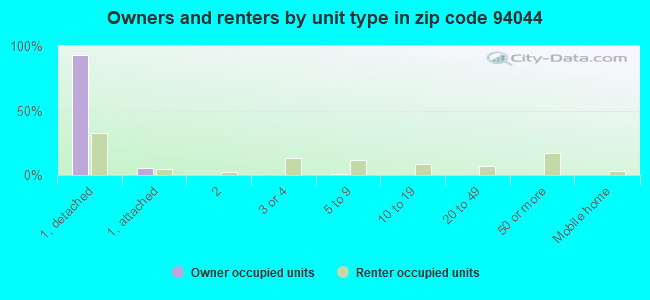
Houses and condos: 14,586 Renter-occupied apartments: 4,466
% of renters here:
31%
State:
44%
March 2022 cost of living index in zip code 94044: 130.4 (high, U.S. average is 100)
Land area: 14.7 sq. mi. Water area: 0.0 sq. mi.
Population density: 2,572 people per square mile
(average).
OSM Map
General Map
Google Map
MSN Map
OSM Map
General Map
Google Map
MSN Map
OSM Map
General Map
Google Map
MSN Map
OSM Map
General Map
Google Map
MSN Map
Please wait while loading the map...
Real estate property taxes paid for housing units in 2022:
This zip code:
0.6% ($7,132)
California:
0.7% ($4,831)
Median real estate property taxes paid for housing units with mortgages in 2022: $8,417 (0.6%) Median real estate property taxes paid for housing units with no mortgage in 2022: $4,304 (0.3%)
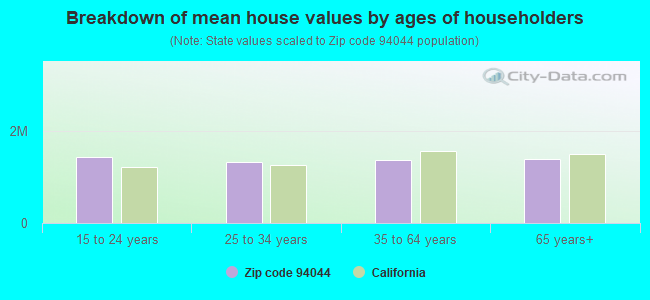
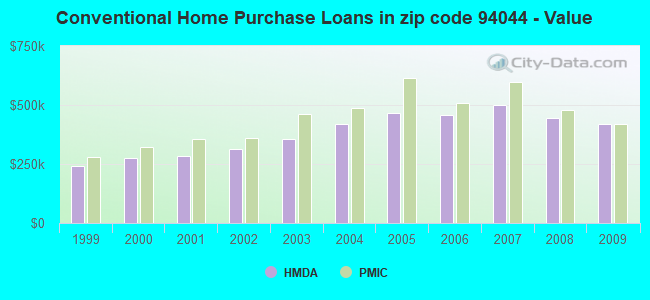
Estimated median house/condo value in 2022: $1,289,988
94044:
$1,289,988
California:
$715,900
According to our research of California and other state lists, there were 22 registered sex offenders living in 94044 zip code as of April 26, 2024. The ratio of all residents to sex offenders in zip code 94044 is 1,791 to 1. The ratio of registered sex offenders to all residents in this zip code is lower than the state average.
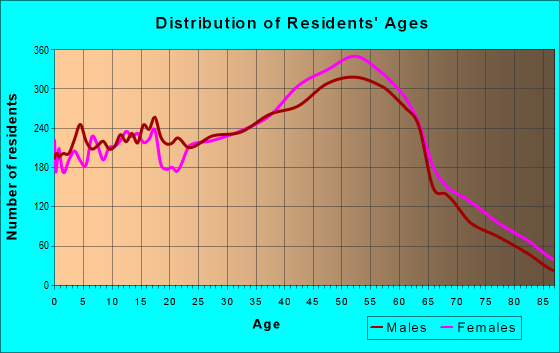
Median resident age:
This zip code:
43.8 years
California median age:
37.9 years
Average household size:
This zip code:
2.6 people
California:
2.8 people
Averages for the 2020 tax year for zip code 94044, filed in 2021:
Average Adjusted Gross Income (AGI) in 2020: $125,522 (Individual Income Tax Returns)
Here:
$125,522
State:
$95,910
Salary/wage: $116,434 (reported on 79.1% of returns)
Here:
$116,434
State:
$77,331
(% of AGI for various income ranges: 1195.8% for AGIs below $25k, 3748.5% for AGIs $25k-50k, 7227.2% for AGIs $50k-75k, 10426.8% for AGIs $75k-100k, 20995.2% for AGIs $100k-200k, 104861.5% for AGIs over 200k)
Taxable interest for individuals: $1,328 (reported on 48.2% of returns)
This zip code:
$1,328
California:
$2,294
(% of AGI for various income ranges: 35.2% for AGIs below $25k, 40.8% for AGIs $25k-50k, 71.3% for AGIs $50k-75k, 86.3% for AGIs $75k-100k, 148.0% for AGIs $100k-200k, 579.2% for AGIs over 200k)
Ordinary dividends: $5,233 (reported on 33.2% of returns)
Here:
$5,233
State:
$10,949
(% of AGI for various income ranges: 59.7% for AGIs below $25k, 82.9% for AGIs $25k-50k, 140.1% for AGIs $50k-75k, 191.0% for AGIs $75k-100k, 397.5% for AGIs $100k-200k, 1871.0% for AGIs over 200k)
Net capital gain/loss in AGI: +$26,471 (reported on 30.7% of returns)
Here:
+$26,471
State:
+$49,306
(% of AGI for various income ranges: 24.5% for AGIs below $25k, 94.1% for AGIs $25k-50k, 131.0% for AGIs $50k-75k, 216.0% for AGIs $75k-100k, 570.0% for AGIs $100k-200k, 14978.4% for AGIs over 200k)
Profit/loss from business: +$18,459 (reported on 16.7% of returns)
Here:
+$18,459
State:
+$15,671
(% of AGI for various income ranges: 183.2% for AGIs below $25k, 265.6% for AGIs $25k-50k, 337.5% for AGIs $50k-75k, 341.4% for AGIs $75k-100k, 758.0% for AGIs $100k-200k, 2613.7% for AGIs over 200k)
Taxable individual retirement arrangement distribution: $19,423 (reported on 9.9% of returns)
94044:
$19,423
California:
$23,505
(% of AGI for various income ranges: 87.5% for AGIs below $25k, 148.9% for AGIs $25k-50k, 248.7% for AGIs $50k-75k, 328.1% for AGIs $75k-100k, 635.9% for AGIs $100k-200k, 1093.4% for AGIs over 200k)
Self-employed (Keogh) retirement plans: $21,785 (reported on 1.4% of returns)
94044:
$21,785
California:
$30,163
(% of AGI for various income ranges: 8.4% for AGIs below $25k, 25.3% for AGIs $50k-75k, 58.0% for AGIs $100k-200k, 421.4% for AGIs over 200k)
Total itemized deductions: $33,801 (reported on 25.2% of returns)
Here:
$33,801
State:
$39,517
(% of AGI for various income ranges: 223.6% for AGIs below $25k, 378.2% for AGIs $25k-50k, 672.1% for AGIs $50k-75k, 1159.4% for AGIs $75k-100k, 2355.5% for AGIs $100k-200k, 8029.7% for AGIs over 200k)
Charity contributions: $5,831 (reported on 19.5% of returns)
Here:
$5,831
State:
$12,598
(% of AGI for various income ranges: 8.9% for AGIs below $25k, 24.5% for AGIs $25k-50k, 61.7% for AGIs $50k-75k, 91.4% for AGIs $75k-100k, 241.2% for AGIs $100k-200k, 1495.2% for AGIs over 200k)
Taxes paid: $9,272 (reported on 25.1% of returns)
94044:
$9,272
State:
$8,807
(% of AGI for various income ranges: 46.8% for AGIs below $25k, 89.0% for AGIs $25k-50k, 176.0% for AGIs $50k-75k, 364.6% for AGIs $75k-100k, 718.5% for AGIs $100k-200k, 2024.1% for AGIs over 200k)
Earned income credit: $1,414 (reported on 5.2% of returns)
Here:
$1,414
State:
$2,074
(% of AGI for various income ranges: 42.2% for AGIs below $25k, 28.8% for AGIs $25k-50k)
Percentage of individuals using paid preparers for their 2020 taxes: 91.5%
Here:
92%
State:
92%
(% for various income ranges: 87.5% for AGIs below $25k, 91.4% for AGIs $25k-50k, 91.9% for AGIs $50k-75k, 92.2% for AGIs $75k-100k, 92.1% for AGIs $100k-200k, 94.8% for AGIs over 200k)
Averages for the 2012 tax year for zip code 94044, filed in 2013:
Average Adjusted Gross Income (AGI) in 2012: $80,496 (Individual Income Tax Returns)
Here:
$80,496
State:
$72,726
Salary/wage: $75,708 (reported on 83.0% of returns)
Here:
$75,708
State:
$59,079
(% of AGI for various income ranges: 69.6% for AGIs below $25k, 74.8% for AGIs $25k-50k, 74.9% for AGIs $50k-75k, 75.9% for AGIs $75k-100k, 81.1% for AGIs $100k-200k, 78.3% for AGIs over 200k)
Taxable interest for individuals: $876 (reported on 46.4% of returns)
This zip code:
$876
California:
$2,146
(% of AGI for various income ranges: 1.4% for AGIs below $25k, 0.7% for AGIs $25k-50k, 0.7% for AGIs $50k-75k, 0.6% for AGIs $75k-100k, 0.4% for AGIs $100k-200k, 0.4% for AGIs over 200k)
Ordinary dividends: $3,457 (reported on 26.1% of returns)
Here:
$3,457
State:
$9,308
(% of AGI for various income ranges: 2.0% for AGIs below $25k, 1.4% for AGIs $25k-50k, 1.1% for AGIs $50k-75k, 1.1% for AGIs $75k-100k, 0.9% for AGIs $100k-200k, 1.3% for AGIs over 200k)
Net capital gain/loss in AGI: +$7,404 (reported on 21.4% of returns)
Here:
+$7,404
State:
+$30,460
(% of AGI for various income ranges: 0.3% for AGIs $50k-75k, 0.5% for AGIs $75k-100k, 0.8% for AGIs $100k-200k, 6.0% for AGIs over 200k)
Profit/loss from business: +$19,900 (reported on 16.6% of returns)
Here:
+$19,900
State:
+$17,064
(% of AGI for various income ranges: 10.1% for AGIs below $25k, 6.0% for AGIs $25k-50k, 3.8% for AGIs $50k-75k, 3.8% for AGIs $75k-100k, 3.8% for AGIs $100k-200k, 3.3% for AGIs over 200k)
Taxable individual retirement arrangement distribution: $15,876 (reported on 9.7% of returns)
94044:
$15,876
California:
$19,557
(% of AGI for various income ranges: 3.4% for AGIs below $25k, 2.3% for AGIs $25k-50k, 2.5% for AGIs $50k-75k, 2.1% for AGIs $75k-100k, 1.7% for AGIs $100k-200k, 1.6% for AGIs over 200k)
Self-employment retirement plans: $15,293 (reported on 1.4% of returns)
94044:
$15,293
California:
$24,530
(% of AGI for various income ranges: 0.2% for AGIs $25k-50k, 0.2% for AGIs $50k-75k, 0.1% for AGIs $75k-100k, 0.2% for AGIs $100k-200k, 0.5% for AGIs over 200k)
Total itemized deductions: $30,112 (24% of AGI, reported on 47.1% of returns)
Here:
$30,112
State:
$34,004
Here:
23.5% of AGI
State:
22.7% of AGI
(% of AGI for various income ranges: 15.7% for AGIs below $25k, 12.4% for AGIs $25k-50k, 15.2% for AGIs $50k-75k, 17.8% for AGIs $75k-100k, 19.9% for AGIs $100k-200k, 17.3% for AGIs over 200k)
Charity contributions: $2,531 (reported on 39.1% of returns)
Here:
$2,531
State:
$4,659
(% of AGI for various income ranges: 0.7% for AGIs below $25k, 0.9% for AGIs $25k-50k, 1.2% for AGIs $50k-75k, 1.3% for AGIs $75k-100k, 1.4% for AGIs $100k-200k, 1.2% for AGIs over 200k)
Taxes paid: $12,541 (reported on 47.0% of returns)
94044:
$12,541
State:
$14,448
(% of AGI for various income ranges: 3.4% for AGIs below $25k, 2.9% for AGIs $25k-50k, 4.7% for AGIs $50k-75k, 6.6% for AGIs $75k-100k, 8.3% for AGIs $100k-200k, 9.5% for AGIs over 200k)
Earned income credit: $1,485 (reported on 7.0% of returns)
Here:
$1,485
State:
$2,286
(% of AGI for various income ranges: 2.4% for AGIs below $25k, 0.4% for AGIs $25k-50k)
Percentage of individuals using paid preparers for their 2012 taxes: 55.0%
Here:
55%
State:
64%
(% for various income ranges: 47.1% for AGIs below $25k, 50.8% for AGIs $25k-50k, 55.6% for AGIs $50k-75k, 60.4% for AGIs $75k-100k, 61.8% for AGIs $100k-200k, 64.6% for AGIs over 200k)
Averages for the 2004 tax year for zip code 94044, filed in 2005:
Average Adjusted Gross Income (AGI) in 2004: $63,408 (Individual Income Tax Returns)
Here:
$63,408
State:
$58,600
Salary/wage: $60,450 (reported on 84.1% of returns)
Here:
$60,450
State:
$49,455
(% of AGI for various income ranges: 143.7% for AGIs below $10k, 68.8% for AGIs $10k-25k, 79.2% for AGIs $25k-50k, 80.7% for AGIs $50k-75k, 84.6% for AGIs $75k-100k, 79.0% for AGIs over 100k)
Taxable interest for individuals: $1,153 (reported on 55.8% of returns)
This zip code:
$1,153
California:
$2,365
(% of AGI for various income ranges: 9.4% for AGIs below $10k, 2.3% for AGIs $10k-25k, 1.2% for AGIs $25k-50k, 1.1% for AGIs $50k-75k, 0.8% for AGIs $75k-100k, 0.8% for AGIs over 100k)
Taxable dividends: $2,015 (reported on 29.5% of returns)
Here:
$2,015
State:
$4,746
(% of AGI for various income ranges: 6.1% for AGIs below $10k, 1.6% for AGIs $10k-25k, 1.0% for AGIs $25k-50k, 0.9% for AGIs $50k-75k, 0.8% for AGIs $75k-100k, 0.9% for AGIs over 100k)
Net capital gain/loss: +$8,573 (reported on 23.8% of returns)
Here:
+$8,573
State:
+$23,418
(% of AGI for various income ranges: -3.5% for AGIs below $10k, -0.2% for AGIs $10k-25k, 0.3% for AGIs $25k-50k, 0.4% for AGIs $50k-75k, 0.7% for AGIs $75k-100k, 6.2% for AGIs over 100k)
Profit/loss from business: +$17,564 (reported on 16.7% of returns)
Here:
+$17,564
State:
+$16,826
(% of AGI for various income ranges: -2.9% for AGIs below $10k, 7.7% for AGIs $10k-25k, 5.3% for AGIs $25k-50k, 4.5% for AGIs $50k-75k, 3.9% for AGIs $75k-100k, 4.6% for AGIs over 100k)
IRA payment deduction: $3,148 (reported on 3.1% of returns)
94044:
$3,148
California:
$3,192
(% of AGI for various income ranges: 0.5% for AGIs below $10k, 0.2% for AGIs $10k-25k, 0.3% for AGIs $25k-50k, 0.2% for AGIs $50k-75k, 0.2% for AGIs $75k-100k, 0.1% for AGIs over 100k)
Self-employed pension: $11,785 (reported on 1.7% of returns)
Here:
$11,785
California:
$17,688
(% of AGI for various income ranges: 0.2% for AGIs $25k-50k, 0.2% for AGIs $50k-75k, 0.2% for AGIs $75k-100k, 0.5% for AGIs over 100k)
Total itemized deductions: $25,956 (26% of AGI, reported on 47.9% of returns)
Here:
$25,956
State:
$28,113
Here:
26.1% of AGI
State:
25.3% of AGI
(% of AGI for various income ranges: 39.9% for AGIs below $10k, 16.1% for AGIs $10k-25k, 14.9% for AGIs $25k-50k, 19.9% for AGIs $50k-75k, 22.9% for AGIs $75k-100k, 19.8% for AGIs over 100k)
Charity contributions deductions: $2,350 (2% of AGI, reported on 42.9% of returns)
Here:
$2,350
State:
$3,923
Here:
2.3% of AGI
State:
3.3% of AGI
(% of AGI for various income ranges: 1.5% for AGIs below $10k, 1.1% for AGIs $10k-25k, 1.2% for AGIs $25k-50k, 1.7% for AGIs $50k-75k, 1.8% for AGIs $75k-100k, 1.7% for AGIs over 100k)
Total tax: $9,499 (reported on 85.7% of returns)
94044:
$9,499
State:
$10,761
(% of AGI for various income ranges: 6.1% for AGIs below $10k, 5.5% for AGIs $10k-25k, 8.5% for AGIs $25k-50k, 10.1% for AGIs $50k-75k, 10.4% for AGIs $75k-100k, 16.5% for AGIs over 100k)
Earned income credit: $1,187 (reported on 6.1% of returns)
Here:
$1,187
State:
$1,763
Percentage of individuals using paid preparers for their 2004 taxes: 59.1%
Here:
59%
State:
66%
(% for various income ranges: 48.7% for AGIs below $10k, 56.8% for AGIs $10k-25k, 56.2% for AGIs $25k-50k, 63.7% for AGIs $50k-75k, 64.3% for AGIs $75k-100k, 64.8% for AGIs over 100k)
Likely homosexual households (counted as self-reported same-sex unmarried-partner households)
Lesbian couples: 0.2% of all households
Gay men: 0.1% of all households
Household received Food Stamps/SNAP in the past 12 months: 501 Household did not receive Food Stamps/SNAP in the past 12 months: 13,416
Women who had a birth in the past 12 months: 272 (250 now married, 20 unmarried) Women who did not have a birth in the past 12 months: 8,016 (3,769 now married, 4,223 unmarried)
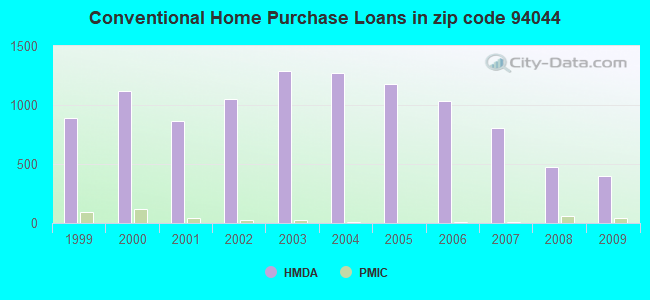
Housing units in zip code 94044 with a mortgage: 6,670 (940 second mortgage, 39 home equity loan, 753 both second mortgage and home equity loan) Houses without a mortgage: 177
Median monthly owner costs for units with a mortgage: $3,514 Median monthly owner costs for units without a mortgage: $812
Residents with income below the poverty level in 2022:
This zip code:
5.6%
Whole state:
12.2%
Residents with income below 50% of the poverty level in 2022:
This zip code:
2.5%
Whole state:
6.2%
Median number of rooms in houses and condos:
Here:
6.1
State:
6.0
Median number of rooms in apartments:
Here:
3.9
State:
3.9
Notable locations in this zip code not listed on our city pages
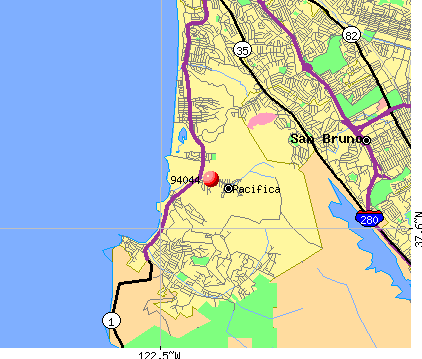
Notable locations in zip code 94044: Sanchez Adobe (A), Walnut Grove Group Picnic Area (B), Trout Farm Picnic Area (C), Sharp Park Golf Course (D), Sanchez Branch San Mateo County Library (E), Sanchez Adobe Museum (F), Pacifica Branch San Mateo County Library (G), Mildred Owen Concert Hall (H), North County Fire Authority Station 71 (I), North County Fire Authority Station 72 (J). Display/hide their locations on the map
Shopping Centers: Vallemar Shopping Center (1), Rockaway Beach Shopping Center (2), Pedro Point Shopping Center (3), Park Pacifica Shopping Center (4), Linda Mar Shopping Center (5), Crespi Shopping Center (6), Adobe Plaza Shopping Center (7), Fairmont Shopping Center (8), Palmetto Avenue Shopping Center (9). Display/hide their locations on the map
Churches in zip code 94044 include: Church of the Good Shepherd (A), Filipino Seventh Day Adventist Church (B), Genesis Worship Center (C), Pacifica Baptist Church (D), Westside Baptist Church (E), Bethany Baptist Church (F), Church of Christ (G), Holy Cross Lutheran Church (H), Lighthouse Christian Fellowship Church (I). Display/hide their locations on the map
Parks in zip code 94044 include: Sharp Park Beach (1), Portola Expedition Historical Marker (2), Sharp Park (3), San Pedro Valley County Park (4), Milagra Ridge County Park (5), Pomo Park (6), Fairmont Park (7), Imperial Park (8), Calera Creek Park (9). Display/hide their locations on the map
4,871 married couples with children.
1,037 single-parent households (371 men, 666 women).
72.6% of residents of 94044 zip code speak English at home.
8.2% of residents speak Spanish at home (71% very well, 25% well, 2% not well, 2% not at all).
4.2% of residents speak other Indo-European language at home (75% very well, 22% well, 2% not well, 1% not at all).
13.9% of residents speak Asian or Pacific Island language at home (63% very well, 24% well, 7% not well, 6% not at all).
1.2% of residents speak other language at home (99% very well, 1% well).
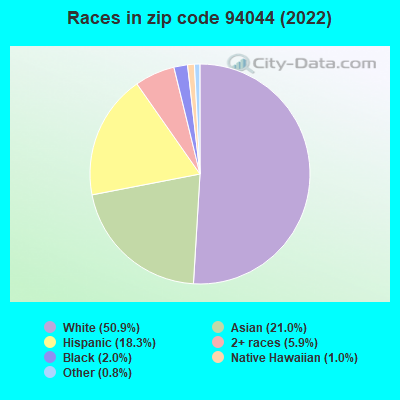
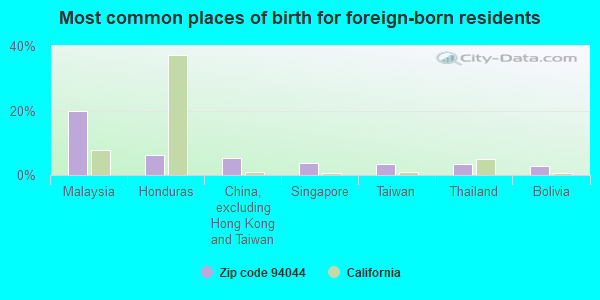
Foreign born population: 8,354 (22.1%) (77.6% of them are naturalized citizens)
This zip code:
22.1%
Whole state:
26.7%
20%Malaysia
6%Honduras
5%China, excluding Hong Kong and Taiwan
4%Singapore
3%Taiwan
3%Thailand
3%Bolivia
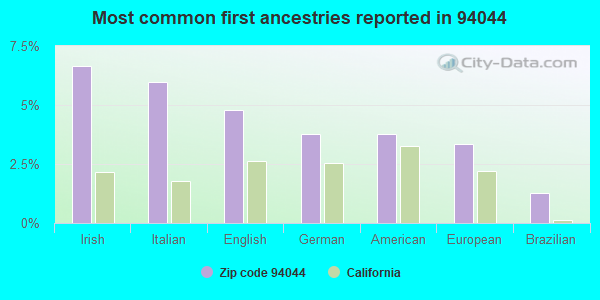
7%Irish
6%Italian
5%English
4%German
4%American
3%European
1%Brazilian
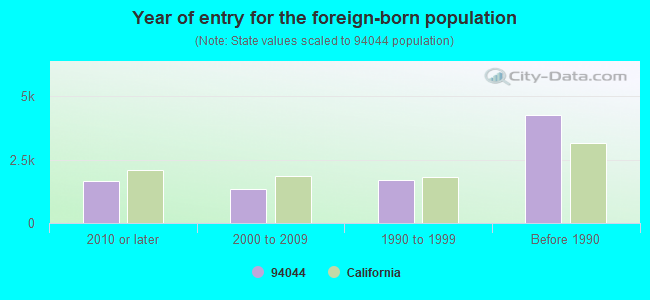
Year of entry for the foreign-born population
1,6482010 or later
1,3362000 to 2009
1,6841990 to 1999
4,264Before 1990
Major facilities with environmental interests located in this zip code:
HACKS AUTO BODY INCORPORATED (118 MONTEREY DRIVE in PACIFICA, CA)
STATE MASTER (California - Hazardous Waste Tracking) - HAZARDOU WASTE PROGRAM CRITERIA AND HAZARDOUS AIR POLLUTANT INVENTORY (Inventory of air pollution sources) (Resource Conservation and Recovery Act (tracking hazardous waste)) Business SIC classification: TOP, BODY, AND UPHOLSTERY REPAIR SHOPS AND PAINT SHOPS Organizations: FRANK KIRBY (CONTACT/OWNER)
EUREKA CLEANERS (160 EUREKA SQUARE in PACIFICA, CA)
STATE MASTER (California - Hazardous Waste Tracking) - HAZARDOU WASTE PROGRAM CRITERIA AND HAZARDOUS AIR POLLUTANT INVENTORY (Inventory of air pollution sources) Small Quantity Generators, between 100 kg and 1000 kg of hazardous waste/month (Resource Conservation and Recovery Act (tracking hazardous waste)) Business SIC classification: DRYCLEANING PLANTS, EXCEPT RUG CLEANING
INGRID B. LACY MIDDLE SCHOOL (1427 PALMETTO AVE in PACIFICA, CA)
(National Center for Education Statistics) - STATE ID-4130126 Organizations: LAGUNA SALADA UNION ELEMENTARY (SCHOOL DISTRICT)
LINDA MAR ELEMENTARY (830 ROSITA ROAD in PACIFICA, CA)
(National Center for Education Statistics) - STATE ID-6043962 Organizations: LAGUNA SALADA UNION ELEMENTARY (SCHOOL DISTRICT)
CABRILLO ELEMENTARY (601 CRESPI DR. in PACIFICA, CA)
(National Center for Education Statistics) - STATE ID-6043939 Organizations: LAGUNA SALADA UNION ELEMENTARY (SCHOOL DISTRICT)
FAIRMONT CLEANERS (773 HICKEY BOULEVARD in PACIFICA, CA)
CRITERIA AND HAZARDOUS AIR POLLUTANT INVENTORY (Inventory of air pollution sources) Small Quantity Generators, between 100 kg and 1000 kg of hazardous waste/month (Resource Conservation and Recovery Act (tracking hazardous waste)) - notification Business SIC classification: DRYCLEANING PLANTS, EXCEPT RUG CLEANING Organizations: DOUG SHINN (CONTACT/OWNER)
JOE'S AUTOBODY (2085 COAST HIGHWAY in PACIFICA, CA)
CRITERIA AND HAZARDOUS AIR POLLUTANT INVENTORY (Inventory of air pollution sources) Small Quantity Generators, between 100 kg and 1000 kg of hazardous waste/month (Resource Conservation and Recovery Act (tracking hazardous waste)) Business SIC classification: TOP, BODY, AND UPHOLSTERY REPAIR SHOPS AND PAINT SHOPS Organizations: MARIAN THOREIN (CONTACT/OWNER)
Alternative names: JOES AUTO BODY
C AND M NURSERY (1204 LINDA MAR BLVD in PACIFICA, CA)
Large Quantity Generators, more that 1000 kg of hazardous waste/month (Resource Conservation and Recovery Act (tracking hazardous waste)) - notification Organizations: RONALD AND STEVEN OMORI (CONTACT/OWNER)
C C S F SHARP PARK RIFLE RANGE (1 MI E HWY 1 AT SHARP PARK RD in PACIFICA, CA)
(Resource Conservation and Recovery Act (tracking hazardous waste)) Organizations: SAN FRANCISCO CITY AND COUNTY (CONTACT/OWNER)
CALTRANS DIST 4 (RTE 35 AT P M 27.4 in PACIFICA, CA)
Large Quantity Generators, more that 1000 kg of hazardous waste/month (Resource Conservation and Recovery Act (tracking hazardous waste)) - notification
ALS MOBIL SVC (610 CRESPI DR in PACIFICA, CA)
Small Quantity Generators, between 100 kg and 1000 kg of hazardous waste/month (Resource Conservation and Recovery Act (tracking hazardous waste)) Organizations: ALLEN STEINMETZ (CONTACT/OWNER)
ED CORDERO CHEVROLET (555 OCEANA BLVD in PACIFICA, CA)
Small Quantity Generators, between 100 kg and 1000 kg of hazardous waste/month (Resource Conservation and Recovery Act (tracking hazardous waste))
FAIRMONT ONE HOUR PHOTO (777 HICKEY BLVD in PACIFICA, CA)
Small Quantity Generators, between 100 kg and 1000 kg of hazardous waste/month (Resource Conservation and Recovery Act (tracking hazardous waste)) - notification Organizations: PARTNERSHIP RAUL MARTINEZ (CONTACT/OWNER)
Housing units lacking complete plumbing facilities: 0.2% Housing units lacking complete kitchen facilities: 0.4%
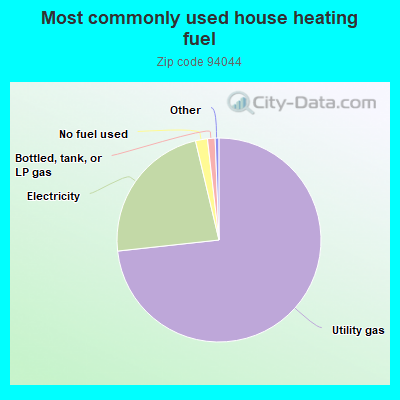
73.2%Utility gas
23.0%Electricity
1.9%No fuel used
1.2%Bottled, tank, or LP gas
Population in 1990: 37,596. Population change in the 1990s: +1,273 (+3.4%).
Place of birth for U.S.-born residents:
This state: 22,124
Northeast: 1,818
Midwest: 2,026
South: 1,551
West: 1,137
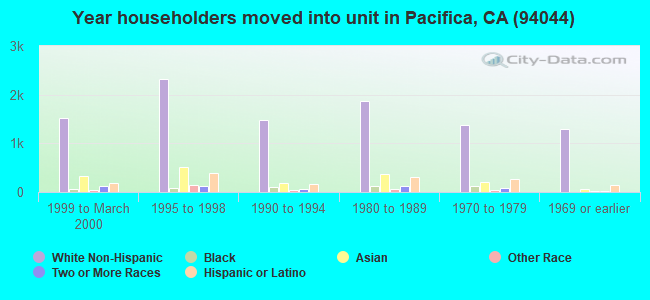
64% of the 94044 zip code residents lived in the same house 5 years ago. Out of people who lived in different houses, 49% lived in this county. Out of people who lived in different counties, 50% lived in California.
93% of the 94044 zip code residents lived in the same house 1 year ago. Out of people who lived in different houses, 50% moved from this county. Out of people who lived in different houses, 41% moved from different county within same state. Out of people who lived in different houses, 10% moved from different state. Out of people who lived in different houses, 1% moved from abroad.
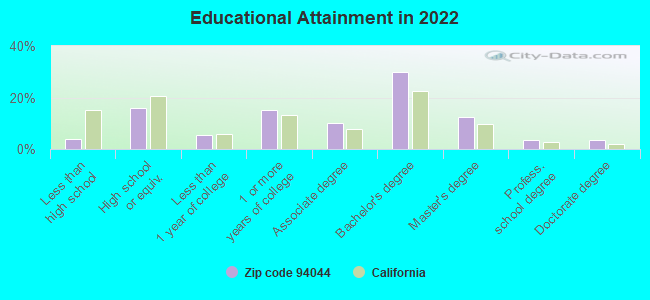
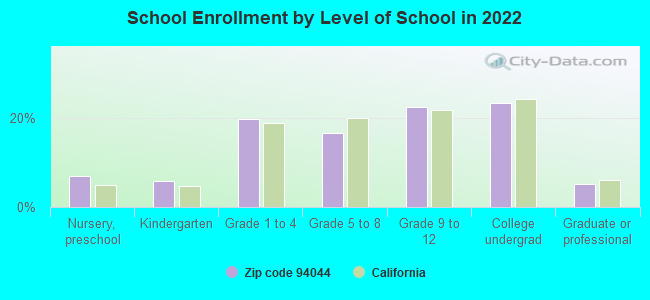
Private vs. public school enrollment:
Students in private schools in grades 1 to 8 (elementary and middle school): 600
Here:
19.9%
California:
10.5%
Students in private schools in grades 9 to 12 (high school): 246
Here:
13.4%
California:
8.5%
Students in private undergraduate colleges: 317
Here:
16.5%
California:
15.9%
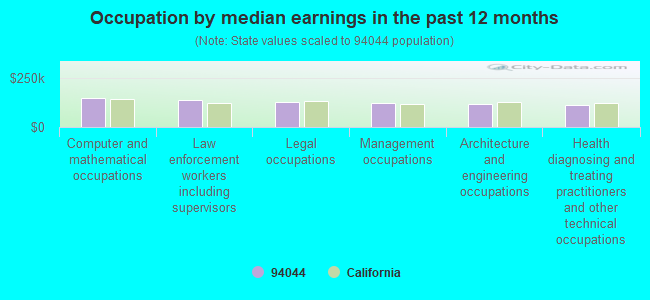
Occupation by median earnings in the past 12 months ($)
150,344Computer and mathematical occupations
140,065Law enforcement workers including supervisors
128,763Legal occupations
121,169Management occupations
118,468Architecture and engineering occupations
112,265Health diagnosing and treating practitioners and other technical occupations
Companies with federal contracts located in this zip code:
REDWOOD SCIENTIFIC, INC (1005 TERRA NOVA BLVD in PACIFICA, CA; small business) : $1,394,249 in 7 contractsfrom 2001 to 2004
Contracts for Defense Missile and Space Systems -- Advanced Development (R&D), Defense Electronics and Communication Equipment -- Operational Systems Development (R&D), Weapons -- Basic Research (R&D), Aeronautics and Space Technology -- Basic Research (R&D) by Army, Air Force, NASA Signed by year:2000: $0; 2001: $70,000; 2002: $99,275; 2003: $517,391; 2004: $707,583; 2005: $0; 2006: $0.
Biggest contracts:
$397,393 with Army for Defense Missile and Space Systems -- Advanced Development (R&D). Signed on 2003-11-21. Completion date: 2005-11-21.
$374,991 with Air Force for Defense Electronics and Communication Equipment -- Operational Systems Development (R&D). Signed on 2004-09-27. Completion date: 2005-09-16.
$332,592 with Army for Defense Missile and Space Systems -- Advanced Development (R&D). Signed on 2004-11-26. Completion date: 2005-11-21.
$99,275 with Air Force for Weapons -- Basic Research (R&D). Signed on 2002-05-24. Completion date: 2003-05-02.
LINGUASTAT INC (784 EDGEMAR AVE in PACIFICA, CA; small business)
$98,660 with Air Force for Other Defense -- Applied Research and Exploratory Development (R&D). Signed on 2006-04-14. Completion date: 2007-01-15.
J C PHELAN COMPANY (704 CINDY WAY in PACIFICA, CA; small business)
$6,800 with Army for Other Non-Building Structures. Taking place in VA. Signed on 2003-05-02. Completion date: 2003-07-21.
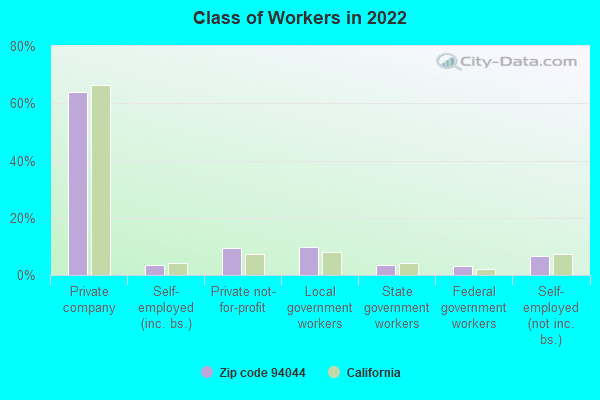
Top industries in this zip code by the number of employees in 2005:
2005 - 2018 National Fire Incident Reporting System (NFIRS) incidents
According to the data from the years 2005 - 2018 the average number of fire incidents per year is 97. The highest number of fire incidents - 130 took place in 2008, and the least - 32 in 2007. The data has a decreasing trend.
When looking into fire subcategories, the most incidents belonged to: Structure Fires (51.1%), and Outside Fires (33.0%).
Fire incident types reported to NFIRS in Zip Code 94044


 Nearest zip codes: 94066, 94037, 94080, 94015, 94030, 94038.
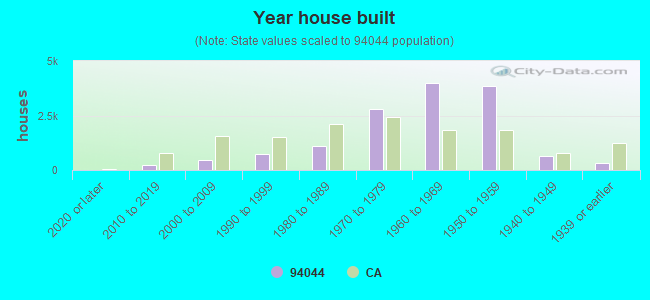


 According to the data from the years 2005 - 2018 the average number of fire incidents per year is 97. The highest number of fire incidents - 130 took place in 2008, and the least - 32 in 2007. The data has a decreasing trend.
 When looking into fire subcategories, the most incidents belonged to: Structure Fires (51.1%), and Outside Fires (33.0%).