Pacifica, California Submit your own pictures of this city and show them to the world
OSM Map
General Map
Google Map
MSN Map
OSM Map
General Map
Google Map
MSN Map
OSM Map
General Map
Google Map
MSN Map
OSM Map
General Map
Google Map
MSN Map
Please wait while loading the map...
Population in 2022: 36,517 (100% urban, 0% rural). Population change since 2000: -4.9%Males: 18,279 Females: 18,238
March 2022 cost of living index in Pacifica: 134.9 (high, U.S. average is 100) Percentage of residents living in poverty in 2022: 5.6%for White Non-Hispanic residents , 6.2% for Black residents , 7.7% for Hispanic or Latino residents , 20.1% for American Indian residents , 2.3% for Native Hawaiian and other Pacific Islander residents , 3.8% for other race residents , 6.3% for two or more races residents )
Profiles of local businesses
Business Search - 14 Million verified businesses
Data:
Median household income ($)
Median household income (% change since 2000)
Household income diversity
Ratio of average income to average house value (%)
Ratio of average income to average rent
Median household income ($) - White
Median household income ($) - Black or African American
Median household income ($) - Asian
Median household income ($) - Hispanic or Latino
Median household income ($) - American Indian and Alaska Native
Median household income ($) - Multirace
Median household income ($) - Other Race
Median household income for houses/condos with a mortgage ($)
Median household income for apartments without a mortgage ($)
Races - White alone (%)
Races - White alone (% change since 2000)
Races - Black alone (%)
Races - Black alone (% change since 2000)
Races - American Indian alone (%)
Races - American Indian alone (% change since 2000)
Races - Asian alone (%)
Races - Asian alone (% change since 2000)
Races - Hispanic (%)
Races - Hispanic (% change since 2000)
Races - Native Hawaiian and Other Pacific Islander alone (%)
Races - Native Hawaiian and Other Pacific Islander alone (% change since 2000)
Races - Two or more races (%)
Races - Two or more races (% change since 2000)
Races - Other race alone (%)
Races - Other race alone (% change since 2000)
Racial diversity
Unemployment (%)
Unemployment (% change since 2000)
Unemployment (%) - White
Unemployment (%) - Black or African American
Unemployment (%) - Asian
Unemployment (%) - Hispanic or Latino
Unemployment (%) - American Indian and Alaska Native
Unemployment (%) - Multirace
Unemployment (%) - Other Race
Population density (people per square mile)
Population - Males (%)
Population - Females (%)
Population - Males (%) - White
Population - Males (%) - Black or African American
Population - Males (%) - Asian
Population - Males (%) - Hispanic or Latino
Population - Males (%) - American Indian and Alaska Native
Population - Males (%) - Multirace
Population - Males (%) - Other Race
Population - Females (%) - White
Population - Females (%) - Black or African American
Population - Females (%) - Asian
Population - Females (%) - Hispanic or Latino
Population - Females (%) - American Indian and Alaska Native
Population - Females (%) - Multirace
Population - Females (%) - Other Race
Coronavirus confirmed cases (Apr 27, 2024)
Deaths caused by coronavirus (Apr 27, 2024)
Coronavirus confirmed cases (per 100k population) (Apr 27, 2024)
Deaths caused by coronavirus (per 100k population) (Apr 27, 2024)
Daily increase in number of cases (Apr 27, 2024)
Weekly increase in number of cases (Apr 27, 2024)
Cases doubled (in days) (Apr 27, 2024)
Hospitalized patients (Apr 18, 2022)
Negative test results (Apr 18, 2022)
Total test results (Apr 18, 2022)
COVID Vaccine doses distributed (per 100k population) (Sep 19, 2023)
COVID Vaccine doses administered (per 100k population) (Sep 19, 2023)
COVID Vaccine doses distributed (Sep 19, 2023)
COVID Vaccine doses administered (Sep 19, 2023)
Likely homosexual households (%)
Likely homosexual households (% change since 2000)
Likely homosexual households - Lesbian couples (%)
Likely homosexual households - Lesbian couples (% change since 2000)
Likely homosexual households - Gay men (%)
Likely homosexual households - Gay men (% change since 2000)
Cost of living index
Median gross rent ($)
Median contract rent ($)
Median monthly housing costs ($)
Median house or condo value ($)
Median house or condo value ($ change since 2000)
Mean house or condo value by units in structure - 1, detached ($)
Mean house or condo value by units in structure - 1, attached ($)
Mean house or condo value by units in structure - 2 ($)
Mean house or condo value by units in structure by units in structure - 3 or 4 ($)
Mean house or condo value by units in structure - 5 or more ($)
Mean house or condo value by units in structure - Boat, RV, van, etc. ($)
Mean house or condo value by units in structure - Mobile home ($)
Median house or condo value ($) - White
Median house or condo value ($) - Black or African American
Median house or condo value ($) - Asian
Median house or condo value ($) - Hispanic or Latino
Median house or condo value ($) - American Indian and Alaska Native
Median house or condo value ($) - Multirace
Median house or condo value ($) - Other Race
Median resident age
Resident age diversity
Median resident age - Males
Median resident age - Females
Median resident age - White
Median resident age - Black or African American
Median resident age - Asian
Median resident age - Hispanic or Latino
Median resident age - American Indian and Alaska Native
Median resident age - Multirace
Median resident age - Other Race
Median resident age - Males - White
Median resident age - Males - Black or African American
Median resident age - Males - Asian
Median resident age - Males - Hispanic or Latino
Median resident age - Males - American Indian and Alaska Native
Median resident age - Males - Multirace
Median resident age - Males - Other Race
Median resident age - Females - White
Median resident age - Females - Black or African American
Median resident age - Females - Asian
Median resident age - Females - Hispanic or Latino
Median resident age - Females - American Indian and Alaska Native
Median resident age - Females - Multirace
Median resident age - Females - Other Race
Commute - mean travel time to work (minutes)
Travel time to work - Less than 5 minutes (%)
Travel time to work - Less than 5 minutes (% change since 2000)
Travel time to work - 5 to 9 minutes (%)
Travel time to work - 5 to 9 minutes (% change since 2000)
Travel time to work - 10 to 19 minutes (%)
Travel time to work - 10 to 19 minutes (% change since 2000)
Travel time to work - 20 to 29 minutes (%)
Travel time to work - 20 to 29 minutes (% change since 2000)
Travel time to work - 30 to 39 minutes (%)
Travel time to work - 30 to 39 minutes (% change since 2000)
Travel time to work - 40 to 59 minutes (%)
Travel time to work - 40 to 59 minutes (% change since 2000)
Travel time to work - 60 to 89 minutes (%)
Travel time to work - 60 to 89 minutes (% change since 2000)
Travel time to work - 90 or more minutes (%)
Travel time to work - 90 or more minutes (% change since 2000)
Marital status - Never married (%)
Marital status - Now married (%)
Marital status - Separated (%)
Marital status - Widowed (%)
Marital status - Divorced (%)
Median family income ($)
Median family income (% change since 2000)
Median non-family income ($)
Median non-family income (% change since 2000)
Median per capita income ($)
Median per capita income (% change since 2000)
Median family income ($) - White
Median family income ($) - Black or African American
Median family income ($) - Asian
Median family income ($) - Hispanic or Latino
Median family income ($) - American Indian and Alaska Native
Median family income ($) - Multirace
Median family income ($) - Other Race
Median year house/condo built
Median year apartment built
Year house built - Built 2005 or later (%)
Year house built - Built 2000 to 2004 (%)
Year house built - Built 1990 to 1999 (%)
Year house built - Built 1980 to 1989 (%)
Year house built - Built 1970 to 1979 (%)
Year house built - Built 1960 to 1969 (%)
Year house built - Built 1950 to 1959 (%)
Year house built - Built 1940 to 1949 (%)
Year house built - Built 1939 or earlier (%)
Average household size
Household density (households per square mile)
Average household size - White
Average household size - Black or African American
Average household size - Asian
Average household size - Hispanic or Latino
Average household size - American Indian and Alaska Native
Average household size - Multirace
Average household size - Other Race
Occupied housing units (%)
Vacant housing units (%)
Owner occupied housing units (%)
Renter occupied housing units (%)
Vacancy status - For rent (%)
Vacancy status - For sale only (%)
Vacancy status - Rented or sold, not occupied (%)
Vacancy status - For seasonal, recreational, or occasional use (%)
Vacancy status - For migrant workers (%)
Vacancy status - Other vacant (%)
Residents with income below the poverty level (%)
Residents with income below 50% of the poverty level (%)
Children below poverty level (%)
Poor families by family type - Married-couple family (%)
Poor families by family type - Male, no wife present (%)
Poor families by family type - Female, no husband present (%)
Poverty status for native-born residents (%)
Poverty status for foreign-born residents (%)
Poverty among high school graduates not in families (%)
Poverty among people who did not graduate high school not in families (%)
Residents with income below the poverty level (%) - White
Residents with income below the poverty level (%) - Black or African American
Residents with income below the poverty level (%) - Asian
Residents with income below the poverty level (%) - Hispanic or Latino
Residents with income below the poverty level (%) - American Indian and Alaska Native
Residents with income below the poverty level (%) - Multirace
Residents with income below the poverty level (%) - Other Race
Air pollution - Air Quality Index (AQI)
Air pollution - CO
Air pollution - NO2
Air pollution - SO2
Air pollution - Ozone
Air pollution - PM10
Air pollution - PM25
Air pollution - Pb
Crime - Murders per 100,000 population
Crime - Rapes per 100,000 population
Crime - Robberies per 100,000 population
Crime - Assaults per 100,000 population
Crime - Burglaries per 100,000 population
Crime - Thefts per 100,000 population
Crime - Auto thefts per 100,000 population
Crime - Arson per 100,000 population
Crime - City-data.com crime index
Crime - Violent crime index
Crime - Property crime index
Crime - Murders per 100,000 population (5 year average)
Crime - Rapes per 100,000 population (5 year average)
Crime - Robberies per 100,000 population (5 year average)
Crime - Assaults per 100,000 population (5 year average)
Crime - Burglaries per 100,000 population (5 year average)
Crime - Thefts per 100,000 population (5 year average)
Crime - Auto thefts per 100,000 population (5 year average)
Crime - Arson per 100,000 population (5 year average)
Crime - City-data.com crime index (5 year average)
Crime - Violent crime index (5 year average)
Crime - Property crime index (5 year average)
1996 Presidential Elections Results (%) - Democratic Party (Clinton)
1996 Presidential Elections Results (%) - Republican Party (Dole)
1996 Presidential Elections Results (%) - Other
2000 Presidential Elections Results (%) - Democratic Party (Gore)
2000 Presidential Elections Results (%) - Republican Party (Bush)
2000 Presidential Elections Results (%) - Other
2004 Presidential Elections Results (%) - Democratic Party (Kerry)
2004 Presidential Elections Results (%) - Republican Party (Bush)
2004 Presidential Elections Results (%) - Other
2008 Presidential Elections Results (%) - Democratic Party (Obama)
2008 Presidential Elections Results (%) - Republican Party (McCain)
2008 Presidential Elections Results (%) - Other
2012 Presidential Elections Results (%) - Democratic Party (Obama)
2012 Presidential Elections Results (%) - Republican Party (Romney)
2012 Presidential Elections Results (%) - Other
2016 Presidential Elections Results (%) - Democratic Party (Clinton)
2016 Presidential Elections Results (%) - Republican Party (Trump)
2016 Presidential Elections Results (%) - Other
2020 Presidential Elections Results (%) - Democratic Party (Biden)
2020 Presidential Elections Results (%) - Republican Party (Trump)
2020 Presidential Elections Results (%) - Other
Ancestries Reported - Arab (%)
Ancestries Reported - Czech (%)
Ancestries Reported - Danish (%)
Ancestries Reported - Dutch (%)
Ancestries Reported - English (%)
Ancestries Reported - French (%)
Ancestries Reported - French Canadian (%)
Ancestries Reported - German (%)
Ancestries Reported - Greek (%)
Ancestries Reported - Hungarian (%)
Ancestries Reported - Irish (%)
Ancestries Reported - Italian (%)
Ancestries Reported - Lithuanian (%)
Ancestries Reported - Norwegian (%)
Ancestries Reported - Polish (%)
Ancestries Reported - Portuguese (%)
Ancestries Reported - Russian (%)
Ancestries Reported - Scotch-Irish (%)
Ancestries Reported - Scottish (%)
Ancestries Reported - Slovak (%)
Ancestries Reported - Subsaharan African (%)
Ancestries Reported - Swedish (%)
Ancestries Reported - Swiss (%)
Ancestries Reported - Ukrainian (%)
Ancestries Reported - United States (%)
Ancestries Reported - Welsh (%)
Ancestries Reported - West Indian (%)
Ancestries Reported - Other (%)
Educational Attainment - No schooling completed (%)
Educational Attainment - Less than high school (%)
Educational Attainment - High school or equivalent (%)
Educational Attainment - Less than 1 year of college (%)
Educational Attainment - 1 or more years of college (%)
Educational Attainment - Associate degree (%)
Educational Attainment - Bachelor's degree (%)
Educational Attainment - Master's degree (%)
Educational Attainment - Professional school degree (%)
Educational Attainment - Doctorate degree (%)
School Enrollment - Nursery, preschool (%)
School Enrollment - Kindergarten (%)
School Enrollment - Grade 1 to 4 (%)
School Enrollment - Grade 5 to 8 (%)
School Enrollment - Grade 9 to 12 (%)
School Enrollment - College undergrad (%)
School Enrollment - Graduate or professional (%)
School Enrollment - Not enrolled in school (%)
School enrollment - Public schools (%)
School enrollment - Private schools (%)
School enrollment - Not enrolled (%)
Median number of rooms in houses and condos
Median number of rooms in apartments
Housing units lacking complete plumbing facilities (%)
Housing units lacking complete kitchen facilities (%)
Density of houses
Urban houses (%)
Rural houses (%)
Households with people 60 years and over (%)
Households with people 65 years and over (%)
Households with people 75 years and over (%)
Households with one or more nonrelatives (%)
Households with no nonrelatives (%)
Population in households (%)
Family households (%)
Nonfamily households (%)
Population in families (%)
Family households with own children (%)
Median number of bedrooms in owner occupied houses
Mean number of bedrooms in owner occupied houses
Median number of bedrooms in renter occupied houses
Mean number of bedrooms in renter occupied houses
Median number of vehichles in owner occupied houses
Mean number of vehichles in owner occupied houses
Median number of vehichles in renter occupied houses
Mean number of vehichles in renter occupied houses
Mortgage status - with mortgage (%)
Mortgage status - with second mortgage (%)
Mortgage status - with home equity loan (%)
Mortgage status - with both second mortgage and home equity loan (%)
Mortgage status - without a mortgage (%)
Average family size
Average family size - White
Average family size - Black or African American
Average family size - Asian
Average family size - Hispanic or Latino
Average family size - American Indian and Alaska Native
Average family size - Multirace
Average family size - Other Race
Geographical mobility - Same house 1 year ago (%)
Geographical mobility - Moved within same county (%)
Geographical mobility - Moved from different county within same state (%)
Geographical mobility - Moved from different state (%)
Geographical mobility - Moved from abroad (%)
Place of birth - Born in state of residence (%)
Place of birth - Born in other state (%)
Place of birth - Native, outside of US (%)
Place of birth - Foreign born (%)
Housing units in structures - 1, detached (%)
Housing units in structures - 1, attached (%)
Housing units in structures - 2 (%)
Housing units in structures - 3 or 4 (%)
Housing units in structures - 5 to 9 (%)
Housing units in structures - 10 to 19 (%)
Housing units in structures - 20 to 49 (%)
Housing units in structures - 50 or more (%)
Housing units in structures - Mobile home (%)
Housing units in structures - Boat, RV, van, etc. (%)
House/condo owner moved in on average (years ago)
Renter moved in on average (years ago)
Year householder moved into unit - Moved in 1999 to March 2000 (%)
Year householder moved into unit - Moved in 1995 to 1998 (%)
Year householder moved into unit - Moved in 1990 to 1994 (%)
Year householder moved into unit - Moved in 1980 to 1989 (%)
Year householder moved into unit - Moved in 1970 to 1979 (%)
Year householder moved into unit - Moved in 1969 or earlier (%)
Means of transportation to work - Drove car alone (%)
Means of transportation to work - Carpooled (%)
Means of transportation to work - Public transportation (%)
Means of transportation to work - Bus or trolley bus (%)
Means of transportation to work - Streetcar or trolley car (%)
Means of transportation to work - Subway or elevated (%)
Means of transportation to work - Railroad (%)
Means of transportation to work - Ferryboat (%)
Means of transportation to work - Taxicab (%)
Means of transportation to work - Motorcycle (%)
Means of transportation to work - Bicycle (%)
Means of transportation to work - Walked (%)
Means of transportation to work - Other means (%)
Working at home (%)
Industry diversity
Most Common Industries - Agriculture, forestry, fishing and hunting, and mining (%)
Most Common Industries - Agriculture, forestry, fishing and hunting (%)
Most Common Industries - Mining, quarrying, and oil and gas extraction (%)
Most Common Industries - Construction (%)
Most Common Industries - Manufacturing (%)
Most Common Industries - Wholesale trade (%)
Most Common Industries - Retail trade (%)
Most Common Industries - Transportation and warehousing, and utilities (%)
Most Common Industries - Transportation and warehousing (%)
Most Common Industries - Utilities (%)
Most Common Industries - Information (%)
Most Common Industries - Finance and insurance, and real estate and rental and leasing (%)
Most Common Industries - Finance and insurance (%)
Most Common Industries - Real estate and rental and leasing (%)
Most Common Industries - Professional, scientific, and management, and administrative and waste management services (%)
Most Common Industries - Professional, scientific, and technical services (%)
Most Common Industries - Management of companies and enterprises (%)
Most Common Industries - Administrative and support and waste management services (%)
Most Common Industries - Educational services, and health care and social assistance (%)
Most Common Industries - Educational services (%)
Most Common Industries - Health care and social assistance (%)
Most Common Industries - Arts, entertainment, and recreation, and accommodation and food services (%)
Most Common Industries - Arts, entertainment, and recreation (%)
Most Common Industries - Accommodation and food services (%)
Most Common Industries - Other services, except public administration (%)
Most Common Industries - Public administration (%)
Occupation diversity
Most Common Occupations - Management, business, science, and arts occupations (%)
Most Common Occupations - Management, business, and financial occupations (%)
Most Common Occupations - Management occupations (%)
Most Common Occupations - Business and financial operations occupations (%)
Most Common Occupations - Computer, engineering, and science occupations (%)
Most Common Occupations - Computer and mathematical occupations (%)
Most Common Occupations - Architecture and engineering occupations (%)
Most Common Occupations - Life, physical, and social science occupations (%)
Most Common Occupations - Education, legal, community service, arts, and media occupations (%)
Most Common Occupations - Community and social service occupations (%)
Most Common Occupations - Legal occupations (%)
Most Common Occupations - Education, training, and library occupations (%)
Most Common Occupations - Arts, design, entertainment, sports, and media occupations (%)
Most Common Occupations - Healthcare practitioners and technical occupations (%)
Most Common Occupations - Health diagnosing and treating practitioners and other technical occupations (%)
Most Common Occupations - Health technologists and technicians (%)
Most Common Occupations - Service occupations (%)
Most Common Occupations - Healthcare support occupations (%)
Most Common Occupations - Protective service occupations (%)
Most Common Occupations - Fire fighting and prevention, and other protective service workers including supervisors (%)
Most Common Occupations - Law enforcement workers including supervisors (%)
Most Common Occupations - Food preparation and serving related occupations (%)
Most Common Occupations - Building and grounds cleaning and maintenance occupations (%)
Most Common Occupations - Personal care and service occupations (%)
Most Common Occupations - Sales and office occupations (%)
Most Common Occupations - Sales and related occupations (%)
Most Common Occupations - Office and administrative support occupations (%)
Most Common Occupations - Natural resources, construction, and maintenance occupations (%)
Most Common Occupations - Farming, fishing, and forestry occupations (%)
Most Common Occupations - Construction and extraction occupations (%)
Most Common Occupations - Installation, maintenance, and repair occupations (%)
Most Common Occupations - Production, transportation, and material moving occupations (%)
Most Common Occupations - Production occupations (%)
Most Common Occupations - Transportation occupations (%)
Most Common Occupations - Material moving occupations (%)
People in Group quarters - Institutionalized population (%)
People in Group quarters - Correctional institutions (%)
People in Group quarters - Federal prisons and detention centers (%)
People in Group quarters - Halfway houses (%)
People in Group quarters - Local jails and other confinement facilities (including police lockups) (%)
People in Group quarters - Military disciplinary barracks (%)
People in Group quarters - State prisons (%)
People in Group quarters - Other types of correctional institutions (%)
People in Group quarters - Nursing homes (%)
People in Group quarters - Hospitals/wards, hospices, and schools for the handicapped (%)
People in Group quarters - Hospitals/wards and hospices for chronically ill (%)
People in Group quarters - Hospices or homes for chronically ill (%)
People in Group quarters - Military hospitals or wards for chronically ill (%)
People in Group quarters - Other hospitals or wards for chronically ill (%)
People in Group quarters - Hospitals or wards for drug/alcohol abuse (%)
People in Group quarters - Mental (Psychiatric) hospitals or wards (%)
People in Group quarters - Schools, hospitals, or wards for the mentally retarded (%)
People in Group quarters - Schools, hospitals, or wards for the physically handicapped (%)
People in Group quarters - Institutions for the deaf (%)
People in Group quarters - Institutions for the blind (%)
People in Group quarters - Orthopedic wards and institutions for the physically handicapped (%)
People in Group quarters - Wards in general hospitals for patients who have no usual home elsewhere (%)
People in Group quarters - Wards in military hospitals for patients who have no usual home elsewhere (%)
People in Group quarters - Juvenile institutions (%)
People in Group quarters - Long-term care (%)
People in Group quarters - Homes for abused, dependent, and neglected children (%)
People in Group quarters - Residential treatment centers for emotionally disturbed children (%)
People in Group quarters - Training schools for juvenile delinquents (%)
People in Group quarters - Short-term care, detention or diagnostic centers for delinquent children (%)
People in Group quarters - Type of juvenile institution unknown (%)
People in Group quarters - Noninstitutionalized population (%)
People in Group quarters - College dormitories (includes college quarters off campus) (%)
People in Group quarters - Military quarters (%)
People in Group quarters - On base (%)
People in Group quarters - Barracks, unaccompanied personnel housing (UPH), (Enlisted/Officer), ;and similar group living quarters for military personnel (%)
People in Group quarters - Transient quarters for temporary residents (%)
People in Group quarters - Military ships (%)
People in Group quarters - Group homes (%)
People in Group quarters - Homes or halfway houses for drug/alcohol abuse (%)
People in Group quarters - Homes for the mentally ill (%)
People in Group quarters - Homes for the mentally retarded (%)
People in Group quarters - Homes for the physically handicapped (%)
People in Group quarters - Other group homes (%)
People in Group quarters - Religious group quarters (%)
People in Group quarters - Dormitories (%)
People in Group quarters - Agriculture workers' dormitories on farms (%)
People in Group quarters - Job Corps and vocational training facilities (%)
People in Group quarters - Other workers' dormitories (%)
People in Group quarters - Crews of maritime vessels (%)
People in Group quarters - Other nonhousehold living situations (%)
People in Group quarters - Other noninstitutional group quarters (%)
Residents speaking English at home (%)
Residents speaking English at home - Born in the United States (%)
Residents speaking English at home - Native, born elsewhere (%)
Residents speaking English at home - Foreign born (%)
Residents speaking Spanish at home (%)
Residents speaking Spanish at home - Born in the United States (%)
Residents speaking Spanish at home - Native, born elsewhere (%)
Residents speaking Spanish at home - Foreign born (%)
Residents speaking other language at home (%)
Residents speaking other language at home - Born in the United States (%)
Residents speaking other language at home - Native, born elsewhere (%)
Residents speaking other language at home - Foreign born (%)
Class of Workers - Employee of private company (%)
Class of Workers - Self-employed in own incorporated business (%)
Class of Workers - Private not-for-profit wage and salary workers (%)
Class of Workers - Local government workers (%)
Class of Workers - State government workers (%)
Class of Workers - Federal government workers (%)
Class of Workers - Self-employed workers in own not incorporated business and Unpaid family workers (%)
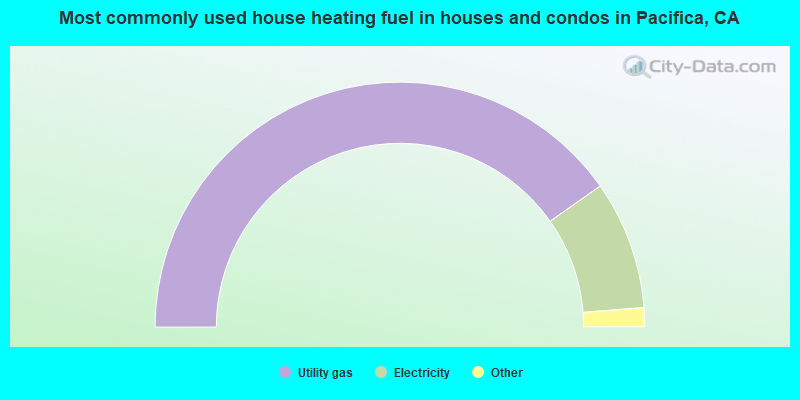
House heating fuel used in houses and condos - Utility gas (%)
House heating fuel used in houses and condos - Bottled, tank, or LP gas (%)
House heating fuel used in houses and condos - Electricity (%)
House heating fuel used in houses and condos - Fuel oil, kerosene, etc. (%)
House heating fuel used in houses and condos - Coal or coke (%)
House heating fuel used in houses and condos - Wood (%)
House heating fuel used in houses and condos - Solar energy (%)
House heating fuel used in houses and condos - Other fuel (%)
House heating fuel used in houses and condos - No fuel used (%)
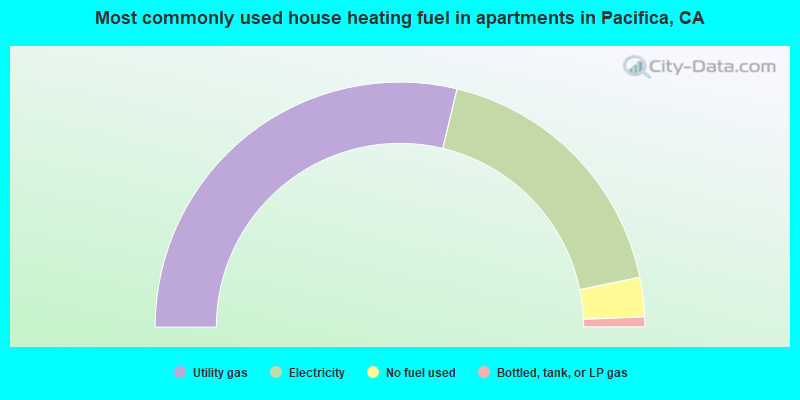
House heating fuel used in apartments - Utility gas (%)
House heating fuel used in apartments - Bottled, tank, or LP gas (%)
House heating fuel used in apartments - Electricity (%)
House heating fuel used in apartments - Fuel oil, kerosene, etc. (%)
House heating fuel used in apartments - Coal or coke (%)
House heating fuel used in apartments - Wood (%)
House heating fuel used in apartments - Solar energy (%)
House heating fuel used in apartments - Other fuel (%)
House heating fuel used in apartments - No fuel used (%)
Armed forces status - In Armed Forces (%)
Armed forces status - Civilian (%)
Armed forces status - Civilian - Veteran (%)
Armed forces status - Civilian - Nonveteran (%)
Fatal accidents locations in years 2005-2021
Fatal accidents locations in 2005
Fatal accidents locations in 2006
Fatal accidents locations in 2007
Fatal accidents locations in 2008
Fatal accidents locations in 2009
Fatal accidents locations in 2010
Fatal accidents locations in 2011
Fatal accidents locations in 2012
Fatal accidents locations in 2013
Fatal accidents locations in 2014
Fatal accidents locations in 2015
Fatal accidents locations in 2016
Fatal accidents locations in 2017
Fatal accidents locations in 2018
Fatal accidents locations in 2019
Fatal accidents locations in 2020
Fatal accidents locations in 2021
Alcohol use - People drinking some alcohol every month (%)
Alcohol use - People not drinking at all (%)
Alcohol use - Average days/month drinking alcohol
Alcohol use - Average drinks/week
Alcohol use - Average days/year people drink much
Audiometry - Average condition of hearing (%)
Audiometry - People that can hear a whisper from across a quiet room (%)
Audiometry - People that can hear normal voice from across a quiet room (%)
Audiometry - Ears ringing, roaring, buzzing (%)
Audiometry - Had a job exposure to loud noise (%)
Audiometry - Had off-work exposure to loud noise (%)
Blood Pressure & Cholesterol - Has high blood pressure (%)
Blood Pressure & Cholesterol - Checking blood pressure at home (%)
Blood Pressure & Cholesterol - Frequently checking blood cholesterol (%)
Blood Pressure & Cholesterol - Has high cholesterol level (%)
Consumer Behavior - Money monthly spent on food at supermarket/grocery store
Consumer Behavior - Money monthly spent on food at other stores
Consumer Behavior - Money monthly spent on eating out
Consumer Behavior - Money monthly spent on carryout/delivered foods
Consumer Behavior - Income spent on food at supermarket/grocery store (%)
Consumer Behavior - Income spent on food at other stores (%)
Consumer Behavior - Income spent on eating out (%)
Consumer Behavior - Income spent on carryout/delivered foods (%)
Current Health Status - General health condition (%)
Current Health Status - Blood donors (%)
Current Health Status - Has blood ever tested for HIV virus (%)
Current Health Status - Left-handed people (%)
Dermatology - People using sunscreen (%)
Diabetes - Diabetics (%)
Diabetes - Had a blood test for high blood sugar (%)
Diabetes - People taking insulin (%)
Diet Behavior & Nutrition - Diet health (%)
Diet Behavior & Nutrition - Milk product consumption (# of products/month)
Diet Behavior & Nutrition - Meals not home prepared (#/week)
Diet Behavior & Nutrition - Meals from fast food or pizza place (#/week)
Diet Behavior & Nutrition - Ready-to-eat foods (#/month)
Diet Behavior & Nutrition - Frozen meals/pizza (#/month)
Drug Use - People that ever used marijuana or hashish (%)
Drug Use - Ever used hard drugs (%)
Drug Use - Ever used any form of cocaine (%)
Drug Use - Ever used heroin (%)
Drug Use - Ever used methamphetamine (%)
Health Insurance - People covered by health insurance (%)
Kidney Conditions-Urology - Avg. # of times urinating at night
Medical Conditions - People with asthma (%)
Medical Conditions - People with anemia (%)
Medical Conditions - People with psoriasis (%)
Medical Conditions - People with overweight (%)
Medical Conditions - Elderly people having difficulties in thinking or remembering (%)
Medical Conditions - People who ever received blood transfusion (%)
Medical Conditions - People having trouble seeing even with glass/contacts (%)
Medical Conditions - People with arthritis (%)
Medical Conditions - People with gout (%)
Medical Conditions - People with congestive heart failure (%)
Medical Conditions - People with coronary heart disease (%)
Medical Conditions - People with angina pectoris (%)
Medical Conditions - People who ever had heart attack (%)
Medical Conditions - People who ever had stroke (%)
Medical Conditions - People with emphysema (%)
Medical Conditions - People with thyroid problem (%)
Medical Conditions - People with chronic bronchitis (%)
Medical Conditions - People with any liver condition (%)
Medical Conditions - People who ever had cancer or malignancy (%)
Mental Health - People who have little interest in doing things (%)
Mental Health - People feeling down, depressed, or hopeless (%)
Mental Health - People who have trouble sleeping or sleeping too much (%)
Mental Health - People feeling tired or having little energy (%)
Mental Health - People with poor appetite or overeating (%)
Mental Health - People feeling bad about themself (%)
Mental Health - People who have trouble concentrating on things (%)
Mental Health - People moving or speaking slowly or too fast (%)
Mental Health - People having thoughts they would be better off dead (%)
Oral Health - Average years since last visit a dentist
Oral Health - People embarrassed because of mouth (%)
Oral Health - People with gum disease (%)
Oral Health - General health of teeth and gums (%)
Oral Health - Average days a week using dental floss/device
Oral Health - Average days a week using mouthwash for dental problem
Oral Health - Average number of teeth
Pesticide Use - Households using pesticides to control insects (%)
Pesticide Use - Households using pesticides to kill weeds (%)
Physical Activity - People doing vigorous-intensity work activities (%)
Physical Activity - People doing moderate-intensity work activities (%)
Physical Activity - People walking or bicycling (%)
Physical Activity - People doing vigorous-intensity recreational activities (%)
Physical Activity - People doing moderate-intensity recreational activities (%)
Physical Activity - Average hours a day doing sedentary activities
Physical Activity - Average hours a day watching TV or videos
Physical Activity - Average hours a day using computer
Physical Functioning - People having limitations keeping them from working (%)
Physical Functioning - People limited in amount of work they can do (%)
Physical Functioning - People that need special equipment to walk (%)
Physical Functioning - People experiencing confusion/memory problems (%)
Physical Functioning - People requiring special healthcare equipment (%)
Prescription Medications - Average number of prescription medicines taking
Preventive Aspirin Use - Adults 40+ taking low-dose aspirin (%)
Reproductive Health - Vaginal deliveries (%)
Reproductive Health - Cesarean deliveries (%)
Reproductive Health - Deliveries resulted in a live birth (%)
Reproductive Health - Pregnancies resulted in a delivery (%)
Reproductive Health - Women breastfeeding newborns (%)
Reproductive Health - Women that had a hysterectomy (%)
Reproductive Health - Women that had both ovaries removed (%)
Reproductive Health - Women that have ever taken birth control pills (%)
Reproductive Health - Women taking birth control pills (%)
Reproductive Health - Women that have ever used Depo-Provera or injectables (%)
Reproductive Health - Women that have ever used female hormones (%)
Sexual Behavior - People 18+ that ever had sex (vaginal, anal, or oral) (%)
Sexual Behavior - Males 18+ that ever had vaginal sex with a woman (%)
Sexual Behavior - Males 18+ that ever performed oral sex on a woman (%)
Sexual Behavior - Males 18+ that ever had anal sex with a woman (%)
Sexual Behavior - Males 18+ that ever had any sex with a man (%)
Sexual Behavior - Females 18+ that ever had vaginal sex with a man (%)
Sexual Behavior - Females 18+ that ever performed oral sex on a man (%)
Sexual Behavior - Females 18+ that ever had anal sex with a man (%)
Sexual Behavior - Females 18+ that ever had any kind of sex with a woman (%)
Sexual Behavior - Average age people first had sex
Sexual Behavior - Average number of female sex partners in lifetime (males 18+)
Sexual Behavior - Average number of female vaginal sex partners in lifetime (males 18+)
Sexual Behavior - Average age people first performed oral sex on a woman (18+)
Sexual Behavior - Average number of woman performed oral sex on in lifetime (18+)
Sexual Behavior - Average number of male sex partners in lifetime (males 18+)
Sexual Behavior - Average number of male anal sex partners in lifetime (males 18+)
Sexual Behavior - Average age people first performed oral sex on a man (18+)
Sexual Behavior - Average number of male oral sex partners in lifetime (18+)
Sexual Behavior - People using protection when performing oral sex (%)
Sexual Behavior - Average number of times people have vaginal or anal sex a year
Sexual Behavior - People having sex without condom (%)
Sexual Behavior - Average number of male sex partners in lifetime (females 18+)
Sexual Behavior - Average number of male vaginal sex partners in lifetime (females 18+)
Sexual Behavior - Average number of female sex partners in lifetime (females 18+)
Sexual Behavior - Circumcised males 18+ (%)
Sleep Disorders - Average hours sleeping at night
Sleep Disorders - People that has trouble sleeping (%)
Smoking-Cigarette Use - People smoking cigarettes (%)
Taste & Smell - People 40+ having problems with smell (%)
Taste & Smell - People 40+ having problems with taste (%)
Taste & Smell - People 40+ that ever had wisdom teeth removed (%)
Taste & Smell - People 40+ that ever had tonsils teeth removed (%)
Taste & Smell - People 40+ that ever had a loss of consciousness because of a head injury (%)
Taste & Smell - People 40+ that ever had a broken nose or other serious injury to face or skull (%)
Taste & Smell - People 40+ that ever had two or more sinus infections (%)
Weight - Average height (inches)
Weight - Average weight (pounds)
Weight - Average BMI
Weight - People that are obese (%)
Weight - People that ever were obese (%)
Weight - People trying to lose weight (%)
17,874 48.6% White alone 8,093 22.0% Asian alone 6,673 18.1% Hispanic 2,295 6.2% Two or more races 694 1.9% Black alone 409 1.1% Other race alone 386 1.0% Native Hawaiian and Other 16 0.04% American Indian alone
According to our research of California and other state lists, there were 24 registered sex offenders living in Pacifica, California as of April 27, 2024 . The ratio of all residents to sex offenders in Pacifica is 1,640 to 1.The ratio of registered sex offenders to all residents in this city is lower than the state average.
Officers per 1,000 residents here:
0.81California average:
2.30
Latest news from Pacifica, CA collected exclusively by city-data.com from local newspapers, TV, and radio stations
Ancestries: Irish (6.2%), Italian (5.7%), English (4.0%), European (4.0%), American (3.9%), German (3.6%).
Current Local Time:
Land area: 12.6 square miles.
Population density: 2,891 people per square mile (average).
8,319 residents are foreign born (13.0% Asia , 4.3% Latin America , 2.9% Europe ).
This city:
22.6%California:
26.5%
Median real estate property taxes paid for housing units with mortgages in 2022: $8,244 (0.6%)Median real estate property taxes paid for housing units with no mortgage in 2022: $4,435 (0.3%)
Nearest city with pop. 50,000+: South San Francisco, CA (4.0 miles
Nearest city with pop. 200,000+: San Francisco, CA
Nearest city with pop. 1,000,000+: Los Angeles, CA
Nearest cities:
Latitude: 37.62 N, Longitude: 122.49 W
Pacifica nicknames or aliases (official or unofficial):
Fog Capital of California, PasyphillisDaytime population change due to commuting: -11,262 (-30.6%)Workers who live and work in this city: 6,455 (33.6%)
Property values in Pacifica, CA
Pacifica tourist attractions:
Single-family new house construction building permits:
2022: 12 buildings , average cost: $275,9002021: 34 buildings , average cost: $334,4002020: 1 building , cost: $600,0002019: 3 buildings , average cost: $1,600,0002018: 13 buildings , average cost: $524,6002017: 3 buildings , average cost: $493,2002016: 8 buildings , average cost: $390,9002015: 4 buildings , average cost: $348,6002014: 4 buildings , average cost: $288,8002013: 4 buildings , average cost: $482,6002012: 4 buildings , average cost: $482,6002011: 2 buildings , average cost: $482,6002010: 5 buildings , average cost: $626,1002009: 8 buildings , average cost: $520,0002008: 14 buildings , average cost: $509,7002007: 101 buildings , average cost: $417,8002006: 4 buildings , average cost: $400,5002005: 9 buildings , average cost: $451,6002004: 9 buildings , average cost: $427,1002003: 7 buildings , average cost: $299,7002002: 14 buildings , average cost: $341,4002001: 31 buildings , average cost: $269,6002000: 36 buildings , average cost: $261,2001999: 45 buildings , average cost: $234,9001998: 96 buildings , average cost: $230,1001997: 36 buildings , average cost: $232,100Unemployment in December 2023:
Population change in the 1990s: +688 (+1.8%).
Most common occupations in Pacifica, CA (%)
Both Males Females
Other office and administrative support workers, including supervisors (5.1%)
Other sales and related occupations, including supervisors (4.7%)
Other management occupations, except farmers and farm managers (4.6%)
Computer specialists (4.3%)
Secretaries and administrative assistants (3.4%)
Sales representatives, services, wholesale and manufacturing (2.6%)
Electrical equipment mechanics and other installation, maintenance, and repair workers, including supervisors (2.4%)
Computer specialists (6.4%)
Other sales and related occupations, including supervisors (5.6%)
Other management occupations, except farmers and farm managers (4.9%)
Electrical equipment mechanics and other installation, maintenance, and repair workers, including supervisors (4.4%)
Driver/sales workers and truck drivers (3.9%)
Vehicle and mobile equipment mechanics, installers, and repairers (2.9%)
Building and grounds cleaning and maintenance occupations (2.9%)
Other office and administrative support workers, including supervisors (8.2%)
Secretaries and administrative assistants (6.6%)
Other management occupations, except farmers and farm managers (4.4%)
Other sales and related occupations, including supervisors (3.8%)
Bookkeeping, accounting, and auditing clerks (3.7%)
Registered nurses (3.5%)
Information and record clerks, except customer service representatives (3.4%)
Earthquake activity:
Pacifica-area historical earthquake activity is significantly above California state average. It is 7272% greater than the overall U.S. average. On 4/18/1906 at 13:12:21, a magnitude 7.9 (7.9 UK, Class: Major, Intensity: VIII - XII) earthquake occurred 38.4 miles away from the city center, causing $524,000,000 total damage On 10/18/1989 at 00:04:15, a magnitude 7.1 (6.5 MB, 7.1 MS, 6.9 MW, 7.0 ML) earthquake occurred 53.0 miles away from Pacifica center, causing 62 deaths ( 62 shaking deaths) and 3757 injuries, causing $1,305,032,704 total damage On 11/4/1927 at 13:51:53, a magnitude 7.5 (7.5 UK) earthquake occurred 204.1 miles away from the city center On 7/21/1952 at 11:52:14, a magnitude 7.7 (7.7 UK) earthquake occurred 265.8 miles away from the city center, causing $50,000,000 total damage On 1/31/1922 at 13:17:28, a magnitude 7.6 (7.6 UK) earthquake occurred 269.0 miles away from Pacifica center On 4/25/1992 at 18:06:04, a magnitude 7.2 (6.3 MB, 7.1 MS, 7.2 MW, 7.1 MW, Depth: 9.4 mi) earthquake occurred 206.9 miles away from Pacifica center, causing $75,000,000 total damage Magnitude types: body-wave magnitude (MB), local magnitude (ML), surface-wave magnitude (MS), moment magnitude (MW) Natural disasters: The number of natural disasters in San Mateo County (18) is near the US average (15).Major Disasters (Presidential) Declared: 11Emergencies Declared: 2Floods: 11, Storms: 6, Mudslides: 5, Winter Storms: 5, Landslides: 4, Fires: 2, Drought: 1, Earthquake: 1, Freeze: 1, Hurricane: 1, Tornado: 1, Other: 1 (Note: some incidents may be assigned to more than one category). Hospitals and medical centers in Pacifica: LINDA MAR CARE CENTER (751 SAN PEDRO TERRACE ROAD)
PACIFICA NURSING AND REHAB CENTER (385 ESPLANADE STREET)
Other hospitals and medical centers near Pacifica: SEACLIFF ICF-DDH INC (Hospital, about 2 miles away; SAN BRUNO, CA)
SUSAN MANOR ICF/DD-H (Hospital, about 2 miles away; SAN BRUNO, CA)
ANTON'S HOME (Hospital, about 2 miles away; SAN BRUNO, CA)
STAFFING HOME CARE (Home Health Center, about 2 miles away; SOUTH SAN FRANCISCO, CA)
BERKSHIRE MANOR, INC (Hospital, about 2 miles away; SAN BRUNO, CA)
FLEETWOOD ICF/DD-H (Hospital, about 3 miles away; SAN BRUNO, CA)
COTTONWOOD HOME ICF/DDH (Hospital, about 3 miles away; SAN BRUNO, CA)
Amtrak stations near Pacifica: 6 miles: SAN FRANCISCO INT'L AIRPO (SAN BRUNO, SAN FRANCISCO INTERNATIONAL AIRPORT) - Bus Station Services: fully wheelchair accessible, enclosed waiting area, public restrooms, public payphones, snack bar, paid short-term parking, paid long-term parking, car rental agency, taxi stand, public transit connection.
6 miles: MILLBRAE (MILLBRAE AVE. & CALIFORNIA DR.) - Bus Station Services: fully wheelchair accessible, public payphones, free short-term parking, call for taxi service, public transit connection.
13 miles: SAN FRANCISCO SHOPPING (SAN FRANCISCO, 835 MARKET ST.) - Bus Station Services: fully wheelchair accessible, public payphones, snack bar, paid short-term parking, paid long-term parking, call for taxi service, public transit connection.
Colleges/universities with over 2000 students nearest to Pacifica:
Skyline College (about 2 miles; San Bruno, CA ; Full-time enrollment: 5,824)
San Francisco State University (about 7 miles; San Francisco, CA ; FT enrollment: 24,644)
City College of San Francisco (about 8 miles; San Francisco, CA ; FT enrollment: 17,569)
College of San Mateo (about 11 miles; San Mateo, CA ; FT enrollment: 5,398)
University of San Francisco (about 11 miles; San Francisco, CA ; FT enrollment: 9,190)
Academy of Art University (about 13 miles; San Francisco, CA ; FT enrollment: 12,352)
College of Alameda (about 16 miles; Alameda, CA ; FT enrollment: 3,071)
Public high schools in Pacifica: TERRA NOVA HIGH Students: 964, Location: 1450 TERRA NOVA BLVD., Grades: 9-12)OCEANA HIGH Students: 392, Location: 401 PALOMA AVE., Grades: 9-12)Private high school in Pacifica: ALMA HEIGHTS CHRISTIAN SCHOOLS Students: 327, Location: 1295 SEVILLE DR, Grades: KG-12)
Public elementary/middle schools in Pacifica: INGRID B. LACY MIDDLE Students: 585, Location: 1427 PALMETTO AVE., Grades: 6-8)VALLEMAR ELEMENTARY Students: 420, Location: 377 REINA DEL MAR AVE., Grades: KG-8)SUNSET RIDGE ELEMENTARY Students: 331, Location: 340 INVERNESS DR., Grades: KG-5)OCEAN SHORE ELEMENTARY Students: 262, Location: 411 OCEANA BLVD., Grades: KG-8)ORTEGA ELEMENTARY Students: 255, Location: 1283 TERRA NOVA BLVD., Grades: KG-5)LINDA MAR EDUCATIONAL CENTER Students: 18, Location: 830 ROSITA RD., Grades: KG-8)CABRILLO ELEMENTARY Location: 601 CRESPI DR., Grades: KG-8)
Private elementary/middle school in Pacifica: GOOD SHEPHERD ELEMENTARY SCHOOL Students: 203, Location: 909 OCEANA BLVD, Grades: KG-8)
See full list of schools located in Pacifica User-submitted facts and corrections:
Christian church: Coastside Community Church (coastsidechurch.org)
Notable locations in Pacifica: (A) , Trout Farm Picnic Area (B) , Sharp Park Golf Course (C) , Sanchez Branch San Mateo County Library (D) , Sanchez Adobe Museum (E) , Pacifica Branch San Mateo County Library (F) , Mildred Owen Concert Hall (G) , North County Fire Authority Station 71 (H) , North County Fire Authority Station 72 (I) . Display/hide their locations on the map
Shopping Centers: (1) , Rockaway Beach Shopping Center (2) , Pedro Point Shopping Center (3) , Park Pacifica Shopping Center (4) , Linda Mar Shopping Center (5) , Crespi Shopping Center (6) , Adobe Plaza Shopping Center (7) , Fairmont Shopping Center (8) , Palmetto Avenue Shopping Center (9) . Display/hide their locations on the map
Churches in Pacifica include: (A) , Filipino Seventh Day Adventist Church (B) , Genesis Worship Center (C) , Pacifica Baptist Church (D) , Westside Baptist Church (E) , Bethany Baptist Church (F) , Holy Cross Lutheran Church (G) , Lighthouse Christian Fellowship Church (H) , Pacifica Christian Church (I) . Display/hide their locations on the map
Lake: (A) . Display/hide its location on the map
Creeks: (A) , San Pedro Creek (B) . Display/hide their locations on the map
Parks in Pacifica include: (1) , Portola Expedition Historical Marker (2) , Sharp Park (3) , San Pedro Valley County Park (4) , Milagra Ridge County Park (5) , Pomo Park (6) , Fairmont Park (7) , Imperial Park (8) , Calera Creek Park (9) . Display/hide their locations on the map
Beaches: (A) , San Pedro Beach (B) , Rockaway Beach (C) . Display/hide their locations on the map
Hotel:
Birthplace of: Greg Reynolds - Baseball player, Kevin Gogan - Football player.
San Mateo County has a predicted average indoor radon screening level between 2 and 4 pCi/L (pico curies per liter) - Moderate Potential Average household size: This city:
2.6 peopleCalifornia:
2.9 people
Percentage of family households: This city:
69.3%Whole state:
68.7%
Percentage of households with unmarried partners: This city:
7.9%Whole state:
7.2%
Likely homosexual households (counted as self-reported same-sex unmarried-partner households)
Lesbian couples: 1.1% of all households Gay men: 0.6% of all households
People in group quarters in Pacifica in 2010:
115 people in nursing facilities/skilled-nursing facilities
50 people in group homes intended for adults
14 people in other noninstitutional facilities
3 people in in-patient hospice facilities
People in group quarters in Pacifica in 2000:
133 people in nursing homes
23 people in religious group quarters
11 people in other nonhousehold living situations
9 people in hospitals/wards and hospices for chronically ill
9 people in hospices or homes for chronically ill
5 people in other noninstitutional group quarters
Banks with branches in Pacifica (2011 data):
U.S. Bank National Association: Pacifica Branch at 1655 Oceana, branch established on 1890/01/01. Info updated 2012/01/30: Bank assets: $330,470.8 mil, Deposits: $236,091.5 mil, headquarters in Cincinnati, OH, positive income , 3121 total offices , Holding Company: U.S. Bancorp
Bank of America, National Association: Linda Mar Branch at 1375 Linda Mar Shopping Center, branch established on 1956/12/10. Info updated 2009/11/18: Bank assets: $1,451,969.3 mil, Deposits: $1,077,176.8 mil, headquarters in Charlotte, NC, positive income , 5782 total offices , Holding Company: Bank Of America Corporation
Wells Fargo Bank, National Association: Linda Mar Center Branch at 1380 Linda Mar Shopping Center, branch established on 1999/01/28. Info updated 2011/04/05: Bank assets: $1,161,490.0 mil, Deposits: $905,653.0 mil, headquarters in Sioux Falls, SD, positive income , 6395 total offices , Holding Company: Wells Fargo & Company
First National Bank of Northern California: Linda Mar Branch at 1450 Linda Mar Shopping Center, branch established on 1984/10/29. Info updated 2006/11/03: Bank assets: $715.6 mil, Deposits: $622.4 mil, headquarters in Daly City, CA, positive income , Commercial Lending Specialization, 12 total offices , Holding Company: Fnb Bancorp
For population 15 years and over in Pacifica:
Never married: 33.1%Now married: 51.8%Separated: 1.9%Widowed: 4.8%Divorced: 8.5% For population 25 years and over in Pacifica:
High school or higher: 96.0%Bachelor's degree or higher: 47.9%Graduate or professional degree: 18.3%Unemployed: 3.5%Mean travel time to work (commute): 19.9 minutes
Education Gini index (Inequality in education) Here:
10.5California average:
15.5
Religion statistics for Pacifica, CA (based on San Mateo County data)
Religion Adherents Congregations Catholic 243,634 22 Other 31,697 78 Evangelical Protestant 24,771 166 Mainline Protestant 23,840 74 Orthodox 5,350 5 Black Protestant 2,046 12 None 387,113 -
Source: Clifford Grammich, Kirk Hadaway, Richard Houseal, Dale E.Jones, Alexei Krindatch, Richie Stanley and Richard H.Taylor. 2012. 2010 U.S.Religion Census: Religious Congregations & Membership Study. Association of Statisticians of American Religious Bodies. Jones, Dale E., et al. 2002. Congregations and Membership in the United States 2000. Nashville, TN: Glenmary Research Center. Graphs represent county-level data
Food Environment Statistics: Number of grocery stores : 171San Mateo County :
2.44 / 10,000 pop.California :
2.14 / 10,000 pop.
Number of supercenters and club stores : 4San Mateo County :
0.06 / 10,000 pop.California :
0.04 / 10,000 pop.
Number of convenience stores (no gas) : 39San Mateo County :
0.56 / 10,000 pop.State :
0.62 / 10,000 pop.
Number of convenience stores (with gas) : 114San Mateo County :
1.62 / 10,000 pop.California :
1.49 / 10,000 pop.
Number of full-service restaurants : 703San Mateo County :
10.02 / 10,000 pop.California :
7.42 / 10,000 pop.
Adult obesity rate : San Mateo County :
16.9%California :
21.3%
Low-income preschool obesity rate : San Mateo County :
18.0%California :
17.9%
Health and Nutrition: Healthy diet rate : This city:
53.7%California:
49.4%
Average overall health of teeth and gums : Pacifica:
52.3%California:
48.0%
Average BMI : This city:
27.8California:
28.1
People feeling badly about themselves : This city:
18.8%California:
20.2%
People not drinking alcohol at all : Pacifica:
11.3%State:
11.2%
Average hours sleeping at night : Overweight people : Pacifica:
31.9%California:
31.5%
General health condition : Pacifica:
59.8%California:
56.4%
Average condition of hearing : Pacifica:
81.8%California:
80.9%
More about Health and Nutrition of Pacifica, CA Residents
Local government employment and payroll (March 2022)
Function
Full-time employees
Monthly full-time payroll
Average yearly full-time wage
Part-time employees
Monthly part-time payroll
Police Protection - Officers
34 $432,592 $152,680 0 $0 Sewerage
29 $297,089 $122,933 0 $0 Firefighters
25 $322,110 $154,613 0 $0 Parks and Recreation
24 $128,001 $64,001 84 $93,319 Streets and Highways
23 $181,753 $94,828 0 $0 Other and Unallocable
14 $150,795 $129,253 0 $0 Other Government Administration
12 $90,602 $90,602 1 $441 Financial Administration
7 $65,654 $112,550 0 $0 Police - Other
4 $28,717 $86,151 2 $6,196 Fire - Other
1 $6,379 $76,548 0 $0
Totals for Government
173 $1,703,691 $118,175 87 $99,955
Pacifica government finances - Expenditure in 2017 (per resident):
Construction - Sewerage: $1,729,000 ($47.35)
Local Fire Protection: $546,000 ($14.95)Police Protection: $232,000 ($6.35)Parks and Recreation: $176,000 ($4.82)Housing and Community Development: $13,000 ($0.36)Current Operations - Police Protection: $9,163,000 ($250.92)
Sewerage: $8,632,000 ($236.38)Central Staff Services: $7,173,000 ($196.43)Local Fire Protection: $5,831,000 ($159.68)Parks and Recreation: $5,310,000 ($145.41)Regular Highways: $2,599,000 ($71.17)Protective Inspection and Regulation - Other: $1,138,000 ($31.16)Parking Facilities: $502,000 ($13.75)Financial Administration: $484,000 ($13.25)Health - Other: $304,000 ($8.32)General - Other: $167,000 ($4.57)Housing and Community Development: $80,000 ($2.19)General - Interest on Debt: $3,260,000 ($89.27)
Intergovernmental to Local - Other - Police Protection: $620,000 ($16.98)
Other - Health - Other: $264,000 ($7.23)Intergovernmental to State - Elementary and Secondary Education: $108,000 ($2.96)
Other Capital Outlay - Regular Highways: $1,901,000 ($52.06)
Central Staff Services: $52,000 ($1.42)Housing and Community Development: $1,000 ($0.03)
Pacifica government finances - Revenue in 2017 (per resident):
Charges - Sewerage: $12,715,000 ($348.19)
Parks and Recreation: $2,324,000 ($63.64)Other: $2,159,000 ($59.12)Parking Facilities: $494,000 ($13.53)Federal Intergovernmental - Other: $228,000 ($6.24)
Local Intergovernmental - Other: $1,744,000 ($47.76)
Miscellaneous - General Revenue - Other: $2,749,000 ($75.28)
Interest Earnings: $946,000 ($25.91)Rents: $181,000 ($4.96)Fines and Forfeits: $165,000 ($4.52)Donations From Private Sources: $45,000 ($1.23)State Intergovernmental - Other: $843,000 ($23.09)
Highways: $756,000 ($20.70)General Local Government Support: $49,000 ($1.34)Tax - Property: $14,708,000 ($402.77)
Public Utilities Sales: $3,465,000 ($94.89)General Sales and Gross Receipts: $3,317,000 ($90.83)Other: $1,648,000 ($45.13)Other Selective Sales: $1,604,000 ($43.92)Other License: $1,553,000 ($42.53)Occupation and Business License - Other: $429,000 ($11.75)Documentary and Stock Transfer: $269,000 ($7.37)
Pacifica government finances - Debt in 2017 (per resident):
Long Term Debt - Outstanding Unspecified Public Purpose: $72,231,000 ($1978.01)
Beginning Outstanding - Unspecified Public Purpose: $51,964,000 ($1423.01)Issue, Unspecified Public Purpose: $36,780,000 ($1007.20)Retired Unspecified Public Purpose: $16,513,000 ($452.20)
Pacifica government finances - Cash and Securities in 2017 (per resident):
Bond Funds - Cash and Securities: $15,617,000 ($427.66)
Other Funds - Cash and Securities: $49,760,000 ($1362.65)
Sinking Funds - Cash and Securities: $2,745,000 ($75.17)
6.99% of this county's 2021 resident taxpayers lived in other counties in 2020 ($178,839 average adjusted gross income )
Here:
6.99%California average:
5.19%
0.01% of residents moved from foreign countries ($58 average AGI )San Mateo County:
0.01%California average:
0.03%
Top counties from which taxpayers relocated into this county between 2020 and 2021:
9.90% of this county's 2020 resident taxpayers moved to other counties in 2021 ($222,747 average adjusted gross income )
Here:
9.90%California average:
6.14%
0.01% of residents moved to foreign countries ($372 average AGI )San Mateo County:
0.01%California average:
0.02%
Top counties to which taxpayers relocated from this county between 2020 and 2021:
Businesses in Pacifica, CA
Name Count Name Count
24 Hour Fitness 1 MasterBrand Cabinets 1 7-Eleven 2 McDonald's 2 Ace Hardware 1 Payless 1 Best Western 1 RadioShack 1 Cold Stone Creamery 1 Rite Aid 2 Curves 1 Safeway 2 Dennys 1 Starbucks 4 Domino's Pizza 1 Subway 3 FedEx 3 T-Mobile 1 GameStop 1 Taco Bell 1 Goodwill 1 U-Haul 1 H&R Block 1 UPS 2 Holiday Inn 1 Vans 3 Jones New York 1 Vons 2 Kroger 1 Walgreens 1
Strongest AM radio stations in Pacifica:
KNBR (680 AM; 50 kW; SAN FRANCISCO, CA; Owner: KNBR LICO, INC.)
KTRB (860 AM; 50 kW; MODESTO, CA; Owner: PAPPAS RADIO OF CALIFORNIA, A CALIFORNIA LIMITED PARTNERSHIP)
KYCY (1550 AM; 50 kW; SAN FRANCISCO, CA; Owner: INFINITY BROADCASTING OPERATIONS, INC.)
KTCT (1050 AM; 50 kW; SAN MATEO, CA; Owner: SUSQUEHANNA RADIO CORP.)
KFAX (1100 AM; 50 kW; SAN FRANCISCO, CA; Owner: GOLDEN GATE BROADCASTING CO, INC.)
KGO (810 AM; 50 kW; SAN FRANCISCO, CA; Owner: KGO-AM RADIO, INC.)
KIQI (1010 AM; 35 kW; SAN FRANCISCO, CA; Owner: RADIO UNICA OF SAN FRANCISCO LICENSE CORP.)
KSFO (560 AM; 5 kW; SAN FRANCISCO, CA; Owner: KGO-AM RADIO, INC.)
KOIT (1260 AM; 5 kW; SAN FRANCISCO, CA; Owner: BONNEVILLE HOLDING COMPANY)
KCBS (740 AM; 50 kW; SAN FRANCISCO, CA; Owner: INFINITY BROADCASTING OPERATIONS, INC.)
KNEW (910 AM; 20 kW; OAKLAND, CA; Owner: AMFM RADIO LICENSES, L.L.C.)
KLOK (1170 AM; 50 kW; SAN JOSE, CA; Owner: ENTRAVISION HOLDINGS, LLC)
KFRC (610 AM; 5 kW; SAN FRANCISCO, CA; Owner: INFINITY BROADCASTING CORPORATION OF LOS ANGELES)
Strongest FM radio stations in Pacifica:
KFRC-FM (99.7 FM; SAN FRANCISCO, CA; Owner: INFINITY KFRC-FM, INC.)
KYLD (94.9 FM; SAN FRANCISCO, CA; Owner: AMFM RADIO LICENSES, L.L.C.)
KBLX-FM (102.9 FM; BERKELEY, CA; Owner: ICBC BROADCAST HOLDINGS - CA, INC.)
KZBR (95.7 FM; SAN FRANCISCO, CA; Owner: BONNEVILLE HOLDING COMPANY)
KMEL (106.1 FM; SAN FRANCISCO, CA; Owner: AMFM RADIO LICENSES, L.L.C.)
KSAN (107.7 FM; SAN MATEO, CA; Owner: SUSQUEHANNA RADIO CORP.)
KQED-FM (88.5 FM; SAN FRANCISCO, CA; Owner: KQED, INC.)
KITS (105.3 FM; SAN FRANCISCO, CA; Owner: INFINITY BROADCASTING OPERATIONS, INC.)
KIOI (101.3 FM; SAN FRANCISCO, CA; Owner: AMFM RADIO LICENSES, L.L.C.)
KOIT-FM (96.5 FM; SAN FRANCISCO, CA; Owner: BONNEVILLE HOLDING COMPANY)
KKSF (103.7 FM; SAN FRANCISCO, CA; Owner: AMFM RADIO LICENSES, L.L.C.)
KFOG (104.5 FM; SAN FRANCISCO, CA; Owner: KFFG LICO, INC)
KSOL (98.9 FM; SAN FRANCISCO, CA; Owner: TMS LICENSE CALIFORNIA, INC)
KALW (91.7 FM; SAN FRANCISCO, CA; Owner: SAN FRANCISCO UNIFIED SCHOOL DIST.)
KBAY (93.3 FM; SAN FRANCISCO, CA; Owner: INFINITY BROADCASTING CORP. OF SAN FRANCISCO)
KDFC-FM (102.1 FM; SAN FRANCISCO, CA; Owner: BONNEVILLE HOLDING COMPANY)
KSFB-FM (100.7 FM; SAN RAFAEL, CA; Owner: GOLDEN GATE BROADCASTING COMPANY, INC.)
KKSF-FM1 (103.7 FM; PLEASANTON, ETC., CA; Owner: AMFM RADIO LICENSES, L.L.C.)
KFRC-FM3 (99.7 FM; WALNUT CREEK, CA; Owner: INFINITY KFRC-FM, INC.)
KZBR-FM1 (95.7 FM; WALNUT CREEK, CA; Owner: BONNEVILLE HOLDING COMPANY)
TV broadcast stations around Pacifica:
KQED (Channel 9; SAN FRANCISCO, CA; Owner: KQED, INC.)
KCSM-TV (Channel 60; SAN MATEO, CA; Owner: SAN MATEO COUNTY COMMUNITY COLLEGE DISTRICT)
KGO-TV (Channel 7; SAN FRANCISCO, CA; Owner: KGO TELEVISION, INC.)
KPIX-TV (Channel 5; SAN FRANCISCO, CA; Owner: CBS BROADCASTING INC.)
KTVU (Channel 2; OAKLAND, CA; Owner: KTVU PARTNERSHIP)
KRON-TV (Channel 4; SAN FRANCISCO, CA; Owner: YOUNG BROADCASTING OF SAN FRANCISCO, INC.)
KMTP-TV (Channel 32; SAN FRANCISCO, CA; Owner: MINORITY TELEVISION PROJECT)
KBHK-TV (Channel 44; SAN FRANCISCO, CA; Owner: VIACOM TELEVISION STATIONS GROUP OF SAN FRANCISCO INC.)
KBWB (Channel 20; SAN FRANCISCO, CA; Owner: KBWB LICENSE, INC.)
KFSF (Channel 66; VALLEJO, CA; Owner: TELEFUTURA SAN FRANCISCO LLC)
KCNS (Channel 38; SAN FRANCISCO, CA; Owner: WRAY, INC.)
KTSF (Channel 26; SAN FRANCISCO, CA; Owner: LINCOLN BROADCASTING COMPANY, A CALIFORNIA LP)
KBIT-CA (Channel 28; SAN FRANCISCO, ETC., CA; Owner: POLAR BROADCASTING, INC.)
National Bridge Inventory (NBI) Statistics 14 Number of bridges213ft / 64.8m Total length263,083 Total average daily traffic6,902 Total average daily truck traffic
New bridges - historical statistics
1 1940-1949 8 1960-1969 1 1980-1989 1 1990-1999 1 2000-2009 2 2010-2019
See full National Bridge Inventory statistics for Pacifica, CA
Home Mortgage Disclosure Act Aggregated Statistics For Year 2009(Based on 5 full and 3 partial tracts) A) FHA, FSA/RHS & VA B) Conventional C) Refinancings D) Home Improvement Loans E) Loans on Dwellings For 5+ Families F) Non-occupant Loans on G) Loans On Manufactured Number Average Value Number Average Value Number Average Value Number Average Value Number Average Value Number Average Value Number Average Value
LOANS ORIGINATED 67 $486,593 204 $411,507 1,062 $334,195 54 $228,159 0 $0 57 $311,500 0 $0 APPLICATIONS APPROVED, NOT ACCEPTED 5 $452,854 31 $398,953 122 $381,602 0 $0 0 $0 8 $313,132 0 $0 APPLICATIONS DENIED 8 $545,171 36 $430,033 308 $406,731 22 $217,547 0 $0 23 $338,620 1 $76,980 APPLICATIONS WITHDRAWN 8 $638,219 22 $406,952 147 $367,084 9 $190,684 1 $999,700 12 $320,252 0 $0 FILES CLOSED FOR INCOMPLETENESS 1 $268,720 3 $392,873 52 $392,913 4 $240,328 0 $0 3 $310,333 0 $0
Aggregated Statistics For Year 2008(Based on 5 full and 3 partial tracts) A) FHA, FSA/RHS & VA B) Conventional C) Refinancings D) Home Improvement Loans E) Loans on Dwellings For 5+ Families F) Non-occupant Loans on G) Loans On Manufactured Number Average Value Number Average Value Number Average Value Number Average Value Number Average Value Number Average Value Number Average Value
LOANS ORIGINATED 19 $584,908 227 $434,469 443 $366,384 51 $226,577 8 $6,368,455 51 $307,778 1 $43,050 APPLICATIONS APPROVED, NOT ACCEPTED 2 $649,030 59 $417,229 115 $402,336 12 $170,173 0 $0 10 $340,148 2 $134,480 APPLICATIONS DENIED 5 $493,876 55 $485,867 268 $444,901 49 $323,347 0 $0 13 $493,485 0 $0 APPLICATIONS WITHDRAWN 3 $399,443 38 $432,951 104 $383,144 13 $271,175 1 $6,500,000 9 $276,161 0 $0 FILES CLOSED FOR INCOMPLETENESS 1 $741,000 11 $415,038 37 $510,333 6 $238,130 0 $0 3 $367,123 0 $0
Aggregated Statistics For Year 2007(Based on 5 full and 3 partial tracts) B) Conventional C) Refinancings D) Home Improvement Loans E) Loans on Dwellings For 5+ Families F) Non-occupant Loans on G) Loans On Manufactured Number Average Value Number Average Value Number Average Value Number Average Value Number Average Value Number Average Value
LOANS ORIGINATED 347 $460,420 825 $408,132 114 $252,987 11 $3,090,823 93 $404,565 1 $22,990 APPLICATIONS APPROVED, NOT ACCEPTED 96 $461,605 168 $445,525 23 $171,500 0 $0 14 $372,066 1 $40,000 APPLICATIONS DENIED 105 $506,185 429 $468,771 71 $309,393 1 $735,000 25 $451,849 2 $91,970 APPLICATIONS WITHDRAWN 31 $473,263 146 $459,788 22 $253,395 4 $797,390 8 $333,110 0 $0 FILES CLOSED FOR INCOMPLETENESS 14 $499,349 58 $477,119 5 $203,126 0 $0 1 $504,450 0 $0
Aggregated Statistics For Year 2006(Based on 5 full and 3 partial tracts) B) Conventional C) Refinancings D) Home Improvement Loans E) Loans on Dwellings For 5+ Families F) Non-occupant Loans on G) Loans On Manufactured Number Average Value Number Average Value Number Average Value Number Average Value Number Average Value Number Average Value
LOANS ORIGINATED 498 $437,922 971 $406,537 168 $328,923 5 $5,990,256 119 $402,444 1 $96,970 APPLICATIONS APPROVED, NOT ACCEPTED 78 $410,794 175 $435,630 22 $369,381 0 $0 24 $416,506 0 $0 APPLICATIONS DENIED 129 $441,690 356 $435,576 96 $265,536 1 $599,820 21 $427,855 3 $354,303 APPLICATIONS WITHDRAWN 46 $443,142 234 $453,715 23 $261,075 0 $0 21 $407,716 0 $0 FILES CLOSED FOR INCOMPLETENESS 14 $422,149 62 $457,079 4 $253,930 0 $0 5 $442,570 0 $0
Aggregated Statistics For Year 2005(Based on 5 full and 3 partial tracts) B) Conventional C) Refinancings D) Home Improvement Loans E) Loans on Dwellings For 5+ Families F) Non-occupant Loans on G) Loans On Manufactured Number Average Value Number Average Value Number Average Value Number Average Value Number Average Value Number Average Value
LOANS ORIGINATED 544 $435,728 1,295 $398,435 200 $295,245 11 $2,421,424 117 $362,402 2 $301,450 APPLICATIONS APPROVED, NOT ACCEPTED 110 $401,426 229 $385,078 26 $244,778 0 $0 29 $378,206 1 $74,980 APPLICATIONS DENIED 145 $429,446 420 $423,466 89 $236,206 2 $1,024,000 24 $404,123 1 $289,840 APPLICATIONS WITHDRAWN 76 $435,499 318 $383,641 45 $276,723 0 $0 16 $406,000 0 $0 FILES CLOSED FOR INCOMPLETENESS 18 $379,226 93 $382,113 10 $296,309 0 $0 5 $307,384 0 $0
Aggregated Statistics For Year 2004(Based on 5 full and 3 partial tracts) B) Conventional C) Refinancings D) Home Improvement Loans E) Loans on Dwellings For 5+ Families F) Non-occupant Loans on G) Loans On Manufactured Number Average Value Number Average Value Number Average Value Number Average Value Number Average Value Number Average Value
LOANS ORIGINATED 580 $393,971 1,468 $338,052 144 $250,918 7 $1,442,076 118 $289,064 1 $239,930 APPLICATIONS APPROVED, NOT ACCEPTED 78 $353,050 227 $333,219 18 $159,896 0 $0 10 $223,557 1 $115,970 APPLICATIONS DENIED 99 $345,355 428 $360,496 72 $167,290 0 $0 24 $261,190 1 $33,150 APPLICATIONS WITHDRAWN 50 $368,879 463 $339,201 25 $149,049 1 $769,470 10 $320,989 0 $0 FILES CLOSED FOR INCOMPLETENESS 15 $419,683 96 $369,766 7 $253,081 0 $0 3 $294,333 0 $0
Aggregated Statistics For Year 2003(Based on 5 full and 3 partial tracts) A) FHA, FSA/RHS & VA B) Conventional C) Refinancings D) Home Improvement Loans E) Loans on Dwellings For 5+ Families F) Non-occupant Loans on Number Average Value Number Average Value Number Average Value Number Average Value Number Average Value Number Average Value
LOANS ORIGINATED 2 $166,995 603 $336,137 3,427 $265,960 52 $82,842 7 $1,456,393 240 $247,721 APPLICATIONS APPROVED, NOT ACCEPTED 1 $28,000 70 $320,819 517 $285,870 11 $99,884 0 $0 30 $286,708 APPLICATIONS DENIED 1 $86,870 122 $316,360 565 $300,044 39 $60,923 2 $712,285 51 $281,966 APPLICATIONS WITHDRAWN 0 $0 65 $341,493 581 $265,760 15 $85,415 1 $399,880 22 $240,420 FILES CLOSED FOR INCOMPLETENESS 0 $0 21 $319,613 115 $294,013 5 $76,002 0 $0 11 $270,821
Aggregated Statistics For Year 2002(Based on 5 full and 3 partial tracts) A) FHA, FSA/RHS & VA B) Conventional C) Refinancings D) Home Improvement Loans E) Loans on Dwellings For 5+ Families F) Non-occupant Loans on Number Average Value Number Average Value Number Average Value Number Average Value Number Average Value Number Average Value
LOANS ORIGINATED 1 $88,000 568 $303,112 2,393 $263,402 49 $96,450 11 $1,177,130 146 $244,860 APPLICATIONS APPROVED, NOT ACCEPTED 1 $57,410 64 $328,435 385 $273,132 7 $64,280 2 $974,710 13 $202,362 APPLICATIONS DENIED 0 $0 67 $317,011 328 $281,055 27 $65,335 4 $1,542,888 15 $227,342 APPLICATIONS WITHDRAWN 0 $0 46 $303,677 447 $275,590 25 $74,342 0 $0 15 $263,438 FILES CLOSED FOR INCOMPLETENESS 0 $0 24 $326,085 127 $309,094 1 $59,190 0 $0 6 $349,348
Aggregated Statistics For Year 2001(Based on 5 full and 3 partial tracts) B) Conventional C) Refinancings D) Home Improvement Loans E) Loans on Dwellings For 5+ Families F) Non-occupant Loans on Number Average Value Number Average Value Number Average Value Number Average Value Number Average Value
LOANS ORIGINATED 484 $276,264 1,744 $261,503 134 $57,845 12 $3,757,482 118 $224,055 APPLICATIONS APPROVED, NOT ACCEPTED 56 $239,637 261 $258,699 25 $85,340 0 $0 16 $238,268 APPLICATIONS DENIED 80 $284,104 309 $265,647 58 $51,265 2 $787,765 16 $229,206 APPLICATIONS WITHDRAWN 72 $277,203 321 $260,919 29 $42,388 1 $9,885,000 14 $209,833 FILES CLOSED FOR INCOMPLETENESS 15 $267,490 85 $260,314 5 $33,536 3 $883,170 3 $228,637
Aggregated Statistics For Year 2000(Based on 5 full and 3 partial tracts) A) FHA, FSA/RHS & VA B) Conventional C) Refinancings D) Home Improvement Loans E) Loans on Dwellings For 5+ Families F) Non-occupant Loans on Number Average Value Number Average Value Number Average Value Number Average Value Number Average Value Number Average Value
LOANS ORIGINATED 0 $0 609 $265,981 525 $215,839 139 $41,096 2 $534,420 56 $228,769 APPLICATIONS APPROVED, NOT ACCEPTED 1 $117,960 79 $253,467 90 $205,996 44 $47,012 0 $0 3 $238,623 APPLICATIONS DENIED 0 $0 85 $234,016 203 $216,888 49 $55,473 1 $2,099,370 11 $216,515 APPLICATIONS WITHDRAWN 0 $0 72 $257,131 175 $200,205 18 $83,852 0 $0 8 $144,714 FILES CLOSED FOR INCOMPLETENESS 0 $0 22 $310,230 89 $253,748 4 $34,378 1 $8,048,740 2 $190,435
Aggregated Statistics For Year 1999(Based on 3 full and 5 partial tracts) A) FHA, FSA/RHS & VA B) Conventional C) Refinancings D) Home Improvement Loans E) Loans on Dwellings For 5+ Families F) Non-occupant Loans on Number Average Value Number Average Value Number Average Value Number Average Value Number Average Value Number Average Value
LOANS ORIGINATED 2 $103,130 611 $223,598 1,023 $190,446 110 $33,015 6 $14,465,852 90 $187,688 APPLICATIONS APPROVED, NOT ACCEPTED 0 $0 72 $225,290 199 $183,494 22 $33,870 0 $0 15 $158,705 APPLICATIONS DENIED 0 $0 94 $224,340 250 $194,393 31 $31,568 0 $0 17 $273,041 APPLICATIONS WITHDRAWN 2 $337,400 93 $211,141 271 $189,263 7 $29,364 2 $1,568,000 23 $178,053 FILES CLOSED FOR INCOMPLETENESS 0 $0 25 $193,642 106 $203,104 1 $312,840 2 $3,986,975 4 $234,822
Detailed HMDA statistics for the following Tracts:
6027.00
, 6028.00 , 6029.00 , 6030.00 , 6031.00 , 6032.00 , 6033.00 , 6034.00
Private Mortgage Insurance Companies Aggregated Statistics For Year 2009(Based on 5 full and 3 partial tracts) A) Conventional B) Refinancings Number Average Value Number Average Value
LOANS ORIGINATED 24 $427,633 3 $426,613 APPLICATIONS APPROVED, NOT ACCEPTED 5 $466,518 5 $451,144 APPLICATIONS DENIED 4 $445,385 4 $360,392 APPLICATIONS WITHDRAWN 1 $383,000 1 $512,970 FILES CLOSED FOR INCOMPLETENESS 1 $386,530 0 $0
Aggregated Statistics For Year 2008(Based on 5 full and 3 partial tracts) A) Conventional B) Refinancings Number Average Value Number Average Value
LOANS ORIGINATED 35 $486,855 5 $558,366 APPLICATIONS APPROVED, NOT ACCEPTED 8 $489,400 3 $425,120 APPLICATIONS DENIED 9 $399,117 0 $0 APPLICATIONS WITHDRAWN 3 $353,847 0 $0 FILES CLOSED FOR INCOMPLETENESS 0 $0 0 $0
Aggregated Statistics For Year 2007(Based on 4 full and 3 partial tracts) A) Conventional B) Refinancings C) Non-occupant Loans on Number Average Value Number Average Value Number Average Value
LOANS ORIGINATED 6 $550,850 7 $598,976 0 $0 APPLICATIONS APPROVED, NOT ACCEPTED 2 $917,630 3 $524,660 0 $0 APPLICATIONS DENIED 1 $687,310 3 $564,750 1 $687,310 APPLICATIONS WITHDRAWN 0 $0 1 $562,830 0 $0 FILES CLOSED FOR INCOMPLETENESS 0 $0 0 $0 0 $0
Aggregated Statistics For Year 2006(Based on 5 full and 3 partial tracts) A) Conventional B) Refinancings Number Average Value Number Average Value
LOANS ORIGINATED 3 $599,563 5 $585,266 APPLICATIONS APPROVED, NOT ACCEPTED 0 $0 0 $0 APPLICATIONS DENIED 0 $0 0 $0 APPLICATIONS WITHDRAWN 1 $600,000 0 $0 FILES CLOSED FOR INCOMPLETENESS 0 $0 0 $0
Aggregated Statistics For Year 2005(Based on 4 full and 1 partial tracts) A) Conventional B) Refinancings C) Non-occupant Loans on Number Average Value Number Average Value Number Average Value
LOANS ORIGINATED 1 $518,000 3 $492,963 1 $518,000 APPLICATIONS APPROVED, NOT ACCEPTED 0 $0 3 $487,197 0 $0 APPLICATIONS DENIED 0 $0 1 $563,210 0 $0 APPLICATIONS WITHDRAWN 0 $0 0 $0 0 $0 FILES CLOSED FOR INCOMPLETENESS 0 $0 1 $652,000 0 $0
Aggregated Statistics For Year 2004(Based on 5 full and 2 partial tracts) A) Conventional B) Refinancings C) Non-occupant Loans on Number Average Value Number Average Value Number Average Value
LOANS ORIGINATED 5 $483,994 9 $492,836 0 $0 APPLICATIONS APPROVED, NOT ACCEPTED 1 $457,660 2 $365,025 1 $468,000 APPLICATIONS DENIED 0 $0 1 $534,580 0 $0 APPLICATIONS WITHDRAWN 0 $0 1 $560,000 0 $0 FILES CLOSED FOR INCOMPLETENESS 0 $0 0 $0 0 $0
Aggregated Statistics For Year 2003(Based on 5 full and 3 partial tracts) A) Conventional B) Refinancings Number Average Value Number Average Value
LOANS ORIGINATED 12 $443,809 16 $403,501 APPLICATIONS APPROVED, NOT ACCEPTED 2 $479,580 4 $391,960 APPLICATIONS DENIED 0 $0 0 $0 APPLICATIONS WITHDRAWN 3 $486,007 0 $0 FILES CLOSED FOR INCOMPLETENESS 0 $0 0 $0
Aggregated Statistics For Year 2002(Based on 5 full and 3 partial tracts) A) Conventional B) Refinancings C) Non-occupant Loans on Number Average Value Number Average Value Number Average Value
LOANS ORIGINATED 15 $342,527 9 $332,102 0 $0 APPLICATIONS APPROVED, NOT ACCEPTED 5 $332,176 10 $361,570 0 $0 APPLICATIONS DENIED 0 $0 2 $443,515 0 $0 APPLICATIONS WITHDRAWN 0 $0 2 $331,400 1 $278,920 FILES CLOSED FOR INCOMPLETENESS 0 $0 0 $0 0 $0
Aggregated Statistics For Year 2001(Based on 5 full and 3 partial tracts) A) Conventional B) Refinancings C) Non-occupant Loans on Number Average Value Number Average Value Number Average Value
LOANS ORIGINATED 25 $348,171 8 $340,259 0 $0 APPLICATIONS APPROVED, NOT ACCEPTED 7 $387,270 3 $339,387 0 $0 APPLICATIONS DENIED 1 $333,040 0 $0 0 $0 APPLICATIONS WITHDRAWN 3 $390,097 2 $227,425 1 $207,160 FILES CLOSED FOR INCOMPLETENESS 0 $0 0 $0 0 $0
Aggregated Statistics For Year 2000(Based on 5 full and 3 partial tracts) A) Conventional B) Refinancings C) Non-occupant Loans on Number Average Value Number Average Value Number Average Value
LOANS ORIGINATED 72 $318,926 27 $288,448 3 $244,833 APPLICATIONS APPROVED, NOT ACCEPTED 5 $303,902 6 $286,218 1 $295,740 APPLICATIONS DENIED 1 $365,610 3 $275,330 0 $0 APPLICATIONS WITHDRAWN 2 $263,000 0 $0 0 $0 FILES CLOSED FOR INCOMPLETENESS 0 $0 0 $0 0 $0
Aggregated Statistics For Year 1999(Based on 3 full and 5 partial tracts) A) Conventional B) Refinancings C) Non-occupant Loans on Number Average Value Number Average Value Number Average Value
LOANS ORIGINATED 74 $276,286 16 $231,741 0 $0 APPLICATIONS APPROVED, NOT ACCEPTED 11 $239,943 9 $203,562 1 $112,690 APPLICATIONS DENIED 3 $252,633 2 $262,910 0 $0 APPLICATIONS WITHDRAWN 4 $295,538 3 $208,557 1 $205,920 FILES CLOSED FOR INCOMPLETENESS 0 $0 0 $0 0 $0
Detailed PMIC statistics for the following Tracts:
6027.00
, 6028.00 , 6029.00 , 6030.00 , 6031.00 , 6032.00 , 6033.00 , 6034.00
Most common first names in Pacifica, CA among deceased individuals Name Count Lived (average)
John 159 71.0 years Robert 140 68.0 years Mary 137 78.0 years William 130 72.0 years James 121 71.4 years George 86 74.4 years Joseph 75 72.9 years Helen 65 78.6 years Frank 63 72.2 years Margaret 62 77.4 years
Most common last names in Pacifica, CA among deceased individuals Last name Count Lived (average)
Smith 60 74.9 years Johnson 47 73.8 years Jones 27 75.0 years Anderson 26 76.2 years Miller 20 70.9 years Ryan 19 73.5 years Williams 18 74.1 years Lee 17 70.8 years Brown 16 74.7 years Jackson 16 69.2 years
Pacifica compared to California state average:
Median household income above state average. Median house value above state average. Unemployed percentage significantly below state average. Black race population percentage below state average. Hispanic race population percentage below state average. Median age significantly above state average. Length of stay since moving in significantly above state average. Percentage of population with a bachelor's degree or higher above state average.
#37 on the list of "Top 101 cities where residents moved in more then 10 years ago (10,000+ households)"
#39 on the list of "Top 101 cities with the largest percentage of likely lesbian couples (counted as self-reported female-female unmarried-partner households) (population 5,000+)"
#48 on the list of "Top 101 cities with the most people taking a ferryboat to work (population 5,000+)"
#75 on the list of "Top 101 cities with the most residents born in Hong Kong (population 500+)"
#77 on the list of "Top 101 cities with the largest percentage of likely homosexual households (counted as self-reported same-sex unmarried-partner households) (population 5,000+)"
#6 on the list of "Top 101 counties with the highest percentage of residents that exercised in the past month"
#8 on the list of "Top 101 counties with the highest percentage of residents that drank alcohol in the past 30 days"
#9 on the list of "Top 101 counties with the lowest Ozone (1-hour) air pollution readings in 2012 (ppm)"
#10 on the list of "Top 101 counties with the highest carbon monoxide air pollution readings in 2012 (ppm)"
#11 on the list of "Top 101 counties with the lowest average weight of females"
Top Patent Applicants
Patrick Stan (49)
John Burnier (46)
Michael Graupe (44)
Douglas Sutton (43)
Malek Faham (34)
Eric L. Stangeland (30)
Lawrence R. Mcgee (28)
Shawn M. Bauer (27)
Jonathan R. Heim (23)
Barrett Gibson Lyon (23)
Total of 1753 patent applications in 2008-2024.


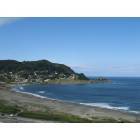
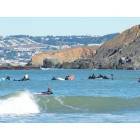

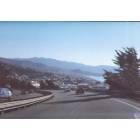
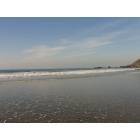
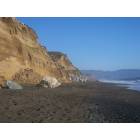
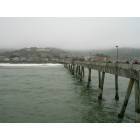
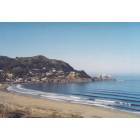
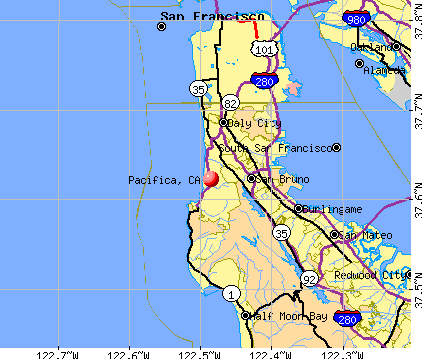


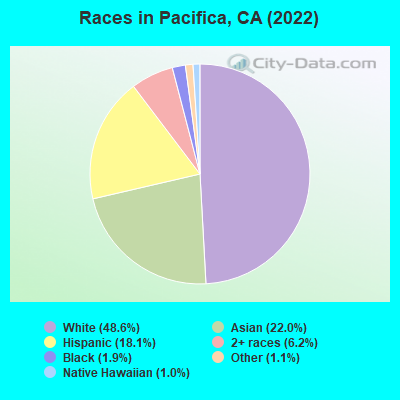
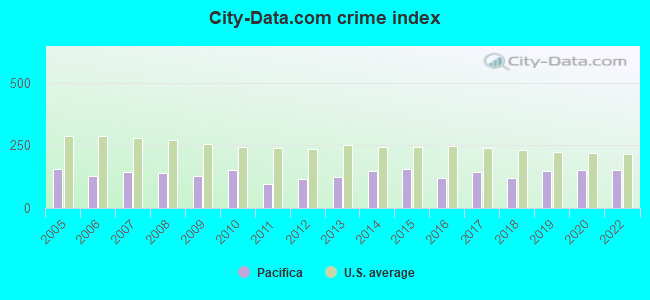
 Recent articles from our blog. Our writers, many of them Ph.D. graduates or candidates, create easy-to-read articles on a wide variety of topics.

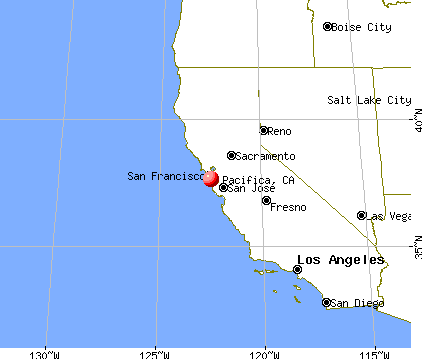
 , pop. 60,552).
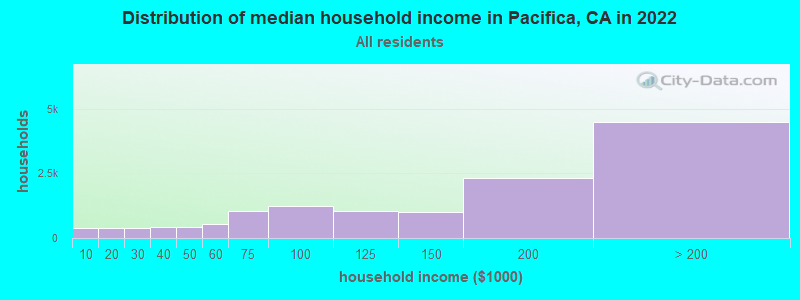
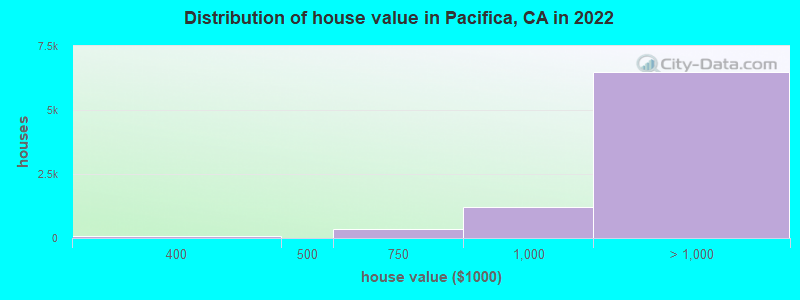
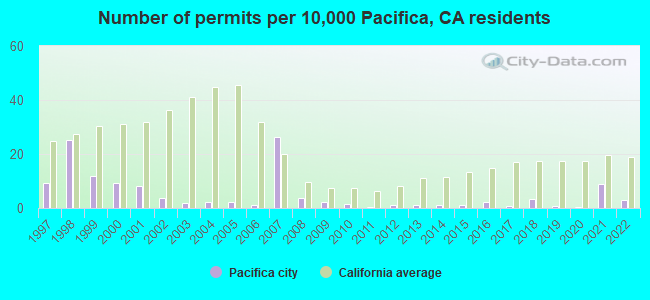
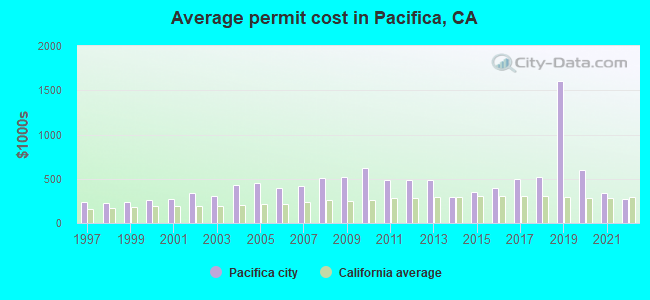
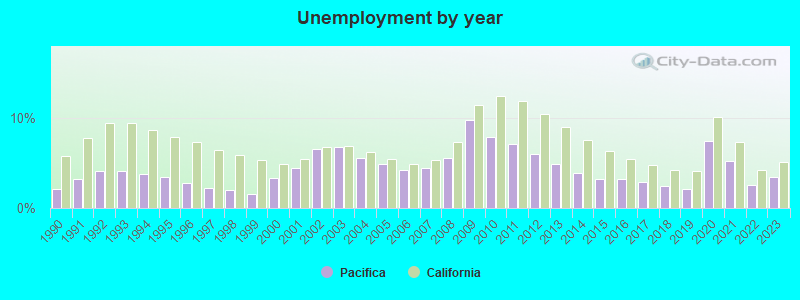
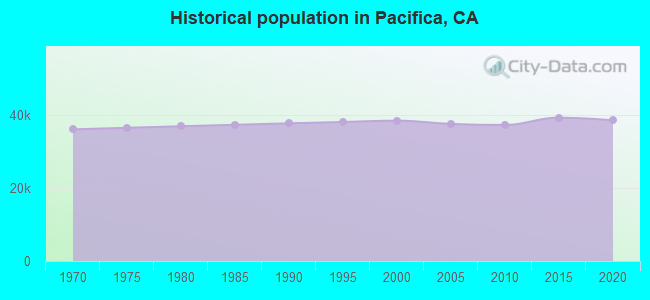
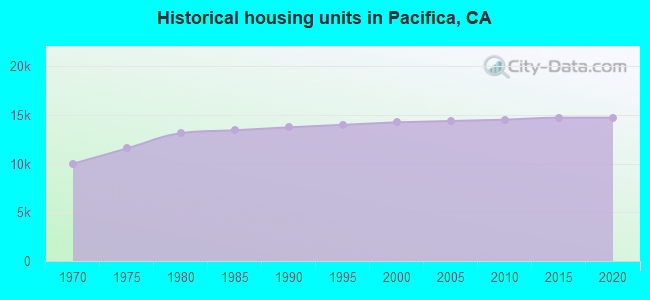
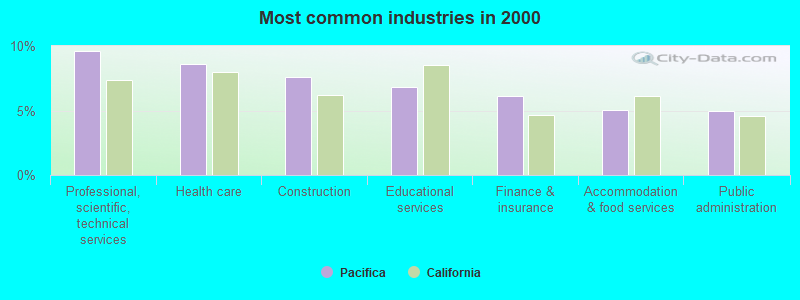
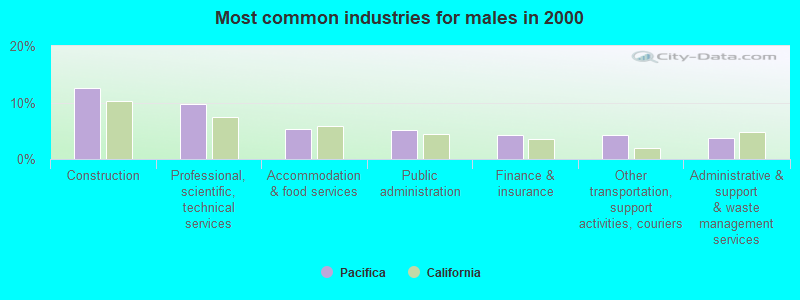
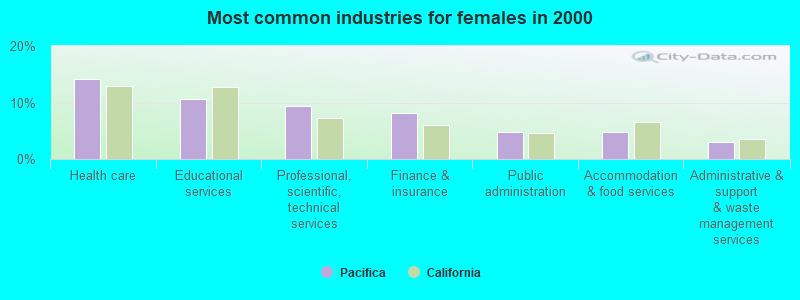
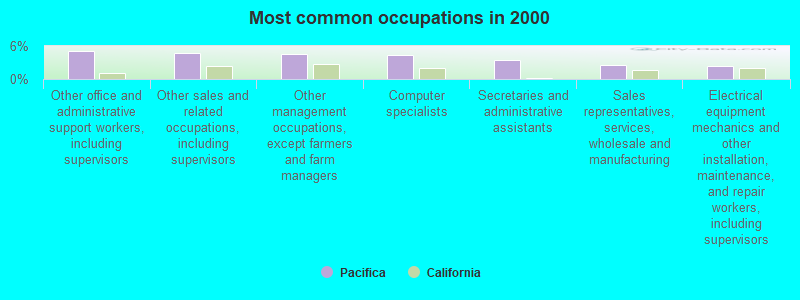
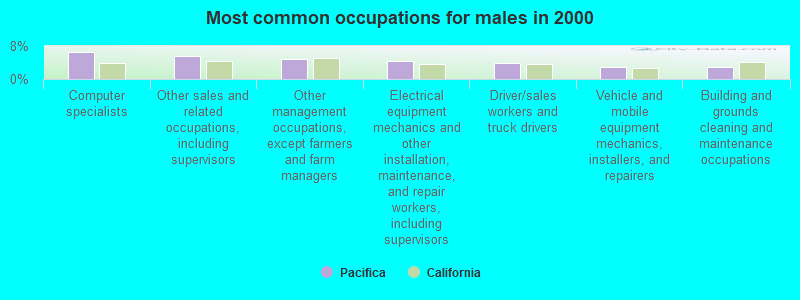
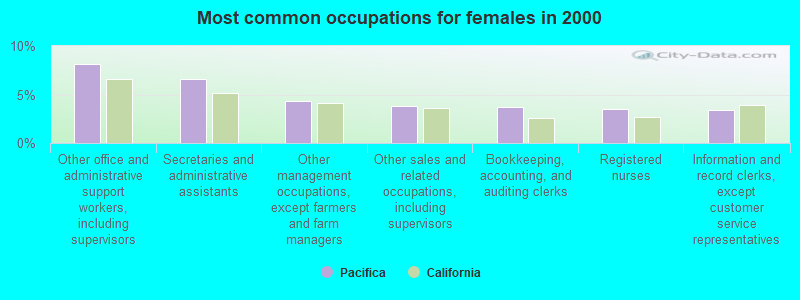
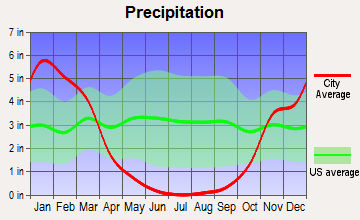
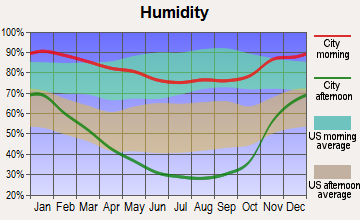
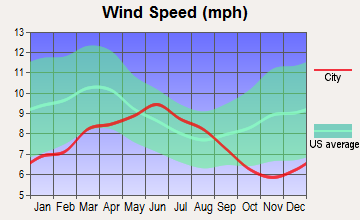
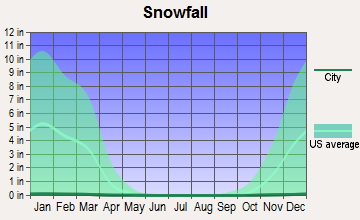
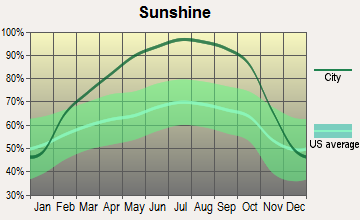
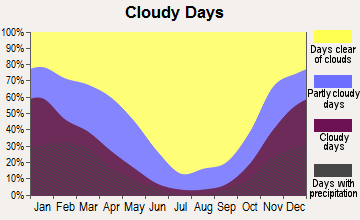

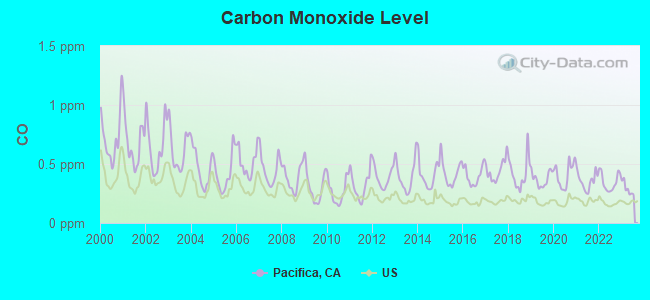
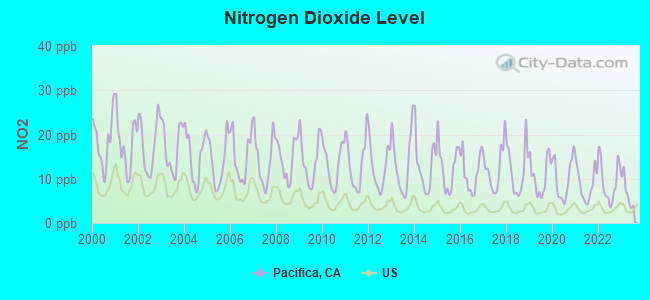
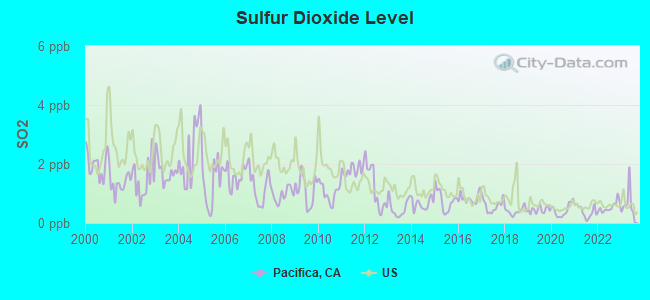
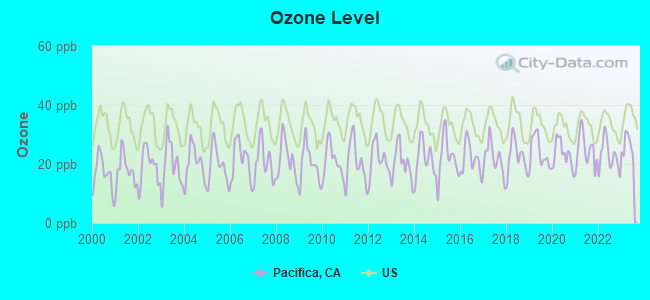

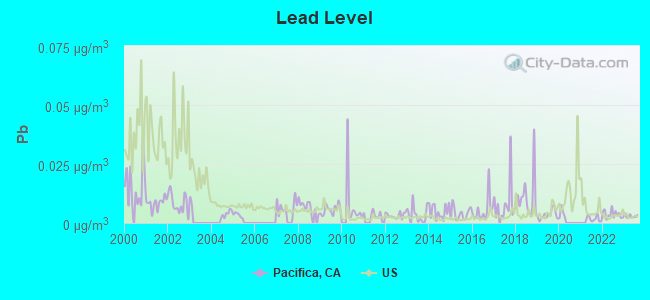
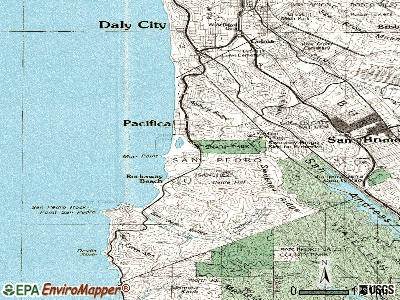
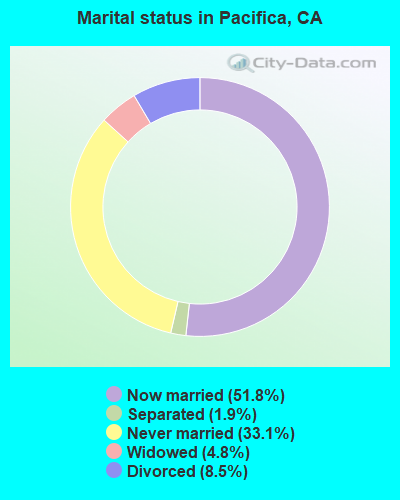
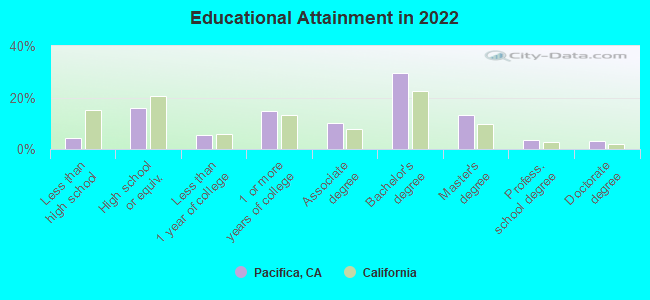
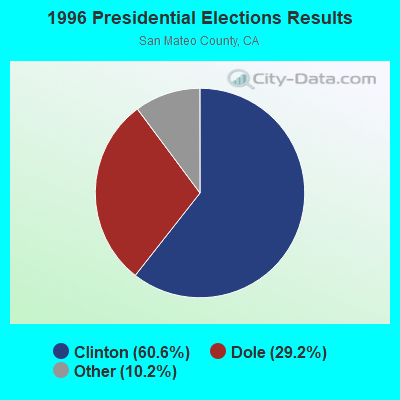
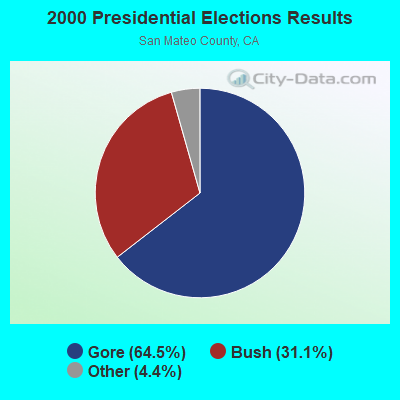
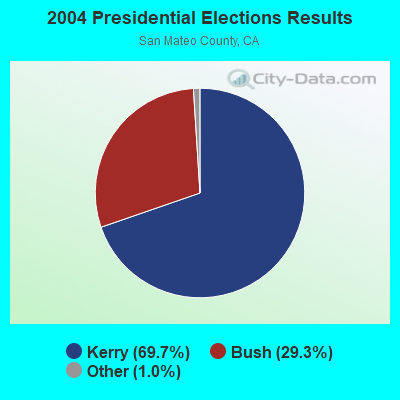

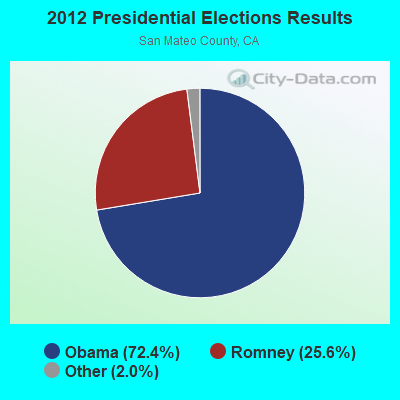
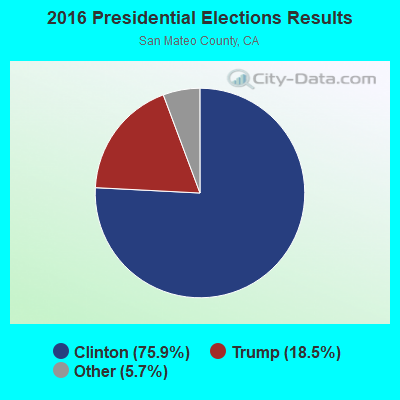
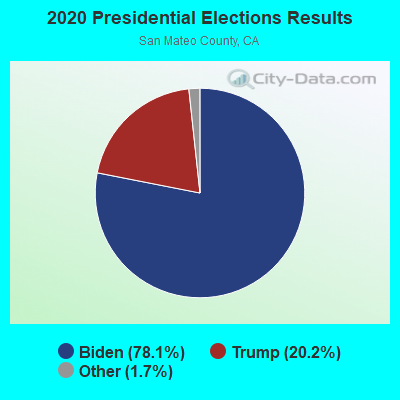
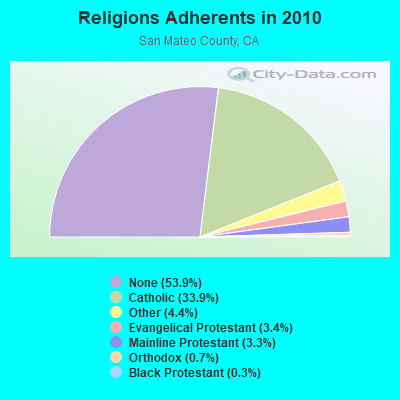
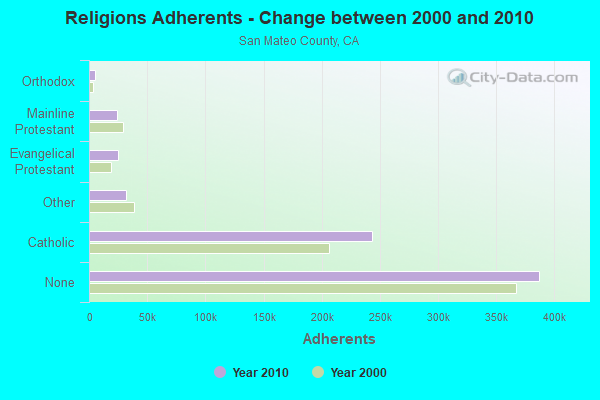
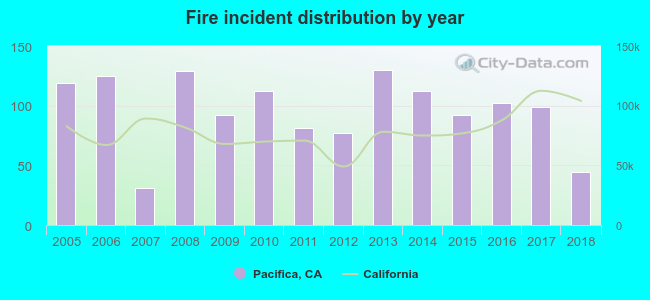 According to the data from the years 2005 - 2018 the average number of fires per year is 96. The highest number of reported fire incidents - 130 took place in 2013, and the least - 31 in 2007. The data has a declining trend.
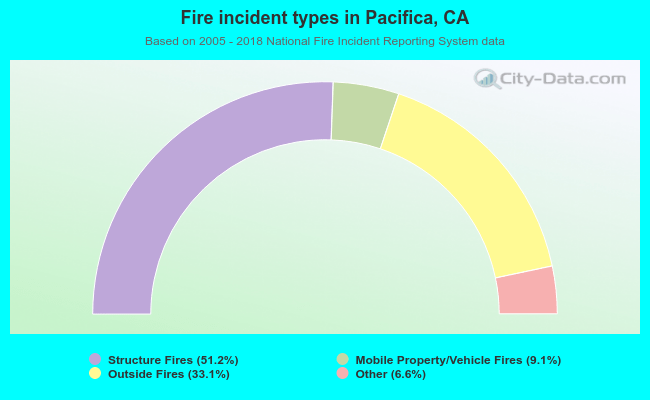 When looking into fire subcategories, the most incidents belonged to: Structure Fires (51.2%), and Outside Fires (33.1%).