Estimated zip code population in 2022: 64,543 Zip code population in 2010: 66,830 Zip code population in 2000: 63,932
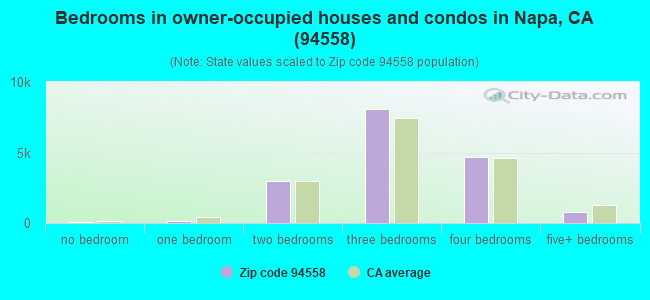
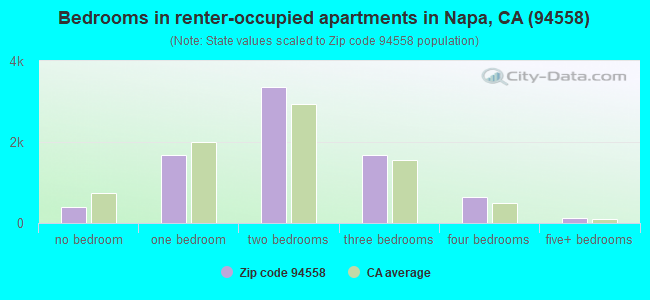
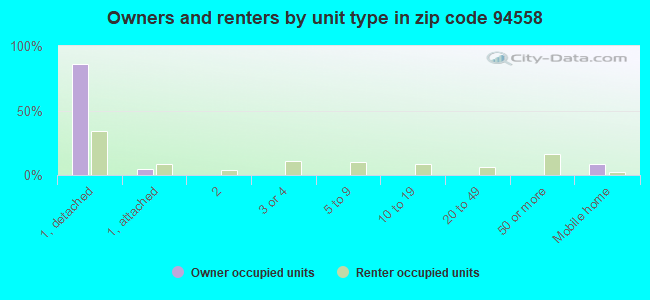
Houses and condos: 27,665 Renter-occupied apartments: 7,858
% of renters here:
32%
State:
44%
March 2022 cost of living index in zip code 94558: 118.6 (more than average, U.S. average is 100)
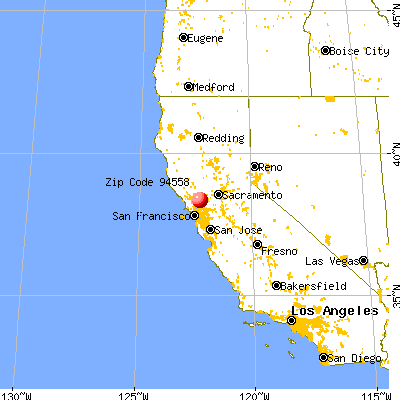
Land area: 355.8 sq. mi. Water area: 30.5 sq. mi.
Population density: 181 people per square mile
(very low).
OSM Map
General Map
Google Map
MSN Map
OSM Map
General Map
Google Map
MSN Map
OSM Map
General Map
Google Map
MSN Map
OSM Map
General Map
Google Map
MSN Map
Please wait while loading the map...
Real estate property taxes paid for housing units in 2022:
This zip code:
0.7% ($5,847)
California:
0.7% ($4,831)
Median real estate property taxes paid for housing units with mortgages in 2022: $7,001 (0.8%) Median real estate property taxes paid for housing units with no mortgage in 2022: $3,816 (0.4%)
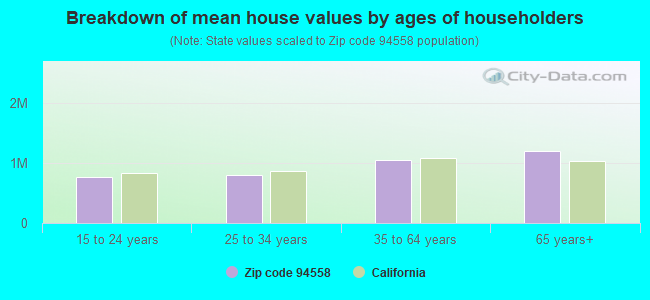
Estimated median house/condo value in 2022: $886,270
94558:
$886,270
California:
$715,900
According to our research of California and other state lists, there were 55 registered sex offenders living in 94558 zip code as of April 27, 2024. The ratio of all residents to sex offenders in zip code 94558 is 1,261 to 1. The ratio of registered sex offenders to all residents in this zip code is lower than the state average.
Median resident age:
This zip code:
45.0 years
California median age:
37.9 years
Average household size:
This zip code:
2.6 people
California:
2.8 people
Averages for the 2020 tax year for zip code 94558, filed in 2021:
Average Adjusted Gross Income (AGI) in 2020: $112,016 (Individual Income Tax Returns)
Here:
$112,016
State:
$95,910
Salary/wage: $78,578 (reported on 77.7% of returns)
Here:
$78,578
State:
$77,331
(% of AGI for various income ranges: 1468.8% for AGIs below $25k, 4368.5% for AGIs $25k-50k, 7261.2% for AGIs $50k-75k, 10616.8% for AGIs $75k-100k, 19726.1% for AGIs $100k-200k, 85997.9% for AGIs over 200k)
Taxable interest for individuals: $2,544 (reported on 41.8% of returns)
This zip code:
$2,544
California:
$2,294
(% of AGI for various income ranges: 26.7% for AGIs below $25k, 43.4% for AGIs $25k-50k, 71.2% for AGIs $50k-75k, 110.3% for AGIs $75k-100k, 258.0% for AGIs $100k-200k, 2228.4% for AGIs over 200k)
Ordinary dividends: $12,153 (reported on 25.3% of returns)
Here:
$12,153
State:
$10,949
(% of AGI for various income ranges: 55.7% for AGIs below $25k, 88.2% for AGIs $25k-50k, 173.2% for AGIs $50k-75k, 276.8% for AGIs $75k-100k, 722.0% for AGIs $100k-200k, 6997.6% for AGIs over 200k)
Net capital gain/loss in AGI: +$44,940 (reported on 23.7% of returns)
Here:
+$44,940
State:
+$49,306
(% of AGI for various income ranges: 27.1% for AGIs below $25k, 47.8% for AGIs $25k-50k, 113.2% for AGIs $50k-75k, 269.5% for AGIs $75k-100k, 828.5% for AGIs $100k-200k, 33993.6% for AGIs over 200k)
Profit/loss from business: +$25,458 (reported on 17.8% of returns)
Here:
+$25,458
State:
+$15,671
(% of AGI for various income ranges: 174.4% for AGIs below $25k, 206.3% for AGIs $25k-50k, 331.2% for AGIs $50k-75k, 475.5% for AGIs $75k-100k, 1301.8% for AGIs $100k-200k, 8446.4% for AGIs over 200k)
Taxable individual retirement arrangement distribution: $27,305 (reported on 10.7% of returns)
94558:
$27,305
California:
$23,505
(% of AGI for various income ranges: 72.2% for AGIs below $25k, 121.0% for AGIs $25k-50k, 299.1% for AGIs $50k-75k, 446.1% for AGIs $75k-100k, 1130.5% for AGIs $100k-200k, 4244.7% for AGIs over 200k)
Self-employed (Keogh) retirement plans: $27,612 (reported on 1.5% of returns)
94558:
$27,612
California:
$30,163
(% of AGI for various income ranges: 4.0% for AGIs $25k-50k, 7.3% for AGIs $50k-75k, 17.5% for AGIs $75k-100k, 93.6% for AGIs $100k-200k, 1114.9% for AGIs over 200k)
Total itemized deductions: $38,229 (reported on 19.6% of returns)
Here:
$38,229
State:
$39,517
(% of AGI for various income ranges: 160.2% for AGIs below $25k, 244.3% for AGIs $25k-50k, 651.9% for AGIs $50k-75k, 1263.0% for AGIs $75k-100k, 2685.9% for AGIs $100k-200k, 12024.8% for AGIs over 200k)
Charity contributions: $10,067 (reported on 15.3% of returns)
Here:
$10,067
State:
$12,598
(% of AGI for various income ranges: 6.7% for AGIs below $25k, 16.3% for AGIs $25k-50k, 50.3% for AGIs $50k-75k, 112.6% for AGIs $75k-100k, 324.2% for AGIs $100k-200k, 4013.3% for AGIs over 200k)
Taxes paid: $8,962 (reported on 19.4% of returns)
94558:
$8,962
State:
$8,807
(% of AGI for various income ranges: 31.1% for AGIs below $25k, 55.1% for AGIs $25k-50k, 161.8% for AGIs $50k-75k, 363.2% for AGIs $75k-100k, 766.6% for AGIs $100k-200k, 2249.8% for AGIs over 200k)
Earned income credit: $1,785 (reported on 8.1% of returns)
Here:
$1,785
State:
$2,074
(% of AGI for various income ranges: 61.7% for AGIs below $25k, 48.0% for AGIs $25k-50k, 0.8% for AGIs $50k-75k)
Percentage of individuals using paid preparers for their 2020 taxes: 90.8%
Here:
91%
State:
92%
(% for various income ranges: 87.0% for AGIs below $25k, 89.5% for AGIs $25k-50k, 91.0% for AGIs $50k-75k, 92.2% for AGIs $75k-100k, 93.7% for AGIs $100k-200k, 95.0% for AGIs over 200k)
Averages for the 2012 tax year for zip code 94558, filed in 2013:
Average Adjusted Gross Income (AGI) in 2012: $76,626 (Individual Income Tax Returns)
Here:
$76,626
State:
$72,726
Salary/wage: $59,666 (reported on 79.6% of returns)
Here:
$59,666
State:
$59,079
(% of AGI for various income ranges: 74.7% for AGIs below $25k, 74.2% for AGIs $25k-50k, 68.6% for AGIs $50k-75k, 65.9% for AGIs $75k-100k, 68.3% for AGIs $100k-200k, 47.9% for AGIs over 200k)
Taxable interest for individuals: $2,116 (reported on 42.3% of returns)
This zip code:
$2,116
California:
$2,146
(% of AGI for various income ranges: 1.2% for AGIs below $25k, 0.8% for AGIs $25k-50k, 1.1% for AGIs $50k-75k, 1.1% for AGIs $75k-100k, 0.9% for AGIs $100k-200k, 1.5% for AGIs over 200k)
Ordinary dividends: $8,680 (reported on 24.3% of returns)
Here:
$8,680
State:
$9,308
(% of AGI for various income ranges: 2.4% for AGIs below $25k, 1.7% for AGIs $25k-50k, 1.9% for AGIs $50k-75k, 2.2% for AGIs $75k-100k, 2.1% for AGIs $100k-200k, 4.1% for AGIs over 200k)
Net capital gain/loss in AGI: +$22,953 (reported on 21.1% of returns)
Here:
+$22,953
State:
+$30,460
(% of AGI for various income ranges: 0.2% for AGIs $25k-50k, 0.4% for AGIs $50k-75k, 0.8% for AGIs $75k-100k, 1.8% for AGIs $100k-200k, 16.4% for AGIs over 200k)
Profit/loss from business: +$26,514 (reported on 17.0% of returns)
Here:
+$26,514
State:
+$17,064
(% of AGI for various income ranges: 8.2% for AGIs below $25k, 4.5% for AGIs $25k-50k, 4.4% for AGIs $50k-75k, 4.4% for AGIs $75k-100k, 5.4% for AGIs $100k-200k, 7.3% for AGIs over 200k)
Taxable individual retirement arrangement distribution: $20,102 (reported on 11.8% of returns)
94558:
$20,102
California:
$19,557
(% of AGI for various income ranges: 2.7% for AGIs below $25k, 2.4% for AGIs $25k-50k, 2.9% for AGIs $50k-75k, 3.8% for AGIs $75k-100k, 3.7% for AGIs $100k-200k, 2.8% for AGIs over 200k)
Self-employment retirement plans: $24,236 (reported on 1.4% of returns)
94558:
$24,236
California:
$24,530
(% of AGI for various income ranges: 0.2% for AGIs $50k-75k, 0.2% for AGIs $75k-100k, 0.4% for AGIs $100k-200k, 0.8% for AGIs over 200k)
Total itemized deductions: $33,326 (24% of AGI, reported on 39.9% of returns)
Here:
$33,326
State:
$34,004
Here:
23.5% of AGI
State:
22.7% of AGI
(% of AGI for various income ranges: 13.5% for AGIs below $25k, 12.2% for AGIs $25k-50k, 16.3% for AGIs $50k-75k, 18.4% for AGIs $75k-100k, 20.3% for AGIs $100k-200k, 17.4% for AGIs over 200k)
Charity contributions: $3,643 (reported on 33.3% of returns)
Here:
$3,643
State:
$4,659
(% of AGI for various income ranges: 0.7% for AGIs below $25k, 0.8% for AGIs $25k-50k, 1.2% for AGIs $50k-75k, 1.5% for AGIs $75k-100k, 1.8% for AGIs $100k-200k, 2.0% for AGIs over 200k)
Taxes paid: $13,455 (reported on 39.8% of returns)
94558:
$13,455
State:
$14,448
(% of AGI for various income ranges: 2.5% for AGIs below $25k, 2.7% for AGIs $25k-50k, 4.5% for AGIs $50k-75k, 5.9% for AGIs $75k-100k, 7.8% for AGIs $100k-200k, 9.6% for AGIs over 200k)
Earned income credit: $1,955 (reported on 10.5% of returns)
Here:
$1,955
State:
$2,286
(% of AGI for various income ranges: 3.5% for AGIs below $25k, 0.7% for AGIs $25k-50k)
Percentage of individuals using paid preparers for their 2012 taxes: 60.4%
Here:
60%
State:
64%
(% for various income ranges: 51.7% for AGIs below $25k, 59.7% for AGIs $25k-50k, 63.7% for AGIs $50k-75k, 65.9% for AGIs $75k-100k, 66.2% for AGIs $100k-200k, 79.3% for AGIs over 200k)
Averages for the 2004 tax year for zip code 94558, filed in 2005:
Average Adjusted Gross Income (AGI) in 2004: $65,928 (Individual Income Tax Returns)
Here:
$65,928
State:
$58,600
Salary/wage: $53,782 (reported on 78.2% of returns)
Here:
$53,782
State:
$49,455
(% of AGI for various income ranges: 70.0% for AGIs $10k-25k, 72.6% for AGIs $25k-50k, 71.3% for AGIs $50k-75k, 72.7% for AGIs $75k-100k, 54.5% for AGIs over 100k)
Taxable interest for individuals: $2,643 (reported on 54.6% of returns)
This zip code:
$2,643
California:
$2,365
(% of AGI for various income ranges: 3.1% for AGIs $10k-25k, 2.1% for AGIs $25k-50k, 1.9% for AGIs $50k-75k, 1.8% for AGIs $75k-100k, 2.0% for AGIs over 100k)
Taxable dividends: $5,102 (reported on 31.7% of returns)
Here:
$5,102
State:
$4,746
(% of AGI for various income ranges: 2.3% for AGIs $10k-25k, 1.7% for AGIs $25k-50k, 1.7% for AGIs $50k-75k, 1.6% for AGIs $75k-100k, 2.8% for AGIs over 100k)
Net capital gain/loss: +$23,288 (reported on 26.5% of returns)
Here:
+$23,288
State:
+$23,418
(% of AGI for various income ranges: 0.2% for AGIs $10k-25k, 0.5% for AGIs $25k-50k, 0.9% for AGIs $50k-75k, 1.8% for AGIs $75k-100k, 15.8% for AGIs over 100k)
Profit/loss from business: +$23,208 (reported on 16.9% of returns)
Here:
+$23,208
State:
+$16,826
(% of AGI for various income ranges: 5.7% for AGIs $10k-25k, 4.8% for AGIs $25k-50k, 5.1% for AGIs $50k-75k, 5.3% for AGIs $75k-100k, 6.9% for AGIs over 100k)
IRA payment deduction: $3,204 (reported on 2.8% of returns)
94558:
$3,204
California:
$3,192
(% of AGI for various income ranges: 0.2% for AGIs $10k-25k, 0.3% for AGIs $25k-50k, 0.2% for AGIs $50k-75k, 0.2% for AGIs $75k-100k, 0.1% for AGIs over 100k)
Self-employed pension: $17,457 (reported on 2.4% of returns)
Here:
$17,457
California:
$17,688
(% of AGI for various income ranges: 0.1% for AGIs $10k-25k, 0.2% for AGIs $25k-50k, 0.3% for AGIs $50k-75k, 0.4% for AGIs $75k-100k, 0.9% for AGIs over 100k)
Total itemized deductions: $29,231 (25% of AGI, reported on 44.1% of returns)
Here:
$29,231
State:
$28,113
Here:
25.0% of AGI
State:
25.3% of AGI
(% of AGI for various income ranges: 15.4% for AGIs $10k-25k, 16.8% for AGIs $25k-50k, 21.1% for AGIs $50k-75k, 22.4% for AGIs $75k-100k, 18.8% for AGIs over 100k)
Charity contributions deductions: $4,003 (3% of AGI, reported on 39.3% of returns)
Here:
$4,003
State:
$3,923
Here:
3.3% of AGI
State:
3.3% of AGI
(% of AGI for various income ranges: 1.1% for AGIs $10k-25k, 1.3% for AGIs $25k-50k, 1.9% for AGIs $50k-75k, 2.1% for AGIs $75k-100k, 2.9% for AGIs over 100k)
Total tax: $12,385 (reported on 79.2% of returns)
94558:
$12,385
State:
$10,761
(% of AGI for various income ranges: 4.4% for AGIs $10k-25k, 7.0% for AGIs $25k-50k, 8.9% for AGIs $50k-75k, 10.2% for AGIs $75k-100k, 20.0% for AGIs over 100k)
Earned income credit: $1,470 (reported on 8.1% of returns)
Here:
$1,470
State:
$1,763
Percentage of individuals using paid preparers for their 2004 taxes: 63.8%
Here:
64%
State:
66%
(% for various income ranges: 52.1% for AGIs below $10k, 60.1% for AGIs $10k-25k, 63.3% for AGIs $25k-50k, 67.2% for AGIs $50k-75k, 68.2% for AGIs $75k-100k, 75.1% for AGIs over 100k)
Likely homosexual households (counted as self-reported same-sex unmarried-partner households)
Lesbian couples: 0.3% of all households
Gay men: 0.0% of all households
Household received Food Stamps/SNAP in the past 12 months: 1,117 Household did not receive Food Stamps/SNAP in the past 12 months: 23,131
Women who had a birth in the past 12 months: 721 (482 now married, 239 unmarried) Women who did not have a birth in the past 12 months: 12,794 (5,788 now married, 6,976 unmarried)
Housing units in zip code 94558 with a mortgage: 10,415 (1,342 second mortgage, 77 home equity loan, 1,104 both second mortgage and home equity loan) Houses without a mortgage: 132
Median monthly owner costs for units with a mortgage: $3,091 Median monthly owner costs for units without a mortgage: $822
Residents with income below the poverty level in 2022:
This zip code:
7.6%
Whole state:
12.2%
Residents with income below 50% of the poverty level in 2022:
This zip code:
3.8%
Whole state:
6.2%
Median number of rooms in houses and condos:
Here:
6.3
State:
6.0
Median number of rooms in apartments:
Here:
4.2
State:
3.9
Notable locations in this zip code not listed on our city pages
Notable locations in zip code 94558: Chimiles Farm Center (A), Sugarloaf Park (B), Napa State Farm (C), Circle S Ranch (D), Shake Cabin (E), Samuel Springs (F), Rancho Monticello (G), Munson Ranch (H), Lake Berryessa Park Headquarters (I), Capell Cove Boat Ramp (J), Oak Shores Park (K), South Shore Resort (L), Smittle Creek Picnic Area (M), Harris Ranch (N), Gunn Ranch (O), Mayacamas Vineyards (P), Christian Brothers Mont La Salle Vineyards (Q), Z D Winery (R), Vose Vineyards (S), Villa Mount Eden Winery (T). Display/hide their locations on the map
Shopping Centers: The Grape Yard Shopping Center (1), Silverado Plaza Shopping Center (2), Northwood Shopping Center (3), Napa Valley Shopping Center (4), Napa Convenience Center Shopping Center (5). Display/hide their locations on the map
Lakes and reservoirs: Leoma Lakes (A), Alfalfa Patch Reservoir (B), West Napa Reservoir (C), Rector Reservoir (D), Lake Berryessa (E), Milliken Reservoir (F), Lake Curry (G), Moskowitz Reservoir (H). Display/hide their locations on the map
Creeks: Browns Creek (A), Eticuera Creek (B), Jackson Creek (C), Montgomery Creek (D), Elkington Creek (E), Wragg Creek (F), Wooden Valley Creek (G), White Creek (H), Trout Creek (I). Display/hide their locations on the map
Parks in zip code 94558 include: Garfield Little League Park (1), Lake Berryessa Recreation Area (2), Alston Park (3), Klamath Park (4), Westwood Hills Park (5). Display/hide their locations on the map
8,455 married couples with children.
2,458 single-parent households (794 men, 1,664 women).
68.9% of residents of 94558 zip code speak English at home.
26.6% of residents speak Spanish at home (47% very well, 24% well, 21% not well, 8% not at all).
2.8% of residents speak other Indo-European language at home (79% very well, 17% well, 3% not well).
1.3% of residents speak Asian or Pacific Island language at home (59% very well, 29% well, 10% not well, 2% not at all).
0.4% of residents speak other language at home (74% very well, 14% well, 11% not well, 1% not at all).
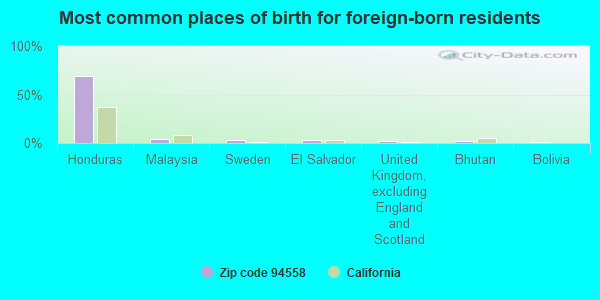
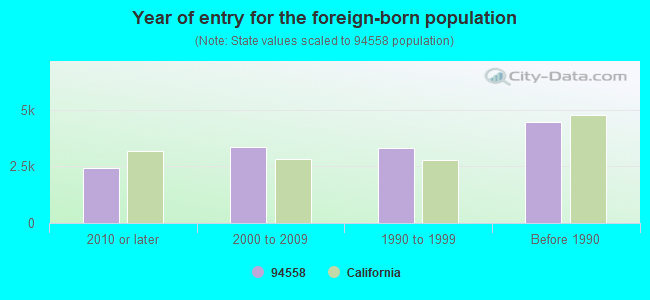
Foreign born population: 12,745 (19.7%) (50.8% of them are naturalized citizens)
Major facilities with environmental interests located in this zip code:
NAPA PIPE CORPORATION (1025 KAISER ROAD in NAPA, CA)
AIR SYNTHETIC MINOR (AIRS/AFS) SUPERFUND (Superfund database) STATE MASTER (California - Hazardous Waste Tracking) - HAZARDOU WASTE PROGRAM COMPLIANCE ACTIVITY (Tracking inspections of insecticide, fungicide, and rodenticide, and toxic substances) CRITERIA AND HAZARDOUS AIR POLLUTANT INVENTORY (Inventory of air pollution sources) Small Quantity Generators, between 100 kg and 1000 kg of hazardous waste/month (Resource Conservation and Recovery Act (tracking hazardous waste)) Small Quantity Generators, between 100 kg and 1000 kg of hazardous waste/month (Resource Conservation and Recovery Act (tracking hazardous waste)) - notification HAZARDOUS WASTE BIENNIAL REPORTER (Resource Conservation and Recovery Act (tracking hazardous waste)) Large Quantity Generators, more that 1000 kg of hazardous waste/month (Resource Conservation and Recovery Act (tracking hazardous waste)) Small Quantity Generators, between 100 kg and 1000 kg of hazardous waste/month (Resource Conservation and Recovery Act (tracking hazardous waste)) - notification USED OIL PROGRAM (Resource Conservation and Recovery Act (tracking hazardous waste)) TRI REPORTER (Tracking of toxic chemicals releasing facilities) Business SIC classification: STEEL PIPE AND TUBES; FABRICATED PLATE WORK (BOILER SHOPS); COATING, ENGRAVING, AND ALLIED SERVICES; FABRICATED PIPE AND PIPE FITTINGS Business NAICS classification: IRON AND STEEL MILLS.; FABRICATED STRUCTURAL METAL MANUFACTURING.; PLATE WORK MANUFACTURING. Organizations: NAPA VALLEY FABRICATORS LESSER (CONTACT/OWNER)
, RONALD E CARLSON (CONTACT/OWNER)
, OREGON STEEL MILLS, INC. (CONTACT/OWNER)
Alternative names: GILMORE STEEL CORP (NEW OWNER /1987), KAISER STEEL CORP NAPA PLANT, MIDWESTERN PIPELINE SERVICES, NAPA PIPE CORP., NAPA VALLEY FABRICATORS
NAPA HS (2475 JEFFERSON ST in NAPA, CA)
STATE MASTER (California - Hazardous Waste Tracking) - HAZARDOU WASTE PROGRAM (National Center for Education Statistics) - STATE ID-2835601 Small Quantity Generators, between 100 kg and 1000 kg of hazardous waste/month (Resource Conservation and Recovery Act (tracking hazardous waste)) - notification Organizations: NAPA VALLEY UN SCH DIST (CONTACT/OWNER)
, NAPA VALLEY UNIFIED (SCHOOL DISTRICT)
Alternative names: NUSD-NAPA HIGH SCHOOL
NAPA STATE HOSPITAL (2100 NAPA VALLEJO HWY in NAPA, CA)
AIR SYNTHETIC MINOR (AIRS/AFS) (Integrated Compliance Information System) - ICIS-09-2002-0169, FORMAL ENFORCEMENT ACTION COMPLIANCE ACTIVITY (Tracking inspections of insecticide, fungicide, and rodenticide, and toxic substances) CRITERIA AND HAZARDOUS AIR POLLUTANT INVENTORY (Inventory of air pollution sources) Small Quantity Generators, between 100 kg and 1000 kg of hazardous waste/month (Resource Conservation and Recovery Act (tracking hazardous waste)) - notification Business SIC classification: GENERAL MEDICAL AND SURGICAL HOSPITALS; PSYCHIATRIC HOSPITALS; ADMINISTRATION OF PUBLIC HEALTH PROGRAMS Business NAICS classification: GENERAL MEDICAL AND SURGICAL HOSPITALS. Organizations: DEVELOPMENTAL SERVICES (CONTACT/OWNER)
NOVA GROUP INCORPORATED (7411 NAPA VALLEJO HWY in NAPA, CA)
STATE MASTER (California - Hazardous Waste Tracking) - HAZARDOU WASTE PROGRAM CRITERIA AND HAZARDOUS AIR POLLUTANT INVENTORY (Inventory of air pollution sources) Large Quantity Generators, more that 1000 kg of hazardous waste/month (Resource Conservation and Recovery Act (tracking hazardous waste)) Business SIC classification: HEAVY CONSTRUCTION; SPECIAL TRADE CONTRACTORS
F P LABEL COMPANY INCORPORATED (601 AIRPARK ROAD in NAPA, CA)
CRITERIA AND HAZARDOUS AIR POLLUTANT INVENTORY (Inventory of air pollution sources) HAZARDOUS WASTE BIENNIAL REPORTER (Resource Conservation and Recovery Act (tracking hazardous waste)) (Resource Conservation and Recovery Act (tracking hazardous waste)) Large Quantity Generators, more that 1000 kg of hazardous waste/month (Resource Conservation and Recovery Act (tracking hazardous waste)) Business SIC classification: COMMERCIAL PRINTING, LITHOGRAPHIC Business NAICS classification: COMMERCIAL SCREEN PRINTING.; OTHER COMMERCIAL PRINTING. Organizations: RENAISSANCE MARK (CONTACT/OPERATOR)
, FLEMING PACKAGING CORP (CONTACT/OWNER)
Alternative names: FP LABEL CO INC, FP PORTOCORK INC, PRESSURE SENSITIVE
CALTEST LABORATORY (1885 N KELLY RD in NAPA, CA)
STATE MASTER (California - Hazardous Waste Tracking) - HAZARDOU WASTE PROGRAM Large Quantity Generators, more that 1000 kg of hazardous waste/month (Resource Conservation and Recovery Act (tracking hazardous waste))
CHARDONNAY CLEANERS (1520 TRANCAS ST in NAPA, CA)
STATE MASTER (California - Hazardous Waste Tracking) - HAZARDOU WASTE PROGRAM CRITERIA AND HAZARDOUS AIR POLLUTANT INVENTORY (Inventory of air pollution sources) Small Quantity Generators, between 100 kg and 1000 kg of hazardous waste/month (Resource Conservation and Recovery Act (tracking hazardous waste)) - notification Business SIC classification: DRYCLEANING PLANTS, EXCEPT RUG CLEANING Organizations: JACK GATLIN (CONTACT/OWNER)
Alternative names: CHARDONAY CLEANERS
JENSON MOTOR CENTER (495 SOSCOL AVE in NAPA, CA)
STATE MASTER (California - Hazardous Waste Tracking) - HAZARDOU WASTE PROGRAM CRITERIA AND HAZARDOUS AIR POLLUTANT INVENTORY (Inventory of air pollution sources) Small Quantity Generators, between 100 kg and 1000 kg of hazardous waste/month (Resource Conservation and Recovery Act (tracking hazardous waste)) - notification Business SIC classification: TOP, BODY, AND UPHOLSTERY REPAIR SHOPS AND PAINT SHOPS Organizations: ROBERT JENSON (CONTACT/OWNER)
JONERGIN PACIFIC (1901 N KELLY RD in NAPA, CA)
STATE MASTER (California - Hazardous Waste Tracking) - HAZARDOU WASTE PROGRAM CRITERIA AND HAZARDOUS AIR POLLUTANT INVENTORY (Inventory of air pollution sources) Small Quantity Generators, between 100 kg and 1000 kg of hazardous waste/month (Resource Conservation and Recovery Act (tracking hazardous waste)) Business SIC classification: COMMERCIAL PRINTING, LITHOGRAPHIC Business NAICS classification: COMMERCIAL LITHOGRAPHIC PRINTING. Organizations: JAMES PARKER (CONTACT/OPERATOR)
, SANDEEP LAL (CONTACT/OWNER)
L J MACHINE SHOP INC (954 KAISER RD in NAPA, CA)
STATE MASTER (California - Hazardous Waste Tracking) - HAZARDOU WASTE PROGRAM Small Quantity Generators, between 100 kg and 1000 kg of hazardous waste/month (Resource Conservation and Recovery Act (tracking hazardous waste)) - notification Business NAICS classification: GENERAL AUTOMOTIVE REPAIR. Organizations: JOHN GERLACH (CONTACT/OWNER)
Alternative names: LJ'S SPEED & MACHINE SHOP, INC.
NAPA CHRYSLER INCORPORATED (333 SOSCOL AVENUE in NAPA, CA)
STATE MASTER (California - Hazardous Waste Tracking) - HAZARDOU WASTE PROGRAM CRITERIA AND HAZARDOUS AIR POLLUTANT INVENTORY (Inventory of air pollution sources) Small Quantity Generators, between 100 kg and 1000 kg of hazardous waste/month (Resource Conservation and Recovery Act (tracking hazardous waste)) - notification Business SIC classification: MOTOR VEHICLE DEALERS (NEW AND USED) Organizations: PATRICK SMORRA (CONTACT/OWNER)
Alternative names: ED BARWICK CHRYSLER PLYMOUTH I, NAPA CHRYSLER PLYMOUTH
ADVANCED PRESSURE TECHNOLOGY (687 TECHNOLOGY WY in NAPA, CA) . Federal Facility
STATE MASTER (California - Hazardous Waste Tracking) - HAZARDOU WASTE PROGRAM Small Quantity Generators, between 100 kg and 1000 kg of hazardous waste/month (Resource Conservation and Recovery Act (tracking hazardous waste)) - notification Alternative names: A P TECH
ALPINA CAR CENTER (902 KAISER RD in NAPA, CA)
STATE MASTER (California - Hazardous Waste Tracking) - HAZARDOU WASTE PROGRAM Small Quantity Generators, between 100 kg and 1000 kg of hazardous waste/month (Resource Conservation and Recovery Act (tracking hazardous waste)) - notification Organizations: GABRIEL PASTRAMA (CONTACT/OWNER)
Housing units lacking complete plumbing facilities: 0.9% Housing units lacking complete kitchen facilities: 1.6%
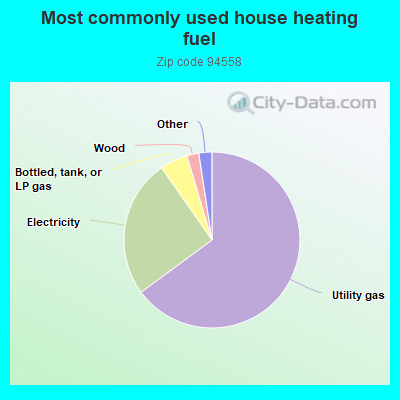
64.9%Utility gas
25.4%Electricity
5.1%Bottled, tank, or LP gas
2.2%Wood
1.0%Solar energy
0.7%No fuel used
Population in 1990: 57,901. Population change in the 1990s: +6,031 (+10.4%).
Place of birth for U.S.-born residents:
This state: 38,842
Northeast: 2,621
Midwest: 3,619
South: 2,792
West: 2,906
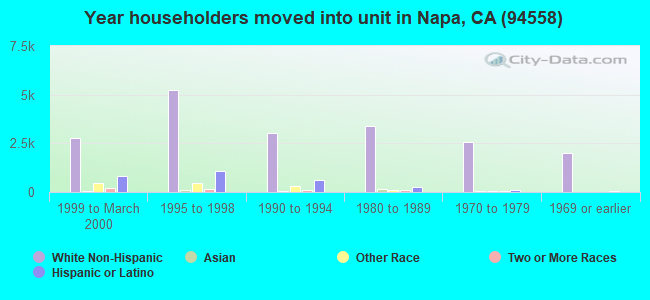
56% of the 94558 zip code residents lived in the same house 5 years ago. Out of people who lived in different houses, 61% lived in this county. Out of people who lived in different counties, 50% lived in California.
90% of the 94558 zip code residents lived in the same house 1 year ago. Out of people who lived in different houses, 48% moved from this county. Out of people who lived in different houses, 39% moved from different county within same state. Out of people who lived in different houses, 9% moved from different state. Out of people who lived in different houses, 3% moved from abroad.
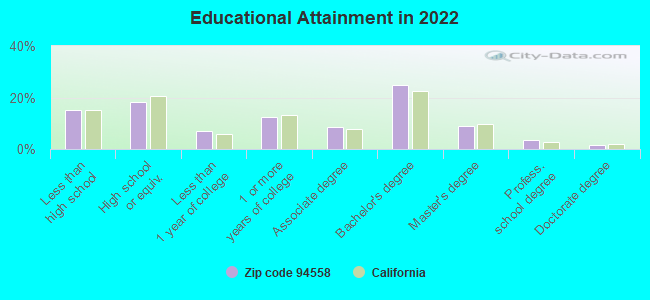
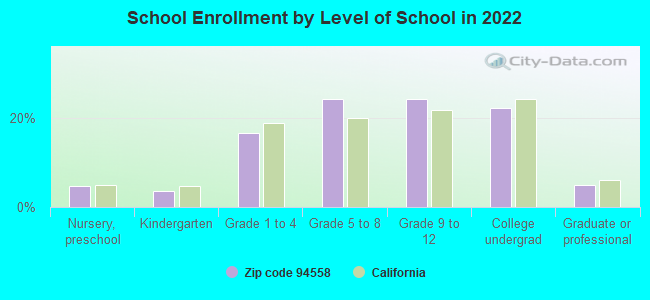
Private vs. public school enrollment:
Students in private schools in grades 1 to 8 (elementary and middle school): 765
Here:
13.6%
California:
10.5%
Students in private schools in grades 9 to 12 (high school): 355
Here:
10.6%
California:
8.5%
Students in private undergraduate colleges: 438
Here:
14.4%
California:
15.9%
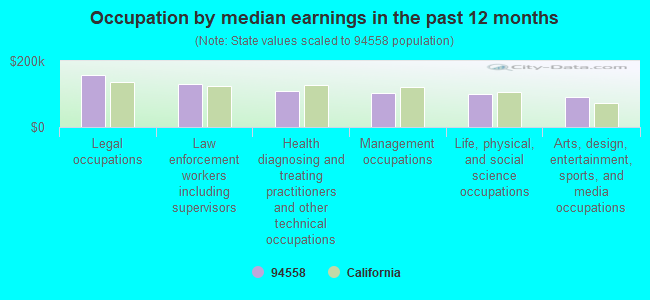
Occupation by median earnings in the past 12 months ($)
157,349Legal occupations
131,028Law enforcement workers including supervisors
108,746Health diagnosing and treating practitioners and other technical occupations
101,874Management occupations
99,077Life, physical, and social science occupations
89,883Arts, design, entertainment, sports, and media occupations
Companies with biggest federal contracts located in this zip code (NAPA, CA):
NOVA GROUP, INC (7411 NAPA-VALLEJO HWY) : $151,595,111 in 236 contractsfrom 1999 to 2006
Contracts for Maintenance, Repair or Alteration of Real Property -- Other Non-Building Facilities, Construction of Structures and Facilities -- Other Non-Building Facilities, Construction of Structures and Facilities -- Fuel Supply Facilities, Construction of Structures and Facilities -- Other Conservation and Development Facilities, and moreby Army, Navy Signed by year:2000: $1,015,933; 2001: $10,189,000; 2002: $44,344,866; 2003: $12,752,887; 2004: $18,233,651; 2005: $43,291,509; 2006: $21,759,249.
Biggest contracts:
$25,750,000 with Army for Maintenance, Repair or Alteration of Real Property -- Other Non-Building Facilities. Taking place in HI. Signed on 2002-07-30. Completion date: 2004-07-30.
$13,350,000 with Navy for Construction of Structures and Facilities -- Other Non-Building Facilities. Taking place in HI. Signed on 2005-09-20. Completion date: 2007-03-13.
$13,090,000 with Navy for Construction of Structures and Facilities -- Fuel Supply Facilities. Signed on 2005-05-31. Completion date: 2006-11-22.
$11,500,000 with Navy for Construction of Structures and Facilities -- Other Conservation and Development Facilities. Signed on 2002-09-12. Completion date: 2004-03-04.
NOVA GROUP (7411 NAPA VALLEY HWY) : $30,234,867 in 3 contractsin 2000
$30,139,094 with Navy for Construction of Structures and Facilities -- Dredging. Signed on 2000-02-18. Completion date: 2002-03-04.
$93,546 with Navy for Construction of Structures and Facilities -- Other Non-Building Facilities. Signed on 2000-09-29. Completion date: 2002-03-04.
$2,227, same as above.Signed on 2000-06-08. Completion date: 2002-03-04.
ACTUS CORPORATION (221 GATEWAY ROAD WEST, SUI) : $18,897,109 in 69 contractsfrom 1999 to 2005
Contracts for Maintenance, Repair or Alteration of Real Property -- Family Housing Facilities, Construction of Structures and Facilities -- Family Housing Facilities by Navy, Air Force Signed by year:2000: $8,444,246; 2001: $8,860,488; 2002: $570,686; 2003: $726,874; 2004: $156,119; 2005: $30,527; 2006: $0.
Biggest contracts:
$8,839,292 with Navy for Maintenance, Repair or Alteration of Real Property -- Family Housing Facilities. Signed on 2001-09-20. Completion date: 2002-09-18.
$3,830,000, same as above.Signed on 2000-08-08. Completion date: 2001-11-08.
$3,160,080, same as above.Signed on 2000-09-29. Completion date: 2001-10-08.
$695,647 with Air Force for Construction of Structures and Facilities -- Family Housing Facilities. Signed on 2000-02-23. Completion date: 2000-01-28.
DDM/NOVA, A JOINT VENTURE (7411 NAPA-VALLEJO HWY; small business) : $17,929,289 in 62 contractsfrom 2003 to 2006
Contracts for Construction of Structures and Facilities -- Other Non-Building Facilities, Maintenance, Repair or Alteration of Real Property -- Other Non-Building Facilities, Maintenance, Repair or Alteration of Real Property -- Restoration of real property, Maintenance, Repair or Alteration of Real Property -- Miscellaneous Buildings, and moreby U.S. Army Corps of Engineers - civil program financing only, Army, U.S. Coast Guard, United States Coast Guard (disused code: now 7008), and others Signed by year:2000: $0; 2001: $0; 2002: $0; 2003: $9,047,618; 2004: $6,579,677; 2005: $1,715,947; 2006: $586,047.
Biggest contracts:
$2,889,600 with U.S. Army Corps of Engineers - civil program financing only for Construction of Structures and Facilities -- Other Non-Building Facilities. Signed on 2003-09-27. Completion date: 2003-12-30.
$1,500,000 with U.S. Army Corps of Engineers - civil program financing only for Maintenance, Repair or Alteration of Real Property -- Other Non-Building Facilities. Signed on 2003-08-21. Completion date: 2003-01-28.
$1,385,763 with Army for Maintenance, Repair or Alteration of Real Property -- Restoration of real property. Signed on 2004-11-10. Completion date: 2005-12-31.
$1,385,763 with U.S. Army Corps of Engineers - civil program financing only for Maintenance, Repair or Alteration of Real Property -- Restoration of real property. Signed on 2004-11-10. Completion date: 2005-12-31.
NOVA GROUP/R E STAITE, A JOIN (7411 NAPA-VALLEJO HIGHWAY) : $14,958,304 in 52 contractsfrom 2000 to 2003
Contracts for Construction of Structures and Facilities -- Other Non-Building Facilities by Navy Signed by year:2000: $12,522,014; 2001: $1,506,989; 2002: $707,690; 2003: $221,611; 2004: $0; 2005: $0; 2006: $0.
Biggest contracts:
$11,317,706 with Navy for Construction of Structures and Facilities -- Other Non-Building Facilities. Signed on 2000-11-15. Completion date: 2002-04-14.
$1,087,719, same as above.Signed on 2000-11-28. Completion date: 2002-04-14.
$611,796, same as above.Signed on 2001-04-03. Completion date: 2002-04-14.
$554,386, same as above.Signed on 2001-04-03. Completion date: 2002-04-14.
PRISMEDICAL CORPORATION (1100 TRANCAS ST STE 250; small business) : $8,204,052 in 9 contractsfrom 2002 to 2005
Contracts for Other Defense -- Advanced Development (R&D), Other Defense -- Applied Research and Exploratory Development (R&D), Motor Vehicle Maintenance and Repair Shop Specialized Equipment, Water Purification Equipment by Navy, Defense Logistics Agency, Army Signed by year:2000: $0; 2001: $0; 2002: $949,700; 2003: $951,221; 2004: $2,734,827; 2005: $3,568,304; 2006: $0.
Biggest contracts:
$2,809,376 with Navy for Other Defense -- Advanced Development (R&D). Signed on 2005-07-25. Completion date: 2006-07-30.
$2,730,207 with Navy for Other Defense -- Applied Research and Exploratory Development (R&D). Signed on 2004-03-25. Completion date: 2005-04-30.
$951,221 with Navy for Other Defense -- Advanced Development (R&D). Signed on 2003-06-27. Completion date: 2004-06-30.
$949,700, same as above.Signed on 2002-09-26. Completion date: 2003-09-30.
NOVA DREDGING, LLC (7411 NAPA-VALLEJO HIGHWAY) : $7,351,211 in 34 contractsfrom 2001 to 2005
Contracts for Maintenance, Repair or Alteration of Real Property -- Other Non-Building Facilities, Construction of Structures and Facilities -- Dredging, Maintenance, Repair or Alteration of Real Property -- Dredging, Maintenance, Repair or Alteration of Real Property -- Miscellaneous Buildings by U.S. Army Corps of Engineers - civil program financing only, Army Signed by year:2000: $0; 2001: $1,725,000; 2002: $1,883,750; 2003: $2,178,295; 2004: $671,050; 2005: $893,116; 2006: $0.
Biggest contracts:
$1,460,000 with U.S. Army Corps of Engineers - civil program financing only for Maintenance, Repair or Alteration of Real Property -- Other Non-Building Facilities. Signed on 2002-10-08. Completion date: 2002-12-09.
$1,000,000 with Army for Construction of Structures and Facilities -- Dredging. Signed on 2005-03-02. Completion date: 2006-09-29.
$847,016 with U.S. Army Corps of Engineers - civil program financing only for Maintenance, Repair or Alteration of Real Property -- Other Non-Building Facilities. Signed on 2003-09-16. Completion date: 2002-12-09.
$825,000 with U.S. Army Corps of Engineers - civil program financing only for Maintenance, Repair or Alteration of Real Property -- Dredging. Signed on 2001-12-21. Completion date: 2002-05-07.
ACTUS CORPORATION/SUNDT CONSTR (221 GATEWAY ROAD WEST, SUI) : $6,064,185 in 59 contractsfrom 1999 to 2001
Contracts for Construction of Structures and Facilities -- Family Housing Facilities, Maintenance, Repair or Alteration of Real Property -- Family Housing Facilities, Construction of Structures and Facilities -- Penal Facilities by Navy, Army Signed by year:2000: $3,062,688; 2001: $496,621; 2002: $0; 2003: $0; 2004: $0; 2005: $0; 2006: $0.
Biggest contracts:
$1,584,672 with Navy for Construction of Structures and Facilities -- Family Housing Facilities. Signed on 1999-12-15. Completion date: 2000-06-03.
$889,932, same as above.Signed on 2000-06-23. Completion date: 2000-06-03.
$551,071, same as above.Signed on 1999-12-27. Completion date: 2000-06-03.
$393,171, same as above.Signed on 2000-08-07. Completion date: 2000-06-03.
U S EAGLE, INC (1 HIDDEN SPRINGS ROAD; small business) : $4,878,095 in 25 contractsfrom 1999 to 2006
Contracts for Custodial Janitorial Services, Trash/Garbage Collection Services - Including Portable Sanitation Services, Maintenance, Repair and Rebuilding of Equipment -- Miscellaneous, Maintenance, Repair or Alteration of Real Property -- Office Buildings by Navy, Air Force, Army Signed by year:2000: $167,310; 2001: $76,237; 2002: $1,041,531; 2003: $1,747,916; 2004: $1,003,800; 2005: $83,000; 2006: -$88,069.
Biggest contracts:
$846,370 with Navy for Custodial Janitorial Services. Signed on 1999-12-31. Completion date: 2000-06-30.
$660,000 with Air Force for Trash/Garbage Collection Services - Including Portable Sanitation Services. Signed on 2003-04-30. Completion date: 2003-12-31.
$641,531 with Air Force for Maintenance, Repair and Rebuilding of Equipment -- Miscellaneous. Signed on 2002-04-03. Completion date: 2002-04-08.
$537,916 with Air Force for Trash/Garbage Collection Services - Including Portable Sanitation Services. Taking place in UT. Signed on 2003-12-22. Completion date: 2006-01-31.
NOVA/TIC GOVERNMENT PROJECTS, (7411 NAPA-VALLEJO HIGHWAY) : $2,978,993 in 12 contractsfrom 2000 to 2003
Contracts for Maintenance, Repair or Alteration of Real Property -- Other Non-Building Facilities by Navy Signed by year:2000: $945,326; 2001: $1,433,667; 2002: $0; 2003: $600,000; 2004: $0; 2005: $0; 2006: $0.
Biggest contracts:
$1,435,053 with Navy for Maintenance, Repair or Alteration of Real Property -- Other Non-Building Facilities. Taking place in FL. Signed on 2001-02-01. Completion date: 2000-11-26.
$600,000, same as above.Signed on 2003-01-14. Completion date: 2000-11-26.
$500,000, same as above.Signed on 2000-12-18. Completion date: 2000-11-26.
$200,000, same as above.Signed on 2000-07-19. Completion date: 2000-11-26.
Top industries in this zip code by the number of employees in 2005:
Health Care and Social Assistance: Psychiatric and Substance Abuse Hospitals (over 1000 employees: 1 establishment)
Health Care and Social Assistance: General Medical and Surgical Hospitals (over 1000: 1)
Administrative and Support and Waste Management and Remediation Services: Temporary Help Services (250-499: 1, 100-249: 3, 20-49: 1, 1-4: 1)
2005 - 2018 National Fire Incident Reporting System (NFIRS) incidents
Based on the data from the years 2005 - 2018 the average number of fire incidents per year is 258. The highest number of fire incidents - 350 took place in 2007, and the least - 171 in 2012. The data has a rising trend.
When looking into fire subcategories, the most reports belonged to: Outside Fires (46.0%), and Structure Fires (32.8%).
Fire incident types reported to NFIRS in Zip Code 94558


 Nearest zip codes: 94599, 94573, 95694, 94574, 94559, 95688.


 Based on the data from the years 2005 - 2018 the average number of fire incidents per year is 258. The highest number of fire incidents - 350 took place in 2007, and the least - 171 in 2012. The data has a rising trend.
 When looking into fire subcategories, the most reports belonged to: Outside Fires (46.0%), and Structure Fires (32.8%).