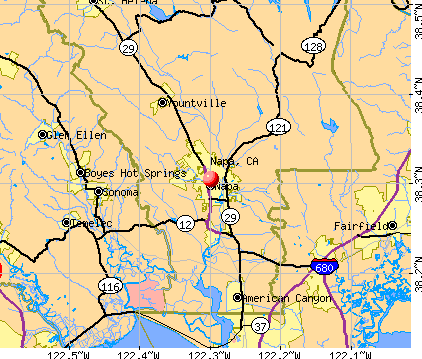
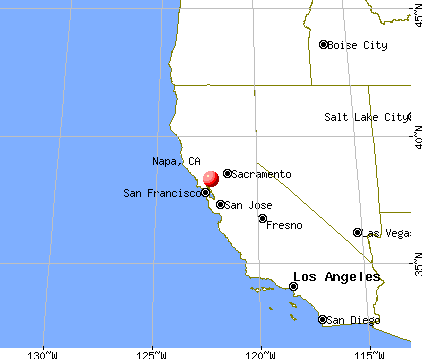
Napa, California

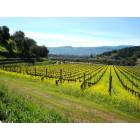
Napa: Mustard in Carneros
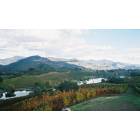
Napa: A view of Napa Valley
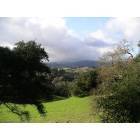
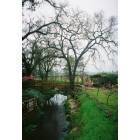
Napa: Taken in the hills west of the city of Napa
Napa: Stag's Leap district

Napa: Napa Airport
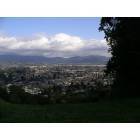
Napa: Napa from the west hills
Napa: View from Silverado Trail, Napa, CA
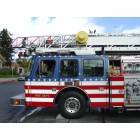
Napa: City of Napa Fire Truck
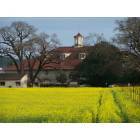
Napa: Mustard Season in Napa Valley

Napa: Porsche at Sears Point Raceway near Napa, California
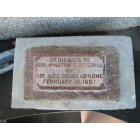
Napa: The lake during the 30s, where Memorial Stadium now stands.
- see
15
more - add
your
Submit your own pictures of this city and show them to the world
- OSM Map
- General Map
- Google Map
- MSN Map
Population change since 2000: +7.9%
 |
| Males: 39,851 | |
| Females: 38,464 |
| Median resident age: | 41.2 years |
| California median age: | 37.9 years |
Zip codes: 94559.
| Napa: | $94,248 |
| CA: | $91,551 |
Estimated per capita income in 2022: $50,133 (it was $23,642 in 2000)
Napa city income, earnings, and wages data
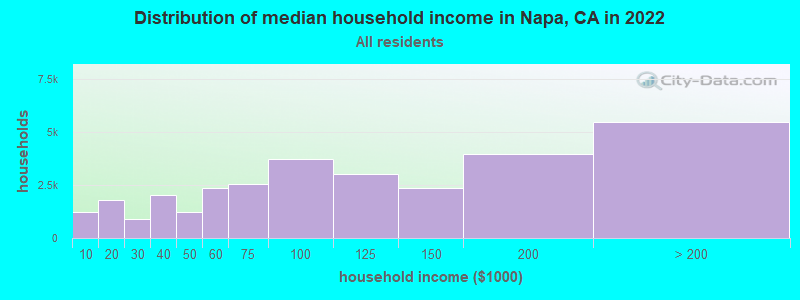
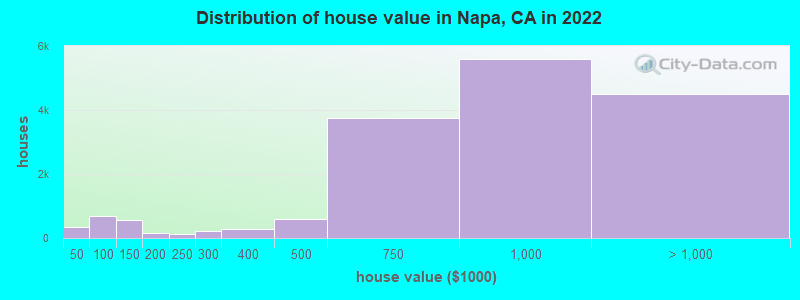
Estimated median house or condo value in 2022: $867,800 (it was $230,500 in 2000)
| Napa: | $867,800 |
| CA: | $715,900 |
Mean prices in 2022: all housing units: $902,074; detached houses: $981,248; townhouses or other attached units: $714,967; in 2-unit structures: $666,968; in 3-to-4-unit structures: $600,054; in 5-or-more-unit structures: $573,826; mobile homes: $274,057
Median gross rent in 2022: $2,051.
(4.9% for White Non-Hispanic residents, 29.2% for Black residents, 11.3% for Hispanic or Latino residents, 29.7% for American Indian residents, 10.7% for Native Hawaiian and other Pacific Islander residents, 13.2% for other race residents, 8.8% for two or more races residents)
Detailed information about poverty and poor residents in Napa, CA


Compare current foreclosures in Napa, CA:
| Photo | Address | Area | Beds / Baths | Price | Details |
|---|---|---|---|---|---|

|
#1
Terrace Dr
Napa, CA 94559
|
2,140 sq. feet
|
2 baths 4 beds |
show details | |

|
#2
Hemlock St
Napa, CA 94559
|
935 sq. feet
|
1 baths 3 beds |
show details | |

|
#3
Berry Ln
Napa, CA 94558
|
840 sq. feet
|
1 baths 3 beds |
show details | |

|
#4
Shoreline Dr
Napa, CA 94558
|
1,653 sq. feet
|
2 baths 3 beds |
show details | |

|
#5
Catalpa Ct
Napa, CA 94558
|
- sq. feet
|
3 baths 3 beds |
show details | |

|
#6
Heinke Dr
Napa, CA 94558
|
- sq. feet
|
1 baths 3 beds |
show details | |

|
#7
Cross St
Napa, CA 94559
|
- sq. feet
|
1 baths 2 beds |
show details | |

|
#8
Sierra Ave
Napa, CA 94558
|
- sq. feet
|
1 baths 3 beds |
show details | |

|
#9
Pine St
Napa, CA 94558
|
- sq. feet
|
1 baths 2 beds |
show details | |

|
#10
Dry Creek Rd
Napa, CA 94558
|
- sq. feet
|
1 baths 3 beds |
show details |
| Photo | Address | Area | Beds / Baths | Price | Details |
|---|---|---|---|---|---|

|
#11
Michelle Ct
Napa, CA 94558
|
- sq. feet
|
1 baths 2 beds |
show details | |

|
#12
Amanda Ct
Napa, CA 94559
|
- sq. feet
|
3 baths 4 beds |
show details | |

|
#13
Kilburn Ave
Napa, CA 94558
|
- sq. feet
|
1 baths 3 beds |
show details | |

|
#14
Needles Ct
Napa, CA 94559
|
- sq. feet
|
2 baths 2 beds |
show details | |

|
#15
1st Ave
Napa, CA 94558
|
- sq. feet
|
1 baths 3 beds |
show details | |

|
#16
Spencer St
Napa, CA 94559
|
- sq. feet
|
1 baths 2 beds |
show details | |

|
#17
Cayetano Dr
Napa, CA 94559
|
- sq. feet
|
2 baths 3 beds |
show details | |

|
#18
Palmer St
Napa, CA 94559
|
- sq. feet
|
3 baths 4 beds |
show details | |

|
#19
Davis Ave
Napa, CA 94559
|
- sq. feet
|
1 baths 2 beds |
show details | |

|
#20
Sonoma St
Napa, CA 94558
|
- sq. feet
|
1 baths 2 beds |
show details |
| Photo | Address | Area | Beds / Baths | Price | Details |
|---|---|---|---|---|---|

|
#21
Atlas Peak Rd # 295
Napa, CA 94558
|
- sq. feet
|
2 baths 2 beds |
show details | |

|
#22
Dry Creek Rd
Napa, CA 94558
|
- sq. feet
|
2 baths 3 beds |
show details | |

|
#23
Atlas Peak Rd # 305
Napa, CA 94558
|
- sq. feet
|
2 baths 2 beds |
show details | |

|
#24
Ellen Way
Napa, CA 94558
|
- sq. feet
|
3 baths 4 beds |
show details | |

|
#25
Hemlock St
Napa, CA 94559
|
- sq. feet
|
1 baths 3 beds |
show details | |

|
#26
Cornwall Ave
Napa, CA 94558
|
- sq. feet
|
1 baths 3 beds |
show details | |

|
#27
Lugo Ln
Napa, CA 94559
|
- sq. feet
|
1 baths 3 beds |
show details | |

|
#28
York St
Napa, CA 94559
|
- sq. feet
|
3 baths 3 beds |
show details | |

|
#29
Packard Ct
Napa, CA 94558
|
- sq. feet
|
2 baths 4 beds |
show details | |

|
#30
Soscol Ave Apt 118
Napa, CA 94558
|
- sq. feet
|
- baths - beds |
show details |
| Photo | Address | Area | Beds / Baths | Price | Details |
|---|---|---|---|---|---|

|
#31
Marina Dr
Napa, CA 94559
|
- sq. feet
|
- baths - beds |
show details | |

|
#32
Pear Tree Ln Apt 167
Napa, CA 94558
|
- sq. feet
|
- baths - beds |
show details | |

|
#33
Louisa St
Napa, CA 94558
|
- sq. feet
|
- baths - beds |
show details | |

|
#34
River Glen Dr Apt 122
Napa, CA 94558
|
- sq. feet
|
- baths - beds |
show details | |

|
#35
Silverado Trl # C
Napa, CA 94559
|
- sq. feet
|
- baths - beds |
show details | |

|
#36
6th St
Napa, CA 94559
|
- sq. feet
|
- baths - beds |
show details | |

|
#37
Fairways Dr
Napa, CA 94558
|
- sq. feet
|
- baths - beds |
show details | |

|
#38
Packard Ct
Napa, CA 94558
|
- sq. feet
|
- baths - beds |
show details | |

|
#39
Rohlffs Way
Napa, CA 94558
|
- sq. feet
|
- baths - beds |
show details | |

|
#40
Hacienda Dr
Napa, CA 94558
|
- sq. feet
|
- baths - beds |
show details |
| Photo | Address | Area | Beds / Baths | Price | Details |
|---|---|---|---|---|---|

|
#41
Hemings Ct
Napa, CA 94558
|
- sq. feet
|
- baths - beds |
show details | |

|
#42
Rohlffs Way Apt 202
Napa, CA 94558
|
- sq. feet
|
- baths - beds |
show details | |

|
#43
Trancas St Apt 231
Napa, CA 94558
|
- sq. feet
|
- baths - beds |
show details | |

|
#44
White Fir Ct
Napa, CA 94558
|
- sq. feet
|
- baths - beds |
show details | |

|
#45
Laurel St Apt 78
Napa, CA 94558
|
- sq. feet
|
- baths - beds |
show details | |

|
#46
Tade Ct
Napa, CA 94559
|
- sq. feet
|
- baths - beds |
show details | |

|
#47
Funny Cide St Apt 201
Napa, CA 94559
|
- sq. feet
|
- baths - beds |
show details | |

|
#48
3rd St Apt 10
Napa, CA 94559
|
- sq. feet
|
- baths - beds |
show details | |

|
#49
Longhorn Ridge Rd
Napa, CA 94558
|
- sq. feet
|
- baths - beds |
show details | |

|
Check over 1 million property listings on Foreclosure.com!
|
browse all offers | |||


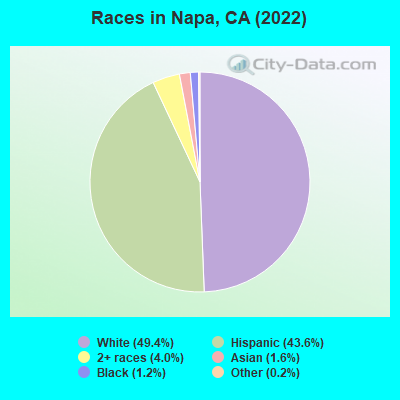
- 38,66349.4%White alone
- 34,14743.6%Hispanic
- 3,0954.0%Two or more races
- 1,2851.6%Asian alone
- 9511.2%Black alone
- 1370.2%Other race alone
- 240.03%Native Hawaiian and Other
Pacific Islander alone - 60.01%American Indian alone
According to our research of California and other state lists, there were 82 registered sex offenders living in Napa, California as of April 27, 2024.
The ratio of all residents to sex offenders in Napa is 981 to 1.
The ratio of registered sex offenders to all residents in this city is lower than the state average.
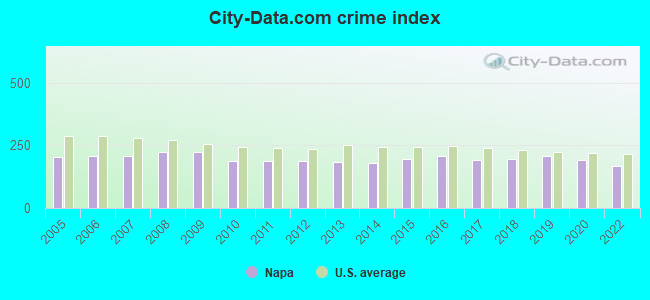
The City-Data.com crime index weighs serious crimes and violent crimes more heavily. Higher means more crime, U.S. average is 246.1. It adjusts for the number of visitors and daily workers commuting into cities.
- means the value is smaller than the state average.- means the value is about the same as the state average.
- means the value is bigger than the state average.
Crime rate in Napa detailed stats: murders, rapes, robberies, assaults, burglaries, thefts, arson
Full-time law enforcement employees in 2021, including police officers: 103 (61 officers - 56 male; 5 female).
| Officers per 1,000 residents here: | 0.79 |
| California average: | 2.30 |
 Recent articles from our blog. Our writers, many of them Ph.D. graduates or candidates, create easy-to-read articles on a wide variety of topics.

 | Is a 75-80,000 salary for a single chef enough to love on in the napa area? (10 replies) |
| Wine tasting in Napa/Sonoma versus Paso Robles (23 replies) |
| Fires in Napa and Sonoma (272 replies) |
| Housing close to Napa CA (21 replies) |
| Places in California that meet my criteria? (60 replies) |
| Visiting San Francisco and Napa (8 replies) |
Latest news from Napa, CA collected exclusively by city-data.com from local newspapers, TV, and radio stations
Ancestries: European (8.7%), German (4.6%), English (4.1%), American (3.8%), Irish (3.7%), Italian (3.3%).
Current Local Time: PST time zone
Elevation: 17 feet
Land area: 17.7 square miles.
Population density: 4,425 people per square mile (average).
16,360 residents are foreign born (16.5% Latin America).
| This city: | 21.1% |
| California: | 26.5% |
Median real estate property taxes paid for housing units with mortgages in 2022: $6,860 (0.8%)
Median real estate property taxes paid for housing units with no mortgage in 2022: $4,036 (0.5%)
Nearest city with pop. 200,000+: West Contra Costa, CA (24.2 miles  , pop. 236,008).
Nearest city with pop. 1,000,000+: Los Angeles, CA (364.7 miles , pop. 3,694,820).
Nearest cities:
), ), ), Latitude: 38.30 N, Longitude: 122.30 W
Daytime population change due to commuting: -2,368 (-3.0%)
Workers who live and work in this city: 21,817 (57.2%)
Area code: 707

Napa tourist attractions:
- American Center for Wine, Food & the Arts - Napa, California - Center Now Closed
- Napa River Inn
- Cakebread Cellars
- The Westin Verasa, Napa
- Silverado Resort
- Ceja Vineyards, Napa
- Chardonnay Golf Club, Napa
- Chateau Potelle, Napa
- Chimney Rock Winery, Napa
- Andretti Winery
- Elizabeth Spencer Wines
- Far Niente Winery
- Farmer's Markets in Napa
- Flora Springs
- Cliff Lake
- Clos Du Val Winery
- Cosentino Winery Yountville
- Del Dotto Vineyards & Winery
- Domaine Carneros
- Domaine Chandon, Yountville
- Luna Vineyards
- Niebaum-Coppola Winery
- Napa Valley Marriott Hotel & Spa
- Joseph Phelps Vineyards
- Juniper Lake
- Kings Creek Falls
- Mumm Napa
- Napa Factory Stores
- Napa Golf Course at Kennedy Park
- Napa Valley Bike Tours
- River Terrace Inn
- Napa Valley Conference and Visitors Bureau
- Napa Valley Museum
- Napa Valley Opera House
- Napa Valley Symphony
- Napa Valley Wine Train
- Artesa Winery
- Beau Wine Tours
- Napa River Inn
- Vino Bello Resort
- NV Hoppers
- Oakville Grade
- O'Brien Estate Winery
- Pine Ridge Winery
- Quent Cordair Fine Art
- AVIA Napa
- Pride Mountain Vineyards
- Peju Province Winery
- The White Sulphur Springs Retreat and Spa
- Westwood Hills Park
- William Hill Winery
- St. Helena Market Place
- St. Helena Olive Oil Company
- St. Supery Winery
- Sterling
- Swanson Vineyards Salon
- The di Rosa Preserve: Art and Nature
- Taste at Oxbow
- The Hess Collection
- River Pointe
- Vintner's Collective
- Trefethen Vineyards
- Robert Mondavi Winery
- Robert Sinskey Vineyards
- Rombauer Winery
- Round Pond
- Rubicon Estate
- Hilton Garden Inn Napa
- Rutherford Hill Winery
- Silo's Jazz Club at the Napa River Inn
- Skyline Wilderness Park
- Best Western Elm House Inn
Napa, California accommodation & food services, waste management - Economy and Business Data
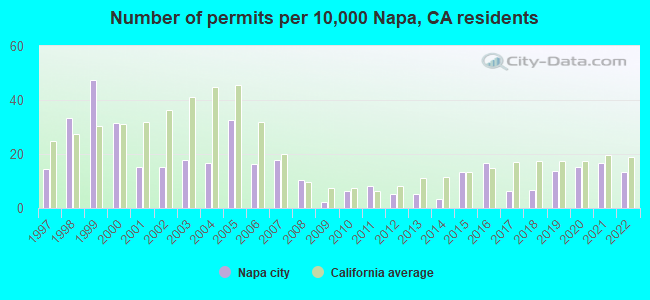
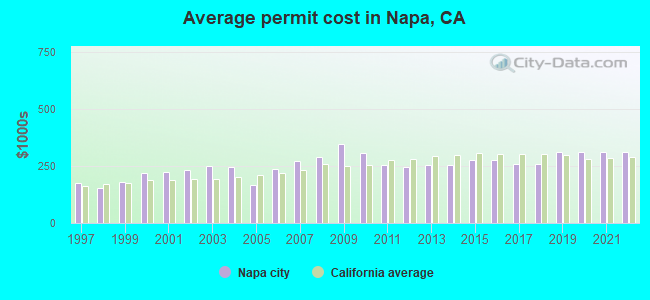
Single-family new house construction building permits:
- 2022: 97 buildings, average cost: $314,000
- 2021: 120 buildings, average cost: $314,000
- 2020: 109 buildings, average cost: $314,000
- 2019: 100 buildings, average cost: $314,000
- 2018: 49 buildings, average cost: $260,100
- 2017: 46 buildings, average cost: $260,100
- 2016: 122 buildings, average cost: $276,700
- 2015: 98 buildings, average cost: $276,700
- 2014: 25 buildings, average cost: $254,600
- 2013: 38 buildings, average cost: $256,100
- 2012: 37 buildings, average cost: $245,900
- 2011: 58 buildings, average cost: $253,600
- 2010: 46 buildings, average cost: $307,000
- 2009: 17 buildings, average cost: $346,300
- 2008: 75 buildings, average cost: $289,000
- 2007: 129 buildings, average cost: $272,100
- 2006: 119 buildings, average cost: $237,200
- 2005: 237 buildings, average cost: $167,800
- 2004: 121 buildings, average cost: $245,600
- 2003: 128 buildings, average cost: $250,700
- 2002: 109 buildings, average cost: $231,700
- 2001: 110 buildings, average cost: $225,400
- 2000: 228 buildings, average cost: $217,600
- 1999: 343 buildings, average cost: $181,000
- 1998: 241 buildings, average cost: $156,300
- 1997: 105 buildings, average cost: $175,600
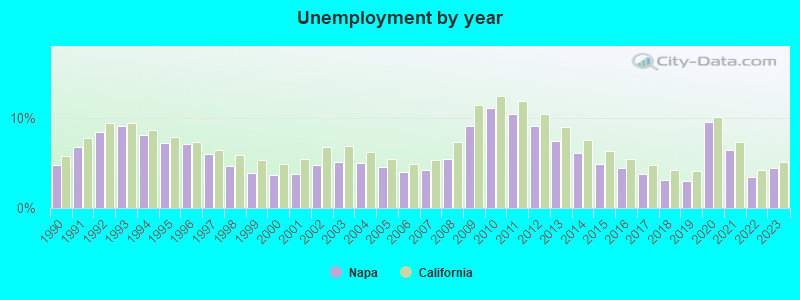
| Here: | 4.4% |
| California: | 5.1% |
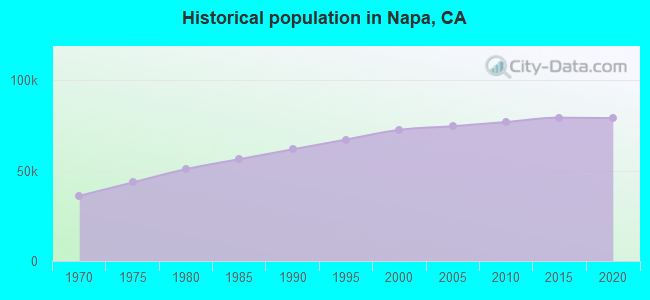
Population change in the 1990s: +9,876 (+15.7%).
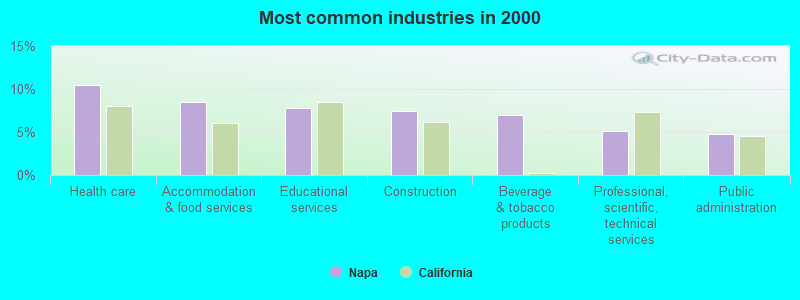
- Health care (10.5%)
- Accommodation & food services (8.5%)
- Educational services (7.8%)
- Construction (7.4%)
- Beverage & tobacco products (7.0%)
- Professional, scientific, technical services (5.1%)
- Public administration (4.8%)
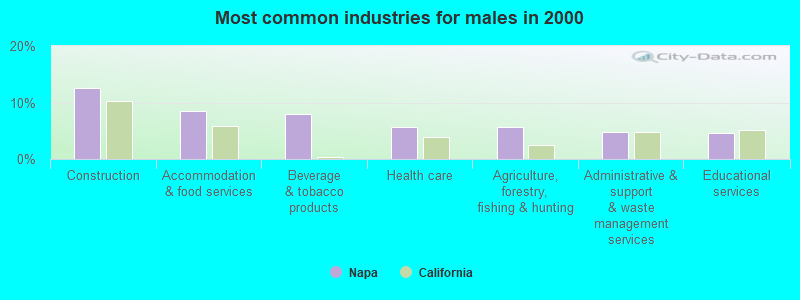
- Construction (12.5%)
- Accommodation & food services (8.4%)
- Beverage & tobacco products (8.0%)
- Health care (5.6%)
- Agriculture, forestry, fishing & hunting (5.6%)
- Administrative & support & waste management services (4.8%)
- Educational services (4.6%)
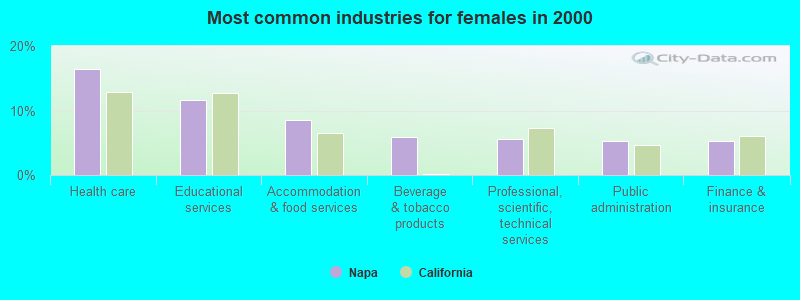
- Health care (16.5%)
- Educational services (11.6%)
- Accommodation & food services (8.5%)
- Beverage & tobacco products (5.9%)
- Professional, scientific, technical services (5.6%)
- Public administration (5.3%)
- Finance & insurance (5.2%)
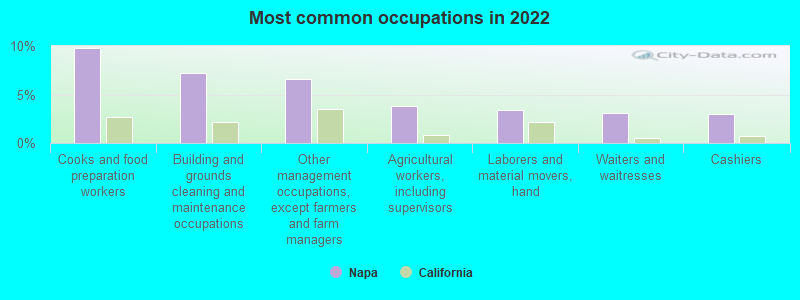
- Cooks and food preparation workers (9.8%)
- Building and grounds cleaning and maintenance occupations (7.2%)
- Other management occupations, except farmers and farm managers (6.6%)
- Agricultural workers, including supervisors (3.8%)
- Laborers and material movers, hand (3.4%)
- Waiters and waitresses (3.1%)
- Cashiers (3.0%)
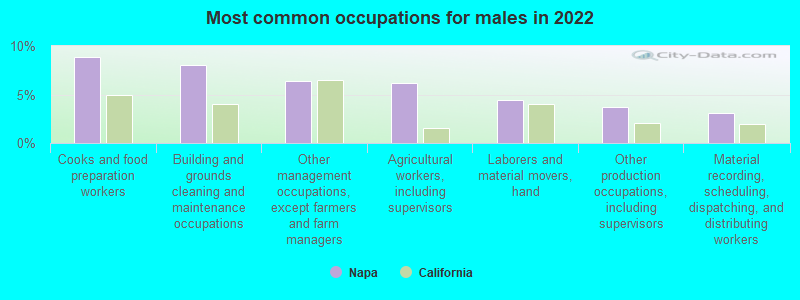
- Cooks and food preparation workers (8.8%)
- Building and grounds cleaning and maintenance occupations (8.0%)
- Other management occupations, except farmers and farm managers (6.3%)
- Agricultural workers, including supervisors (6.2%)
- Laborers and material movers, hand (4.4%)
- Other production occupations, including supervisors (3.7%)
- Material recording, scheduling, dispatching, and distributing workers (3.1%)
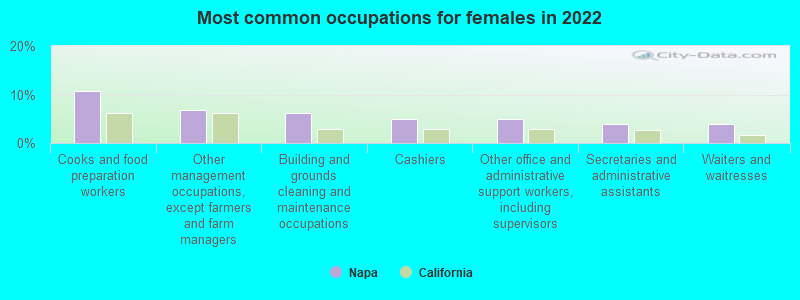
- Cooks and food preparation workers (10.8%)
- Other management occupations, except farmers and farm managers (6.9%)
- Building and grounds cleaning and maintenance occupations (6.2%)
- Cashiers (5.0%)
- Other office and administrative support workers, including supervisors (4.9%)
- Secretaries and administrative assistants (3.9%)
- Waiters and waitresses (3.8%)
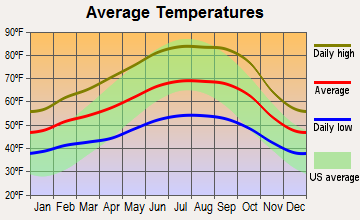
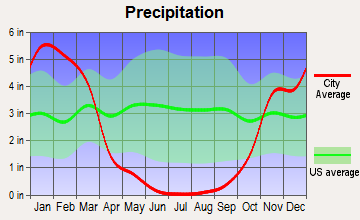
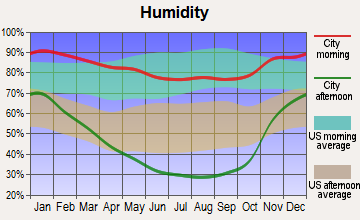
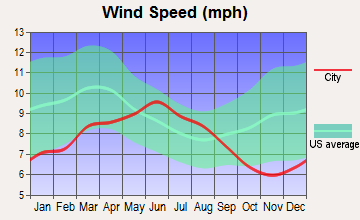
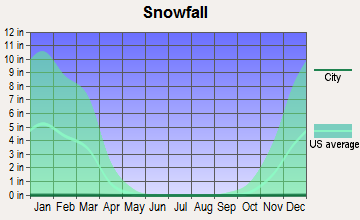
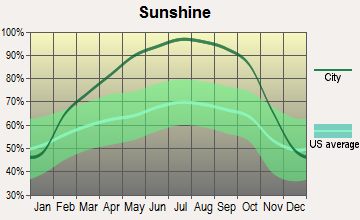
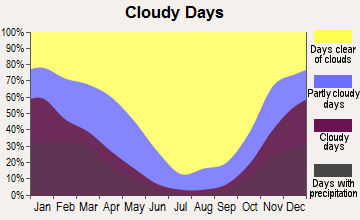
Average climate in Napa, California
Based on data reported by over 4,000 weather stations
|
|

(lower is better)
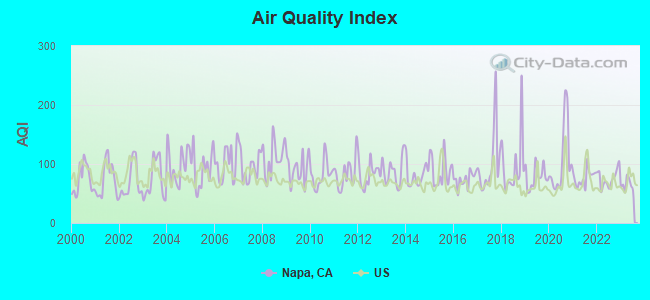
Air Quality Index (AQI) level in 2023 was 64.9. This is about average.
| City: | 64.9 |
| U.S.: | 72.6 |
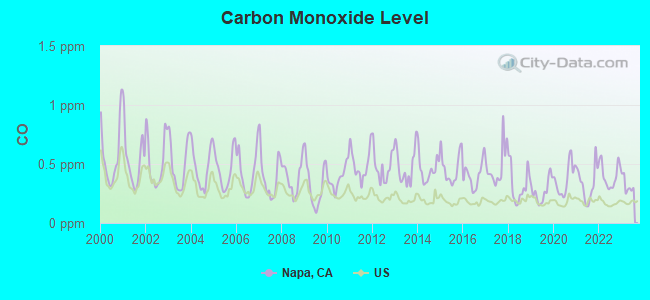
Carbon Monoxide (CO) [ppm] level in 2023 was 0.320. This is worse than average. Closest monitor was 0.5 miles away from the city center.
| City: | 0.320 |
| U.S.: | 0.251 |
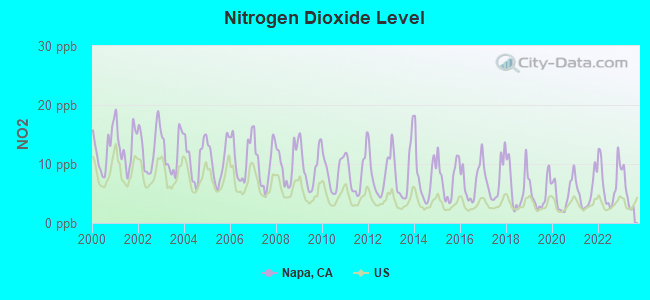
Nitrogen Dioxide (NO2) [ppb] level in 2023 was 5.29. This is about average. Closest monitor was 0.5 miles away from the city center.
| City: | 5.29 |
| U.S.: | 5.11 |
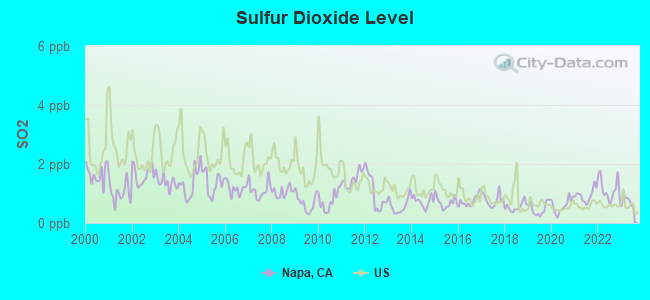
Sulfur Dioxide (SO2) [ppb] level in 2023 was 0.739. This is significantly better than average. Closest monitor was 0.5 miles away from the city center.
| City: | 0.739 |
| U.S.: | 1.515 |
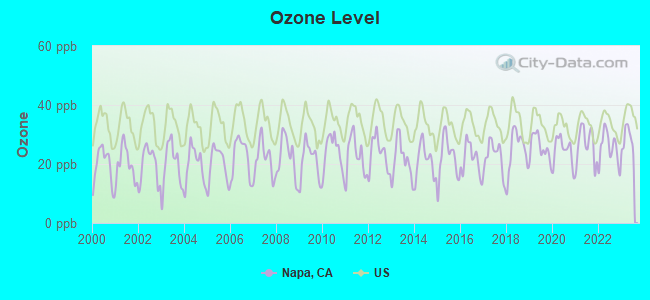
Ozone [ppb] level in 2023 was 28.5. This is about average. Closest monitor was 0.5 miles away from the city center.
| City: | 28.5 |
| U.S.: | 33.3 |
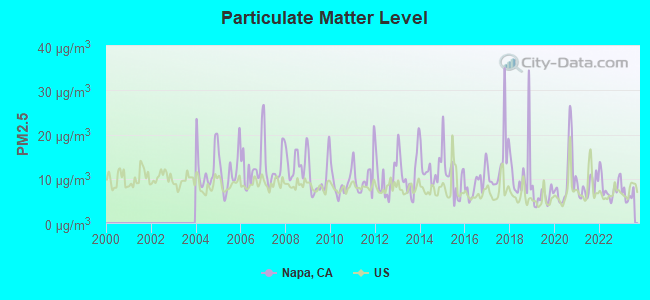
Particulate Matter (PM2.5) [µg/m3] level in 2023 was 6.30. This is better than average. Closest monitor was 0.5 miles away from the city center.
| City: | 6.30 |
| U.S.: | 8.11 |
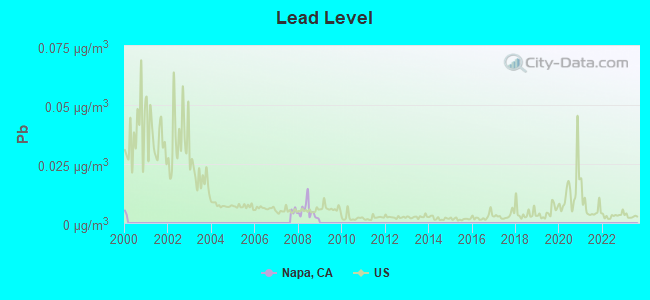
Lead (Pb) [µg/m3] level in 2008 was 0.00499. This is significantly better than average. Closest monitor was 0.5 miles away from the city center.
| City: | 0.00499 |
| U.S.: | 0.00931 |
Earthquake activity:
Napa-area historical earthquake activity is significantly above California state average. It is 7587% greater than the overall U.S. average.On 4/18/1906 at 13:12:21, a magnitude 7.9 (7.9 UK, Class: Major, Intensity: VIII - XII) earthquake occurred 43.6 miles away from the city center, causing $524,000,000 total damage
On 10/18/1989 at 00:04:15, a magnitude 7.1 (6.5 MB, 7.1 MS, 6.9 MW, 7.0 ML) earthquake occurred 87.6 miles away from the city center, causing 62 deaths (62 shaking deaths) and 3757 injuries, causing $1,305,032,704 total damage
On 1/31/1922 at 13:17:28, a magnitude 7.6 (7.6 UK) earthquake occurred 240.0 miles away from Napa center
On 4/25/1992 at 18:06:04, a magnitude 7.2 (6.3 MB, 7.1 MS, 7.2 MW, 7.1 MW, Depth: 9.4 mi) earthquake occurred 170.2 miles away from Napa center, causing $75,000,000 total damage
On 11/4/1927 at 13:51:53, a magnitude 7.5 (7.5 UK) earthquake occurred 244.8 miles away from Napa center
On 7/21/1952 at 11:52:14, a magnitude 7.7 (7.7 UK) earthquake occurred 292.8 miles away from Napa center, causing $50,000,000 total damage
Magnitude types: body-wave magnitude (MB), local magnitude (ML), surface-wave magnitude (MS), moment magnitude (MW)
Natural disasters:
The number of natural disasters in Napa County (26) is a lot greater than the US average (15).Major Disasters (Presidential) Declared: 13
Emergencies Declared: 3
Causes of natural disasters: Floods: 15, Winter Storms: 9, Landslides: 7, Mudslides: 7, Storms: 6, Fires: 5, Earthquakes: 2, Drought: 1, Freeze: 1, Heavy Rain: 1, Hurricane: 1, Tornado: 1, Other: 1 (Note: some incidents may be assigned to more than one category).

Main business address for: CHALONE WINE GROUP LTD (BEVERAGES), NORTH BAY BANCORP/CA (NATIONAL COMMERCIAL BANKS).
Hospitals in Napa:
- HOSPICE OF NAPA VALLEY (414 SOUTH JEFFERSON STREET)
- QUEEN OF THE VALLEY MEDICAL CENTER (Voluntary non-profit - Church, 1000 TRANCAS ST)
Nursing Homes in Napa:
- GOLDEN LIVINGCENTER - NAPA (705 TRANCAS ST.)
- NAPA STATE HOSPITAL D/P SNF (2100 NAPA-VALLEJO HIGHWAY)
- NAPA VALLEY CARE CENTER (3275 VILLA LANE)
- PINERS NURSING HOME (1800 PUEBLO AVE)
- ROBERTS NURSING HOME (3415 BROWNS VALLEY RD)
- THE MEADOWS OF NAPA VALLEY (1900 ATRIUM PARKWAY)
Dialysis Facilities in Napa:
Home Health Centers in Napa:
Airports, heliports and other landing facilities located in Napa:
- Napa County Airport (APC) (Runways: 3, Air Taxi Ops: 5,101, Itinerant Ops: 26,776, Local Ops: 21,874, Military Ops: 202)
- Queen Of The Valley Hospital Heliport (CN14)
- Lake Berryessa Seaplane Base (E20)
Colleges/Universities in Napa:
Other colleges/universities with over 2000 students near Napa:
- Solano Community College (about 11 miles; Fairfield, CA; Full-time enrollment: 5,790)
- Sonoma State University (about 21 miles; Rohnert Park, CA; FT enrollment: 7,796)
- Contra Costa College (about 24 miles; San Pablo, CA; FT enrollment: 4,249)
- Santa Rosa Junior College (about 26 miles; Santa Rosa, CA; FT enrollment: 13,047)
- Diablo Valley College (about 27 miles; Pleasant Hill, CA; FT enrollment: 13,015)
- College of Marin (about 28 miles; Kentfield, CA; FT enrollment: 4,489)
- University of California-Berkeley (about 31 miles; Berkeley, CA; FT enrollment: 37,127)
Public high schools in Napa:
- NAPA HIGH (Students: 1,759, Location: 2475 JEFFERSON ST., Grades: 9-12)
- VINTAGE HIGH (Students: 1,673, Location: 1375 TROWER AVE., Grades: 9-12)
- NEW TECHNOLOGY HIGH (Students: 264, Location: 920 YOUNT ST., Grades: 9-12)
- NAPA COUNTY COMMUNITY (Students: 60, Location: 2121 IMOLA AVE., Grades: 7-12)
- VALLEY OAK HIGH (Students: 49, Location: 1600 MYRTLE AVE., Grades: 10-12)
- NAPA COUNTY JUVENILE HALL/COURT (Students: 18, Location: 212 WALNUT ST., Grades: 7-12)
- NAPA COUNTY ROP (Location: 2121 IMOLA AVE., Grades: 10-12)
- NAPA VALLEY INDEPENDENT STUDIES (Location: 3310 LINDA VISTA AVE.., Grades: KG-12)
Private high schools in Napa:
- NAPA CHRISTIAN CAMPUS OF EDUCATION (Students: 136, Location: 2201 PINE ST, Grades: KG-12)
- KOLBE ACADEMY & TRINITY PREP (Students: 93, Location: 2055 REDWOOD RD, Grades: KG-12)
- THE OXBOW SCHOOL (Students: 71, Location: 530 3RD ST, Grades: 11-12)
- ALDEA SCHOOL (Students: 9, Location: 4002 JEFFERSON ST, Grades: 8-11, Boys only)
Biggest public elementary/middle schools in Napa:
- REDWOOD MIDDLE (Students: 986, Location: 3600 OXFORD ST., Grades: 6-8)
- HARVEST MIDDLE (Students: 764, Location: 2449 OLD SONOMA RD., Grades: 6-8)
- SILVERADO MIDDLE (Students: 723, Location: 1133 COOMBSVILLE RD., Grades: 6-8)
- NAPA VALLEY LANGUAGE ACADEMY (Students: 425, Location: 2700 KILBURN AVE., Grades: KG-6, Charter school)
- MCPHERSON ELEMENTARY (Students: 379, Location: 2670 YAJOME ST., Grades: KG-5)
- RIVER CHARTER (Students: 336, Location: 2447 OLD SONOMA RD., Grades: 6-8, Charter school)
- BEL AIRE PARK ELEMENTARY (Students: 255, Location: 3580 BECKWORTH DR., Grades: KG-5)
- NORTHWOOD ELEMENTARY (Students: 250, Location: 2214 BERKS ST., Grades: KG-5)
- BROWNS VALLEY ELEMENTARY (Students: 246, Location: 1001 BUHMAN AVE., Grades: KG-5)
- ALTA HEIGHTS ELEMENTARY (Students: 240, Location: 15 MONTECITO BLVD., Grades: KG-5)
Private elementary/middle schools in Napa:
- ST APOLLINARIS SCHOOL (Students: 266, Location: 3700 LASSEN ST, Grades: KG-8)
- ST JOHN'S LUTHERAN SCHOOL (Students: 253, Location: 3521 LINDA VISTA AVE, Grades: PK-8)
- ST JOHN THE BAPTIST CATHOLIC SCHOOL (Students: 218, Location: 983 NAPA ST, Grades: KG-8)
- FIRST CHRISTIAN SCHOOL (Students: 211, Location: 2659 1ST ST, Grades: PK-8)
- BLUE OAK SCHOOL (Students: 167, Location: 1436 POLK ST, Grades: KG-8)
- SUNRISE MONTESSORI OF NAPA VALLEY (Students: 124, Location: 1226 SALVADOR AVE, Grades: PK-6)
- GRACE ACADEMY OF NAPA VALLEY (Students: 24, Location: 3765 SOLANO AVE, Grades: KG-8)
User-submitted facts and corrections:
- Pacific Union College in Angwin, CA 94508. Around 20 miles from Napa.
Points of interest:
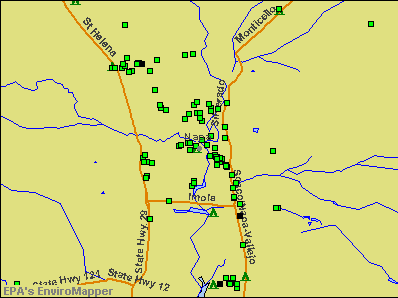
Notable locations in Napa: Juarez Old Adobe (A), Lisbon Winery (B), Napa Municipal Golf Course (C), Napa City Fire Department Station 2 (D), Napa City Fire Department Station 1 (E), Napa County Hall of Justice (F), Napa City-County Library (G), Manassee Mansion (H), Noyes Mansion (I), Napa Opera House (J), Napa Law Center (K), Napa County Law Library (L), Napa County Courthouse (M), Holden Mansion (N), Goodman Library (O), Churchill Manor (P), Cedar Gables (Q), Napa Unified School District Headquarters (R), Piners Napa Ambulance Service (S), Napa City Fire Department Station 4 (T). Display/hide their locations on the map
Shopping Centers: The Grape Yard Shopping Center (1), Napa Retail Center Shopping Center (2), Silverado Plaza Shopping Center (3), Riverpark Shopping Center (4), Northwood Shopping Center (5), Napa Valley Shopping Center (6), Napa Town Center Shopping Center (7), Napa Convenience Center Shopping Center (8), Coombs-Imola Shopping Center (9). Display/hide their locations on the map
Main business address in Napa: NORTH BAY BANCORP/CA (A). Display/hide its location on the map
Churches in Napa include: First Presbyterian Church (A), First United Methodist Church (B), Advent Christian Church (C), Congregation Beth Sholom (D), First Baptist Church (E), First Church of Christ Scientist (F), Grace Baptist Church (G), Lutheran Church of the Redeemer (H), Saint John the Baptist Roman Catholic Church (I). Display/hide their locations on the map
Cemeteries: Tulocay Cemetery (1), Napa Valley Memorial Gardens (2). Display/hide their locations on the map
Reservoirs: West Napa Reservoir (A), Pacifica Water Tank (B), East Napa Reservoir (C), East Side Reservoir (D). Display/hide their locations on the map
Creeks: Browns Creek (A), Napa Creek (B), Milliken Creek (C), Redwood Creek (D). Display/hide their locations on the map
Parks in Napa include: Garfield Little League Park (1), South Park (2), Fuller Park (3), Camille Park (4), Shurtleff Park (5), Alston Park (6), Fairview Park (7), Klamath Park (8), Westwood Hills Park (9). Display/hide their locations on the map
Tourist attractions: Copia the American Center for W Food and the Arts (Cultural Attractions- Events- & Facilities; 500 1st Street) (1), Di Rosa Preserve-Art & Nature (Cultural Attractions- Events- & Facilities; 5200 Sonoma Highway) (2), Carolyn Parr Nature Museum (Cultural Attractions- Events- & Facilities; 3107 Browns Valley Road) (3), California Wine Tours Limousine Service (4075 Solano Avenue) (4), Aerostat Adventures (Tours & Charters; 5091 Solano Avenue) (5). Display/hide their approximate locations on the map
Hotels: Best Western Elm House Inn (800 California Boulevard) (1), Amc Hospitality (3659 Young Avenue) (2), Best Western Inn at the Vines (100 Soscol Avenue) (3). Display/hide their approximate locations on the map
Birthplace of: Donny Robinson - Bicycle motocross rider, Logan Tom - Volleyball player, Jerry Bohlander - Martial artist, Andy Miller (golfer) - Professional golfer, Elmer Leonard - Baseball player, Kurt Caceres - Actor, Mike Neu (baseball) - Baseball player, Mike Stephens - College basketball player (Princeton Tigers), Pete Daglia - Major League Baseball pitcher, Phil Bonifield - Craftsman Truck series NASCAR driver (born: Jun 23, 1963).
Drinking water stations with addresses in Napa and their reported violations in the past:
CIRCLE OAKS WATER DISTRICT (Population served: 500, Surface water):Past monitoring violations:BERRYESSA PINES WATER SYSTEM (Population served: 261, Surface water):
- 2 routine major monitoring violations
Past health violations:WELCOME GRANGE HALL (Population served: 200, Groundwater):Past monitoring violations:
- MCL, Average - Between JAN-2006 and MAR-2006, Contaminant: Total Haloacetic Acids (HAA5). Follow-up actions: St AO (w/o penalty) issued (APR-02-2007)
- MCL, Average - Between OCT-2005 and DEC-2005, Contaminant: Total Haloacetic Acids (HAA5). Follow-up actions: St AO (w/o penalty) issued (NOV-14-2006)
- Monitoring and Reporting (DBP) - Between OCT-2005 and DEC-2005, Contaminant: Total Haloacetic Acids (HAA5). Follow-up actions: St Violation/Reminder Notice (JAN-06-2006), St Compliance achieved (APR-28-2010)
- Monitoring and Reporting (DBP) - Between OCT-2005 and DEC-2005, Contaminant: Total Haloacetic Acids (HAA5)
- Monitoring and Reporting (DBP) - Between JAN-2005 and DEC-2005, Contaminant: TTHM
- Monitoring and Reporting (DBP) - Between JAN-2005 and DEC-2005, Contaminant: TTHM. Follow-up actions: St Violation/Reminder Notice (JAN-06-2006), St Compliance achieved (APR-28-2010)
- Initial Tap Sampling for Pb and Cu - In JAN-01-1996, Contaminant: Lead and Copper Rule. Follow-up actions: St AO (w/o penalty) issued (2 times from OCT-10-2001 to OCT-10-2001)
- One routine major monitoring violation
- One other older monitoring violation
Past monitoring violations:SKYLINE PARK (Population served: 150, Groundwater):
- 4 routine major monitoring violations
Past monitoring violations:MONT ST. JOHN CELLARS (Population served: 100, Groundwater):
- Notification, State - In JUL-2011, Contaminant: Coliform (TCR). Follow-up actions: St Violation/Reminder Notice (AUG-22-2011)
- One routine major monitoring violation
Past monitoring violations:SILVERADO HILL CELLARS (Population served: 100, Groundwater):
- 4 routine major monitoring violations
Past health violations:MT. GEORGE ESTATES (Population served: 100, Groundwater):Past monitoring violations:
- MCL, Monthly (TCR) - Between OCT-2006 and DEC-2006, Contaminant: Coliform. Follow-up actions: St Site Visit (enforcement) (JAN-25-2007)
- MCL, Monthly (TCR) - Between OCT-2006 and DEC-2006, Contaminant: Coliform. Follow-up actions: St Site Visit (enforcement) (JAN-25-2007)
- 5 routine major monitoring violations
Past monitoring violations:WILD HORSE VALLEY RANCH (Population served: 100, Groundwater):
- Monitoring, Repeat Major (TCR) - Between JAN-2006 and MAR-2006, Contaminant: Coliform (TCR). Follow-up actions: St Violation/Reminder Notice (APR-26-2006)
- Monitoring, Repeat Major (TCR) - Between JAN-2006 and MAR-2006, Contaminant: Coliform (TCR). Follow-up actions: St Violation/Reminder Notice (APR-26-2006)
- 7 routine major monitoring violations
Past health violations:
- MCL, Acute (TCR) - Between JUL-2005 and SEP-2005, Contaminant: Coliform. Follow-up actions: St Violation/Reminder Notice (APR-26-2006)
- MCL, Acute (TCR) - Between JUL-2005 and SEP-2005, Contaminant: Coliform. Follow-up actions: St Violation/Reminder Notice (APR-26-2006)
Drinking water stations with addresses in Napa that have no violations reported:
- SNUG HARBOR RESORT (Population served: 250, Primary Water Source Type: Groundwater)
- Z D WINES (Population served: 25, Primary Water Source Type: Groundwater)
- FOLEY JOHNSON WINERY (Address: Suite 101 , Population served: 25, Primary Water Source Type: Groundwater)
- ETUDE WINES (Population served: 25, Primary Water Source Type: Groundwater)
| This city: | 2.7 people |
| California: | 2.9 people |
| This city: | 66.2% |
| Whole state: | 68.7% |
| This city: | 6.8% |
| Whole state: | 7.2% |
Likely homosexual households (counted as self-reported same-sex unmarried-partner households)
- Lesbian couples: 0.5% of all households
- Gay men: 0.3% of all households
People in group quarters in Napa in 2010:
- 343 people in nursing facilities/skilled-nursing facilities
- 236 people in local jails and other municipal confinement facilities
- 220 people in other noninstitutional facilities
- 154 people in emergency and transitional shelters (with sleeping facilities) for people experiencing homelessness
- 142 people in workers' group living quarters and job corps centers
- 59 people in correctional facilities intended for juveniles
- 44 people in group homes intended for adults
- 17 people in group homes for juveniles (non-correctional)
- 8 people in residential treatment centers for juveniles (non-correctional)
- 8 people in residential treatment centers for adults
- 6 people in in-patient hospice facilities
People in group quarters in Napa in 2000:
- 467 people in nursing homes
- 332 people in other noninstitutional group quarters
- 199 people in local jails and other confinement facilities (including police lockups)
- 151 people in other group homes
- 87 people in homes for the mentally retarded
- 57 people in homes or halfway houses for drug/alcohol abuse
- 51 people in other workers' dormitories
- 47 people in religious group quarters
- 39 people in homes for the mentally ill
- 23 people in short-term care, detention or diagnostic centers for delinquent children
- 4 people in homes for the physically handicapped
- 2 people in other nonhousehold living situations
Banks with most branches in Napa (2011 data):
- Umpqua Bank: South Soscol Branch, Bel Aire Branch, Soscol Main Branch, Browns Valley Branch, Napa Airport Branch. Info updated 2011/09/02: Bank assets: $11,556.7 mil, Deposits: $9,325.3 mil, headquarters in Roseburg, OR, positive income, Commercial Lending Specialization, 193 total offices, Holding Company: Umpqua Holdings Corporation
- Westamerica Bank: South Napa Branch, North Napa Branch, Downtown Napa Branch. Info updated 2011/06/21: Bank assets: $4,998.1 mil, Deposits: $4,253.2 mil, headquarters in San Rafael, CA, positive income, Commercial Lending Specialization, 98 total offices, Holding Company: Westamerica Bancorporation
- Wells Fargo Bank, National Association: Raleys Napa Branch, Silverado Branch, Napa Downtown Branch. Info updated 2011/04/05: Bank assets: $1,161,490.0 mil, Deposits: $905,653.0 mil, headquarters in Sioux Falls, SD, positive income, 6395 total offices, Holding Company: Wells Fargo & Company
- JPMorgan Chase Bank, National Association: Napa Branch, California & Lincoln Lucky Banking C, 257 Soscol Branch. Info updated 2011/11/10: Bank assets: $1,811,678.0 mil, Deposits: $1,190,738.0 mil, headquarters in Columbus, OH, positive income, International Specialization, 5577 total offices, Holding Company: Jpmorgan Chase & Co.
- U.S. Bank National Association: Napa - First Street Branch, Napa Branch, Trancas & Jefferson Safeway Branch. Info updated 2012/01/30: Bank assets: $330,470.8 mil, Deposits: $236,091.5 mil, headquarters in Cincinnati, OH, positive income, 3121 total offices, Holding Company: U.S. Bancorp
- Bank of America, National Association: Napa Branch at 1700 First Street, branch established on 1917/01/27; North Napa Branch at Two Financial Plaza, branch established on 1974/05/20. Info updated 2009/11/18: Bank assets: $1,451,969.3 mil, Deposits: $1,077,176.8 mil, headquarters in Charlotte, NC, positive income, 5782 total offices, Holding Company: Bank Of America Corporation
- Bank of the West: Napa Main Street Branch at 700 Main Street, branch established on 2011/08/01; Napa Branch at 3300 Jefferson Street, branch established on 1926/01/01. Info updated 2009/11/16: Bank assets: $62,408.3 mil, Deposits: $43,995.2 mil, headquarters in San Francisco, CA, positive income, 647 total offices, Holding Company: Bnp Paribas
- Bank of Napa, N.A.: Bank Of Napa, N.A. at 2007 Redwood Road, Suite 101, branch established on 2006/08/14. Info updated 2008/03/04: Bank assets: $140.0 mil, Deposits: $121.1 mil, local headquarters, positive income, Commercial Lending Specialization, 1 total offices
- Bank of Marin: Charter Oak Bank Branch at 600 Trancas Street, branch established on 2004/12/17. Info updated 2011/02/22: Bank assets: $1,393.3 mil, Deposits: $1,206.0 mil, headquarters in Novato, CA, positive income, Commercial Lending Specialization, 18 total offices, Holding Company: Bank Of Marin Bancorp
- 5 other banks with 5 local branches
For population 15 years and over in Napa:
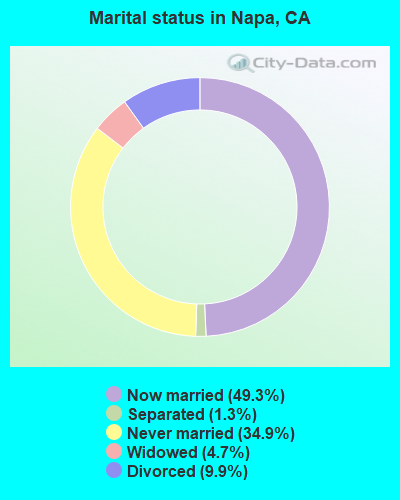
- Never married: 34.9%
- Now married: 49.3%
- Separated: 1.3%
- Widowed: 4.7%
- Divorced: 9.9%
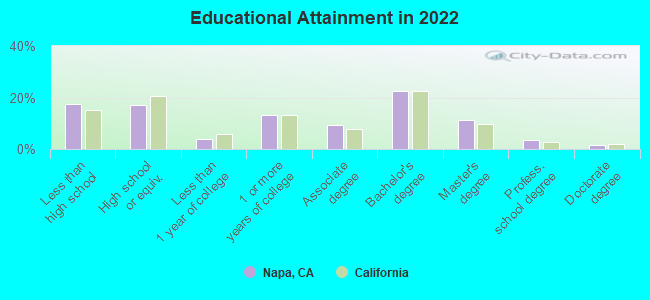
For population 25 years and over in Napa:
- High school or higher: 82.5%
- Bachelor's degree or higher: 38.7%
- Graduate or professional degree: 16.1%
- Unemployed: 5.3%
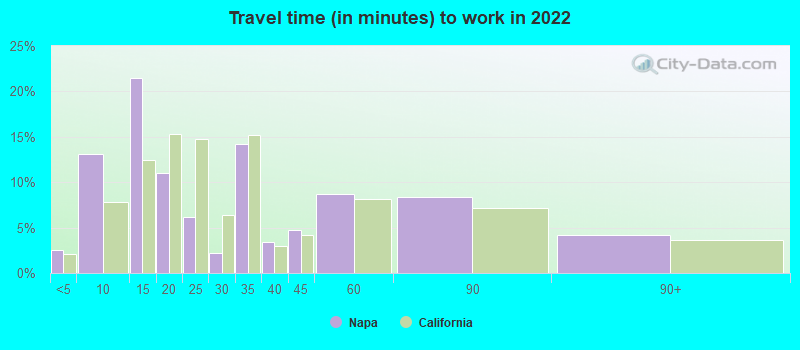
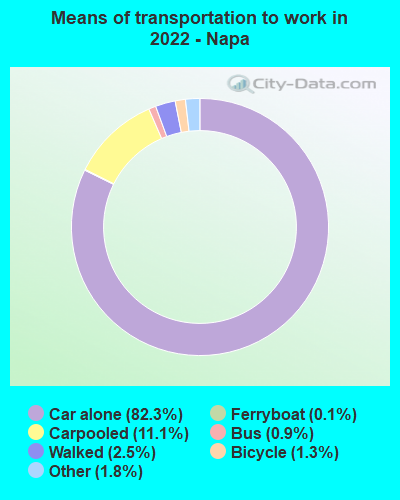
- Mean travel time to work (commute): 20.5 minutes
| Here: | 16.4 |
| California average: | 15.5 |
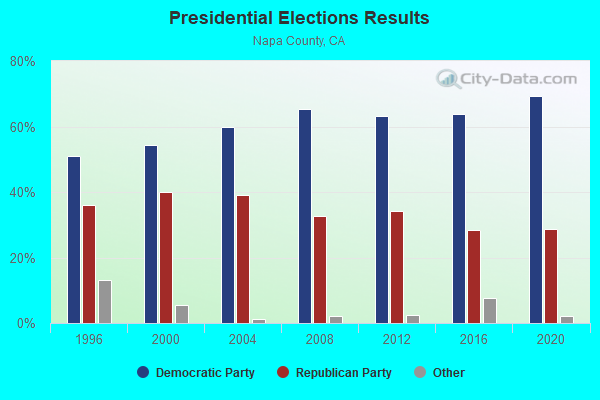
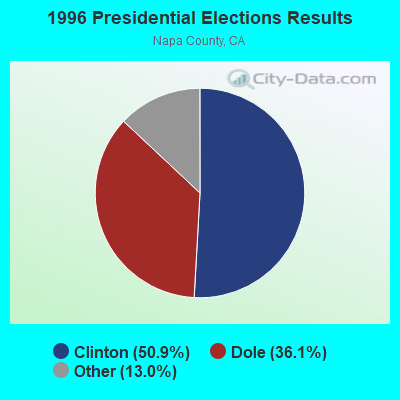
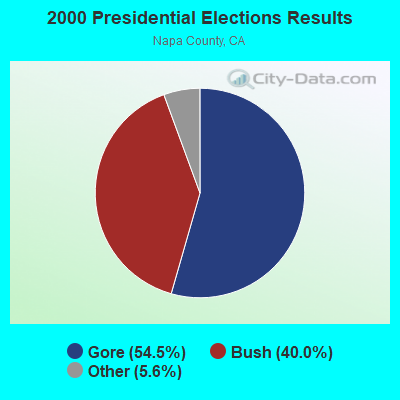
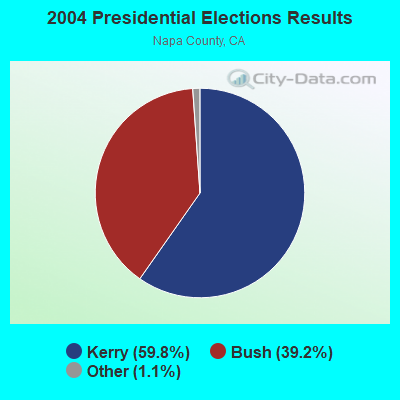
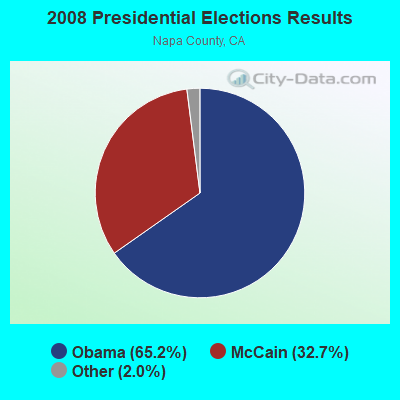
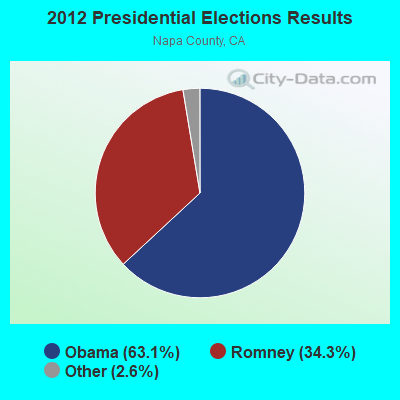
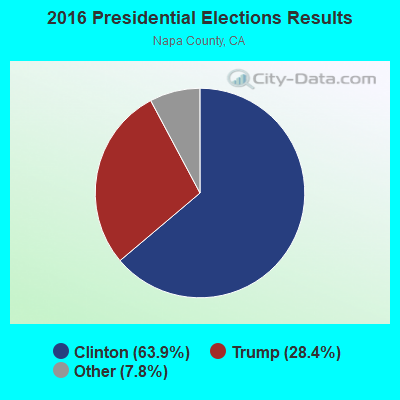
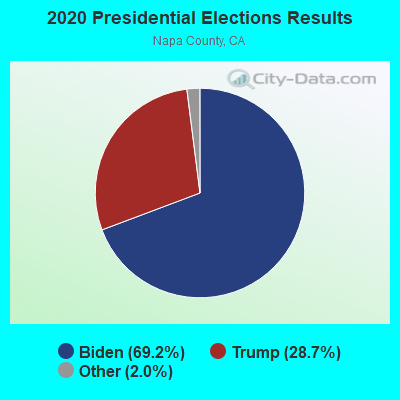
Graphs represent county-level data. Detailed 2008 Election Results
Neighborhoods in Napa:
(Napa, California Neighborhood Map)Religion statistics for Napa, CA (based on Napa County data)
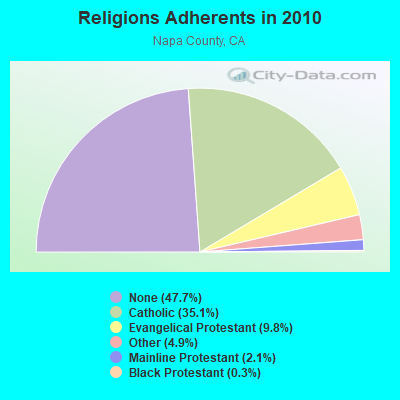
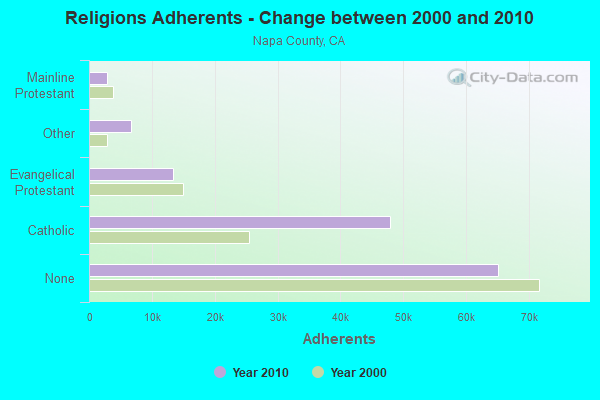
| Religion | Adherents | Congregations |
|---|---|---|
| Catholic | 47,968 | 8 |
| Evangelical Protestant | 13,323 | 55 |
| Other | 6,725 | 20 |
| Mainline Protestant | 2,923 | 14 |
| Black Protestant | 364 | 2 |
| Orthodox | 80 | 2 |
| None | 65,101 | - |
Food Environment Statistics:
| Napa County: | 2.50 / 10,000 pop. |
| California: | 2.14 / 10,000 pop. |
| Napa County: | 0.91 / 10,000 pop. |
| California: | 0.62 / 10,000 pop. |
| Napa County: | 1.90 / 10,000 pop. |
| California: | 1.49 / 10,000 pop. |
| This county: | 10.24 / 10,000 pop. |
| State: | 7.42 / 10,000 pop. |
| Napa County: | 7.2% |
| State: | 7.3% |
| Napa County: | 20.8% |
| California: | 21.3% |
| This county: | 16.9% |
| California: | 17.9% |
Health and Nutrition:
| Napa: | 48.3% |
| California: | 49.4% |
| Napa: | 46.6% |
| California: | 48.0% |
| Napa: | 28.4 |
| California: | 28.1 |
| This city: | 21.9% |
| California: | 20.2% |
| Napa: | 9.7% |
| California: | 11.2% |
| This city: | 6.8 |
| California: | 6.8 |
| Napa: | 33.4% |
| California: | 31.5% |
| Napa: | 55.5% |
| California: | 56.4% |
| Napa: | 78.9% |
| State: | 80.9% |
More about Health and Nutrition of Napa, CA Residents
| Local government employment and payroll (March 2022) | |||||
| Function | Full-time employees | Monthly full-time payroll | Average yearly full-time wage | Part-time employees | Monthly part-time payroll |
|---|---|---|---|---|---|
| Firefighters | 69 | $888,203 | $154,470 | 0 | $0 |
| Police Protection - Officers | 68 | $938,742 | $165,660 | 0 | $0 |
| Streets and Highways | 65 | $558,649 | $103,135 | 4 | $6,326 |
| Water Supply | 54 | $499,414 | $110,981 | 0 | $0 |
| Police - Other | 39 | $378,576 | $116,485 | 0 | $0 |
| Financial Administration | 35 | $343,996 | $117,941 | 2 | $4,807 |
| Parks and Recreation | 35 | $249,621 | $85,584 | 25 | $33,980 |
| Other Government Administration | 24 | $293,650 | $146,825 | 6 | $15,113 |
| Housing and Community Development (Local) | 22 | $183,166 | $99,909 | 2 | $5,627 |
| Other and Unallocable | 9 | $80,600 | $107,467 | 0 | $0 |
| Solid Waste Management | 9 | $113,983 | $151,977 | 1 | $1,849 |
| Fire - Other | 5 | $58,453 | $140,287 | 1 | $455 |
| Judicial and Legal | 4 | $62,478 | $187,434 | 0 | $0 |
| Totals for Government | 438 | $4,649,531 | $127,384 | 41 | $68,157 |
Napa government finances - Expenditure in 2021 (per resident):
- Construction - Housing and Community Development: $6,577,000 ($83.98)
Regular Highways: $4,234,000 ($54.06)
Police Protection: $77,000 ($0.98)
Parks and Recreation: $53,000 ($0.68)
- Current Operations - General - Other: $33,805,000 ($431.65)
Solid Waste Management: $31,897,000 ($407.29)
Police Protection: $30,034,000 ($383.50)
Water Utilities: $26,357,000 ($336.55)
Housing and Community Development: $22,512,000 ($287.45)
Central Staff Services: $16,214,000 ($207.04)
Local Fire Protection: $13,979,000 ($178.50)
Health - Other: $8,900,000 ($113.64)
Protective Inspection and Regulation - Other: $6,701,000 ($85.56)
Parks and Recreation: $6,328,000 ($80.80)
Regular Highways: $3,897,000 ($49.76)
Parking Facilities: $626,000 ($7.99)
- General - Interest on Debt: $404,000 ($5.16)
- Water Utilities - Interest on Debt: $1,360,000 ($17.37)
Napa government finances - Revenue in 2021 (per resident):
- Charges - Solid Waste Management: $39,219,000 ($500.79)
Other: $6,269,000 ($80.05)
Housing and Community Development: $2,639,000 ($33.70)
Parks and Recreation: $264,000 ($3.37)
Parking Facilities: $75,000 ($0.96)
- Federal Intergovernmental - Other: $17,605,000 ($224.80)
Water Utilities: $2,224,000 ($28.40)
Housing and Community Development: $637,000 ($8.13)
- Local Intergovernmental - Other: $146,000 ($1.86)
Water Utilities: $70,000 ($0.89)
- Miscellaneous - General Revenue - Other: $1,726,000 ($22.04)
Special Assessments: $1,263,000 ($16.13)
Interest Earnings: $1,129,000 ($14.42)
Rents: $896,000 ($11.44)
Fines and Forfeits: $565,000 ($7.21)
Donations From Private Sources: $555,000 ($7.09)
Sale of Property: $9,000 ($0.11)
- Revenue - Water Utilities: $40,689,000 ($519.56)
- State Intergovernmental - Other: $5,260,000 ($67.16)
Highways: $3,257,000 ($41.59)
Water Utilities: $362,000 ($4.62)
General Local Government Support: $87,000 ($1.11)
- Tax - Property: $40,848,000 ($521.59)
General Sales and Gross Receipts: $17,470,000 ($223.07)
Other Selective Sales: $11,717,000 ($149.61)
Other: $10,142,000 ($129.50)
Occupation and Business License - Other: $3,295,000 ($42.07)
Other License: $2,101,000 ($26.83)
Public Utilities Sales: $1,970,000 ($25.15)
Documentary and Stock Transfer: $739,000 ($9.44)
Napa government finances - Debt in 2021 (per resident):
- Long Term Debt - Outstanding Unspecified Public Purpose: $52,551,000 ($671.02)
Beginning Outstanding - Unspecified Public Purpose: $49,769,000 ($635.50)
Issue, Unspecified Public Purpose: $6,190,000 ($79.04)
Retired Unspecified Public Purpose: $3,408,000 ($43.52)
Napa government finances - Cash and Securities in 2021 (per resident):
- Bond Funds - Cash and Securities: $21,626,000 ($276.14)
- Other Funds - Cash and Securities: $144,256,000 ($1842.00)
| Businesses in Napa, CA | ||||
| Name | Count | Name | Count | |
|---|---|---|---|---|
| 7-Eleven | 6 | KFC | 2 | |
| AT&T | 2 | Kohl's | 1 | |
| Ace Hardware | 2 | La-Z-Boy | 1 | |
| Aerosoles | 1 | Levi Strauss & Co. | 1 | |
| Ann Taylor | 2 | Little Caesars Pizza | 1 | |
| Applebee's | 1 | Marriott | 1 | |
| AutoZone | 1 | MasterBrand Cabinets | 14 | |
| Banana Republic | 1 | McDonald's | 2 | |
| Baskin-Robbins | 1 | New Balance | 2 | |
| Ben & Jerry's | 1 | Nike | 5 | |
| Best Western | 3 | Nissan | 1 | |
| Big O Tires | 1 | Office Depot | 1 | |
| Blockbuster | 1 | Pac Sun | 1 | |
| Brooks Brothers | 1 | Panda Express | 1 | |
| Budget Car Rental | 1 | Payless | 1 | |
| Burger King | 2 | Penske | 1 | |
| CVS | 3 | Pizza Hut | 1 | |
| Carl\s Jr. | 1 | Quiznos | 1 | |
| Chevrolet | 1 | RadioShack | 2 | |
| Clarks | 1 | Rite Aid | 1 | |
| Cold Stone Creamery | 1 | SAS Shoes | 1 | |
| DHL | 1 | Sears | 1 | |
| Decora Cabinetry | 2 | Staples | 1 | |
| Dennys | 1 | Starbucks | 7 | |
| Discount Tire | 1 | Subaru | 1 | |
| Domino's Pizza | 1 | Subway | 3 | |
| Famous Footwear | 1 | T-Mobile | 4 | |
| FedEx | 12 | Taco Bell | 2 | |
| Ford | 1 | Talbots | 2 | |
| GNC | 2 | Target | 2 | |
| GameStop | 1 | Toyota | 1 | |
| Gap | 1 | Trader Joe's | 1 | |
| Goodwill | 1 | Travelodge | 1 | |
| Gymboree | 1 | True Value | 1 | |
| H&R Block | 2 | U-Haul | 3 | |
| Hawthorn | 1 | UPS | 20 | |
| Hilton | 2 | Vans | 5 | |
| Home Depot | 1 | Verizon Wireless | 1 | |
| Honda | 1 | Volkswagen | 1 | |
| Hyatt | 1 | Vons | 2 | |
| IHOP | 1 | Walmart | 1 | |
| J.Crew | 1 | Wendy's | 1 | |
| Jack In The Box | 2 | Westin | 1 | |
| Jamba Juice | 2 | Whole Foods Market | 1 | |
| Jones New York | 1 | |||
Strongest AM radio stations in Napa:
- KVON (1440 AM; 5 kW; NAPA, CA; Owner: CBM NAPA, LLC)
- KCBS (740 AM; 50 kW; SAN FRANCISCO, CA; Owner: INFINITY BROADCASTING OPERATIONS, INC.)
- KTRB (860 AM; 50 kW; MODESTO, CA; Owner: PAPPAS RADIO OF CALIFORNIA, A CALIFORNIA LIMITED PARTNERSHIP)
- KDYA (1190 AM; 10 kW; VALLEJO, CA; Owner: BAYBRIDGE COMMUNICATIONS, L.L.C.)
- KDIA (1640 AM; 10 kW; VALLEJO, CA; Owner: BAYBRIDGE COMMUNICATIONS, L.L.C.)
- KIQI (1010 AM; 35 kW; SAN FRANCISCO, CA; Owner: RADIO UNICA OF SAN FRANCISCO LICENSE CORP.)
- KNEW (910 AM; 20 kW; OAKLAND, CA; Owner: AMFM RADIO LICENSES, L.L.C.)
- KNBR (680 AM; 50 kW; SAN FRANCISCO, CA; Owner: KNBR LICO, INC.)
- KTCT (1050 AM; 50 kW; SAN MATEO, CA; Owner: SUSQUEHANNA RADIO CORP.)
- KFAX (1100 AM; 50 kW; SAN FRANCISCO, CA; Owner: GOLDEN GATE BROADCASTING CO, INC.)
- KGO (810 AM; 50 kW; SAN FRANCISCO, CA; Owner: KGO-AM RADIO, INC.)
- KHTK (1140 AM; 50 kW; SACRAMENTO, CA; Owner: INFINITY RADIO SUBSIDIARY OPERATIONS INC.)
- KATD (990 AM; 10 kW; PITTSBURG, CA; Owner: RADIO UNICA OF SACRAMENTO LICENSE CORP.)
Strongest FM radio stations in Napa:
- KUIC (95.3 FM; VACAVILLE, CA; Owner: KUIC, INC.)
- KXFX-FM1 (101.7 FM; PETALUMA, CA; Owner: MAVERICK MEDIA OF SANTA ROSA LICENSE LLC)
- KNDL (89.9 FM; ANGWIN, CA; Owner: HOWELL MOUNTAIN BROADCASTING COMPANY)
- KLVR (91.9 FM; SANTA ROSA, CA; Owner: EDUCATIONAL MEDIA FOUNDATION)
- KXTS (100.9 FM; CALISTOGA, CA; Owner: SINCLAIR TELECABLE, INC.)
- KBBF (89.1 FM; SANTA ROSA, CA; Owner: BILINGUAL B/CING. FOUNDATION, INC.)
- KKSF-FM1 (103.7 FM; PLEASANTON, ETC., CA; Owner: AMFM RADIO LICENSES, L.L.C.)
- KSFB-FM (100.7 FM; SAN RAFAEL, CA; Owner: GOLDEN GATE BROADCASTING COMPANY, INC.)
- KBLX-FM2 (102.9 FM; PLEASANTON, CA; Owner: ICBC BROADCAST HOLDINGS -CA, INC.)
- KSOL-FM3 (98.9 FM; PLEASANTON, CA; Owner: TMS LICENSE CALIFORNIA, INC)
- KFRC-FM3 (99.7 FM; WALNUT CREEK, CA; Owner: INFINITY KFRC-FM, INC.)
- KZBR-FM1 (95.7 FM; WALNUT CREEK, CA; Owner: BONNEVILLE HOLDING COMPANY)
- KISQ-FM3 (98.1 FM; CONCORD, CA; Owner: AMFM RADIO LICENSES, L.L.C.)
- KMEL-FM1 (106.1 FM; CONCORD, CA; Owner: AMFM RADIO LICENSES, L.L.C.)
- KXFX (101.7 FM; SANTA ROSA, CA; Owner: MAVERICK MEDIA OF SANTA ROSA LICENSE LLC)
- KVYN (99.3 FM; ST. HELENA, CA; Owner: CBM NAPA, LLC)
- KSXY (98.7 FM; MIDDLETOWN, CA; Owner: COMMONWEALTH BROADCASTING, LLC)
- K221DQ (92.1 FM; PETALUMA, CA; Owner: EDUCATIONAL MEDIA FOUNDATION)
- KZST-FM2 (100.1 FM; ROHNERT PARK PETALUM, CA; Owner: REDWOOD EMPIRE STEREOCASTERS)
- KRPQ (104.9 FM; ROHNERT PARK, CA; Owner: RESULTS RADIO OF SONOMA LP)
TV broadcast stations around Napa:
- KQED (Channel 9; SAN FRANCISCO, CA; Owner: KQED, INC.)
- KSPX (Channel 29; SACRAMENTO, CA; Owner: PAXSON SACRAMENTO LICENSE, INC.)
- KOVR (Channel 13; STOCKTON, CA; Owner: SCI - SACRAMENTO LICENSEE, LLC)
- KXTV (Channel 10; SACRAMENTO, CA; Owner: KXTV, INC.)
- KCRA-TV (Channel 3; SACRAMENTO, CA; Owner: KCRA HEARST-ARGYLE TELEVISION, INC.)
- KTXL (Channel 40; SACRAMENTO, CA; Owner: CHANNEL 40, INC.)
- KQCA (Channel 58; STOCKTON, CA; Owner: KCRA HEARST-ARGYLE TELEVISION, INC.)
- KVIE (Channel 6; SACRAMENTO, CA; Owner: KVIE, INC.)
- KUVS (Channel 19; MODESTO, CA; Owner: KUVS LICENSE PARTNERSHIP, G.P.)
- KMAX-TV (Channel 31; SACRAMENTO, CA; Owner: UPN STATIONS GROUP INC.)
- KGO-TV (Channel 7; SAN FRANCISCO, CA; Owner: KGO TELEVISION, INC.)
- KPIX-TV (Channel 5; SAN FRANCISCO, CA; Owner: CBS BROADCASTING INC.)
- KEZT-CA (Channel 23; SACRAMENTO, CA; Owner: TELEFUTURA SACRAMENTO LLC)
- KTVU (Channel 2; OAKLAND, CA; Owner: KTVU PARTNERSHIP)
- KRON-TV (Channel 4; SAN FRANCISCO, CA; Owner: YOUNG BROADCASTING OF SAN FRANCISCO, INC.)
- KTNC-TV (Channel 42; CONCORD, CA; Owner: KTNC LICENSE, LLC)
- KMTP-TV (Channel 32; SAN FRANCISCO, CA; Owner: MINORITY TELEVISION PROJECT)
- KBHK-TV (Channel 44; SAN FRANCISCO, CA; Owner: VIACOM TELEVISION STATIONS GROUP OF SAN FRANCISCO INC.)
- KBWB (Channel 20; SAN FRANCISCO, CA; Owner: KBWB LICENSE, INC.)
- KFSF (Channel 66; VALLEJO, CA; Owner: TELEFUTURA SAN FRANCISCO LLC)
- KRCB (Channel 22; COTATI, CA; Owner: RURAL CALIFORNIA BROADCASTING CORP.)
- National Bridge Inventory (NBI) Statistics
- 79Number of bridges
- 1,339ft / 408mTotal length
- $24,746,000Total costs
- 1,264,431Total average daily traffic
- 69,913Total average daily truck traffic
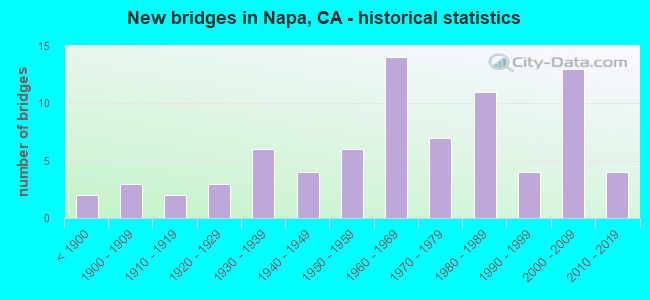
- New bridges - historical statistics
- 2Before 1900
- 31900-1909
- 21910-1919
- 31920-1929
- 61930-1939
- 41940-1949
- 61950-1959
- 141960-1969
- 71970-1979
- 111980-1989
- 41990-1999
- 132000-2009
- 42010-2019
FCC Registered Antenna Towers: 138 (See the full list of FCC Registered Antenna Towers)
FCC Registered Commercial Land Mobile Towers: 2 (See the full list of FCC Registered Commercial Land Mobile Towers in Napa, CA)
FCC Registered Private Land Mobile Towers: 7 (See the full list of FCC Registered Private Land Mobile Towers)
FCC Registered Broadcast Land Mobile Towers: 124 (See the full list of FCC Registered Broadcast Land Mobile Towers)
FCC Registered Microwave Towers: 112 (See the full list of FCC Registered Microwave Towers in this town)
FCC Registered Paging Towers: 8 (See the full list of FCC Registered Paging Towers)
FCC Registered Maritime Coast & Aviation Ground Towers: 9 (See the full list of FCC Registered Maritime Coast & Aviation Ground Towers)
FCC Registered Amateur Radio Licenses: 624 (See the full list of FCC Registered Amateur Radio Licenses in Napa)
FAA Registered Aircraft Manufacturers and Dealers: 5 (See the full list of FAA Registered Manufacturers and Dealers in Napa)
FAA Registered Aircraft: 196 (See the full list of FAA Registered Aircraft)
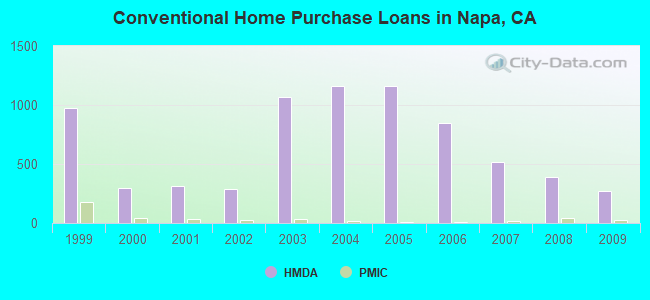
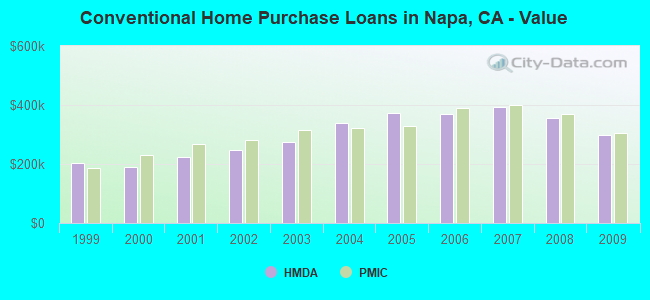
| Home Mortgage Disclosure Act Aggregated Statistics For Year 2009 (Based on 8 full and 9 partial tracts) | ||||||||||||||
| A) FHA, FSA/RHS & VA Home Purchase Loans | B) Conventional Home Purchase Loans | C) Refinancings | D) Home Improvement Loans | E) Loans on Dwellings For 5+ Families | F) Non-occupant Loans on < 5 Family Dwellings (A B C & D) | G) Loans On Manufactured Home Dwelling (A B C & D) | ||||||||
|---|---|---|---|---|---|---|---|---|---|---|---|---|---|---|
| Number | Average Value | Number | Average Value | Number | Average Value | Number | Average Value | Number | Average Value | Number | Average Value | Number | Average Value | |
| LOANS ORIGINATED | 204 | $317,744 | 270 | $297,860 | 1,224 | $288,264 | 38 | $184,033 | 3 | $2,726,710 | 175 | $258,325 | 4 | $38,540 |
| APPLICATIONS APPROVED, NOT ACCEPTED | 11 | $344,658 | 27 | $319,765 | 122 | $332,003 | 4 | $172,235 | 0 | $0 | 16 | $281,614 | 2 | $139,610 |
| APPLICATIONS DENIED | 17 | $340,220 | 54 | $264,964 | 411 | $337,297 | 17 | $170,997 | 0 | $0 | 59 | $268,873 | 4 | $123,650 |
| APPLICATIONS WITHDRAWN | 17 | $320,262 | 43 | $288,664 | 208 | $328,734 | 6 | $234,793 | 0 | $0 | 32 | $272,276 | 0 | $0 |
| FILES CLOSED FOR INCOMPLETENESS | 2 | $221,610 | 6 | $274,267 | 79 | $337,968 | 7 | $62,566 | 0 | $0 | 7 | $227,491 | 0 | $0 |
Detailed mortgage data for all 18 tracts in Napa, CA
| Private Mortgage Insurance Companies Aggregated Statistics For Year 2009 (Based on 6 full and 9 partial tracts) | ||||||
| A) Conventional Home Purchase Loans | B) Refinancings | C) Non-occupant Loans on < 5 Family Dwellings (A & B) | ||||
|---|---|---|---|---|---|---|
| Number | Average Value | Number | Average Value | Number | Average Value | |
| LOANS ORIGINATED | 28 | $305,958 | 7 | $364,536 | 1 | $374,680 |
| APPLICATIONS APPROVED, NOT ACCEPTED | 10 | $304,493 | 4 | $427,905 | 0 | $0 |
| APPLICATIONS DENIED | 4 | $212,455 | 3 | $331,280 | 0 | $0 |
| APPLICATIONS WITHDRAWN | 2 | $319,465 | 2 | $363,350 | 0 | $0 |
| FILES CLOSED FOR INCOMPLETENESS | 0 | $0 | 0 | $0 | 0 | $0 |
2005 - 2018 National Fire Incident Reporting System (NFIRS) incidents
- Fire incident types reported to NFIRS in Napa, CA
- 1,43044.4%Outside Fires
- 1,12534.9%Structure Fires
- 41012.7%Mobile Property/Vehicle Fires
- 2578.0%Other
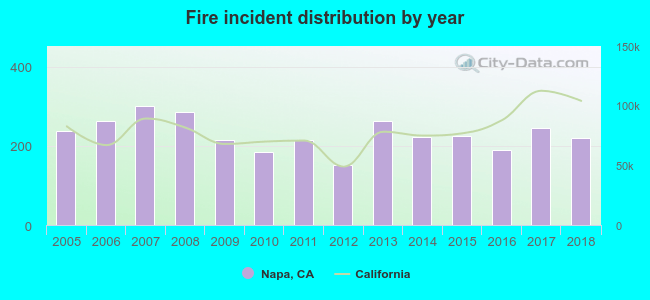 According to the data from the years 2005 - 2018 the average number of fires per year is 230. The highest number of fires - 302 took place in 2007, and the least - 151 in 2012. The data has a dropping trend.
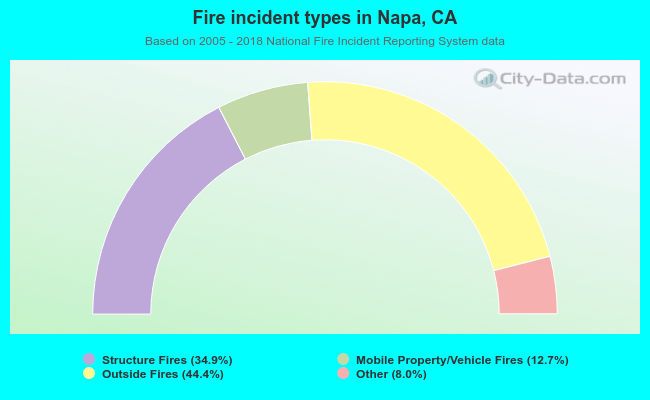 When looking into fire subcategories, the most reports belonged to: Outside Fires (44.4%), and Structure Fires (34.9%).
Fire-safe hotels and motels in Napa, California:
- Napa Winery Inn, 1998 Trower Ave, Napa, California 94558 , Phone: (707) 257-7220, Fax: (707) 258-0943
- Best Western Premeire Ivy Hotel Napa, 4195 Solano Ave, Napa, California 94558 , Phone: (707) 253-9300
- La Residence Country Inn, 4066 St Helena Hwy, Napa, California 94558 , Phone: (707) 253-0337
- Embassy Suites Napa Valley, 1075 California Blvd, Napa, California 94559 , Phone: (707) 253-9540, Fax: (707) 253-9202
- Churchill Manor Bed & Breakfast, 485 Brown St, Napa, California 94559 , Phone: (707) 253-7733
- Steele Park Resort Inc, 1605 Steele Cyn Rd, Napa, California 94558 , Phone: (707) 966-2123, Fax: (707) 255-2727
- Napa Valley Marriott Hotel & Spa, 3425 Solano Ave, Napa, California 94558 , Phone: (707) 253-8600, Fax: (707) 258-1320
- Napa Valley Budget Inn, 3380 Solano Ave, Napa, California 94558 , Phone: (707) 257-6111, Fax: (707) 252-2702
- 8 other hotels and motels
| Most common first names in Napa, CA among deceased individuals | ||
| Name | Count | Lived (average) |
|---|---|---|
| John | 646 | 75.5 years |
| Mary | 509 | 79.9 years |
| William | 501 | 74.9 years |
| Robert | 443 | 71.0 years |
| James | 400 | 72.4 years |
| George | 360 | 77.0 years |
| Charles | 352 | 75.0 years |
| Helen | 261 | 81.2 years |
| Joseph | 259 | 76.8 years |
| Margaret | 247 | 80.0 years |
| Most common last names in Napa, CA among deceased individuals | ||
| Last name | Count | Lived (average) |
|---|---|---|
| Smith | 229 | 76.0 years |
| Johnson | 146 | 77.2 years |
| Brown | 135 | 76.9 years |
| Miller | 108 | 76.7 years |
| Anderson | 107 | 77.5 years |
| Williams | 105 | 76.9 years |
| Jones | 104 | 74.3 years |
| Wilson | 94 | 78.2 years |
| Davis | 87 | 77.0 years |
| Thompson | 82 | 76.4 years |
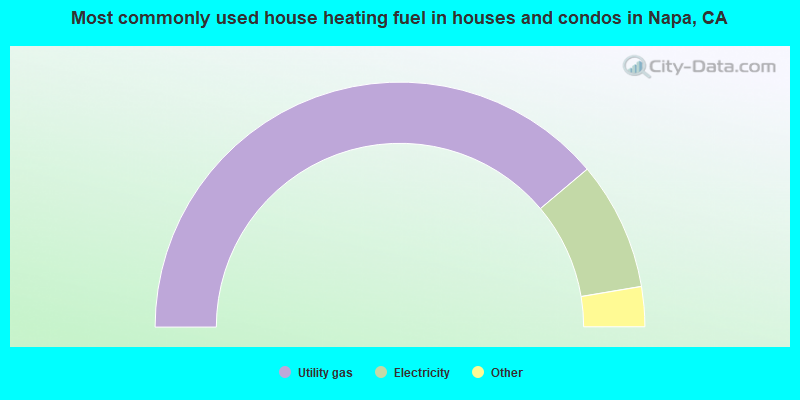
- 77.8%Utility gas
- 17.0%Electricity
- 2.1%Bottled, tank, or LP gas
- 1.4%Wood
- 1.2%Solar energy
- 0.3%No fuel used
- 0.2%Other fuel
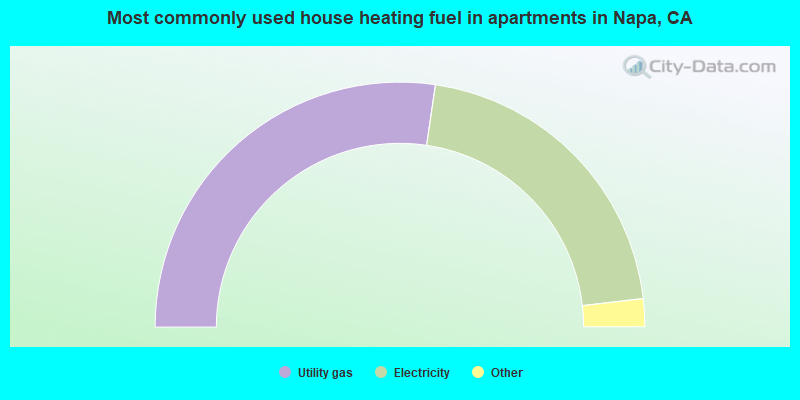
- 54.6%Utility gas
- 41.6%Electricity
- 1.7%Bottled, tank, or LP gas
- 1.4%No fuel used
- 0.2%Fuel oil, kerosene, etc.
- 0.2%Solar energy
- 0.2%Wood
Napa compared to California state average:
- Unemployed percentage significantly below state average.
- Black race population percentage significantly below state average.
- Median age above state average.
- Percentage of population with a bachelor's degree or higher above state average.
Napa on our top lists:
- #16 on the list of "Top 101 cities with largest percentage of females in industries: agriculture, forestry, fishing and hunting (population 50,000+)"
- #19 on the list of "Top 101 cities with the lowest number of police officers per 1000 residents (population 50,000+)"
- #20 on the list of "Top 101 cities with largest percentage of females in industries: accommodation and food services (population 50,000+)"
- #24 on the list of "Top 101 cities with the highest maximum monthly sunshine amount (population 50,000+)"
- #40 on the list of "Top 101 cities with the largest sunshine amount differences during a year (population 50,000+)"
- #48 on the list of "Top 101 cities with largest percentage of females in occupations: food preparation and serving related occupations (population 50,000+)"
- #50 on the list of "Top 101 cities with largest percentage of males in occupations: farming, fishing, and forestry occupations (population 50,000+)"
- #50 on the list of "Top 101 cities with largest percentage of males in occupations: office and administrative support occupations (population 50,000+)"
- #54 on the list of "Top 101 cities with largest percentage of males in industries: real estate and rental and leasing (population 50,000+)"
- #55 on the list of "Top 101 cities with largest percentage of males in industries: agriculture, forestry, fishing and hunting (population 50,000+)"
- #57 on the list of "Top 101 cities with the largest humidity differences during a year (population 50,000+)"
- #57 on the list of "Top 101 cities with the largest differences between morning and afternoon humidity (population 50,000+)"
- #64 on the list of "Top 101 cities with largest percentage of females in occupations: farming, fishing, and forestry occupations (population 50,000+)"
- #65 on the list of "Top 101 cities with largest percentage of females in occupations: building and grounds cleaning and maintenance occupations (population 50,000+)"
- #65 on the list of "Top 101 cities with largest percentage of females in industries: retail trade (population 50,000+)"
- #71 on the list of "Top 101 cities with the lowest number of days clear of clouds (population 50,000+)"
- #71 on the list of "Top 101 cities with the highest number of days clear of clouds (population 50,000+)"
- #76 on the list of "Top 101 cities with largest percentage of males in occupations: food preparation and serving related occupations (population 50,000+)"
- #81 on the list of "Top 101 cities with largest percentage of males in industries: accommodation and food services (population 50,000+)"
- #90 on the list of "Top 101 cities with largest percentage of males in industries: administrative and support and waste management services (population 50,000+)"
- #12 on the list of "Top 101 counties with the highest Particulate Matter (PM2.5) Annual air pollution readings in 2012 (µg/m3)"
- #18 on the list of "Top 101 counties with the highest Nitrogen Dioxide air pollution readings in 2012 (ppm)"
- #40 on the list of "Top 101 counties with the largest decrease in the number of deaths per 1000 residents 2000-2006 to 2007-2013 (pop. 50,000+)"
- #55 on the list of "Top 101 counties with the lowest percentage of residents relocating from foreign countries between 2010 and 2011 (pop. 50,000+)"
- #56 on the list of "Top 101 counties with the lowest Ozone (1-hour) air pollution readings in 2012 (ppm)"

|
|
Total of 438 patent applications in 2008-2024.