Estimated zip code population in 2022: 14,628 Zip code population in 2010: 15,768 Zip code population in 2000: 12,347
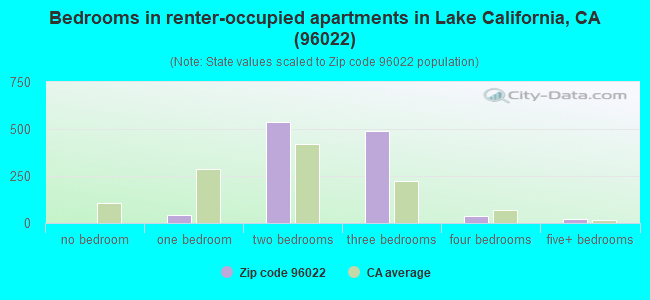
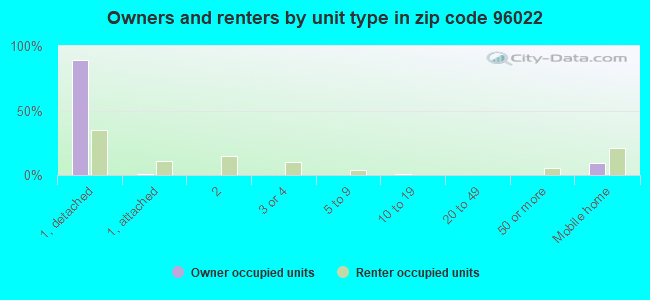
Houses and condos: 6,372 Renter-occupied apartments: 1,130
% of renters here:
19%
State:
44%
March 2022 cost of living index in zip code 96022: 95.1 (less than average, U.S. average is 100)
Land area: 242.0 sq. mi. Water area: 0.7 sq. mi.
Population density: 60 people per square mile
(very low).
OSM Map
General Map
Google Map
MSN Map
OSM Map
General Map
Google Map
MSN Map
OSM Map
General Map
Google Map
MSN Map
OSM Map
General Map
Google Map
MSN Map
Please wait while loading the map...
Real estate property taxes paid for housing units in 2022:
This zip code:
0.6% ($2,104)
California:
0.7% ($4,831)
Median real estate property taxes paid for housing units with mortgages in 2022: $2,251 (0.6%) Median real estate property taxes paid for housing units with no mortgage in 2022: $1,572 (0.6%)
Averages for the 2020 tax year for zip code 96022, filed in 2021:
Average Adjusted Gross Income (AGI) in 2020: $66,092 (Individual Income Tax Returns)
Here:
$66,092
State:
$95,910
Salary/wage: $59,450 (reported on 76.7% of returns)
Here:
$59,450
State:
$77,331
(% of AGI for various income ranges: 1198.0% for AGIs below $25k, 3576.4% for AGIs $25k-50k, 6777.9% for AGIs $50k-75k, 9464.4% for AGIs $75k-100k, 17736.1% for AGIs $100k-200k, 58050.0% for AGIs over 200k)
Taxable interest for individuals: $965 (reported on 39.5% of returns)
This zip code:
$965
California:
$2,294
(% of AGI for various income ranges: 22.2% for AGIs below $25k, 26.5% for AGIs $25k-50k, 35.9% for AGIs $50k-75k, 73.2% for AGIs $75k-100k, 120.0% for AGIs $100k-200k, 797.5% for AGIs over 200k)
Ordinary dividends: $3,974 (reported on 14.0% of returns)
Here:
$3,974
State:
$10,949
(% of AGI for various income ranges: 29.0% for AGIs below $25k, 36.9% for AGIs $25k-50k, 74.6% for AGIs $50k-75k, 97.0% for AGIs $75k-100k, 200.3% for AGIs $100k-200k, 893.8% for AGIs over 200k)
Net capital gain/loss in AGI: +$12,903 (reported on 14.4% of returns)
Here:
+$12,903
State:
+$49,306
(% of AGI for various income ranges: 15.2% for AGIs below $25k, 33.5% for AGIs $25k-50k, 89.0% for AGIs $50k-75k, 131.0% for AGIs $75k-100k, 417.0% for AGIs $100k-200k, 10435.0% for AGIs over 200k)
Profit/loss from business: +$11,554 (reported on 16.0% of returns)
Here:
+$11,554
State:
+$15,671
(% of AGI for various income ranges: 77.5% for AGIs below $25k, 159.3% for AGIs $25k-50k, 360.6% for AGIs $50k-75k, 370.2% for AGIs $75k-100k, 534.8% for AGIs $100k-200k, 2510.0% for AGIs over 200k)
Taxable individual retirement arrangement distribution: $16,046 (reported on 9.0% of returns)
96022:
$16,046
California:
$23,505
(% of AGI for various income ranges: 88.7% for AGIs below $25k, 85.7% for AGIs $25k-50k, 177.0% for AGIs $50k-75k, 334.4% for AGIs $75k-100k, 540.0% for AGIs $100k-200k, 1716.3% for AGIs over 200k)
Total itemized deductions: $29,766 (reported on 9.3% of returns)
Here:
$29,766
State:
$39,517
(% of AGI for various income ranges: 61.5% for AGIs below $25k, 154.2% for AGIs $25k-50k, 307.0% for AGIs $50k-75k, 618.2% for AGIs $75k-100k, 1103.9% for AGIs $100k-200k, 5008.8% for AGIs over 200k)
Charity contributions: $7,707 (reported on 6.3% of returns)
Here:
$7,707
State:
$12,598
(% of AGI for various income ranges: 15.7% for AGIs $25k-50k, 36.7% for AGIs $50k-75k, 65.8% for AGIs $75k-100k, 193.7% for AGIs $100k-200k, 1640.0% for AGIs over 200k)
Taxes paid: $7,794 (reported on 9.3% of returns)
96022:
$7,794
State:
$8,807
(% of AGI for various income ranges: 11.2% for AGIs below $25k, 25.7% for AGIs $25k-50k, 70.1% for AGIs $50k-75k, 172.4% for AGIs $75k-100k, 335.8% for AGIs $100k-200k, 1250.0% for AGIs over 200k)
Earned income credit: $2,155 (reported on 14.4% of returns)
Here:
$2,155
State:
$2,074
(% of AGI for various income ranges: 90.5% for AGIs below $25k, 79.7% for AGIs $25k-50k, 3.1% for AGIs $50k-75k)
Percentage of individuals using paid preparers for their 2020 taxes: 94.7%
Here:
95%
State:
92%
(% for various income ranges: 93.5% for AGIs below $25k, 95.9% for AGIs $25k-50k, 94.5% for AGIs $50k-75k, 94.9% for AGIs $75k-100k, 95.0% for AGIs $100k-200k, 95.8% for AGIs over 200k)
Averages for the 2012 tax year for zip code 96022, filed in 2013:
Average Adjusted Gross Income (AGI) in 2012: $49,697 (Individual Income Tax Returns)
Here:
$49,697
State:
$72,726
Salary/wage: $44,669 (reported on 77.8% of returns)
Here:
$44,669
State:
$59,079
(% of AGI for various income ranges: 67.6% for AGIs below $25k, 68.2% for AGIs $25k-50k, 70.2% for AGIs $50k-75k, 71.5% for AGIs $75k-100k, 75.9% for AGIs $100k-200k, 54.9% for AGIs over 200k)
Taxable interest for individuals: $978 (reported on 39.1% of returns)
This zip code:
$978
California:
$2,146
(% of AGI for various income ranges: 1.4% for AGIs below $25k, 0.5% for AGIs $25k-50k, 0.8% for AGIs $50k-75k, 1.0% for AGIs $75k-100k, 0.4% for AGIs $100k-200k, 1.1% for AGIs over 200k)
Ordinary dividends: $3,364 (reported on 14.4% of returns)
Here:
$3,364
State:
$9,308
(% of AGI for various income ranges: 1.2% for AGIs below $25k, 0.9% for AGIs $25k-50k, 1.0% for AGIs $50k-75k, 0.9% for AGIs $75k-100k, 0.9% for AGIs $100k-200k, 1.2% for AGIs over 200k)
Net capital gain/loss in AGI: +$8,628 (reported on 13.3% of returns)
Here:
+$8,628
State:
+$30,460
(% of AGI for various income ranges: 0.5% for AGIs $50k-75k, 1.0% for AGIs $75k-100k, 1.5% for AGIs $100k-200k, 17.6% for AGIs over 200k)
Profit/loss from business: +$9,939 (reported on 17.3% of returns)
Here:
+$9,939
State:
+$17,064
(% of AGI for various income ranges: 8.0% for AGIs below $25k, 5.8% for AGIs $25k-50k, 3.0% for AGIs $50k-75k, 1.9% for AGIs $75k-100k, 2.7% for AGIs $100k-200k)
Taxable individual retirement arrangement distribution: $15,516 (reported on 10.2% of returns)
96022:
$15,516
California:
$19,557
(% of AGI for various income ranges: 3.5% for AGIs below $25k, 2.9% for AGIs $25k-50k, 2.2% for AGIs $50k-75k, 3.2% for AGIs $75k-100k, 3.6% for AGIs $100k-200k, 4.1% for AGIs over 200k)
Total itemized deductions: $22,607 (27% of AGI, reported on 34.7% of returns)
Here:
$22,607
State:
$34,004
Here:
26.5% of AGI
State:
22.7% of AGI
(% of AGI for various income ranges: 13.1% for AGIs below $25k, 12.1% for AGIs $25k-50k, 14.2% for AGIs $50k-75k, 16.4% for AGIs $75k-100k, 17.8% for AGIs $100k-200k, 21.8% for AGIs over 200k)
Charity contributions: $2,532 (reported on 24.6% of returns)
Here:
$2,532
State:
$4,659
(% of AGI for various income ranges: 0.5% for AGIs below $25k, 1.1% for AGIs $25k-50k, 1.1% for AGIs $50k-75k, 1.5% for AGIs $75k-100k, 1.6% for AGIs $100k-200k, 1.3% for AGIs over 200k)
Taxes paid: $6,607 (reported on 34.7% of returns)
96022:
$6,607
State:
$14,448
(% of AGI for various income ranges: 2.2% for AGIs below $25k, 2.4% for AGIs $25k-50k, 3.3% for AGIs $50k-75k, 4.7% for AGIs $75k-100k, 6.7% for AGIs $100k-200k, 7.8% for AGIs over 200k)
Earned income credit: $2,121 (reported on 20.1% of returns)
Here:
$2,121
State:
$2,286
(% of AGI for various income ranges: 6.3% for AGIs below $25k, 1.3% for AGIs $25k-50k)
Percentage of individuals using paid preparers for their 2012 taxes: 60.4%
Here:
60%
State:
64%
(% for various income ranges: 52.5% for AGIs below $25k, 62.5% for AGIs $25k-50k, 65.6% for AGIs $50k-75k, 65.6% for AGIs $75k-100k, 68.8% for AGIs $100k-200k, 88.9% for AGIs over 200k)
Averages for the 2004 tax year for zip code 96022, filed in 2005:
Average Adjusted Gross Income (AGI) in 2004: $40,817 (Individual Income Tax Returns)
Here:
$40,817
State:
$58,600
Salary/wage: $36,841 (reported on 80.7% of returns)
Here:
$36,841
State:
$49,455
(% of AGI for various income ranges: 123.1% for AGIs below $10k, 68.9% for AGIs $10k-25k, 76.7% for AGIs $25k-50k, 79.0% for AGIs $50k-75k, 78.4% for AGIs $75k-100k, 59.0% for AGIs over 100k)
Taxable interest for individuals: $1,442 (reported on 44.8% of returns)
This zip code:
$1,442
California:
$2,365
(% of AGI for various income ranges: 11.1% for AGIs below $10k, 2.0% for AGIs $10k-25k, 1.0% for AGIs $25k-50k, 1.0% for AGIs $50k-75k, 0.7% for AGIs $75k-100k, 2.5% for AGIs over 100k)
Taxable dividends: $1,968 (reported on 17.8% of returns)
Here:
$1,968
State:
$4,746
(% of AGI for various income ranges: 5.4% for AGIs below $10k, 1.1% for AGIs $10k-25k, 0.9% for AGIs $25k-50k, 0.6% for AGIs $50k-75k, 0.8% for AGIs $75k-100k, 0.7% for AGIs over 100k)
Net capital gain/loss: +$12,833 (reported on 16.9% of returns)
Here:
+$12,833
State:
+$23,418
(% of AGI for various income ranges: 2.2% for AGIs below $10k, 1.0% for AGIs $10k-25k, 0.9% for AGIs $25k-50k, 2.1% for AGIs $50k-75k, 4.6% for AGIs $75k-100k, 14.7% for AGIs over 100k)
Profit/loss from business: +$12,471 (reported on 19.2% of returns)
Here:
+$12,471
State:
+$16,826
(% of AGI for various income ranges: 2.1% for AGIs below $10k, 7.1% for AGIs $10k-25k, 5.9% for AGIs $25k-50k, 3.9% for AGIs $50k-75k, 3.7% for AGIs $75k-100k, 8.7% for AGIs over 100k)
IRA payment deduction: $3,331 (reported on 2.5% of returns)
96022:
$3,331
California:
$3,192
(% of AGI for various income ranges: 0.3% for AGIs $10k-25k, 0.3% for AGIs $25k-50k, 0.2% for AGIs $50k-75k, 0.2% for AGIs $75k-100k, 0.2% for AGIs over 100k)
Self-employed pension: $12,317 (reported on 0.7% of returns)
Here:
$12,317
California:
$17,688
Total itemized deductions: $19,345 (28% of AGI, reported on 37.8% of returns)
Here:
$19,345
State:
$28,113
Here:
27.9% of AGI
State:
25.3% of AGI
(% of AGI for various income ranges: 21.5% for AGIs below $10k, 13.9% for AGIs $10k-25k, 16.8% for AGIs $25k-50k, 19.4% for AGIs $50k-75k, 19.7% for AGIs $75k-100k, 17.9% for AGIs over 100k)
Charity contributions deductions: $2,269 (3% of AGI, reported on 30.0% of returns)
Here:
$2,269
State:
$3,923
Here:
3.1% of AGI
State:
3.3% of AGI
(% of AGI for various income ranges: 1.1% for AGIs below $10k, 1.0% for AGIs $10k-25k, 1.6% for AGIs $25k-50k, 1.6% for AGIs $50k-75k, 1.7% for AGIs $75k-100k, 2.1% for AGIs over 100k)
Total tax: $5,188 (reported on 73.9% of returns)
96022:
$5,188
State:
$10,761
(% of AGI for various income ranges: 4.5% for AGIs below $10k, 4.1% for AGIs $10k-25k, 6.2% for AGIs $25k-50k, 7.7% for AGIs $50k-75k, 9.5% for AGIs $75k-100k, 16.2% for AGIs over 100k)
Earned income credit: $1,654 (reported on 16.7% of returns)
Here:
$1,654
State:
$1,763
Percentage of individuals using paid preparers for their 2004 taxes: 63.9%
Here:
64%
State:
66%
(% for various income ranges: 52.0% for AGIs below $10k, 60.6% for AGIs $10k-25k, 67.0% for AGIs $25k-50k, 70.5% for AGIs $50k-75k, 69.8% for AGIs $75k-100k, 77.0% for AGIs over 100k)
Likely homosexual households (counted as self-reported same-sex unmarried-partner households)
Lesbian couples: 0.0% of all households
Gay men: 0.3% of all households
Household received Food Stamps/SNAP in the past 12 months: 576 Household did not receive Food Stamps/SNAP in the past 12 months: 5,197
Women who had a birth in the past 12 months: 200 (90 now married, 111 unmarried) Women who did not have a birth in the past 12 months: 2,820 (1,709 now married, 1,086 unmarried)
Housing units in zip code 96022 with a mortgage: 3,089 (101 second mortgage, 71 both second mortgage and home equity loan) Houses without a mortgage: 46
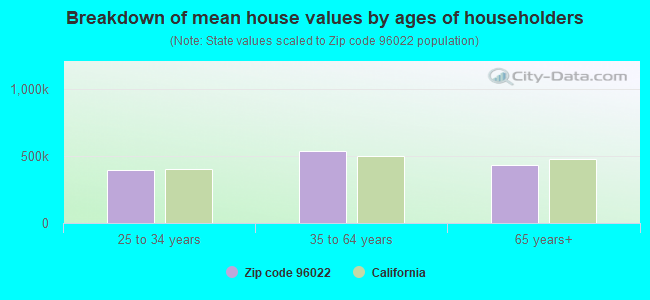
Median monthly owner costs for units with a mortgage: $1,801 Median monthly owner costs for units without a mortgage: $556
Residents with income below the poverty level in 2022:
This zip code:
11.7%
Whole state:
12.2%
Residents with income below 50% of the poverty level in 2022:
This zip code:
5.0%
Whole state:
6.2%
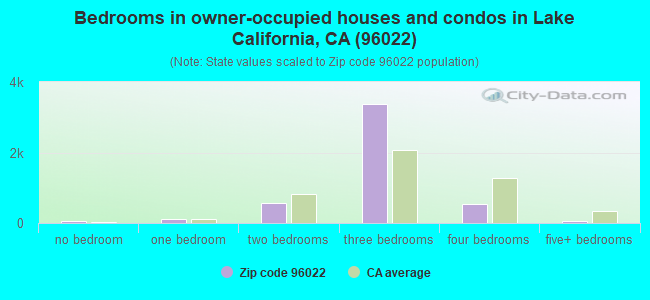
Median number of rooms in houses and condos:
Here:
5.9
State:
6.0
Median number of rooms in apartments:
Here:
4.6
State:
3.9
Notable locations in this zip code not listed on our city pages
Notable locations in zip code 96022: Cottonwood Substation (A), Baker Ranch (B), Ekelund Ranch (C), Rancho Rio Alto (D), Rancho Buena Ventura (E), Baker Fire Control Station (F), Tehama County Fire Department Station 2 Lake California (G), Reading Adobe (H), West Valley Volunteer Fire Company Station 55 (I), Tehama County Fire Department Station 3 Bowman (J), Tehama County Fire Department Baker (K), Cottonwood Fire Protection District (L). Display/hide their locations on the map
Creeks: Hooker Creek (A), Little Crane Creek (B), Fidler Creek (C), Cottonwood Creek (D), Salt Creek (E), Pine Creek (F), Patterson Creek (G), Anderson Creek (H), Antelope Creek (I). Display/hide their locations on the map
In group quarters: 18 (-1 institutionalized population)
Size of family households: 2,112 2-persons, 872 3-persons, 730 4-persons, 147 5-persons, 181 6-persons, 75 7-or-more-persons
Size of nonfamily households: 1,379 1-person, 316 2-persons, 7 3-persons
1,753 married couples with children.
620 single-parent households (245 men, 375 women).
95.5% of residents of 96022 zip code speak English at home.
2.3% of residents speak Spanish at home (69% very well, 26% well, 4% not well).
0.4% of residents speak other Indo-European language at home (100% very well).
1.3% of residents speak Asian or Pacific Island language at home (3% very well, 97% well).
0.1% of residents speak other language at home (100% very well).
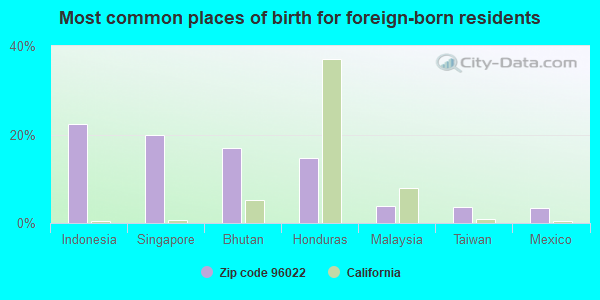
Foreign born population: 407 (2.8%) (70.4% of them are naturalized citizens)
This zip code:
2.8%
Whole state:
26.7%
22%Indonesia
20%Singapore
17%Bhutan
15%Honduras
4%Malaysia
4%Taiwan
3%Mexico
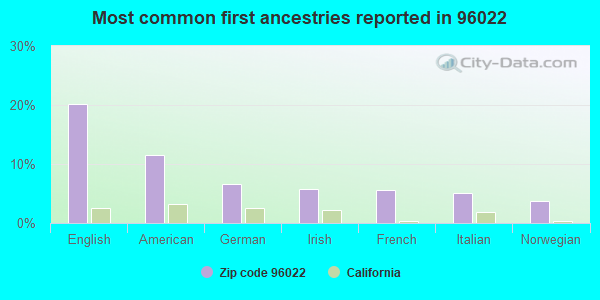
20%English
11%American
7%German
6%Irish
6%French
5%Italian
4%Norwegian
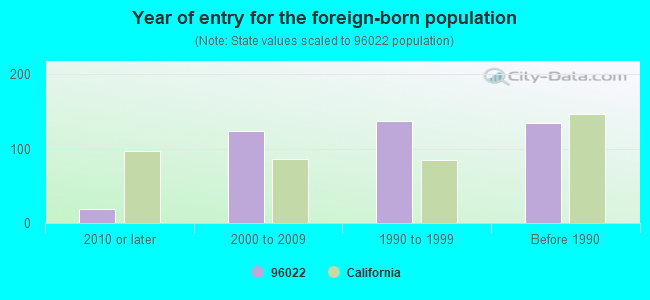
Year of entry for the foreign-born population
192010 or later
1232000 to 2009
1371990 to 1999
134Before 1990
Facilities with environmental interests located in this zip code:
ACORN TO OAKS CHARTER (16280 BOWMAN RD. in COTTONWOOD, CA)
(National Center for Education Statistics) - STATE ID-6119572 Organizations: REDDING ELEMENTARY (SCHOOL DISTRICT)
EAST COTTONWOOD ELEMENTARY (3425 BUSH ST. in COTTONWOOD, CA)
(National Center for Education Statistics) - STATE ID-6050199 Organizations: COTTONWOOD UNION ELEMENTARY (SCHOOL DISTRICT)
EVERGREEN COMMUNITY DAY (19500 LEARNING WAY in COTTONWOOD, CA)
(National Center for Education Statistics) - STATE ID-6114342 Organizations: EVERGREEN UNION ELEMENTARY (SCHOOL DISTRICT)
EVERGREEN ELEMENTARY (19415 HOOKER CREEK ROAD in COTTONWOOD, CA)
(National Center for Education Statistics) - STATE ID-6053516 Organizations: EVERGREEN UNION ELEMENTARY (SCHOOL DISTRICT)
EVERGREEN MIDDLE (19500 LEARNING WAY in COTTONWOOD, CA)
(National Center for Education Statistics) - STATE ID-6111629 Organizations: EVERGREEN UNION ELEMENTARY (SCHOOL DISTRICT)
LAKE CALIFORNIA WWTP (22131 LAKE CALIFORNIA DR in COTTONWOOD, CA)
National Pollutant Discharge Elimination System NON-MAJOR (Tracking pollutant discharge elimination systems) - permit Business SIC classification: SEWERAGE SYSTEMS Organizations: RIO ALTO WATER DIST. (CONTACT/OPERATOR)
, RIO ALTO WD (CONTACT/OWNER)
Alternative names: LAKE CALIFORNIA STP, RIO ALTO WD
EVERGREEN UNION SCHOOL DIST (HOOKER CREEK RD X BOWMAN RD in COTTONWOOD, CA)
Small Quantity Generators, between 100 kg and 1000 kg of hazardous waste/month (Resource Conservation and Recovery Act (tracking hazardous waste)) - notification TRANSPORTER (Resource Conservation and Recovery Act (tracking hazardous waste)) - notification Organizations: STATE OF CALIFORNIA (CONTACT/OWNER)
GEORGIA PACIFIC CORPORATION (OFF BALLS FERRY RD in COTTONWOOD, CA)
Small Quantity Generators, between 100 kg and 1000 kg of hazardous waste/month (Resource Conservation and Recovery Act (tracking hazardous waste)) - notification
JIM & LARRYS AUTOMTIVE (MAIN & OLIVE ST in COTTONWOOD, CA)
Small Quantity Generators, between 100 kg and 1000 kg of hazardous waste/month (Resource Conservation and Recovery Act (tracking hazardous waste)) - notification Organizations: J WELDAY & L BROWER (CONTACT/OWNER)
ANDERSON-COTTONWOOD CONCRETE (3119 TRADE WAY in COTTONWOOD, CA)
CRITERIA AND HAZARDOUS AIR POLLUTANT INVENTORY (Inventory of air pollution sources) Business SIC classification: CONSTRUCTION SAND AND GRAVEL
H. L. RODNEY CINDER SCREENING (16935 EVERGREEN WAY in COTTONWOOD, CA, CA)
CRITERIA AND HAZARDOUS AIR POLLUTANT INVENTORY (Inventory of air pollution sources) Business SIC classification: DIMENSION STONE
NORTH STATE ASPHALT INC. (19840 DRAPER ROAD in COTTONWOOD, CA, CA)
CRITERIA AND HAZARDOUS AIR POLLUTANT INVENTORY (Inventory of air pollution sources) Business SIC classification: ASPHALT PAVING MIXTURES AND BLOCKS
Housing units lacking complete plumbing facilities: 1.3% Housing units lacking complete kitchen facilities: 1.1%
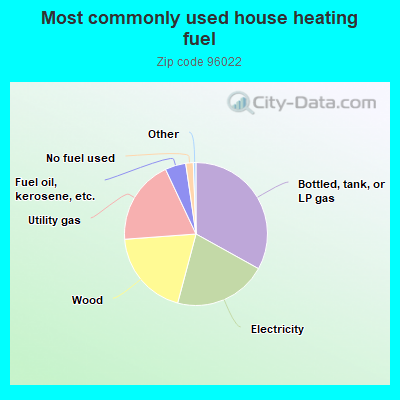
33.1%Bottled, tank, or LP gas
21.1%Electricity
19.7%Wood
19.2%Utility gas
4.7%Fuel oil, kerosene, etc.
1.7%No fuel used
Population in 1990: 9,579. Population change in the 1990s: +2,768 (+28.9%).
Place of birth for U.S.-born residents:
This state: 10,965
Northeast: 558
Midwest: 628
South: 694
West: 1,293
58% of the 96022 zip code residents lived in the same house 5 years ago. Out of people who lived in different houses, 42% lived in this county. Out of people who lived in different counties, 50% lived in California.
93% of the 96022 zip code residents lived in the same house 1 year ago. Out of people who lived in different houses, 30% moved from this county. Out of people who lived in different houses, 60% moved from different county within same state. Out of people who lived in different houses, 12% moved from different state. Out of people who lived in different houses, 3% moved from abroad.
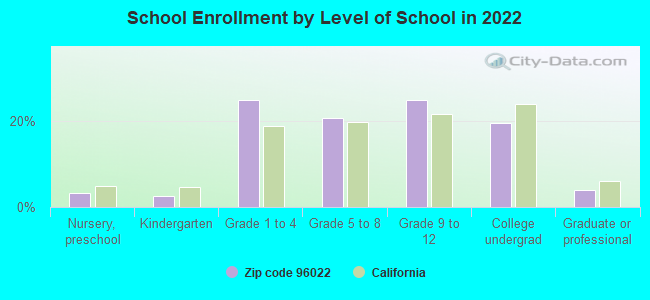
Private vs. public school enrollment:
Students in private schools in grades 1 to 8 (elementary and middle school): 172
Here:
12.4%
California:
10.5%
Students in private schools in grades 9 to 12 (high school): 51
Here:
6.8%
California:
8.5%
Students in private undergraduate colleges: 128
Here:
21.5%
California:
15.9%
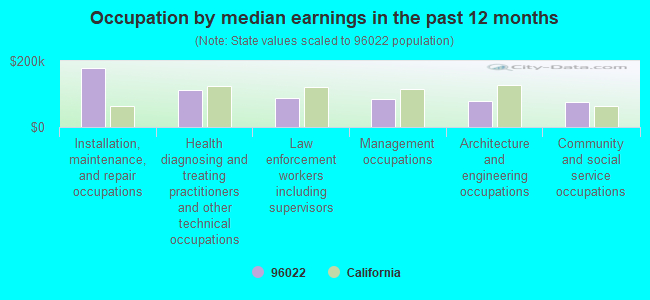
Occupation by median earnings in the past 12 months ($)
177,542Installation, maintenance, and repair occupations
113,049Health diagnosing and treating practitioners and other technical occupations
87,215Law enforcement workers including supervisors
85,957Management occupations
77,817Architecture and engineering occupations
74,858Community and social service occupations
Companies with federal contracts located in this zip code:
NORTH STATE EQUIPMENT HAULERS (18805 QUAIL RIDGE RD in COTTONWOOD, CA; small business) 5 employees, $310000 revenue.
$33,000 with Forest Service (disused code: now 12C2) for Forest/Range Fire Suppression/Presuppression Services. Signed on 2001-08-15. Completion date: 2001-09-15.
COTTONWOOD VETERINARY CLINIC (3917 MAIN ST in COTTONWOOD, CA; small business) 10 employees, $370000 revenue. : $29,500 in 3 contractsfrom 2002 to 2003
$15,000 with Soil Conservation Service (disused code) for Lease or Rental of Facilities -- Office Buildings. Taking place in CO. Signed on 2002-09-15. Completion date: 2002-09-15.
$14,500 with Natural Resources Conservation Service for Lease or Rental of Facilities -- Office Buildings. Taking place in CO. Signed on 2003-09-15. Completion date: 2003-09-15.
$0, same as above.Signed on 2003-09-15. Completion date: 2003-09-15.
Top industries in this zip code by the number of employees in 2005:
2005 - 2018 National Fire Incident Reporting System (NFIRS) incidents
According to the data from the years 2005 - 2018 the average number of fire incidents per year is 83. The highest number of reported fires - 136 took place in 2008, and the least - 13 in 2005. The data has an increasing trend.
When looking into fire subcategories, the most reports belonged to: Outside Fires (57.3%), and Structure Fires (22.3%).
Fire incident types reported to NFIRS in Zip Code 96022

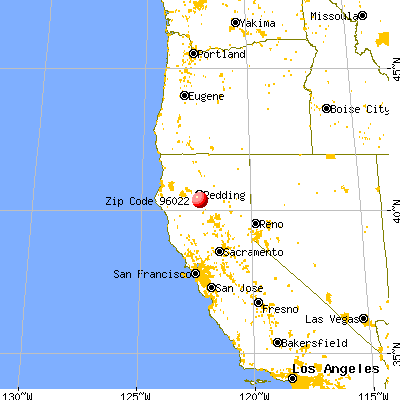


 Nearest zip codes: 96080, 96007, 96002, 96047, 96001, 96087.
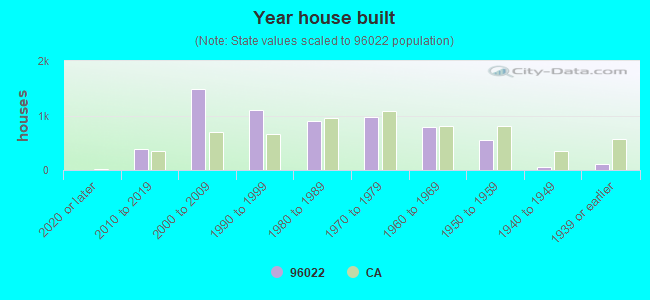


 According to the data from the years 2005 - 2018 the average number of fire incidents per year is 83. The highest number of reported fires - 136 took place in 2008, and the least - 13 in 2005. The data has an increasing trend.
 When looking into fire subcategories, the most reports belonged to: Outside Fires (57.3%), and Structure Fires (22.3%).