Brentwood, California Submit your own pictures of this city and show them to the world
OSM Map
General Map
Google Map
MSN Map
OSM Map
General Map
Google Map
MSN Map
OSM Map
General Map
Google Map
MSN Map
OSM Map
General Map
Google Map
MSN Map
Please wait while loading the map...
Population in 2022: 66,127 (100% urban, 0% rural). Population change since 2000: +183.8%Males: 32,303 Females: 33,824
March 2022 cost of living index in Brentwood: 118.1 (more than average, U.S. average is 100) Percentage of residents living in poverty in 2022: 8.9%for White Non-Hispanic residents , 3.2% for Black residents , 8.2% for Hispanic or Latino residents , 13.3% for American Indian residents , 13.4% for other race residents , 3.2% for two or more races residents )
Profiles of local businesses
Business Search - 14 Million verified businesses
Data:
Median household income ($)
Median household income (% change since 2000)
Household income diversity
Ratio of average income to average house value (%)
Ratio of average income to average rent
Median household income ($) - White
Median household income ($) - Black or African American
Median household income ($) - Asian
Median household income ($) - Hispanic or Latino
Median household income ($) - American Indian and Alaska Native
Median household income ($) - Multirace
Median household income ($) - Other Race
Median household income for houses/condos with a mortgage ($)
Median household income for apartments without a mortgage ($)
Races - White alone (%)
Races - White alone (% change since 2000)
Races - Black alone (%)
Races - Black alone (% change since 2000)
Races - American Indian alone (%)
Races - American Indian alone (% change since 2000)
Races - Asian alone (%)
Races - Asian alone (% change since 2000)
Races - Hispanic (%)
Races - Hispanic (% change since 2000)
Races - Native Hawaiian and Other Pacific Islander alone (%)
Races - Native Hawaiian and Other Pacific Islander alone (% change since 2000)
Races - Two or more races (%)
Races - Two or more races (% change since 2000)
Races - Other race alone (%)
Races - Other race alone (% change since 2000)
Racial diversity
Unemployment (%)
Unemployment (% change since 2000)
Unemployment (%) - White
Unemployment (%) - Black or African American
Unemployment (%) - Asian
Unemployment (%) - Hispanic or Latino
Unemployment (%) - American Indian and Alaska Native
Unemployment (%) - Multirace
Unemployment (%) - Other Race
Population density (people per square mile)
Population - Males (%)
Population - Females (%)
Population - Males (%) - White
Population - Males (%) - Black or African American
Population - Males (%) - Asian
Population - Males (%) - Hispanic or Latino
Population - Males (%) - American Indian and Alaska Native
Population - Males (%) - Multirace
Population - Males (%) - Other Race
Population - Females (%) - White
Population - Females (%) - Black or African American
Population - Females (%) - Asian
Population - Females (%) - Hispanic or Latino
Population - Females (%) - American Indian and Alaska Native
Population - Females (%) - Multirace
Population - Females (%) - Other Race
Coronavirus confirmed cases (May 13, 2024)
Deaths caused by coronavirus (May 13, 2024)
Coronavirus confirmed cases (per 100k population) (May 13, 2024)
Deaths caused by coronavirus (per 100k population) (May 13, 2024)
Daily increase in number of cases (May 13, 2024)
Weekly increase in number of cases (May 13, 2024)
Cases doubled (in days) (May 13, 2024)
Hospitalized patients (Apr 18, 2022)
Negative test results (Apr 18, 2022)
Total test results (Apr 18, 2022)
COVID Vaccine doses distributed (per 100k population) (Sep 19, 2023)
COVID Vaccine doses administered (per 100k population) (Sep 19, 2023)
COVID Vaccine doses distributed (Sep 19, 2023)
COVID Vaccine doses administered (Sep 19, 2023)
Likely homosexual households (%)
Likely homosexual households (% change since 2000)
Likely homosexual households - Lesbian couples (%)
Likely homosexual households - Lesbian couples (% change since 2000)
Likely homosexual households - Gay men (%)
Likely homosexual households - Gay men (% change since 2000)
Cost of living index
Median gross rent ($)
Median contract rent ($)
Median monthly housing costs ($)
Median house or condo value ($)
Median house or condo value ($ change since 2000)
Mean house or condo value by units in structure - 1, detached ($)
Mean house or condo value by units in structure - 1, attached ($)
Mean house or condo value by units in structure - 2 ($)
Mean house or condo value by units in structure by units in structure - 3 or 4 ($)
Mean house or condo value by units in structure - 5 or more ($)
Mean house or condo value by units in structure - Boat, RV, van, etc. ($)
Mean house or condo value by units in structure - Mobile home ($)
Median house or condo value ($) - White
Median house or condo value ($) - Black or African American
Median house or condo value ($) - Asian
Median house or condo value ($) - Hispanic or Latino
Median house or condo value ($) - American Indian and Alaska Native
Median house or condo value ($) - Multirace
Median house or condo value ($) - Other Race
Median resident age
Resident age diversity
Median resident age - Males
Median resident age - Females
Median resident age - White
Median resident age - Black or African American
Median resident age - Asian
Median resident age - Hispanic or Latino
Median resident age - American Indian and Alaska Native
Median resident age - Multirace
Median resident age - Other Race
Median resident age - Males - White
Median resident age - Males - Black or African American
Median resident age - Males - Asian
Median resident age - Males - Hispanic or Latino
Median resident age - Males - American Indian and Alaska Native
Median resident age - Males - Multirace
Median resident age - Males - Other Race
Median resident age - Females - White
Median resident age - Females - Black or African American
Median resident age - Females - Asian
Median resident age - Females - Hispanic or Latino
Median resident age - Females - American Indian and Alaska Native
Median resident age - Females - Multirace
Median resident age - Females - Other Race
Commute - mean travel time to work (minutes)
Travel time to work - Less than 5 minutes (%)
Travel time to work - Less than 5 minutes (% change since 2000)
Travel time to work - 5 to 9 minutes (%)
Travel time to work - 5 to 9 minutes (% change since 2000)
Travel time to work - 10 to 19 minutes (%)
Travel time to work - 10 to 19 minutes (% change since 2000)
Travel time to work - 20 to 29 minutes (%)
Travel time to work - 20 to 29 minutes (% change since 2000)
Travel time to work - 30 to 39 minutes (%)
Travel time to work - 30 to 39 minutes (% change since 2000)
Travel time to work - 40 to 59 minutes (%)
Travel time to work - 40 to 59 minutes (% change since 2000)
Travel time to work - 60 to 89 minutes (%)
Travel time to work - 60 to 89 minutes (% change since 2000)
Travel time to work - 90 or more minutes (%)
Travel time to work - 90 or more minutes (% change since 2000)
Marital status - Never married (%)
Marital status - Now married (%)
Marital status - Separated (%)
Marital status - Widowed (%)
Marital status - Divorced (%)
Median family income ($)
Median family income (% change since 2000)
Median non-family income ($)
Median non-family income (% change since 2000)
Median per capita income ($)
Median per capita income (% change since 2000)
Median family income ($) - White
Median family income ($) - Black or African American
Median family income ($) - Asian
Median family income ($) - Hispanic or Latino
Median family income ($) - American Indian and Alaska Native
Median family income ($) - Multirace
Median family income ($) - Other Race
Median year house/condo built
Median year apartment built
Year house built - Built 2005 or later (%)
Year house built - Built 2000 to 2004 (%)
Year house built - Built 1990 to 1999 (%)
Year house built - Built 1980 to 1989 (%)
Year house built - Built 1970 to 1979 (%)
Year house built - Built 1960 to 1969 (%)
Year house built - Built 1950 to 1959 (%)
Year house built - Built 1940 to 1949 (%)
Year house built - Built 1939 or earlier (%)
Average household size
Household density (households per square mile)
Average household size - White
Average household size - Black or African American
Average household size - Asian
Average household size - Hispanic or Latino
Average household size - American Indian and Alaska Native
Average household size - Multirace
Average household size - Other Race
Occupied housing units (%)
Vacant housing units (%)
Owner occupied housing units (%)
Renter occupied housing units (%)
Vacancy status - For rent (%)
Vacancy status - For sale only (%)
Vacancy status - Rented or sold, not occupied (%)
Vacancy status - For seasonal, recreational, or occasional use (%)
Vacancy status - For migrant workers (%)
Vacancy status - Other vacant (%)
Residents with income below the poverty level (%)
Residents with income below 50% of the poverty level (%)
Children below poverty level (%)
Poor families by family type - Married-couple family (%)
Poor families by family type - Male, no wife present (%)
Poor families by family type - Female, no husband present (%)
Poverty status for native-born residents (%)
Poverty status for foreign-born residents (%)
Poverty among high school graduates not in families (%)
Poverty among people who did not graduate high school not in families (%)
Residents with income below the poverty level (%) - White
Residents with income below the poverty level (%) - Black or African American
Residents with income below the poverty level (%) - Asian
Residents with income below the poverty level (%) - Hispanic or Latino
Residents with income below the poverty level (%) - American Indian and Alaska Native
Residents with income below the poverty level (%) - Multirace
Residents with income below the poverty level (%) - Other Race
Air pollution - Air Quality Index (AQI)
Air pollution - CO
Air pollution - NO2
Air pollution - SO2
Air pollution - Ozone
Air pollution - PM10
Air pollution - PM25
Air pollution - Pb
Crime - Murders per 100,000 population
Crime - Rapes per 100,000 population
Crime - Robberies per 100,000 population
Crime - Assaults per 100,000 population
Crime - Burglaries per 100,000 population
Crime - Thefts per 100,000 population
Crime - Auto thefts per 100,000 population
Crime - Arson per 100,000 population
Crime - City-data.com crime index
Crime - Violent crime index
Crime - Property crime index
Crime - Murders per 100,000 population (5 year average)
Crime - Rapes per 100,000 population (5 year average)
Crime - Robberies per 100,000 population (5 year average)
Crime - Assaults per 100,000 population (5 year average)
Crime - Burglaries per 100,000 population (5 year average)
Crime - Thefts per 100,000 population (5 year average)
Crime - Auto thefts per 100,000 population (5 year average)
Crime - Arson per 100,000 population (5 year average)
Crime - City-data.com crime index (5 year average)
Crime - Violent crime index (5 year average)
Crime - Property crime index (5 year average)
1996 Presidential Elections Results (%) - Democratic Party (Clinton)
1996 Presidential Elections Results (%) - Republican Party (Dole)
1996 Presidential Elections Results (%) - Other
2000 Presidential Elections Results (%) - Democratic Party (Gore)
2000 Presidential Elections Results (%) - Republican Party (Bush)
2000 Presidential Elections Results (%) - Other
2004 Presidential Elections Results (%) - Democratic Party (Kerry)
2004 Presidential Elections Results (%) - Republican Party (Bush)
2004 Presidential Elections Results (%) - Other
2008 Presidential Elections Results (%) - Democratic Party (Obama)
2008 Presidential Elections Results (%) - Republican Party (McCain)
2008 Presidential Elections Results (%) - Other
2012 Presidential Elections Results (%) - Democratic Party (Obama)
2012 Presidential Elections Results (%) - Republican Party (Romney)
2012 Presidential Elections Results (%) - Other
2016 Presidential Elections Results (%) - Democratic Party (Clinton)
2016 Presidential Elections Results (%) - Republican Party (Trump)
2016 Presidential Elections Results (%) - Other
2020 Presidential Elections Results (%) - Democratic Party (Biden)
2020 Presidential Elections Results (%) - Republican Party (Trump)
2020 Presidential Elections Results (%) - Other
Ancestries Reported - Arab (%)
Ancestries Reported - Czech (%)
Ancestries Reported - Danish (%)
Ancestries Reported - Dutch (%)
Ancestries Reported - English (%)
Ancestries Reported - French (%)
Ancestries Reported - French Canadian (%)
Ancestries Reported - German (%)
Ancestries Reported - Greek (%)
Ancestries Reported - Hungarian (%)
Ancestries Reported - Irish (%)
Ancestries Reported - Italian (%)
Ancestries Reported - Lithuanian (%)
Ancestries Reported - Norwegian (%)
Ancestries Reported - Polish (%)
Ancestries Reported - Portuguese (%)
Ancestries Reported - Russian (%)
Ancestries Reported - Scotch-Irish (%)
Ancestries Reported - Scottish (%)
Ancestries Reported - Slovak (%)
Ancestries Reported - Subsaharan African (%)
Ancestries Reported - Swedish (%)
Ancestries Reported - Swiss (%)
Ancestries Reported - Ukrainian (%)
Ancestries Reported - United States (%)
Ancestries Reported - Welsh (%)
Ancestries Reported - West Indian (%)
Ancestries Reported - Other (%)
Educational Attainment - No schooling completed (%)
Educational Attainment - Less than high school (%)
Educational Attainment - High school or equivalent (%)
Educational Attainment - Less than 1 year of college (%)
Educational Attainment - 1 or more years of college (%)
Educational Attainment - Associate degree (%)
Educational Attainment - Bachelor's degree (%)
Educational Attainment - Master's degree (%)
Educational Attainment - Professional school degree (%)
Educational Attainment - Doctorate degree (%)
School Enrollment - Nursery, preschool (%)
School Enrollment - Kindergarten (%)
School Enrollment - Grade 1 to 4 (%)
School Enrollment - Grade 5 to 8 (%)
School Enrollment - Grade 9 to 12 (%)
School Enrollment - College undergrad (%)
School Enrollment - Graduate or professional (%)
School Enrollment - Not enrolled in school (%)
School enrollment - Public schools (%)
School enrollment - Private schools (%)
School enrollment - Not enrolled (%)
Median number of rooms in houses and condos
Median number of rooms in apartments
Housing units lacking complete plumbing facilities (%)
Housing units lacking complete kitchen facilities (%)
Density of houses
Urban houses (%)
Rural houses (%)
Households with people 60 years and over (%)
Households with people 65 years and over (%)
Households with people 75 years and over (%)
Households with one or more nonrelatives (%)
Households with no nonrelatives (%)
Population in households (%)
Family households (%)
Nonfamily households (%)
Population in families (%)
Family households with own children (%)
Median number of bedrooms in owner occupied houses
Mean number of bedrooms in owner occupied houses
Median number of bedrooms in renter occupied houses
Mean number of bedrooms in renter occupied houses
Median number of vehichles in owner occupied houses
Mean number of vehichles in owner occupied houses
Median number of vehichles in renter occupied houses
Mean number of vehichles in renter occupied houses
Mortgage status - with mortgage (%)
Mortgage status - with second mortgage (%)
Mortgage status - with home equity loan (%)
Mortgage status - with both second mortgage and home equity loan (%)
Mortgage status - without a mortgage (%)
Average family size
Average family size - White
Average family size - Black or African American
Average family size - Asian
Average family size - Hispanic or Latino
Average family size - American Indian and Alaska Native
Average family size - Multirace
Average family size - Other Race
Geographical mobility - Same house 1 year ago (%)
Geographical mobility - Moved within same county (%)
Geographical mobility - Moved from different county within same state (%)
Geographical mobility - Moved from different state (%)
Geographical mobility - Moved from abroad (%)
Place of birth - Born in state of residence (%)
Place of birth - Born in other state (%)
Place of birth - Native, outside of US (%)
Place of birth - Foreign born (%)
Housing units in structures - 1, detached (%)
Housing units in structures - 1, attached (%)
Housing units in structures - 2 (%)
Housing units in structures - 3 or 4 (%)
Housing units in structures - 5 to 9 (%)
Housing units in structures - 10 to 19 (%)
Housing units in structures - 20 to 49 (%)
Housing units in structures - 50 or more (%)
Housing units in structures - Mobile home (%)
Housing units in structures - Boat, RV, van, etc. (%)
House/condo owner moved in on average (years ago)
Renter moved in on average (years ago)
Year householder moved into unit - Moved in 1999 to March 2000 (%)
Year householder moved into unit - Moved in 1995 to 1998 (%)
Year householder moved into unit - Moved in 1990 to 1994 (%)
Year householder moved into unit - Moved in 1980 to 1989 (%)
Year householder moved into unit - Moved in 1970 to 1979 (%)
Year householder moved into unit - Moved in 1969 or earlier (%)
Means of transportation to work - Drove car alone (%)
Means of transportation to work - Carpooled (%)
Means of transportation to work - Public transportation (%)
Means of transportation to work - Bus or trolley bus (%)
Means of transportation to work - Streetcar or trolley car (%)
Means of transportation to work - Subway or elevated (%)
Means of transportation to work - Railroad (%)
Means of transportation to work - Ferryboat (%)
Means of transportation to work - Taxicab (%)
Means of transportation to work - Motorcycle (%)
Means of transportation to work - Bicycle (%)
Means of transportation to work - Walked (%)
Means of transportation to work - Other means (%)
Working at home (%)
Industry diversity
Most Common Industries - Agriculture, forestry, fishing and hunting, and mining (%)
Most Common Industries - Agriculture, forestry, fishing and hunting (%)
Most Common Industries - Mining, quarrying, and oil and gas extraction (%)
Most Common Industries - Construction (%)
Most Common Industries - Manufacturing (%)
Most Common Industries - Wholesale trade (%)
Most Common Industries - Retail trade (%)
Most Common Industries - Transportation and warehousing, and utilities (%)
Most Common Industries - Transportation and warehousing (%)
Most Common Industries - Utilities (%)
Most Common Industries - Information (%)
Most Common Industries - Finance and insurance, and real estate and rental and leasing (%)
Most Common Industries - Finance and insurance (%)
Most Common Industries - Real estate and rental and leasing (%)
Most Common Industries - Professional, scientific, and management, and administrative and waste management services (%)
Most Common Industries - Professional, scientific, and technical services (%)
Most Common Industries - Management of companies and enterprises (%)
Most Common Industries - Administrative and support and waste management services (%)
Most Common Industries - Educational services, and health care and social assistance (%)
Most Common Industries - Educational services (%)
Most Common Industries - Health care and social assistance (%)
Most Common Industries - Arts, entertainment, and recreation, and accommodation and food services (%)
Most Common Industries - Arts, entertainment, and recreation (%)
Most Common Industries - Accommodation and food services (%)
Most Common Industries - Other services, except public administration (%)
Most Common Industries - Public administration (%)
Occupation diversity
Most Common Occupations - Management, business, science, and arts occupations (%)
Most Common Occupations - Management, business, and financial occupations (%)
Most Common Occupations - Management occupations (%)
Most Common Occupations - Business and financial operations occupations (%)
Most Common Occupations - Computer, engineering, and science occupations (%)
Most Common Occupations - Computer and mathematical occupations (%)
Most Common Occupations - Architecture and engineering occupations (%)
Most Common Occupations - Life, physical, and social science occupations (%)
Most Common Occupations - Education, legal, community service, arts, and media occupations (%)
Most Common Occupations - Community and social service occupations (%)
Most Common Occupations - Legal occupations (%)
Most Common Occupations - Education, training, and library occupations (%)
Most Common Occupations - Arts, design, entertainment, sports, and media occupations (%)
Most Common Occupations - Healthcare practitioners and technical occupations (%)
Most Common Occupations - Health diagnosing and treating practitioners and other technical occupations (%)
Most Common Occupations - Health technologists and technicians (%)
Most Common Occupations - Service occupations (%)
Most Common Occupations - Healthcare support occupations (%)
Most Common Occupations - Protective service occupations (%)
Most Common Occupations - Fire fighting and prevention, and other protective service workers including supervisors (%)
Most Common Occupations - Law enforcement workers including supervisors (%)
Most Common Occupations - Food preparation and serving related occupations (%)
Most Common Occupations - Building and grounds cleaning and maintenance occupations (%)
Most Common Occupations - Personal care and service occupations (%)
Most Common Occupations - Sales and office occupations (%)
Most Common Occupations - Sales and related occupations (%)
Most Common Occupations - Office and administrative support occupations (%)
Most Common Occupations - Natural resources, construction, and maintenance occupations (%)
Most Common Occupations - Farming, fishing, and forestry occupations (%)
Most Common Occupations - Construction and extraction occupations (%)
Most Common Occupations - Installation, maintenance, and repair occupations (%)
Most Common Occupations - Production, transportation, and material moving occupations (%)
Most Common Occupations - Production occupations (%)
Most Common Occupations - Transportation occupations (%)
Most Common Occupations - Material moving occupations (%)
People in Group quarters - Institutionalized population (%)
People in Group quarters - Correctional institutions (%)
People in Group quarters - Federal prisons and detention centers (%)
People in Group quarters - Halfway houses (%)
People in Group quarters - Local jails and other confinement facilities (including police lockups) (%)
People in Group quarters - Military disciplinary barracks (%)
People in Group quarters - State prisons (%)
People in Group quarters - Other types of correctional institutions (%)
People in Group quarters - Nursing homes (%)
People in Group quarters - Hospitals/wards, hospices, and schools for the handicapped (%)
People in Group quarters - Hospitals/wards and hospices for chronically ill (%)
People in Group quarters - Hospices or homes for chronically ill (%)
People in Group quarters - Military hospitals or wards for chronically ill (%)
People in Group quarters - Other hospitals or wards for chronically ill (%)
People in Group quarters - Hospitals or wards for drug/alcohol abuse (%)
People in Group quarters - Mental (Psychiatric) hospitals or wards (%)
People in Group quarters - Schools, hospitals, or wards for the mentally retarded (%)
People in Group quarters - Schools, hospitals, or wards for the physically handicapped (%)
People in Group quarters - Institutions for the deaf (%)
People in Group quarters - Institutions for the blind (%)
People in Group quarters - Orthopedic wards and institutions for the physically handicapped (%)
People in Group quarters - Wards in general hospitals for patients who have no usual home elsewhere (%)
People in Group quarters - Wards in military hospitals for patients who have no usual home elsewhere (%)
People in Group quarters - Juvenile institutions (%)
People in Group quarters - Long-term care (%)
People in Group quarters - Homes for abused, dependent, and neglected children (%)
People in Group quarters - Residential treatment centers for emotionally disturbed children (%)
People in Group quarters - Training schools for juvenile delinquents (%)
People in Group quarters - Short-term care, detention or diagnostic centers for delinquent children (%)
People in Group quarters - Type of juvenile institution unknown (%)
People in Group quarters - Noninstitutionalized population (%)
People in Group quarters - College dormitories (includes college quarters off campus) (%)
People in Group quarters - Military quarters (%)
People in Group quarters - On base (%)
People in Group quarters - Barracks, unaccompanied personnel housing (UPH), (Enlisted/Officer), ;and similar group living quarters for military personnel (%)
People in Group quarters - Transient quarters for temporary residents (%)
People in Group quarters - Military ships (%)
People in Group quarters - Group homes (%)
People in Group quarters - Homes or halfway houses for drug/alcohol abuse (%)
People in Group quarters - Homes for the mentally ill (%)
People in Group quarters - Homes for the mentally retarded (%)
People in Group quarters - Homes for the physically handicapped (%)
People in Group quarters - Other group homes (%)
People in Group quarters - Religious group quarters (%)
People in Group quarters - Dormitories (%)
People in Group quarters - Agriculture workers' dormitories on farms (%)
People in Group quarters - Job Corps and vocational training facilities (%)
People in Group quarters - Other workers' dormitories (%)
People in Group quarters - Crews of maritime vessels (%)
People in Group quarters - Other nonhousehold living situations (%)
People in Group quarters - Other noninstitutional group quarters (%)
Residents speaking English at home (%)
Residents speaking English at home - Born in the United States (%)
Residents speaking English at home - Native, born elsewhere (%)
Residents speaking English at home - Foreign born (%)
Residents speaking Spanish at home (%)
Residents speaking Spanish at home - Born in the United States (%)
Residents speaking Spanish at home - Native, born elsewhere (%)
Residents speaking Spanish at home - Foreign born (%)
Residents speaking other language at home (%)
Residents speaking other language at home - Born in the United States (%)
Residents speaking other language at home - Native, born elsewhere (%)
Residents speaking other language at home - Foreign born (%)
Class of Workers - Employee of private company (%)
Class of Workers - Self-employed in own incorporated business (%)
Class of Workers - Private not-for-profit wage and salary workers (%)
Class of Workers - Local government workers (%)
Class of Workers - State government workers (%)
Class of Workers - Federal government workers (%)
Class of Workers - Self-employed workers in own not incorporated business and Unpaid family workers (%)
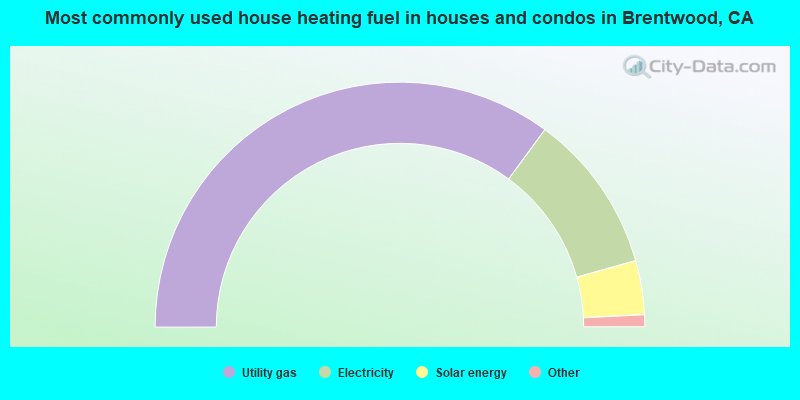
House heating fuel used in houses and condos - Utility gas (%)
House heating fuel used in houses and condos - Bottled, tank, or LP gas (%)
House heating fuel used in houses and condos - Electricity (%)
House heating fuel used in houses and condos - Fuel oil, kerosene, etc. (%)
House heating fuel used in houses and condos - Coal or coke (%)
House heating fuel used in houses and condos - Wood (%)
House heating fuel used in houses and condos - Solar energy (%)
House heating fuel used in houses and condos - Other fuel (%)
House heating fuel used in houses and condos - No fuel used (%)
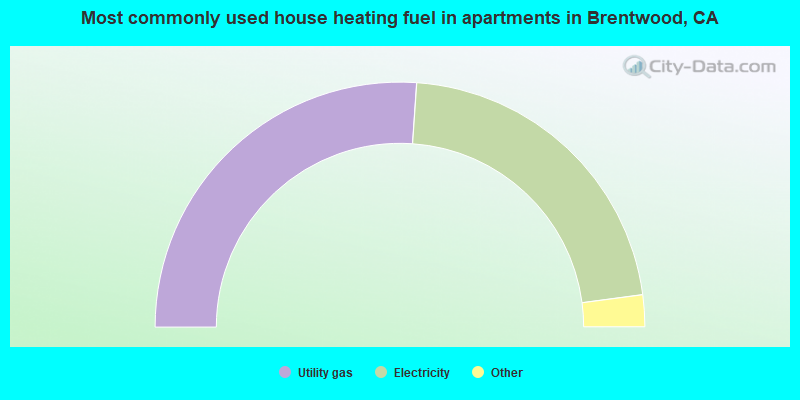
House heating fuel used in apartments - Utility gas (%)
House heating fuel used in apartments - Bottled, tank, or LP gas (%)
House heating fuel used in apartments - Electricity (%)
House heating fuel used in apartments - Fuel oil, kerosene, etc. (%)
House heating fuel used in apartments - Coal or coke (%)
House heating fuel used in apartments - Wood (%)
House heating fuel used in apartments - Solar energy (%)
House heating fuel used in apartments - Other fuel (%)
House heating fuel used in apartments - No fuel used (%)
Armed forces status - In Armed Forces (%)
Armed forces status - Civilian (%)
Armed forces status - Civilian - Veteran (%)
Armed forces status - Civilian - Nonveteran (%)
Fatal accidents locations in years 2005-2021
Fatal accidents locations in 2005
Fatal accidents locations in 2006
Fatal accidents locations in 2007
Fatal accidents locations in 2008
Fatal accidents locations in 2009
Fatal accidents locations in 2010
Fatal accidents locations in 2011
Fatal accidents locations in 2012
Fatal accidents locations in 2013
Fatal accidents locations in 2014
Fatal accidents locations in 2015
Fatal accidents locations in 2016
Fatal accidents locations in 2017
Fatal accidents locations in 2018
Fatal accidents locations in 2019
Fatal accidents locations in 2020
Fatal accidents locations in 2021
Alcohol use - People drinking some alcohol every month (%)
Alcohol use - People not drinking at all (%)
Alcohol use - Average days/month drinking alcohol
Alcohol use - Average drinks/week
Alcohol use - Average days/year people drink much
Audiometry - Average condition of hearing (%)
Audiometry - People that can hear a whisper from across a quiet room (%)
Audiometry - People that can hear normal voice from across a quiet room (%)
Audiometry - Ears ringing, roaring, buzzing (%)
Audiometry - Had a job exposure to loud noise (%)
Audiometry - Had off-work exposure to loud noise (%)
Blood Pressure & Cholesterol - Has high blood pressure (%)
Blood Pressure & Cholesterol - Checking blood pressure at home (%)
Blood Pressure & Cholesterol - Frequently checking blood cholesterol (%)
Blood Pressure & Cholesterol - Has high cholesterol level (%)
Consumer Behavior - Money monthly spent on food at supermarket/grocery store
Consumer Behavior - Money monthly spent on food at other stores
Consumer Behavior - Money monthly spent on eating out
Consumer Behavior - Money monthly spent on carryout/delivered foods
Consumer Behavior - Income spent on food at supermarket/grocery store (%)
Consumer Behavior - Income spent on food at other stores (%)
Consumer Behavior - Income spent on eating out (%)
Consumer Behavior - Income spent on carryout/delivered foods (%)
Current Health Status - General health condition (%)
Current Health Status - Blood donors (%)
Current Health Status - Has blood ever tested for HIV virus (%)
Current Health Status - Left-handed people (%)
Dermatology - People using sunscreen (%)
Diabetes - Diabetics (%)
Diabetes - Had a blood test for high blood sugar (%)
Diabetes - People taking insulin (%)
Diet Behavior & Nutrition - Diet health (%)
Diet Behavior & Nutrition - Milk product consumption (# of products/month)
Diet Behavior & Nutrition - Meals not home prepared (#/week)
Diet Behavior & Nutrition - Meals from fast food or pizza place (#/week)
Diet Behavior & Nutrition - Ready-to-eat foods (#/month)
Diet Behavior & Nutrition - Frozen meals/pizza (#/month)
Drug Use - People that ever used marijuana or hashish (%)
Drug Use - Ever used hard drugs (%)
Drug Use - Ever used any form of cocaine (%)
Drug Use - Ever used heroin (%)
Drug Use - Ever used methamphetamine (%)
Health Insurance - People covered by health insurance (%)
Kidney Conditions-Urology - Avg. # of times urinating at night
Medical Conditions - People with asthma (%)
Medical Conditions - People with anemia (%)
Medical Conditions - People with psoriasis (%)
Medical Conditions - People with overweight (%)
Medical Conditions - Elderly people having difficulties in thinking or remembering (%)
Medical Conditions - People who ever received blood transfusion (%)
Medical Conditions - People having trouble seeing even with glass/contacts (%)
Medical Conditions - People with arthritis (%)
Medical Conditions - People with gout (%)
Medical Conditions - People with congestive heart failure (%)
Medical Conditions - People with coronary heart disease (%)
Medical Conditions - People with angina pectoris (%)
Medical Conditions - People who ever had heart attack (%)
Medical Conditions - People who ever had stroke (%)
Medical Conditions - People with emphysema (%)
Medical Conditions - People with thyroid problem (%)
Medical Conditions - People with chronic bronchitis (%)
Medical Conditions - People with any liver condition (%)
Medical Conditions - People who ever had cancer or malignancy (%)
Mental Health - People who have little interest in doing things (%)
Mental Health - People feeling down, depressed, or hopeless (%)
Mental Health - People who have trouble sleeping or sleeping too much (%)
Mental Health - People feeling tired or having little energy (%)
Mental Health - People with poor appetite or overeating (%)
Mental Health - People feeling bad about themself (%)
Mental Health - People who have trouble concentrating on things (%)
Mental Health - People moving or speaking slowly or too fast (%)
Mental Health - People having thoughts they would be better off dead (%)
Oral Health - Average years since last visit a dentist
Oral Health - People embarrassed because of mouth (%)
Oral Health - People with gum disease (%)
Oral Health - General health of teeth and gums (%)
Oral Health - Average days a week using dental floss/device
Oral Health - Average days a week using mouthwash for dental problem
Oral Health - Average number of teeth
Pesticide Use - Households using pesticides to control insects (%)
Pesticide Use - Households using pesticides to kill weeds (%)
Physical Activity - People doing vigorous-intensity work activities (%)
Physical Activity - People doing moderate-intensity work activities (%)
Physical Activity - People walking or bicycling (%)
Physical Activity - People doing vigorous-intensity recreational activities (%)
Physical Activity - People doing moderate-intensity recreational activities (%)
Physical Activity - Average hours a day doing sedentary activities
Physical Activity - Average hours a day watching TV or videos
Physical Activity - Average hours a day using computer
Physical Functioning - People having limitations keeping them from working (%)
Physical Functioning - People limited in amount of work they can do (%)
Physical Functioning - People that need special equipment to walk (%)
Physical Functioning - People experiencing confusion/memory problems (%)
Physical Functioning - People requiring special healthcare equipment (%)
Prescription Medications - Average number of prescription medicines taking
Preventive Aspirin Use - Adults 40+ taking low-dose aspirin (%)
Reproductive Health - Vaginal deliveries (%)
Reproductive Health - Cesarean deliveries (%)
Reproductive Health - Deliveries resulted in a live birth (%)
Reproductive Health - Pregnancies resulted in a delivery (%)
Reproductive Health - Women breastfeeding newborns (%)
Reproductive Health - Women that had a hysterectomy (%)
Reproductive Health - Women that had both ovaries removed (%)
Reproductive Health - Women that have ever taken birth control pills (%)
Reproductive Health - Women taking birth control pills (%)
Reproductive Health - Women that have ever used Depo-Provera or injectables (%)
Reproductive Health - Women that have ever used female hormones (%)
Sexual Behavior - People 18+ that ever had sex (vaginal, anal, or oral) (%)
Sexual Behavior - Males 18+ that ever had vaginal sex with a woman (%)
Sexual Behavior - Males 18+ that ever performed oral sex on a woman (%)
Sexual Behavior - Males 18+ that ever had anal sex with a woman (%)
Sexual Behavior - Males 18+ that ever had any sex with a man (%)
Sexual Behavior - Females 18+ that ever had vaginal sex with a man (%)
Sexual Behavior - Females 18+ that ever performed oral sex on a man (%)
Sexual Behavior - Females 18+ that ever had anal sex with a man (%)
Sexual Behavior - Females 18+ that ever had any kind of sex with a woman (%)
Sexual Behavior - Average age people first had sex
Sexual Behavior - Average number of female sex partners in lifetime (males 18+)
Sexual Behavior - Average number of female vaginal sex partners in lifetime (males 18+)
Sexual Behavior - Average age people first performed oral sex on a woman (18+)
Sexual Behavior - Average number of woman performed oral sex on in lifetime (18+)
Sexual Behavior - Average number of male sex partners in lifetime (males 18+)
Sexual Behavior - Average number of male anal sex partners in lifetime (males 18+)
Sexual Behavior - Average age people first performed oral sex on a man (18+)
Sexual Behavior - Average number of male oral sex partners in lifetime (18+)
Sexual Behavior - People using protection when performing oral sex (%)
Sexual Behavior - Average number of times people have vaginal or anal sex a year
Sexual Behavior - People having sex without condom (%)
Sexual Behavior - Average number of male sex partners in lifetime (females 18+)
Sexual Behavior - Average number of male vaginal sex partners in lifetime (females 18+)
Sexual Behavior - Average number of female sex partners in lifetime (females 18+)
Sexual Behavior - Circumcised males 18+ (%)
Sleep Disorders - Average hours sleeping at night
Sleep Disorders - People that has trouble sleeping (%)
Smoking-Cigarette Use - People smoking cigarettes (%)
Taste & Smell - People 40+ having problems with smell (%)
Taste & Smell - People 40+ having problems with taste (%)
Taste & Smell - People 40+ that ever had wisdom teeth removed (%)
Taste & Smell - People 40+ that ever had tonsils teeth removed (%)
Taste & Smell - People 40+ that ever had a loss of consciousness because of a head injury (%)
Taste & Smell - People 40+ that ever had a broken nose or other serious injury to face or skull (%)
Taste & Smell - People 40+ that ever had two or more sinus infections (%)
Weight - Average height (inches)
Weight - Average weight (pounds)
Weight - Average BMI
Weight - People that are obese (%)
Weight - People that ever were obese (%)
Weight - People trying to lose weight (%)
30,900 46.7% White alone 18,717 28.3% Hispanic 8,215 12.4% Asian alone 4,454 6.7% Black alone 3,236 4.9% Two or more races 346 0.5% Other race alone 209 0.3% American Indian alone 43 0.07% Native Hawaiian and Other
According to our research of California and other state lists, there were 38 registered sex offenders living in Brentwood, California as of May 13, 2024 . The ratio of all residents to sex offenders in Brentwood is 1,535 to 1.The ratio of registered sex offenders to all residents in this city is lower than the state average.
The City-Data.com crime index weighs serious crimes and violent crimes more heavily. Higher means more crime, U.S. average is 246.1. It adjusts for the number of visitors and daily workers commuting into cities.
- means the value is smaller than the state average.
- means the value is about the same as the state average.
- means the value is bigger than the state average.
Crime rate in Brentwood detailed stats: murders, rapes, robberies, assaults, burglaries, thefts, arson Officers per 1,000 residents here:
0.96California average:
2.30
Latest news from Brentwood, CA collected exclusively by city-data.com from local newspapers, TV, and radio stations
Ancestries: European (5.2%), Irish (3.8%), English (3.8%), German (3.4%), American (2.5%), African (1.9%).
Current Local Time:
Land area: 11.6 square miles.
Population density: 5,679 people per square mile (average).
10,833 residents are foreign born (8.8% Asia , 5.6% Latin America ).
This city:
16.9%California:
26.5%
Median real estate property taxes paid for housing units with mortgages in 2022: $8,022 (0.9%)Median real estate property taxes paid for housing units with no mortgage in 2022: $8,204 (1.0%)
Nearest city with pop. 50,000+: East Contra Costa, CA (1.4 miles
Nearest city with pop. 200,000+: Central Contra Costa, CA (18.4 miles
Nearest city with pop. 1,000,000+: Los Angeles, CA
Nearest cities:
Latitude: 37.94 N, Longitude: 121.71 W
Daytime population change due to commuting: -10,470 (-15.8%)Workers who live and work in this city: 13,066 (42.6%)
Area code commonly used in this area: 925
Single-family new house construction building permits:
2022: 208 buildings , average cost: $196,0002021: 288 buildings , average cost: $143,1002020: 274 buildings , average cost: $208,7002019: 323 buildings , average cost: $204,3002018: 324 buildings , average cost: $205,8002017: 506 buildings , average cost: $223,0002016: 559 buildings , average cost: $220,9002015: 486 buildings , average cost: $210,0002014: 476 buildings , average cost: $174,4002013: 478 buildings , average cost: $204,9002012: 248 buildings , average cost: $209,2002011: 104 buildings , average cost: $207,9002010: 167 buildings , average cost: $202,1002009: 87 buildings , average cost: $214,9002008: 37 buildings , average cost: $203,0002007: 357 buildings , average cost: $217,0002006: 475 buildings , average cost: $235,9002005: 1413 buildings , average cost: $213,3002004: 1308 buildings , average cost: $207,8002003: 1360 buildings , average cost: $191,5002002: 1682 buildings , average cost: $192,9002001: 1254 buildings , average cost: $180,6002000: 952 buildings , average cost: $186,0001999: 1128 buildings , average cost: $159,1001998: 611 buildings , average cost: $159,3001997: 623 buildings , average cost: $144,700Unemployment in December 2023:
Population change in the 1990s: +14,945 (+178.8%).
Most common occupations in Brentwood, CA (%)
Both Males Females
Other management occupations, except farmers and farm managers (6.2%)
Other sales and related occupations, including supervisors (4.9%)
Building and grounds cleaning and maintenance occupations (4.6%)
Other office and administrative support workers, including supervisors (3.6%)
Sales representatives, services, wholesale and manufacturing (3.6%)
Computer specialists (3.4%)
Preschool, kindergarten, elementary, and middle school teachers (3.4%)
Other management occupations, except farmers and farm managers (6.5%)
Other sales and related occupations, including supervisors (5.9%)
Building and grounds cleaning and maintenance occupations (5.6%)
Computer specialists (4.4%)
Electrical equipment mechanics and other installation, maintenance, and repair workers, including supervisors (4.3%)
Law enforcement workers, including supervisors (4.2%)
Supervisors, construction and extraction workers (4.1%)
Other office and administrative support workers, including supervisors (8.1%)
Preschool, kindergarten, elementary, and middle school teachers (6.6%)
Other management occupations, except farmers and farm managers (5.8%)
Secretaries and administrative assistants (5.0%)
Other teachers, instructors, education, training, and library occupations (4.7%)
Customer service representatives (3.8%)
Sales representatives, services, wholesale and manufacturing (3.6%)
Earthquake activity:
Brentwood-area historical earthquake activity is significantly above California state average. It is 7840% greater than the overall U.S. average. On 4/18/1906 at 13:12:21, a magnitude 7.9 (7.9 UK, Class: Major, Intensity: VIII - XII) earthquake occurred 70.5 miles away from Brentwood center, causing $524,000,000 total damage On 10/18/1989 at 00:04:15, a magnitude 7.1 (6.5 MB, 7.1 MS, 6.9 MW, 7.0 ML) earthquake occurred 57.2 miles away from the city center, causing 62 deaths ( 62 shaking deaths) and 3757 injuries, causing $1,305,032,704 total damage On 7/21/1952 at 11:52:14, a magnitude 7.7 (7.7 UK) earthquake occurred 252.8 miles away from the city center, causing $50,000,000 total damage On 11/4/1927 at 13:51:53, a magnitude 7.5 (7.5 UK) earthquake occurred 212.3 miles away from the city center On 1/31/1922 at 13:17:28, a magnitude 7.6 (7.6 UK) earthquake occurred 280.8 miles away from the city center On 10/3/1915 at 06:52:48, a magnitude 7.6 (7.6 UK) earthquake occurred 286.9 miles away from Brentwood center Magnitude types: body-wave magnitude (MB), local magnitude (ML), surface-wave magnitude (MS), moment magnitude (MW) Natural disasters: The number of natural disasters in Contra Costa County (18) is near the US average (15).Major Disasters (Presidential) Declared: 11Emergencies Declared: 3Floods: 13, Storms: 7, Winter Storms: 7, Mudslides: 5, Landslides: 4, Drought: 1, Earthquake: 1, Hurricane: 1, Tornado: 1, Wind: 1, Other: 1 (Note: some incidents may be assigned to more than one category). Hospitals and medical centers in Brentwood: FMC DIABLO BRENTWOOD (4510 OHARA AVENUE SUITE B)
Other hospitals and medical centers near Brentwood: KC'S SUNSHINE HOMES, ANGELIC II (Hospital, about 3 miles away; OAKLEY, CA)
KAISER FOUNDATION HOSPITAL - ANTIOCH (about 4 miles away; ANTIOCH, CA)
FMC EAST ANTIOCH (Dialysis Facility, about 5 miles away; ANTIOCH, CA)
LONE TREE CONV HOSP (Nursing Home, about 5 miles away; ANTIOCH, CA)
SUTTER DELTA MEDICAL CENTER (about 5 miles away; ANTIOCH, CA)
AMERICAN STAR HOME II ICF/DD-N (Hospital, about 6 miles away; ANTIOCH, CA)
PUTNAM ICF (Hospital, about 8 miles away; ANTIOCH, CA)
Airports located in Brentwood: Amtrak stations near Brentwood: 9 miles: ANTIOCH-PITTSBURG (ANTIOCH, I ST. & SANTA FE TRACKS) Services: public payphones, full-service food facilities, free short-term parking, free long-term parking, call for taxi service, intercity bus service, public transit connection.
17 miles: LIVERMORE (720 LAS FLORES DR.) - Bus Station Services: fully wheelchair accessible, enclosed waiting area, public restrooms, public payphones, full-service food facilities, free short-term parking, free long-term parking, call for taxi service, intercity bus service, public transit connection.
20 miles: EAST DUBLIN-PLEASANTON (PLEASANTON, OWENS DR. AT BART WAY) - Bus Station Colleges/universities with over 2000 students nearest to Brentwood:
Los Medanos College (about 10 miles; Pittsburg, CA ; Full-time enrollment: 5,289)
Las Positas College (about 17 miles; Livermore, CA ; FT enrollment: 5,112)
Diablo Valley College (about 20 miles; Pleasant Hill, CA ; FT enrollment: 13,015)
San Joaquin Delta College (about 22 miles; Stockton, CA ; FT enrollment: 12,167)
University of the Pacific (about 23 miles; Stockton, CA ; FT enrollment: 4,999)
Saint Mary's College of California (about 23 miles; Moraga, CA ; FT enrollment: 4,200)
Merritt College (about 27 miles; Oakland, CA ; FT enrollment: 2,842)
Public high school in Brentwood: DIVIDE HIGH Location: 4405 HIGHWAY 193, Grades: 9-12)
Notable locations in Brentwood: (A) , Brentwood Branch Contra Costa County Library (B) , Brentwood City Hall (C) , East Contra Costa Fire Protection District Station 52 (D) , East Contra Costa Fire Protection District Station 54 (E) . Display/hide their locations on the map
Shopping Center: (1) . Display/hide its location on the map
Churches in Brentwood include: (A) , Saint Alban's Episcopal Church (B) , Neighborhood Church (C) , Grace Bible Fellowship Church (D) , Church of Christ (E) , Brentwood Community Methodist Church (F) , Brentwood Baptist Church (G) . Display/hide their locations on the map
Creeks: (A) , Dry Creek (B) . Display/hide their locations on the map
Parks in Brentwood include: (1) , McClarren Park (2) , Sunset Park (3) . Display/hide their locations on the map
Tourist attraction:
Birthplace of: Sarah G. Buxton - Film actor.
Contra Costa County has a predicted average indoor radon screening level between 2 and 4 pCi/L (pico curies per liter) - Moderate Potential Drinking water stations with addresses in Brentwood and their reported violations in the past:
LONE TREE MEDICAL & DENTAL (Population served: 45, Groundwater):
Past health violations:
MCL, Average - In SEP-2008, Contaminant: Nitrate. Follow-up actions: St Compliance achieved (2 times from OCT-21-2008 to OCT-21-2008)
Past monitoring violations:
2 routine major monitoring violations
2 minor monitoring violations
Drinking water stations with addresses in Brentwood that have no violations reported:
COW CREEK PERMITTEES ASSOCIATION (Population served: 100, Primary Water Source Type: Groundwater)
LOS VAQUEROS INTERPRETIVE CENTER (Population served: 100, Primary Water Source Type: Surface water)
LOS VAQUEROS MARINA BLDG (Population served: 50, Primary Water Source Type: Surface water)
LINDQUIST LANDING MARINA (Population served: 30, Primary Water Source Type: Groundwater)
Average household size: This city:
3.1 peopleCalifornia:
2.9 people
Percentage of family households: This city:
80.1%Whole state:
68.7%
Percentage of households with unmarried partners: This city:
5.7%Whole state:
7.2%
Likely homosexual households (counted as self-reported same-sex unmarried-partner households)
Lesbian couples: 0.6% of all households Gay men: 0.3% of all households
People in group quarters in Brentwood in 2010:
53 people in other noninstitutional facilities
44 people in group homes intended for adults
23 people in workers' group living quarters and job corps centers
21 people in emergency and transitional shelters (with sleeping facilities) for people experiencing homelessness
5 people in nursing facilities/skilled-nursing facilities
People in group quarters in Brentwood in 2000:
17 people in other noninstitutional group quarters
7 people in nursing homes
7 people in homes for the mentally retarded
6 people in religious group quarters
Banks with most branches in Brentwood (2011 data):
Bank of Agriculture and Commerce: Brentwood Branch at 740 First Street, branch established on 1967/06/30; Country Club Branch at 2251 Balfour Rd, branch established on 2008/07/09. Info updated 2009/08/28: Bank assets: $469.4 mil, Deposits: $403.6 mil, headquarters in Stockton, CA, positive income , Commercial Lending Specialization, 10 total offices , Holding Company: Bac Financial Inc.
U.S. Bank National Association: Somerset Safeway Branch at 3110 Balfour Road, branch established on 2005/06/13; Brentwood Safeway at 1125 Second Steet, branch established on 2007/10/27. Info updated 2012/01/30: Bank assets: $330,470.8 mil, Deposits: $236,091.5 mil, headquarters in Cincinnati, OH, positive income , 3121 total offices , Holding Company: U.S. Bancorp
Bank of America, National Association: Brentwood Branch at 241 Oak Street, branch established on 1930/11/03; Slatten Branch at 6261 Lone Tree Way, branch established on 2007/04/30. Info updated 2009/11/18: Bank assets: $1,451,969.3 mil, Deposits: $1,077,176.8 mil, headquarters in Charlotte, NC, positive income , 5782 total offices , Holding Company: Bank Of America Corporation
Fremont Bank: Brentwood Branch at 200 Sand Creek Road - Suite F, branch established on 2004/02/04. Info updated 2006/11/03: Bank assets: $2,367.9 mil, Deposits: $1,975.1 mil, headquarters in Fremont, CA, positive income , Commercial Lending Specialization, 19 total offices , Holding Company: Fremont Bancorporation
Bank of the West: Brentwood Branch at 4540 Balfour Road, branch established on 1921/01/01. Info updated 2009/11/16: Bank assets: $62,408.3 mil, Deposits: $43,995.2 mil, headquarters in San Francisco, CA, positive income , 647 total offices , Holding Company: Bnp Paribas
First Bank: Lone Tree Way Branch at 6590 Lone Tree Way, branch established on 2007/09/24. Info updated 2007/12/04: Bank assets: $6,579.8 mil, Deposits: $5,800.6 mil, headquarters in Creve Coeur, MO, negative income in the last year , Commercial Lending Specialization, 148 total offices , Holding Company: First Banks, Inc.
Tri Counties Bank: Brentwood Branch at 2400 Sand Creek Road, branch established on 2002/05/01. Info updated 2011/09/26: Bank assets: $2,554.4 mil, Deposits: $2,191.2 mil, headquarters in Chico, CA, positive income , Commercial Lending Specialization, 71 total offices , Holding Company: Trico Bancshares
Wells Fargo Bank, National Association: Brentwood Branch at 1115 2nd Street, branch established on 2001/11/08. Info updated 2011/04/05: Bank assets: $1,161,490.0 mil, Deposits: $905,653.0 mil, headquarters in Sioux Falls, SD, positive income , 6395 total offices , Holding Company: Wells Fargo & Company
Citibank, National Association: Lone Tree- Brentwood Branch at 6041 Lone Tree Way, branch established on 2006/10/01. Info updated 2012/01/10: Bank assets: $1,288,658.0 mil, Deposits: $882,541.0 mil, headquarters in Sioux Falls, SD, positive income , International Specialization, 1048 total offices , Holding Company: Citigroup Inc.
For population 15 years and over in Brentwood:
Never married: 28.7%Now married: 57.3%Separated: 2.3%Widowed: 4.0%Divorced: 7.6% For population 25 years and over in Brentwood:
High school or higher: 91.6%Bachelor's degree or higher: 38.5%Graduate or professional degree: 10.7%Unemployed: 5.4%Mean travel time to work (commute): 28.3 minutes
Education Gini index (Inequality in education) Here:
11.7California average:
15.5
Religion statistics for Brentwood, CA (based on Contra Costa County data)
Religion Adherents Congregations Catholic 228,400 34 Evangelical Protestant 81,120 352 Other 48,553 123 Mainline Protestant 32,693 101 Black Protestant 10,395 34 Orthodox 2,435 8 None 645,429 -
Source: Clifford Grammich, Kirk Hadaway, Richard Houseal, Dale E.Jones, Alexei Krindatch, Richie Stanley and Richard H.Taylor. 2012. 2010 U.S.Religion Census: Religious Congregations & Membership Study. Association of Statisticians of American Religious Bodies. Jones, Dale E., et al. 2002. Congregations and Membership in the United States 2000. Nashville, TN: Glenmary Research Center. Graphs represent county-level data
Food Environment Statistics: Number of grocery stores : 181This county :
1.78 / 10,000 pop.California :
2.14 / 10,000 pop.
Number of supercenters and club stores : 5This county :
0.05 / 10,000 pop.State :
0.04 / 10,000 pop.
Number of convenience stores (no gas) : 52This county :
0.51 / 10,000 pop.State :
0.62 / 10,000 pop.
Number of convenience stores (with gas) : 178Contra Costa County :
1.75 / 10,000 pop.California :
1.49 / 10,000 pop.
Number of full-service restaurants : 683Here :
6.73 / 10,000 pop.California :
7.42 / 10,000 pop.
Adult diabetes rate : Contra Costa County :
7.1%California :
7.3%
Adult obesity rate : This county :
22.2%State :
21.3%
Low-income preschool obesity rate : Contra Costa County :
16.8%State :
17.9%
Health and Nutrition: Healthy diet rate : Brentwood:
49.2%State:
49.4%
Average overall health of teeth and gums : Average BMI : Brentwood:
28.7California:
28.1
People feeling badly about themselves : Brentwood:
21.5%State:
20.2%
People not drinking alcohol at all : Here:
9.9%California:
11.2%
Average hours sleeping at night : This city:
6.8California:
6.8
Overweight people : This city:
34.7%California:
31.5%
General health condition : This city:
56.7%State:
56.4%
Average condition of hearing : Brentwood:
80.7%California:
80.9%
More about Health and Nutrition of Brentwood, CA Residents
Local government employment and payroll (March 2022)
Function
Full-time employees
Monthly full-time payroll
Average yearly full-time wage
Part-time employees
Monthly part-time payroll
Police Protection - Officers
66 $916,828 $166,696 0 $0 Financial Administration
32 $332,539 $124,702 0 $0 Police - Other
28 $248,173 $106,360 4 $12,018 Parks and Recreation
26 $253,390 $116,949 93 $65,442 Other Government Administration
25 $291,831 $140,079 11 $6,911 Streets and Highways
24 $284,031 $142,016 0 $0 Solid Waste Management
22 $196,438 $107,148 7 $19,488 Other and Unallocable
22 $216,048 $117,844 0 $0 Water Supply
17 $160,747 $113,468 0 $0 Sewerage
16 $168,202 $126,152 1 $1,847 Housing and Community Development (Local)
11 $113,568 $123,892 1 $2,526 Judicial and Legal
5 $74,599 $179,038 0 $0 Health
3 $31,160 $124,640 0 $0
Totals for Government
297 $3,287,554 $132,830 117 $108,232
Brentwood government finances - Expenditure in 2017 (per resident):
Construction - Housing and Community Development: $4,985,000 ($75.39)
Parks and Recreation: $3,315,000 ($50.13)Solid Waste Management: $2,509,000 ($37.94)Water Utilities: $1,414,000 ($21.38)Regular Highways: $987,000 ($14.93)Sewerage: $161,000 ($2.43)Current Operations - Police Protection: $21,271,000 ($321.67)
Water Utilities: $15,656,000 ($236.76)Regular Highways: $12,377,000 ($187.17)Central Staff Services: $12,267,000 ($185.51)Solid Waste Management: $11,282,000 ($170.61)Parks and Recreation: $10,756,000 ($162.66)Sewerage: $8,485,000 ($128.31)Protective Inspection and Regulation - Other: $3,589,000 ($54.27)Housing and Community Development: $2,252,000 ($34.06)Financial Administration: $1,635,000 ($24.73)General - Other: $197,000 ($2.98)Libraries: $110,000 ($1.66)Local Fire Protection: $4,000 ($0.06)General - Interest on Debt: $6,474,000 ($97.90)
Intergovernmental to Local - Other - Police Protection: $712,000 ($10.77)
Other - Health - Other: $324,000 ($4.90)Other Capital Outlay - Water Utilities: $5,318,000 ($80.42)
General Public Building: $2,404,000 ($36.35)Water Utilities - Interest on Debt: $2,126,000 ($32.15)
Brentwood government finances - Revenue in 2017 (per resident):
Charges - Other: $39,860,000 ($602.78)
Solid Waste Management: $11,376,000 ($172.03)Sewerage: $11,261,000 ($170.29)Regular Highways: $5,917,000 ($89.48)Parks and Recreation: $1,039,000 ($15.71)Housing and Community Development: $285,000 ($4.31)Federal Intergovernmental - Other: $1,113,000 ($16.83)
Local Intergovernmental - Other: $1,591,000 ($24.06)
Miscellaneous - Special Assessments: $11,864,000 ($179.41)
General Revenue - Other: $4,662,000 ($70.50)Donations From Private Sources: $1,750,000 ($26.46)Rents: $632,000 ($9.56)Interest Earnings: $560,000 ($8.47)Fines and Forfeits: $132,000 ($2.00)Revenue - Water Utilities: $17,897,000 ($270.65)
State Intergovernmental - Other: $1,265,000 ($19.13)
Highways: $1,157,000 ($17.50)General Local Government Support: $95,000 ($1.44)Tax - Property: $19,385,000 ($293.15)
Other: $11,162,000 ($168.80)General Sales and Gross Receipts: $9,076,000 ($137.25)Other License: $3,903,000 ($59.02)Public Utilities Sales: $1,487,000 ($22.49)Occupation and Business License - Other: $888,000 ($13.43)Documentary and Stock Transfer: $548,000 ($8.29)Other Selective Sales: $397,000 ($6.00)
Brentwood government finances - Debt in 2017 (per resident):
Long Term Debt - Beginning Outstanding - Unspecified Public Purpose: $185,277,000 ($2801.84)
Outstanding Unspecified Public Purpose: $177,308,000 ($2681.33)Retired Unspecified Public Purpose: $8,303,000 ($125.56)Issue, Unspecified Public Purpose: $333,000 ($5.04)
Brentwood government finances - Cash and Securities in 2017 (per resident):
Bond Funds - Cash and Securities: $52,605,000 ($795.51)
Other Funds - Cash and Securities: $132,648,000 ($2005.96)
Sinking Funds - Cash and Securities: $16,792,000 ($253.94)
6.37% of this county's 2021 resident taxpayers lived in other counties in 2020 ($134,084 average adjusted gross income )
Here:
6.37%California average:
5.19%
0.01% of residents moved from foreign countries ($98 average AGI )Contra Costa County:
0.01%California average:
0.03%
Top counties from which taxpayers relocated into this county between 2020 and 2021:
7.09% of this county's 2020 resident taxpayers moved to other counties in 2021 ($123,334 average adjusted gross income )
Here:
7.09%California average:
6.14%
0.01% of residents moved to foreign countries ($92 average AGI )Contra Costa County:
0.01%California average:
0.02%
Top counties to which taxpayers relocated from this county between 2020 and 2021:
Businesses in Brentwood, CA
Name Count Name Count
AT&T 3 Home Depot 1 Ace Hardware 2 J. Jill 1 Aeropostale 1 Jack In The Box 2 American Eagle Outfitters 1 Jamba Juice 1 Ann Taylor 1 JoS. A. Bank 1 Banana Republic 1 Jones New York 3 Baskin-Robbins 1 Justice 2 Bath & Body Works 1 KFC 2 Big O Tires 1 Kohl's 1 Blockbuster 1 Kroger 1 Burger King 1 Lane Furniture 1 CVS 2 LensCrafters 1 Carl\s Jr. 1 Little Caesars Pizza 2 Chico's 1 McDonald's 2 Chuck E. Cheese's 1 Nike 6 Circle K 1 Pac Sun 1 Cold Stone Creamery 1 Panda Express 1 Coldwater Creek 1 Penske 1 Curves 1 Quiznos 1 Discount Tire 1 Red Robin 1 Domino's Pizza 1 Sprint Nextel 1 Express 1 Starbucks 4 Famous Footwear 1 T.J.Maxx 1 FedEx 6 Taco Bell 1 Firestone Complete Auto Care 1 Talbots 1 Ford 1 Toys"R"Us 1 GNC 1 Trader Joe's 1 GameStop 1 U-Haul 2 Gymboree 1 UPS 7 H&R Block 2 Verizon Wireless 1 Haagen-Dazs 1 Victoria's Secret 1 Hilton 1 Vons 2 Holiday Inn 1 Walgreens 3 Hollister Co. 1 Wendy's 1
Strongest AM radio stations in Brentwood:
KATD (990 AM; 10 kW; PITTSBURG, CA; Owner: RADIO UNICA OF SACRAMENTO LICENSE CORP.)
KTRB (860 AM; 50 kW; MODESTO, CA; Owner: PAPPAS RADIO OF CALIFORNIA, A CALIFORNIA LIMITED PARTNERSHIP)
KTCT (1050 AM; 50 kW; SAN MATEO, CA; Owner: SUSQUEHANNA RADIO CORP.)
KGO (810 AM; 50 kW; SAN FRANCISCO, CA; Owner: KGO-AM RADIO, INC.)
KFAX (1100 AM; 50 kW; SAN FRANCISCO, CA; Owner: GOLDEN GATE BROADCASTING CO, INC.)
KNBR (680 AM; 50 kW; SAN FRANCISCO, CA; Owner: KNBR LICO, INC.)
KIQI (1010 AM; 35 kW; SAN FRANCISCO, CA; Owner: RADIO UNICA OF SAN FRANCISCO LICENSE CORP.)
KCBS (740 AM; 50 kW; SAN FRANCISCO, CA; Owner: INFINITY BROADCASTING OPERATIONS, INC.)
KCBC (770 AM; 50 kW; RIVERBANK, CA; Owner: KIERTRON, INC.)
KHTK (1140 AM; 50 kW; SACRAMENTO, CA; Owner: INFINITY RADIO SUBSIDIARY OPERATIONS INC.)
KLOK (1170 AM; 50 kW; SAN JOSE, CA; Owner: ENTRAVISION HOLDINGS, LLC)
KNEW (910 AM; 20 kW; OAKLAND, CA; Owner: AMFM RADIO LICENSES, L.L.C.)
KYCY (1550 AM; 50 kW; SAN FRANCISCO, CA; Owner: INFINITY BROADCASTING OPERATIONS, INC.)
Strongest FM radio stations in Brentwood:
KKSF-FM1 (103.7 FM; PLEASANTON, ETC., CA; Owner: AMFM RADIO LICENSES, L.L.C.)
KMEL-FM1 (106.1 FM; CONCORD, CA; Owner: AMFM RADIO LICENSES, L.L.C.)
KBLX-FM2 (102.9 FM; PLEASANTON, CA; Owner: ICBC BROADCAST HOLDINGS -CA, INC.)
KSOL-FM3 (98.9 FM; PLEASANTON, CA; Owner: TMS LICENSE CALIFORNIA, INC)
KFRC-FM3 (99.7 FM; WALNUT CREEK, CA; Owner: INFINITY KFRC-FM, INC.)
KZBR-FM1 (95.7 FM; WALNUT CREEK, CA; Owner: BONNEVILLE HOLDING COMPANY)
KISQ-FM3 (98.1 FM; CONCORD, CA; Owner: AMFM RADIO LICENSES, L.L.C.)
K238AC (95.5 FM; SALIDA, CA; Owner: FAMILY STATIONS, INC.)
KZBR-FM2 (95.7 FM; LIVERMORE, ETC., CA; Owner: BONNEVILLE HOLDING COMPANY)
KJOY (99.3 FM; STOCKTON, CA; Owner: CITADEL BROADCASTING COMPANY)
KFJO (92.1 FM; WALNUT CREEK, CA; Owner: CHASE RADIO PROPERTIES, L.L.C.)
KOSO (93.1 FM; PATTERSON, CA; Owner: CAPSTAR TX LIMITED PARTNERSHIP)
KDFC-FM1 (102.1 FM; LAFAYETTE, CA; Owner: BONNEVILLE HOLDING COMPANY)
KOIT-FM2 (96.5 FM; MARTINEZ, ETC., CA; Owner: BONNEVILLE HOLDING CO. C/O KOIT(FM))
KUIC (95.3 FM; VACAVILLE, CA; Owner: KUIC, INC.)
KIOI-FM1 (101.3 FM; WALNUT CREEK, CA; Owner: AMFM RADIO LICENSES, L.L.C.)
KUOP (91.3 FM; STOCKTON, CA; Owner: UNIVERSITY OF THE PACIFIC)
KBAA (94.5 FM; GILROY, CA; Owner: INFINITY RADIO OPERATIONS INC.)
KLLC (97.3 FM; SAN FRANCISCO, CA; Owner: INFINITY BROADCASTING OPERATIONS, INC.)
KSFB-FM (100.7 FM; SAN RAFAEL, CA; Owner: GOLDEN GATE BROADCASTING COMPANY, INC.)
TV broadcast stations around Brentwood:
KOVR (Channel 13; STOCKTON, CA; Owner: SCI - SACRAMENTO LICENSEE, LLC)
KXTV (Channel 10; SACRAMENTO, CA; Owner: KXTV, INC.)
KCRA-TV (Channel 3; SACRAMENTO, CA; Owner: KCRA HEARST-ARGYLE TELEVISION, INC.)
KUVS (Channel 19; MODESTO, CA; Owner: KUVS LICENSE PARTNERSHIP, G.P.)
KSPX (Channel 29; SACRAMENTO, CA; Owner: PAXSON SACRAMENTO LICENSE, INC.)
KTXL (Channel 40; SACRAMENTO, CA; Owner: CHANNEL 40, INC.)
KQCA (Channel 58; STOCKTON, CA; Owner: KCRA HEARST-ARGYLE TELEVISION, INC.)
KVIE (Channel 6; SACRAMENTO, CA; Owner: KVIE, INC.)
KMAX-TV (Channel 31; SACRAMENTO, CA; Owner: UPN STATIONS GROUP INC.)
KQED (Channel 9; SAN FRANCISCO, CA; Owner: KQED, INC.)
KTNC-TV (Channel 42; CONCORD, CA; Owner: KTNC LICENSE, LLC)
KMMK-LP (Channel 14; SACRAMENTO, CA; Owner: CABALLERO TELEVISION TEXAS, L.L.C.)
KGO-TV (Channel 7; SAN FRANCISCO, CA; Owner: KGO TELEVISION, INC.)
KPIX-TV (Channel 5; SAN FRANCISCO, CA; Owner: CBS BROADCASTING INC.)
KEZT-CA (Channel 23; SACRAMENTO, CA; Owner: TELEFUTURA SACRAMENTO LLC)
KFTL (Channel 64; STOCKTON, CA; Owner: FAMILY STATIONS, INC.)
KBIT-CA (Channel 28; SAN FRANCISCO, ETC., CA; Owner: POLAR BROADCASTING, INC.)
KRON-TV (Channel 4; SAN FRANCISCO, CA; Owner: YOUNG BROADCASTING OF SAN FRANCISCO, INC.)
KICU-TV (Channel 36; SAN JOSE, CA; Owner: KTVU PARTNERSHIP)
KDTS-CA (Channel 52; STOCKTON, CA; Owner: WORD OF GOD FELLOWSHIP, INC.)
National Bridge Inventory (NBI) Statistics 40 Number of bridges371ft / 113m Total length $537,000 Total costs479,675 Total average daily traffic35,073 Total average daily truck traffic
New bridges - historical statistics
1 1920-1929 1 1930-1939 1 1950-1959 5 1960-1969 2 1980-1989 5 1990-1999 12 2000-2009 13 2010-2019
See full National Bridge Inventory statistics for Brentwood, CA
Home Mortgage Disclosure Act Aggregated Statistics For Year 2009(Based on 2 partial tracts) A) FHA, FSA/RHS & VA B) Conventional C) Refinancings D) Home Improvement Loans F) Non-occupant Loans on G) Loans On Manufactured Number Average Value Number Average Value Number Average Value Number Average Value Number Average Value Number Average Value
LOANS ORIGINATED 236 $280,573 224 $234,690 400 $258,761 12 $124,897 86 $198,612 0 $0 APPLICATIONS APPROVED, NOT ACCEPTED 20 $311,812 25 $253,846 58 $283,317 1 $153,820 12 $224,453 1 $39,980 APPLICATIONS DENIED 41 $308,055 48 $256,673 195 $322,292 5 $100,682 25 $212,546 0 $0 APPLICATIONS WITHDRAWN 21 $315,413 35 $229,065 87 $298,796 5 $114,924 14 $185,457 0 $0 FILES CLOSED FOR INCOMPLETENESS 7 $295,771 8 $252,025 31 $309,280 2 $50,745 6 $211,333 0 $0
Aggregated Statistics For Year 2008(Based on 2 partial tracts) A) FHA, FSA/RHS & VA B) Conventional C) Refinancings D) Home Improvement Loans F) Non-occupant Loans on G) Loans On Manufactured Number Average Value Number Average Value Number Average Value Number Average Value Number Average Value Number Average Value
LOANS ORIGINATED 156 $328,073 316 $286,216 194 $281,744 20 $115,868 79 $242,080 0 $0 APPLICATIONS APPROVED, NOT ACCEPTED 17 $339,538 58 $321,951 58 $311,805 7 $119,929 13 $231,665 1 $93,030 APPLICATIONS DENIED 30 $335,137 103 $304,389 182 $339,839 27 $189,569 32 $255,241 2 $61,520 APPLICATIONS WITHDRAWN 17 $322,345 57 $287,053 79 $332,615 7 $251,944 20 $229,126 1 $13,740 FILES CLOSED FOR INCOMPLETENESS 2 $362,010 15 $348,187 24 $326,861 1 $463,670 3 $255,183 0 $0
Aggregated Statistics For Year 2007(Based on 2 partial tracts) A) FHA, FSA/RHS & VA B) Conventional C) Refinancings D) Home Improvement Loans E) Loans on Dwellings For 5+ Families F) Non-occupant Loans on G) Loans On Manufactured Number Average Value Number Average Value Number Average Value Number Average Value Number Average Value Number Average Value Number Average Value
LOANS ORIGINATED 1 $387,790 399 $367,873 730 $374,082 111 $188,491 1 $1,617,210 87 $335,080 2 $78,495 APPLICATIONS APPROVED, NOT ACCEPTED 0 $0 126 $375,995 194 $397,719 47 $199,668 0 $0 30 $389,836 2 $137,435 APPLICATIONS DENIED 1 $166,510 253 $398,659 541 $438,380 81 $212,815 0 $0 65 $391,595 1 $249,020 APPLICATIONS WITHDRAWN 0 $0 73 $402,340 201 $423,004 15 $160,831 0 $0 19 $384,889 0 $0 FILES CLOSED FOR INCOMPLETENESS 0 $0 26 $371,808 78 $411,531 8 $203,930 0 $0 6 $256,105 0 $0
Aggregated Statistics For Year 2006(Based on 2 partial tracts) B) Conventional C) Refinancings D) Home Improvement Loans F) Non-occupant Loans on G) Loans On Manufactured Number Average Value Number Average Value Number Average Value Number Average Value Number Average Value
LOANS ORIGINATED 1,009 $392,984 1,234 $391,648 178 $246,898 117 $346,175 1 $176,680 APPLICATIONS APPROVED, NOT ACCEPTED 249 $411,216 251 $400,529 43 $233,488 32 $373,276 0 $0 APPLICATIONS DENIED 376 $412,138 603 $429,785 119 $207,644 42 $400,100 2 $60,810 APPLICATIONS WITHDRAWN 218 $426,133 341 $419,050 24 $225,472 27 $371,534 1 $65,650 FILES CLOSED FOR INCOMPLETENESS 39 $434,771 80 $426,889 8 $192,452 9 $360,872 0 $0
Aggregated Statistics For Year 2005(Based on 2 partial tracts) B) Conventional C) Refinancings D) Home Improvement Loans E) Loans on Dwellings For 5+ Families F) Non-occupant Loans on G) Loans On Manufactured Number Average Value Number Average Value Number Average Value Number Average Value Number Average Value Number Average Value
LOANS ORIGINATED 1,288 $404,869 1,682 $397,080 209 $257,113 1 $2,490,900 170 $360,453 4 $147,868 APPLICATIONS APPROVED, NOT ACCEPTED 273 $376,118 206 $389,233 27 $159,715 0 $0 25 $334,353 4 $100,148 APPLICATIONS DENIED 406 $395,100 492 $446,412 123 $215,003 0 $0 51 $370,501 3 $157,007 APPLICATIONS WITHDRAWN 275 $411,650 366 $375,952 54 $277,656 1 $528,600 31 $335,053 1 $324,280 FILES CLOSED FOR INCOMPLETENESS 95 $418,279 89 $400,809 6 $273,813 0 $0 6 $343,165 0 $0
Aggregated Statistics For Year 2004(Based on 2 partial tracts) A) FHA, FSA/RHS & VA B) Conventional C) Refinancings D) Home Improvement Loans E) Loans on Dwellings For 5+ Families F) Non-occupant Loans on G) Loans On Manufactured Number Average Value Number Average Value Number Average Value Number Average Value Number Average Value Number Average Value Number Average Value
LOANS ORIGINATED 1 $154,880 1,214 $318,900 1,637 $322,219 167 $213,665 1 $2,676,210 193 $280,813 2 $90,225 APPLICATIONS APPROVED, NOT ACCEPTED 0 $0 233 $306,015 263 $312,458 30 $108,054 0 $0 24 $277,993 0 $0 APPLICATIONS DENIED 0 $0 254 $311,769 500 $321,122 96 $148,818 0 $0 44 $309,724 2 $104,960 APPLICATIONS WITHDRAWN 0 $0 211 $325,602 418 $310,323 35 $206,643 1 $440,320 24 $273,650 2 $141,665 FILES CLOSED FOR INCOMPLETENESS 0 $0 60 $311,169 87 $325,109 9 $201,279 0 $0 6 $222,648 0 $0
Aggregated Statistics For Year 2003(Based on 2 partial tracts) A) FHA, FSA/RHS & VA B) Conventional C) Refinancings D) Home Improvement Loans E) Loans on Dwellings For 5+ Families F) Non-occupant Loans on Number Average Value Number Average Value Number Average Value Number Average Value Number Average Value Number Average Value
LOANS ORIGINATED 6 $225,505 1,234 $264,458 2,419 $251,061 74 $61,045 0 $0 159 $226,556 APPLICATIONS APPROVED, NOT ACCEPTED 1 $140,420 204 $274,040 387 $242,730 20 $72,570 0 $0 19 $258,279 APPLICATIONS DENIED 2 $137,170 197 $260,935 579 $254,648 73 $56,971 0 $0 30 $246,354 APPLICATIONS WITHDRAWN 4 $186,475 211 $269,415 460 $256,453 19 $74,531 0 $0 23 $236,269 FILES CLOSED FOR INCOMPLETENESS 0 $0 46 $288,941 89 $276,020 4 $125,582 1 $727,410 5 $198,834
Aggregated Statistics For Year 2002(Based on 2 partial tracts) A) FHA, FSA/RHS & VA B) Conventional C) Refinancings D) Home Improvement Loans F) Non-occupant Loans on Number Average Value Number Average Value Number Average Value Number Average Value Number Average Value
LOANS ORIGINATED 20 $202,370 1,121 $238,286 1,589 $232,973 75 $52,974 112 $202,060 APPLICATIONS APPROVED, NOT ACCEPTED 3 $107,440 178 $239,790 240 $234,676 40 $46,398 14 $196,623 APPLICATIONS DENIED 2 $326,665 136 $229,764 359 $220,411 65 $39,816 15 $200,402 APPLICATIONS WITHDRAWN 2 $147,750 143 $227,280 272 $233,813 25 $48,220 8 $212,488 FILES CLOSED FOR INCOMPLETENESS 0 $0 52 $242,793 91 $245,863 3 $60,887 8 $230,719
Aggregated Statistics For Year 2001(Based on 2 partial tracts) A) FHA, FSA/RHS & VA B) Conventional C) Refinancings D) Home Improvement Loans E) Loans on Dwellings For 5+ Families F) Non-occupant Loans on Number Average Value Number Average Value Number Average Value Number Average Value Number Average Value Number Average Value
LOANS ORIGINATED 23 $202,468 819 $216,294 1,416 $213,967 65 $44,214 1 $1,204,410 83 $182,894 APPLICATIONS APPROVED, NOT ACCEPTED 1 $204,090 120 $219,460 198 $214,943 21 $61,826 0 $0 10 $206,643 APPLICATIONS DENIED 3 $229,763 116 $204,429 307 $197,306 45 $44,719 0 $0 11 $157,810 APPLICATIONS WITHDRAWN 1 $287,730 112 $215,982 255 $201,931 15 $69,449 0 $0 14 $191,305 FILES CLOSED FOR INCOMPLETENESS 3 $194,173 45 $213,690 64 $231,041 3 $37,177 0 $0 1 $372,710
Aggregated Statistics For Year 2000(Based on 2 partial tracts) A) FHA, FSA/RHS & VA B) Conventional C) Refinancings D) Home Improvement Loans E) Loans on Dwellings For 5+ Families F) Non-occupant Loans on Number Average Value Number Average Value Number Average Value Number Average Value Number Average Value Number Average Value
LOANS ORIGINATED 53 $194,762 812 $184,897 315 $145,280 79 $37,960 1 $894,270 34 $159,179 APPLICATIONS APPROVED, NOT ACCEPTED 4 $194,785 96 $195,429 68 $136,080 46 $41,845 0 $0 5 $159,970 APPLICATIONS DENIED 4 $165,170 150 $191,703 152 $132,999 47 $40,148 0 $0 6 $126,038 APPLICATIONS WITHDRAWN 8 $202,904 149 $171,119 91 $123,031 9 $37,653 1 $6,686,790 9 $129,627 FILES CLOSED FOR INCOMPLETENESS 1 $110,480 39 $198,277 38 $188,317 1 $22,740 0 $0 2 $192,830
Aggregated Statistics For Year 1999(Based on 2 partial tracts) A) FHA, FSA/RHS & VA B) Conventional C) Refinancings D) Home Improvement Loans E) Loans on Dwellings For 5+ Families F) Non-occupant Loans on Number Average Value Number Average Value Number Average Value Number Average Value Number Average Value Number Average Value
LOANS ORIGINATED 63 $178,406 575 $163,318 443 $151,324 84 $34,072 2 $187,795 46 $139,130 APPLICATIONS APPROVED, NOT ACCEPTED 6 $176,245 57 $166,768 81 $145,342 25 $42,231 0 $0 5 $151,910 APPLICATIONS DENIED 4 $167,260 89 $171,243 182 $134,983 55 $35,559 0 $0 11 $148,117 APPLICATIONS WITHDRAWN 3 $181,720 104 $158,654 127 $146,494 6 $47,522 0 $0 7 $119,770 FILES CLOSED FOR INCOMPLETENESS 0 $0 23 $155,755 44 $154,321 1 $14,970 0 $0 1 $110,560
Detailed HMDA statistics for the following Tracts:
3031.00
, 3032.00
Private Mortgage Insurance Companies Aggregated Statistics For Year 2009(Based on 2 partial tracts) A) Conventional B) Refinancings Number Average Value Number Average Value
LOANS ORIGINATED 25 $271,394 7 $325,016 APPLICATIONS APPROVED, NOT ACCEPTED 11 $304,109 4 $303,618 APPLICATIONS DENIED 2 $294,695 1 $237,870 APPLICATIONS WITHDRAWN 2 $226,240 1 $223,600 FILES CLOSED FOR INCOMPLETENESS 2 $291,795 0 $0
Aggregated Statistics For Year 2008(Based on 2 partial tracts) A) Conventional B) Refinancings C) Non-occupant Loans on Number Average Value Number Average Value Number Average Value
LOANS ORIGINATED 99 $349,130 14 $380,761 5 $354,096 APPLICATIONS APPROVED, NOT ACCEPTED 32 $380,498 16 $436,721 3 $431,160 APPLICATIONS DENIED 9 $320,874 3 $417,943 2 $417,040 APPLICATIONS WITHDRAWN 9 $356,860 2 $458,995 0 $0 FILES CLOSED FOR INCOMPLETENESS 3 $413,200 1 $321,920 1 $682,420
Aggregated Statistics For Year 2007(Based on 2 partial tracts) A) Conventional B) Refinancings C) Non-occupant Loans on Number Average Value Number Average Value Number Average Value
LOANS ORIGINATED 32 $441,920 22 $500,263 4 $539,555 APPLICATIONS APPROVED, NOT ACCEPTED 3 $427,813 11 $498,936 0 $0 APPLICATIONS DENIED 1 $232,060 2 $535,210 1 $232,060 APPLICATIONS WITHDRAWN 3 $461,413 2 $451,630 0 $0 FILES CLOSED FOR INCOMPLETENESS 0 $0 0 $0 0 $0
Aggregated Statistics For Year 2006(Based on 2 partial tracts) A) Conventional B) Refinancings Number Average Value Number Average Value
LOANS ORIGINATED 5 $471,212 4 $615,360 APPLICATIONS APPROVED, NOT ACCEPTED 1 $647,740 4 $423,965 APPLICATIONS DENIED 0 $0 1 $383,230 APPLICATIONS WITHDRAWN 0 $0 3 $457,240 FILES CLOSED FOR INCOMPLETENESS 1 $256,370 0 $0
Aggregated Statistics For Year 2005(Based on 2 partial tracts) A) Conventional B) Refinancings C) Non-occupant Loans on Number Average Value Number Average Value Number Average Value
LOANS ORIGINATED 9 $502,320 11 $429,882 1 $143,780 APPLICATIONS APPROVED, NOT ACCEPTED 1 $496,470 2 $483,495 1 $185,010 APPLICATIONS DENIED 1 $389,100 1 $559,790 0 $0 APPLICATIONS WITHDRAWN 1 $412,320 0 $0 1 $264,300 FILES CLOSED FOR INCOMPLETENESS 0 $0 0 $0 0 $0
Aggregated Statistics For Year 2004(Based on 2 partial tracts) A) Conventional B) Refinancings C) Non-occupant Loans on D) Loans On Manufactured Number Average Value Number Average Value Number Average Value Number Average Value
LOANS ORIGINATED 11 $392,774 14 $338,141 0 $0 0 $0 APPLICATIONS APPROVED, NOT ACCEPTED 6 $342,538 8 $326,032 1 $348,720 0 $0 APPLICATIONS DENIED 1 $601,550 1 $163,870 1 $365,790 0 $0 APPLICATIONS WITHDRAWN 0 $0 3 $382,530 0 $0 1 $163,870 FILES CLOSED FOR INCOMPLETENESS 0 $0 1 $322,450 0 $0 0 $0
Aggregated Statistics For Year 2003(Based on 2 partial tracts) A) Conventional B) Refinancings C) Non-occupant Loans on Number Average Value Number Average Value Number Average Value
LOANS ORIGINATED 45 $334,217 36 $301,002 3 $393,270 APPLICATIONS APPROVED, NOT ACCEPTED 13 $324,181 20 $308,966 1 $213,140 APPLICATIONS DENIED 1 $248,080 0 $0 0 $0 APPLICATIONS WITHDRAWN 2 $364,765 1 $282,230 0 $0 FILES CLOSED FOR INCOMPLETENESS 0 $0 0 $0 0 $0
Aggregated Statistics For Year 2002(Based on 2 partial tracts) A) Conventional B) Refinancings C) Non-occupant Loans on Number Average Value Number Average Value Number Average Value
LOANS ORIGINATED 88 $299,404 33 $269,660 4 $261,267 APPLICATIONS APPROVED, NOT ACCEPTED 13 $296,821 24 $305,813 1 $332,940 APPLICATIONS DENIED 2 $248,610 2 $278,915 0 $0 APPLICATIONS WITHDRAWN 4 $295,582 4 $303,695 2 $191,090 FILES CLOSED FOR INCOMPLETENESS 0 $0 0 $0 0 $0
Aggregated Statistics For Year 2001(Based on 2 partial tracts) A) Conventional B) Refinancings C) Non-occupant Loans on Number Average Value Number Average Value Number Average Value
LOANS ORIGINATED 87 $280,111 47 $252,925 2 $303,015 APPLICATIONS APPROVED, NOT ACCEPTED 23 $285,616 16 $250,640 3 $221,130 APPLICATIONS DENIED 8 $315,364 3 $271,700 1 $166,510 APPLICATIONS WITHDRAWN 5 $259,226 1 $338,680 0 $0 FILES CLOSED FOR INCOMPLETENESS 1 $315,720 2 $188,180 1 $89,860
Aggregated Statistics For Year 2000(Based on 2 partial tracts) A) Conventional B) Refinancings C) Non-occupant Loans on Number Average Value Number Average Value Number Average Value
LOANS ORIGINATED 118 $239,299 30 $216,743 5 $142,296 APPLICATIONS APPROVED, NOT ACCEPTED 17 $236,092 8 $180,824 0 $0 APPLICATIONS DENIED 7 $259,623 1 $379,170 0 $0 APPLICATIONS WITHDRAWN 1 $352,050 4 $232,452 0 $0 FILES CLOSED FOR INCOMPLETENESS 1 $324,560 1 $77,180 0 $0
Aggregated Statistics For Year 1999(Based on 2 partial tracts) A) Conventional B) Refinancings C) Non-occupant Loans on Number Average Value Number Average Value Number Average Value
LOANS ORIGINATED 91 $218,237 61 $174,916 4 $147,098 APPLICATIONS APPROVED, NOT ACCEPTED 11 $213,776 18 $183,362 0 $0 APPLICATIONS DENIED 4 $167,405 3 $180,427 1 $93,740 APPLICATIONS WITHDRAWN 6 $209,132 2 $134,565 0 $0 FILES CLOSED FOR INCOMPLETENESS 1 $125,900 0 $0 0 $0
Detailed PMIC statistics for the following Tracts:
3031.00
, 3032.00 Fire-safe hotels and motels in Brentwood, California:
Holiday Inn Express, 8820 Brentwood Blvd, Brentwood, California 94513 Phone: (925) 634-6400, Fax: (925) 634-5700
Hampton Inn, 7605 Brentwood Blvd, Brentwood, California 94513 Phone: (925) 513-1299, Fax: (925) 513-1280
All 2 fire-safe hotels and motels in Brentwood, California
Most common first names in Brentwood, CA among deceased individuals Name Count Lived (average)
Mary 73 77.3 years William 73 74.3 years Robert 68 71.2 years John 64 76.1 years James 47 72.9 years George 46 77.0 years Charles 43 75.0 years Dorothy 41 81.6 years Frank 32 77.3 years Joseph 31 76.1 years
Most common last names in Brentwood, CA among deceased individuals Last name Count Lived (average)
Smith 34 80.7 years Garcia 22 72.7 years Davis 19 79.2 years Martin 16 81.1 years Johnson 15 77.0 years Martinez 15 74.5 years Thompson 14 74.4 years Williams 14 74.3 years Miller 14 76.6 years Brown 14 74.1 years
Brentwood compared to California state average:
Unemployed percentage significantly below state average. Black race population percentage significantly above state average. Hispanic race population percentage above state average. Foreign-born population percentage above state average. Renting percentage below state average. Length of stay since moving in significantly below state average. Number of rooms per house above state average. House age significantly below state average. Number of college students above state average. Percentage of population with a bachelor's degree or higher above state average.
#6 on the list of "Top 101 cities with largest percentage of females in industries: real estate and rental and leasing (population 50,000+)"
#9 on the list of "Top 101 cities with largest percentage of males in occupations: installation, maintenance, and repair occupations (population 50,000+)"
#10 on the list of "Top 101 cities with largest percentage of females in occupations: law enforcement workers including supervisors (population 50,000+)"
#11 on the list of "Top 101 cities with largest percentage population increases in the 1990s) (population 50,000+)"
#11 on the list of "Top 101 cities with largest percentage of males in industries: real estate and rental and leasing (population 50,000+)"
#12 on the list of "Top 101 cities with largest percentage of males in industries: management of companies and enterprises (population 50,000+)"
#13 on the list of "Top 101 cities with largest percentage of females in industries: management of companies and enterprises (population 50,000+)"
#14 on the list of "Top 100 low-educated but high-earning cities (pop. 50,000+)"
#14 on the list of "Top 100 cities with longest commuting times (pop. 50,000+)"
#14 on the list of "Top 101 cities with the largest percentage population increase from 2000 (population 50,000+)"
#16 on the list of "Top 101 cities with largest percentage of workers with very short commute times (9 minutes or less) (population 50,000+)"
#17 on the list of "Top 101 cities with largest percentage of males in industries: construction (population 50,000+)"
#24 on the list of "Top 100 fastest growing cities from 2000 to 2014 (pop. 50,000+)"
#25 on the list of "Top 100 cities with newest houses (pop. 50,000+)"
#27 on the list of "Top 101 cities with the highest maximum monthly sunshine amount (population 50,000+)"
#31 on the list of "Top 101 cities with most building permits per 10,000 residents (population 50,000+)"
#38 on the list of "Top 100 cities with biggest houses (pop. 50,000+)"
#40 on the list of "Top 101 cities with largest percentage of females in occupations: pipelayers, plumbers, pipefitters, and steamfitters (population 50,000+)"
#41 on the list of "Top 101 cities with largest percentage of males in industries: farm product raw materials merchant wholesalers (population 50,000+)"
#41 on the list of "Top 101 cities with largest percentage of females in industries: farm product raw materials merchant wholesalers (population 50,000+)"
#10 on the list of "Top 101 counties with the largest increase in the number of infant deaths per 1000 residents 2000-2006 to 2007-2013 (pop. 50,000+)"
#15 on the list of "Top 101 counties with the lowest Sulfur Oxides Annual air pollution readings in 2012 (µg/m3 )"
#17 on the list of "Top 101 counties with the highest Nitrogen Dioxide air pollution readings in 2012 (ppm)"
#31 on the list of "Top 101 counties with the highest percentage of residents that drank alcohol in the past 30 days"
#34 on the list of "Top 101 counties with the highest surface withdrawal of fresh water for public supply (pop. 50,000+)"
Top Patent Applicants
Scott E. Lindsey (22)
Pasit Phiasivongsa (22)
Alexander E. Gash (13)
Scott A. Hendrickson (12)
Larry Randall Daudet (7)
Susant K. Patra (6)
Ashish R. Gandhi (6)
Paul Harden (6)
Marc Straub (6)
Jason Petras (6)
Total of 395 patent applications in 2008-2024.
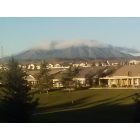
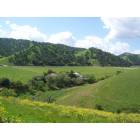

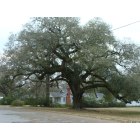


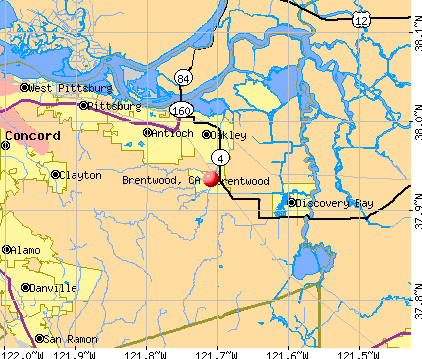


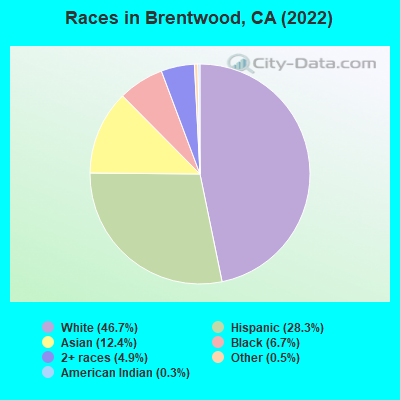
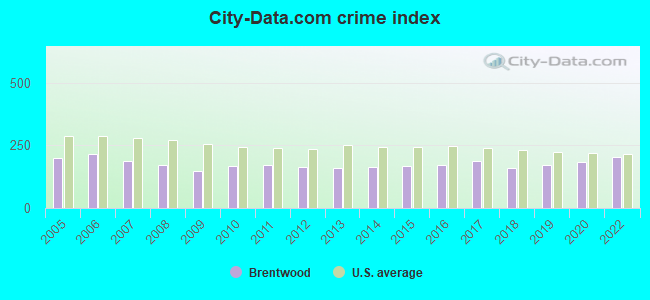
 Recent articles from our blog. Our writers, many of them Ph.D. graduates or candidates, create easy-to-read articles on a wide variety of topics.


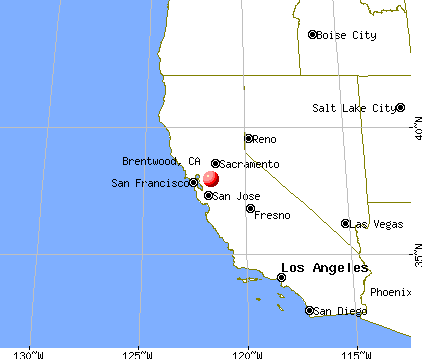
 , pop. 73,778).
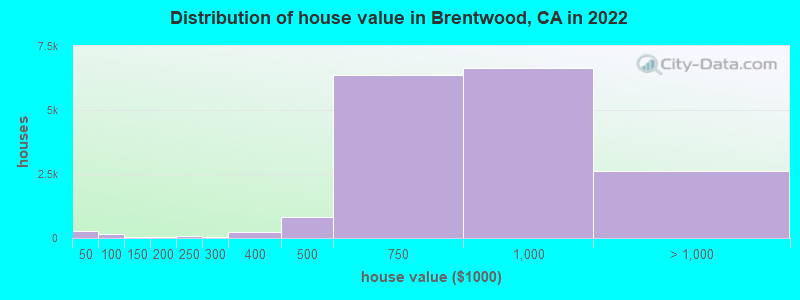
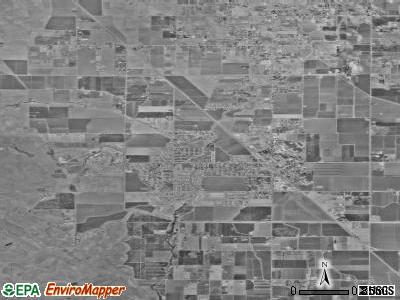
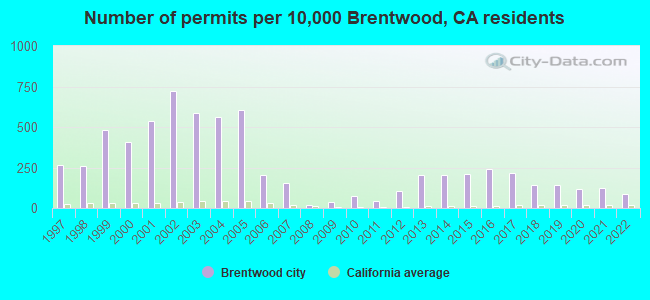
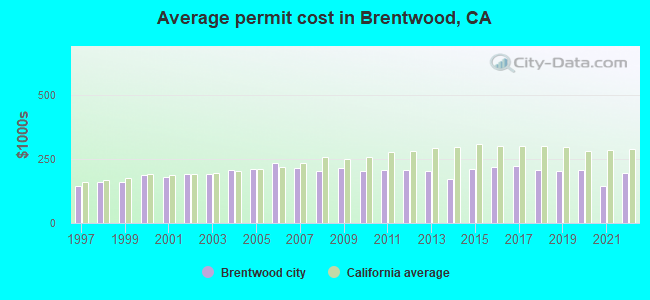
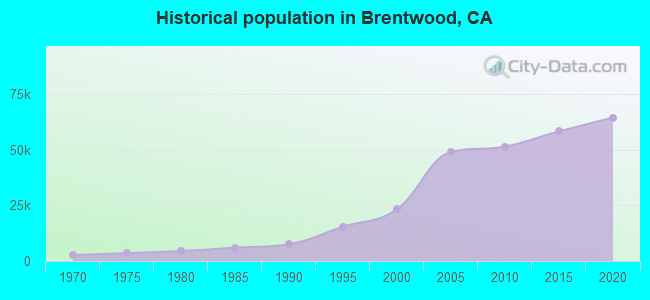
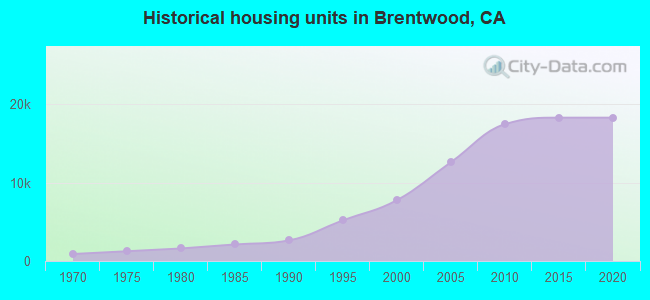
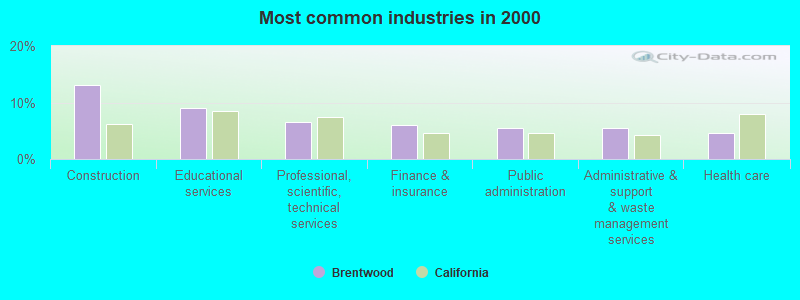
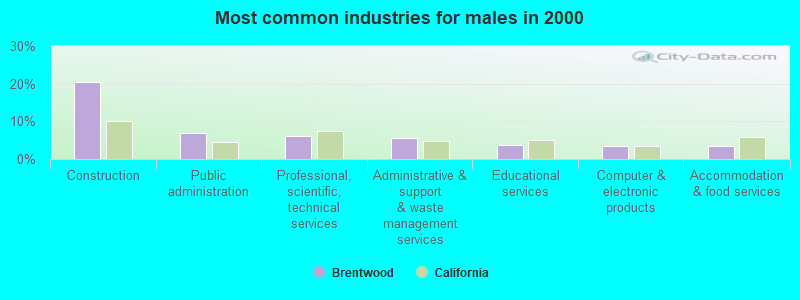
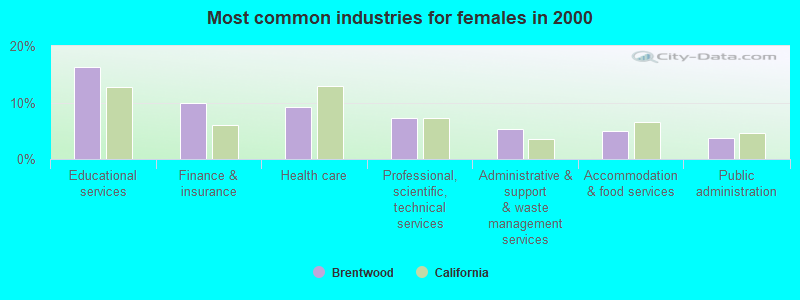
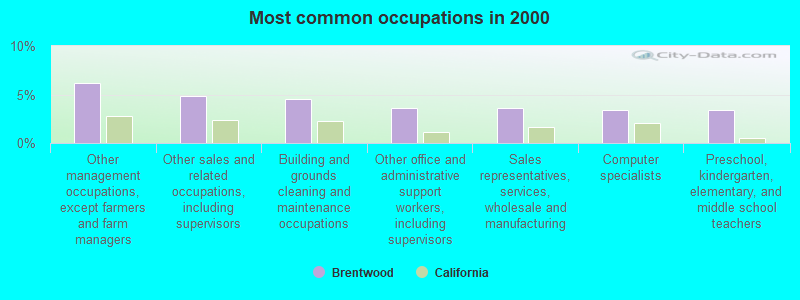
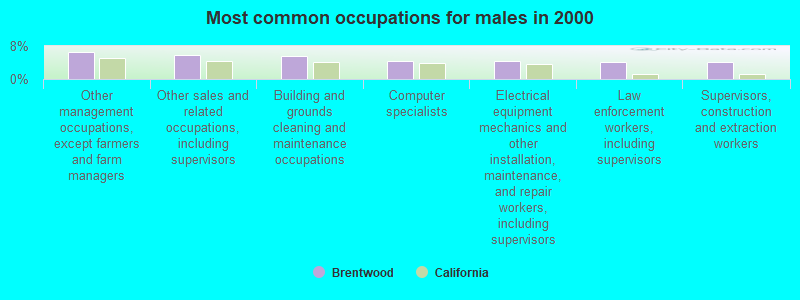

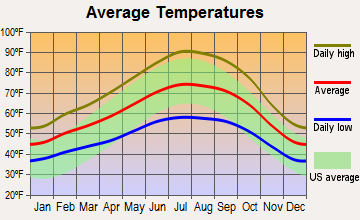
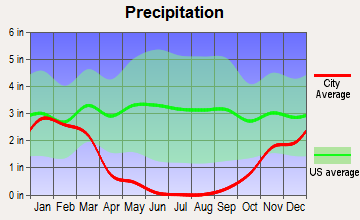
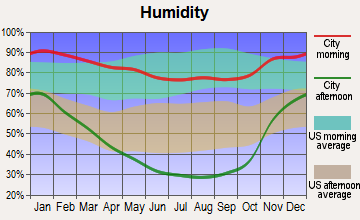
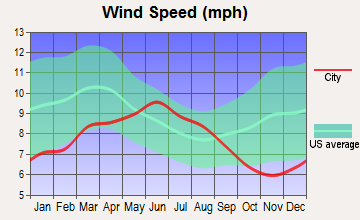
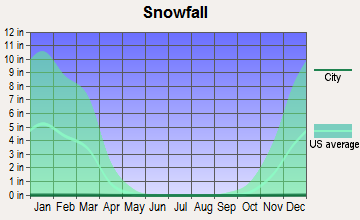
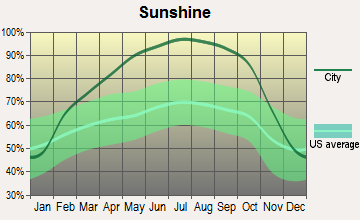
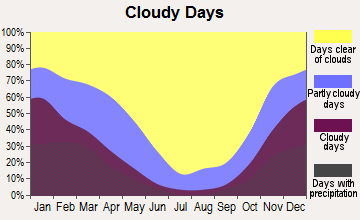
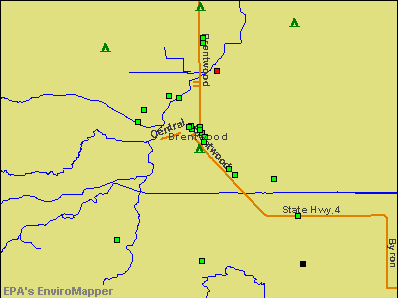

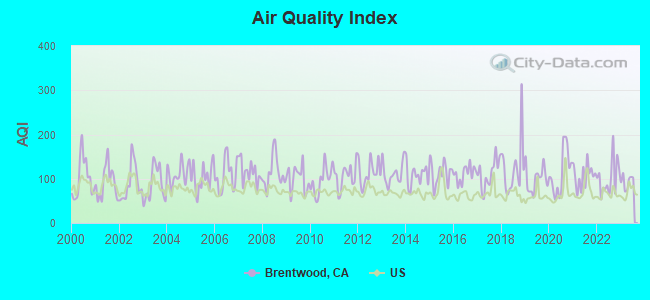
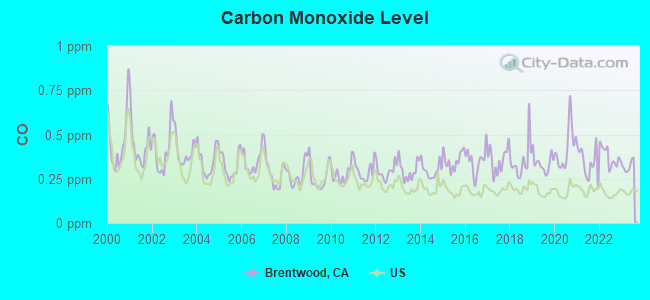
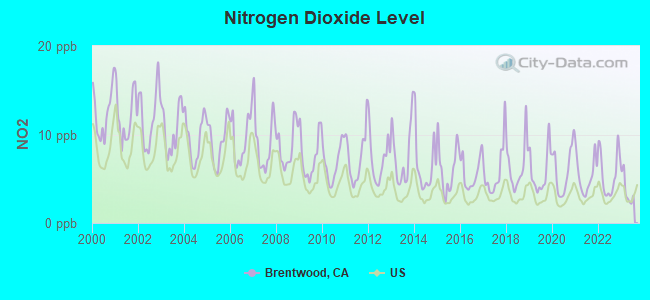
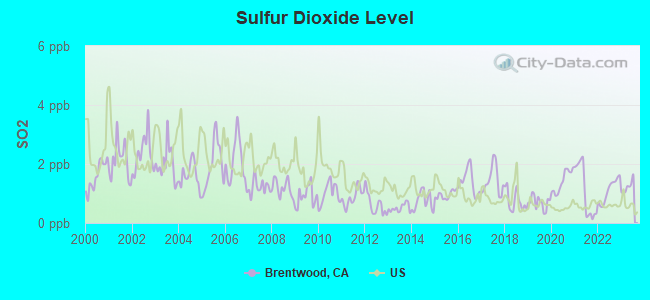
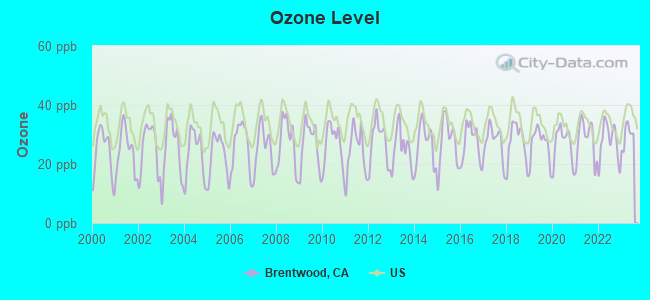
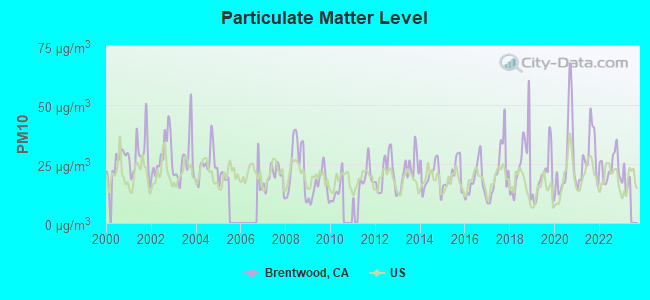
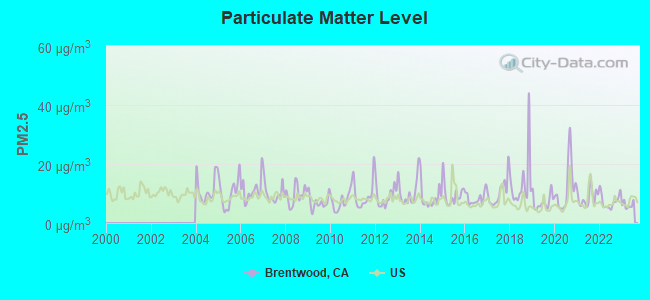

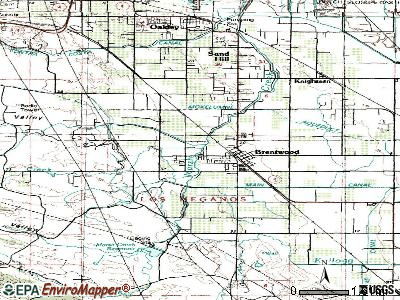
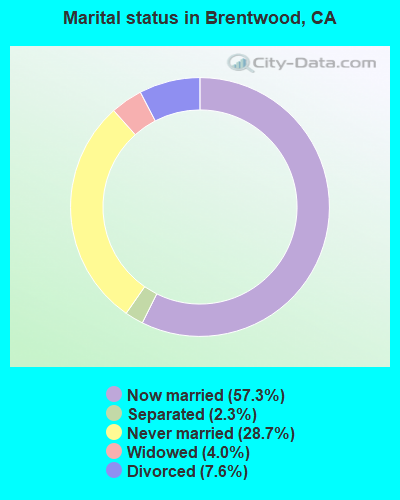
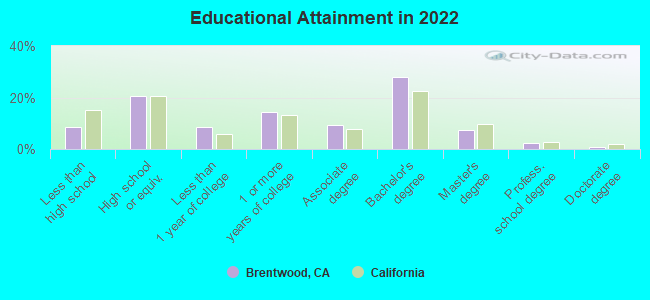
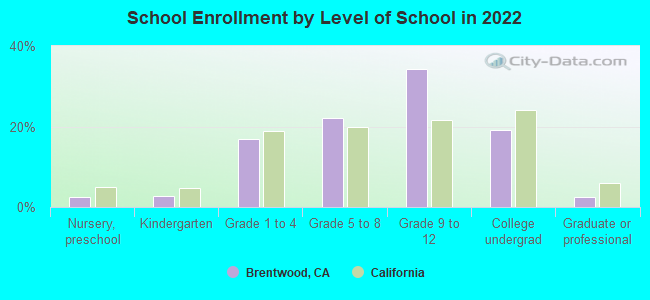
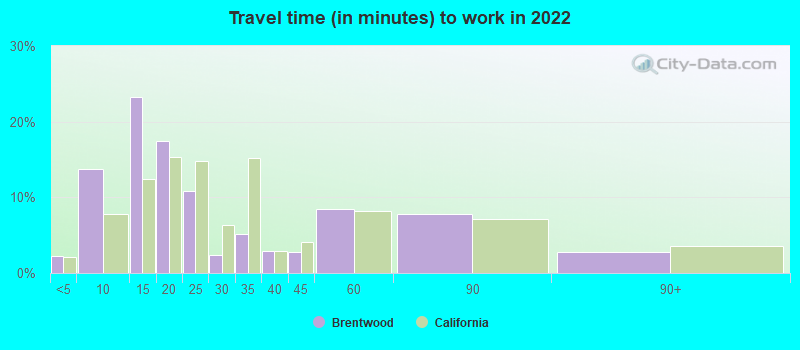
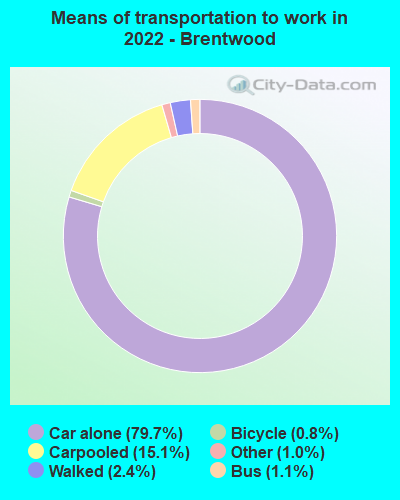


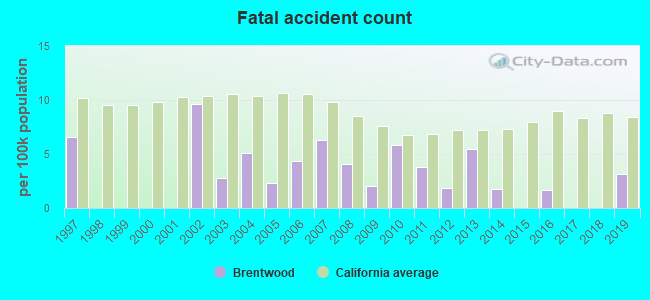
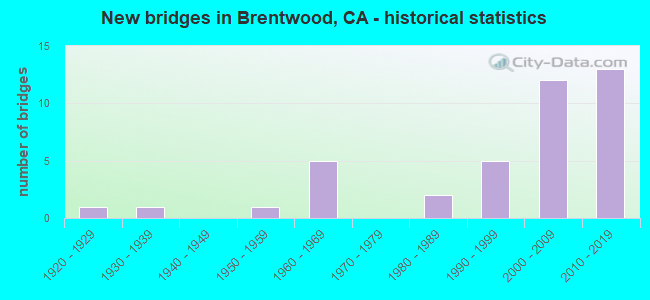
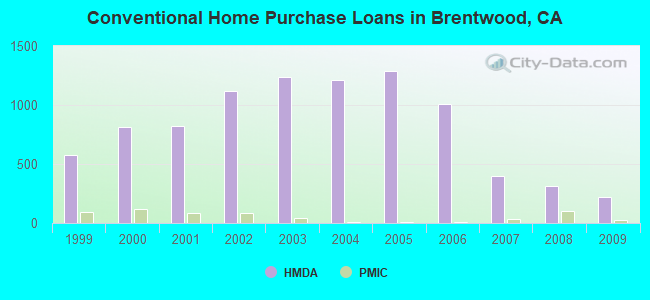
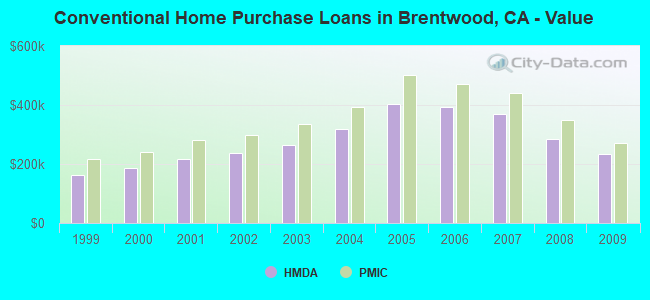
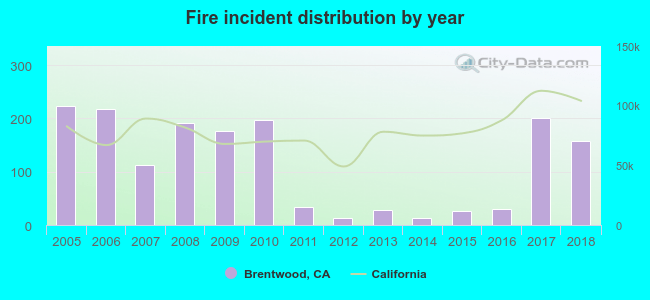 Based on the data from the years 2005 - 2018 the average number of fires per year is 116. The highest number of reported fires - 224 took place in 2005, and the least - 13 in 2014. The data has a dropping trend.
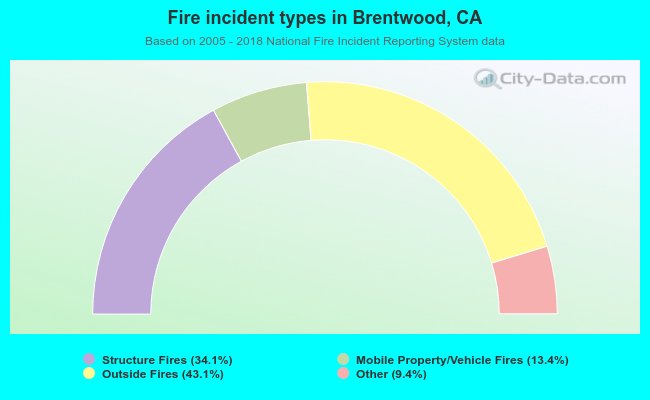 When looking into fire subcategories, the most incidents belonged to: Outside Fires (43.1%), and Structure Fires (34.1%).