Monroe, Michigan Submit your own pictures of this city and show them to the world
OSM Map
General Map
Google Map
MSN Map
OSM Map
General Map
Google Map
MSN Map
OSM Map
General Map
Google Map
MSN Map
OSM Map
General Map
Google Map
MSN Map
Please wait while loading the map...
Population in 2022: 20,295 (99% urban, 1% rural). Population change since 2000: -8.1%Males: 9,799 Females: 10,496
March 2022 cost of living index in Monroe: 95.1 (less than average, U.S. average is 100) Percentage of residents living in poverty in 2022: 16.4%for White Non-Hispanic residents , 40.5% for Black residents , 6.2% for Hispanic or Latino residents , 22.3% for other race residents , 24.4% for two or more races residents )
Profiles of local businesses
Business Search - 14 Million verified businesses
Data:
Median household income ($)
Median household income (% change since 2000)
Household income diversity
Ratio of average income to average house value (%)
Ratio of average income to average rent
Median household income ($) - White
Median household income ($) - Black or African American
Median household income ($) - Asian
Median household income ($) - Hispanic or Latino
Median household income ($) - American Indian and Alaska Native
Median household income ($) - Multirace
Median household income ($) - Other Race
Median household income for houses/condos with a mortgage ($)
Median household income for apartments without a mortgage ($)
Races - White alone (%)
Races - White alone (% change since 2000)
Races - Black alone (%)
Races - Black alone (% change since 2000)
Races - American Indian alone (%)
Races - American Indian alone (% change since 2000)
Races - Asian alone (%)
Races - Asian alone (% change since 2000)
Races - Hispanic (%)
Races - Hispanic (% change since 2000)
Races - Native Hawaiian and Other Pacific Islander alone (%)
Races - Native Hawaiian and Other Pacific Islander alone (% change since 2000)
Races - Two or more races (%)
Races - Two or more races (% change since 2000)
Races - Other race alone (%)
Races - Other race alone (% change since 2000)
Racial diversity
Unemployment (%)
Unemployment (% change since 2000)
Unemployment (%) - White
Unemployment (%) - Black or African American
Unemployment (%) - Asian
Unemployment (%) - Hispanic or Latino
Unemployment (%) - American Indian and Alaska Native
Unemployment (%) - Multirace
Unemployment (%) - Other Race
Population density (people per square mile)
Population - Males (%)
Population - Females (%)
Population - Males (%) - White
Population - Males (%) - Black or African American
Population - Males (%) - Asian
Population - Males (%) - Hispanic or Latino
Population - Males (%) - American Indian and Alaska Native
Population - Males (%) - Multirace
Population - Males (%) - Other Race
Population - Females (%) - White
Population - Females (%) - Black or African American
Population - Females (%) - Asian
Population - Females (%) - Hispanic or Latino
Population - Females (%) - American Indian and Alaska Native
Population - Females (%) - Multirace
Population - Females (%) - Other Race
Coronavirus confirmed cases (May 10, 2024)
Deaths caused by coronavirus (May 10, 2024)
Coronavirus confirmed cases (per 100k population) (May 10, 2024)
Deaths caused by coronavirus (per 100k population) (May 10, 2024)
Daily increase in number of cases (May 10, 2024)
Weekly increase in number of cases (May 10, 2024)
Cases doubled (in days) (May 10, 2024)
Hospitalized patients (Apr 18, 2022)
Negative test results (Apr 18, 2022)
Total test results (Apr 18, 2022)
COVID Vaccine doses distributed (per 100k population) (Sep 19, 2023)
COVID Vaccine doses administered (per 100k population) (Sep 19, 2023)
COVID Vaccine doses distributed (Sep 19, 2023)
COVID Vaccine doses administered (Sep 19, 2023)
Likely homosexual households (%)
Likely homosexual households (% change since 2000)
Likely homosexual households - Lesbian couples (%)
Likely homosexual households - Lesbian couples (% change since 2000)
Likely homosexual households - Gay men (%)
Likely homosexual households - Gay men (% change since 2000)
Cost of living index
Median gross rent ($)
Median contract rent ($)
Median monthly housing costs ($)
Median house or condo value ($)
Median house or condo value ($ change since 2000)
Mean house or condo value by units in structure - 1, detached ($)
Mean house or condo value by units in structure - 1, attached ($)
Mean house or condo value by units in structure - 2 ($)
Mean house or condo value by units in structure by units in structure - 3 or 4 ($)
Mean house or condo value by units in structure - 5 or more ($)
Mean house or condo value by units in structure - Boat, RV, van, etc. ($)
Mean house or condo value by units in structure - Mobile home ($)
Median house or condo value ($) - White
Median house or condo value ($) - Black or African American
Median house or condo value ($) - Asian
Median house or condo value ($) - Hispanic or Latino
Median house or condo value ($) - American Indian and Alaska Native
Median house or condo value ($) - Multirace
Median house or condo value ($) - Other Race
Median resident age
Resident age diversity
Median resident age - Males
Median resident age - Females
Median resident age - White
Median resident age - Black or African American
Median resident age - Asian
Median resident age - Hispanic or Latino
Median resident age - American Indian and Alaska Native
Median resident age - Multirace
Median resident age - Other Race
Median resident age - Males - White
Median resident age - Males - Black or African American
Median resident age - Males - Asian
Median resident age - Males - Hispanic or Latino
Median resident age - Males - American Indian and Alaska Native
Median resident age - Males - Multirace
Median resident age - Males - Other Race
Median resident age - Females - White
Median resident age - Females - Black or African American
Median resident age - Females - Asian
Median resident age - Females - Hispanic or Latino
Median resident age - Females - American Indian and Alaska Native
Median resident age - Females - Multirace
Median resident age - Females - Other Race
Commute - mean travel time to work (minutes)
Travel time to work - Less than 5 minutes (%)
Travel time to work - Less than 5 minutes (% change since 2000)
Travel time to work - 5 to 9 minutes (%)
Travel time to work - 5 to 9 minutes (% change since 2000)
Travel time to work - 10 to 19 minutes (%)
Travel time to work - 10 to 19 minutes (% change since 2000)
Travel time to work - 20 to 29 minutes (%)
Travel time to work - 20 to 29 minutes (% change since 2000)
Travel time to work - 30 to 39 minutes (%)
Travel time to work - 30 to 39 minutes (% change since 2000)
Travel time to work - 40 to 59 minutes (%)
Travel time to work - 40 to 59 minutes (% change since 2000)
Travel time to work - 60 to 89 minutes (%)
Travel time to work - 60 to 89 minutes (% change since 2000)
Travel time to work - 90 or more minutes (%)
Travel time to work - 90 or more minutes (% change since 2000)
Marital status - Never married (%)
Marital status - Now married (%)
Marital status - Separated (%)
Marital status - Widowed (%)
Marital status - Divorced (%)
Median family income ($)
Median family income (% change since 2000)
Median non-family income ($)
Median non-family income (% change since 2000)
Median per capita income ($)
Median per capita income (% change since 2000)
Median family income ($) - White
Median family income ($) - Black or African American
Median family income ($) - Asian
Median family income ($) - Hispanic or Latino
Median family income ($) - American Indian and Alaska Native
Median family income ($) - Multirace
Median family income ($) - Other Race
Median year house/condo built
Median year apartment built
Year house built - Built 2005 or later (%)
Year house built - Built 2000 to 2004 (%)
Year house built - Built 1990 to 1999 (%)
Year house built - Built 1980 to 1989 (%)
Year house built - Built 1970 to 1979 (%)
Year house built - Built 1960 to 1969 (%)
Year house built - Built 1950 to 1959 (%)
Year house built - Built 1940 to 1949 (%)
Year house built - Built 1939 or earlier (%)
Average household size
Household density (households per square mile)
Average household size - White
Average household size - Black or African American
Average household size - Asian
Average household size - Hispanic or Latino
Average household size - American Indian and Alaska Native
Average household size - Multirace
Average household size - Other Race
Occupied housing units (%)
Vacant housing units (%)
Owner occupied housing units (%)
Renter occupied housing units (%)
Vacancy status - For rent (%)
Vacancy status - For sale only (%)
Vacancy status - Rented or sold, not occupied (%)
Vacancy status - For seasonal, recreational, or occasional use (%)
Vacancy status - For migrant workers (%)
Vacancy status - Other vacant (%)
Residents with income below the poverty level (%)
Residents with income below 50% of the poverty level (%)
Children below poverty level (%)
Poor families by family type - Married-couple family (%)
Poor families by family type - Male, no wife present (%)
Poor families by family type - Female, no husband present (%)
Poverty status for native-born residents (%)
Poverty status for foreign-born residents (%)
Poverty among high school graduates not in families (%)
Poverty among people who did not graduate high school not in families (%)
Residents with income below the poverty level (%) - White
Residents with income below the poverty level (%) - Black or African American
Residents with income below the poverty level (%) - Asian
Residents with income below the poverty level (%) - Hispanic or Latino
Residents with income below the poverty level (%) - American Indian and Alaska Native
Residents with income below the poverty level (%) - Multirace
Residents with income below the poverty level (%) - Other Race
Air pollution - Air Quality Index (AQI)
Air pollution - CO
Air pollution - NO2
Air pollution - SO2
Air pollution - Ozone
Air pollution - PM10
Air pollution - PM25
Air pollution - Pb
Crime - Murders per 100,000 population
Crime - Rapes per 100,000 population
Crime - Robberies per 100,000 population
Crime - Assaults per 100,000 population
Crime - Burglaries per 100,000 population
Crime - Thefts per 100,000 population
Crime - Auto thefts per 100,000 population
Crime - Arson per 100,000 population
Crime - City-data.com crime index
Crime - Violent crime index
Crime - Property crime index
Crime - Murders per 100,000 population (5 year average)
Crime - Rapes per 100,000 population (5 year average)
Crime - Robberies per 100,000 population (5 year average)
Crime - Assaults per 100,000 population (5 year average)
Crime - Burglaries per 100,000 population (5 year average)
Crime - Thefts per 100,000 population (5 year average)
Crime - Auto thefts per 100,000 population (5 year average)
Crime - Arson per 100,000 population (5 year average)
Crime - City-data.com crime index (5 year average)
Crime - Violent crime index (5 year average)
Crime - Property crime index (5 year average)
1996 Presidential Elections Results (%) - Democratic Party (Clinton)
1996 Presidential Elections Results (%) - Republican Party (Dole)
1996 Presidential Elections Results (%) - Other
2000 Presidential Elections Results (%) - Democratic Party (Gore)
2000 Presidential Elections Results (%) - Republican Party (Bush)
2000 Presidential Elections Results (%) - Other
2004 Presidential Elections Results (%) - Democratic Party (Kerry)
2004 Presidential Elections Results (%) - Republican Party (Bush)
2004 Presidential Elections Results (%) - Other
2008 Presidential Elections Results (%) - Democratic Party (Obama)
2008 Presidential Elections Results (%) - Republican Party (McCain)
2008 Presidential Elections Results (%) - Other
2012 Presidential Elections Results (%) - Democratic Party (Obama)
2012 Presidential Elections Results (%) - Republican Party (Romney)
2012 Presidential Elections Results (%) - Other
2016 Presidential Elections Results (%) - Democratic Party (Clinton)
2016 Presidential Elections Results (%) - Republican Party (Trump)
2016 Presidential Elections Results (%) - Other
2020 Presidential Elections Results (%) - Democratic Party (Biden)
2020 Presidential Elections Results (%) - Republican Party (Trump)
2020 Presidential Elections Results (%) - Other
Ancestries Reported - Arab (%)
Ancestries Reported - Czech (%)
Ancestries Reported - Danish (%)
Ancestries Reported - Dutch (%)
Ancestries Reported - English (%)
Ancestries Reported - French (%)
Ancestries Reported - French Canadian (%)
Ancestries Reported - German (%)
Ancestries Reported - Greek (%)
Ancestries Reported - Hungarian (%)
Ancestries Reported - Irish (%)
Ancestries Reported - Italian (%)
Ancestries Reported - Lithuanian (%)
Ancestries Reported - Norwegian (%)
Ancestries Reported - Polish (%)
Ancestries Reported - Portuguese (%)
Ancestries Reported - Russian (%)
Ancestries Reported - Scotch-Irish (%)
Ancestries Reported - Scottish (%)
Ancestries Reported - Slovak (%)
Ancestries Reported - Subsaharan African (%)
Ancestries Reported - Swedish (%)
Ancestries Reported - Swiss (%)
Ancestries Reported - Ukrainian (%)
Ancestries Reported - United States (%)
Ancestries Reported - Welsh (%)
Ancestries Reported - West Indian (%)
Ancestries Reported - Other (%)
Educational Attainment - No schooling completed (%)
Educational Attainment - Less than high school (%)
Educational Attainment - High school or equivalent (%)
Educational Attainment - Less than 1 year of college (%)
Educational Attainment - 1 or more years of college (%)
Educational Attainment - Associate degree (%)
Educational Attainment - Bachelor's degree (%)
Educational Attainment - Master's degree (%)
Educational Attainment - Professional school degree (%)
Educational Attainment - Doctorate degree (%)
School Enrollment - Nursery, preschool (%)
School Enrollment - Kindergarten (%)
School Enrollment - Grade 1 to 4 (%)
School Enrollment - Grade 5 to 8 (%)
School Enrollment - Grade 9 to 12 (%)
School Enrollment - College undergrad (%)
School Enrollment - Graduate or professional (%)
School Enrollment - Not enrolled in school (%)
School enrollment - Public schools (%)
School enrollment - Private schools (%)
School enrollment - Not enrolled (%)
Median number of rooms in houses and condos
Median number of rooms in apartments
Housing units lacking complete plumbing facilities (%)
Housing units lacking complete kitchen facilities (%)
Density of houses
Urban houses (%)
Rural houses (%)
Households with people 60 years and over (%)
Households with people 65 years and over (%)
Households with people 75 years and over (%)
Households with one or more nonrelatives (%)
Households with no nonrelatives (%)
Population in households (%)
Family households (%)
Nonfamily households (%)
Population in families (%)
Family households with own children (%)
Median number of bedrooms in owner occupied houses
Mean number of bedrooms in owner occupied houses
Median number of bedrooms in renter occupied houses
Mean number of bedrooms in renter occupied houses
Median number of vehichles in owner occupied houses
Mean number of vehichles in owner occupied houses
Median number of vehichles in renter occupied houses
Mean number of vehichles in renter occupied houses
Mortgage status - with mortgage (%)
Mortgage status - with second mortgage (%)
Mortgage status - with home equity loan (%)
Mortgage status - with both second mortgage and home equity loan (%)
Mortgage status - without a mortgage (%)
Average family size
Average family size - White
Average family size - Black or African American
Average family size - Asian
Average family size - Hispanic or Latino
Average family size - American Indian and Alaska Native
Average family size - Multirace
Average family size - Other Race
Geographical mobility - Same house 1 year ago (%)
Geographical mobility - Moved within same county (%)
Geographical mobility - Moved from different county within same state (%)
Geographical mobility - Moved from different state (%)
Geographical mobility - Moved from abroad (%)
Place of birth - Born in state of residence (%)
Place of birth - Born in other state (%)
Place of birth - Native, outside of US (%)
Place of birth - Foreign born (%)
Housing units in structures - 1, detached (%)
Housing units in structures - 1, attached (%)
Housing units in structures - 2 (%)
Housing units in structures - 3 or 4 (%)
Housing units in structures - 5 to 9 (%)
Housing units in structures - 10 to 19 (%)
Housing units in structures - 20 to 49 (%)
Housing units in structures - 50 or more (%)
Housing units in structures - Mobile home (%)
Housing units in structures - Boat, RV, van, etc. (%)
House/condo owner moved in on average (years ago)
Renter moved in on average (years ago)
Year householder moved into unit - Moved in 1999 to March 2000 (%)
Year householder moved into unit - Moved in 1995 to 1998 (%)
Year householder moved into unit - Moved in 1990 to 1994 (%)
Year householder moved into unit - Moved in 1980 to 1989 (%)
Year householder moved into unit - Moved in 1970 to 1979 (%)
Year householder moved into unit - Moved in 1969 or earlier (%)
Means of transportation to work - Drove car alone (%)
Means of transportation to work - Carpooled (%)
Means of transportation to work - Public transportation (%)
Means of transportation to work - Bus or trolley bus (%)
Means of transportation to work - Streetcar or trolley car (%)
Means of transportation to work - Subway or elevated (%)
Means of transportation to work - Railroad (%)
Means of transportation to work - Ferryboat (%)
Means of transportation to work - Taxicab (%)
Means of transportation to work - Motorcycle (%)
Means of transportation to work - Bicycle (%)
Means of transportation to work - Walked (%)
Means of transportation to work - Other means (%)
Working at home (%)
Industry diversity
Most Common Industries - Agriculture, forestry, fishing and hunting, and mining (%)
Most Common Industries - Agriculture, forestry, fishing and hunting (%)
Most Common Industries - Mining, quarrying, and oil and gas extraction (%)
Most Common Industries - Construction (%)
Most Common Industries - Manufacturing (%)
Most Common Industries - Wholesale trade (%)
Most Common Industries - Retail trade (%)
Most Common Industries - Transportation and warehousing, and utilities (%)
Most Common Industries - Transportation and warehousing (%)
Most Common Industries - Utilities (%)
Most Common Industries - Information (%)
Most Common Industries - Finance and insurance, and real estate and rental and leasing (%)
Most Common Industries - Finance and insurance (%)
Most Common Industries - Real estate and rental and leasing (%)
Most Common Industries - Professional, scientific, and management, and administrative and waste management services (%)
Most Common Industries - Professional, scientific, and technical services (%)
Most Common Industries - Management of companies and enterprises (%)
Most Common Industries - Administrative and support and waste management services (%)
Most Common Industries - Educational services, and health care and social assistance (%)
Most Common Industries - Educational services (%)
Most Common Industries - Health care and social assistance (%)
Most Common Industries - Arts, entertainment, and recreation, and accommodation and food services (%)
Most Common Industries - Arts, entertainment, and recreation (%)
Most Common Industries - Accommodation and food services (%)
Most Common Industries - Other services, except public administration (%)
Most Common Industries - Public administration (%)
Occupation diversity
Most Common Occupations - Management, business, science, and arts occupations (%)
Most Common Occupations - Management, business, and financial occupations (%)
Most Common Occupations - Management occupations (%)
Most Common Occupations - Business and financial operations occupations (%)
Most Common Occupations - Computer, engineering, and science occupations (%)
Most Common Occupations - Computer and mathematical occupations (%)
Most Common Occupations - Architecture and engineering occupations (%)
Most Common Occupations - Life, physical, and social science occupations (%)
Most Common Occupations - Education, legal, community service, arts, and media occupations (%)
Most Common Occupations - Community and social service occupations (%)
Most Common Occupations - Legal occupations (%)
Most Common Occupations - Education, training, and library occupations (%)
Most Common Occupations - Arts, design, entertainment, sports, and media occupations (%)
Most Common Occupations - Healthcare practitioners and technical occupations (%)
Most Common Occupations - Health diagnosing and treating practitioners and other technical occupations (%)
Most Common Occupations - Health technologists and technicians (%)
Most Common Occupations - Service occupations (%)
Most Common Occupations - Healthcare support occupations (%)
Most Common Occupations - Protective service occupations (%)
Most Common Occupations - Fire fighting and prevention, and other protective service workers including supervisors (%)
Most Common Occupations - Law enforcement workers including supervisors (%)
Most Common Occupations - Food preparation and serving related occupations (%)
Most Common Occupations - Building and grounds cleaning and maintenance occupations (%)
Most Common Occupations - Personal care and service occupations (%)
Most Common Occupations - Sales and office occupations (%)
Most Common Occupations - Sales and related occupations (%)
Most Common Occupations - Office and administrative support occupations (%)
Most Common Occupations - Natural resources, construction, and maintenance occupations (%)
Most Common Occupations - Farming, fishing, and forestry occupations (%)
Most Common Occupations - Construction and extraction occupations (%)
Most Common Occupations - Installation, maintenance, and repair occupations (%)
Most Common Occupations - Production, transportation, and material moving occupations (%)
Most Common Occupations - Production occupations (%)
Most Common Occupations - Transportation occupations (%)
Most Common Occupations - Material moving occupations (%)
People in Group quarters - Institutionalized population (%)
People in Group quarters - Correctional institutions (%)
People in Group quarters - Federal prisons and detention centers (%)
People in Group quarters - Halfway houses (%)
People in Group quarters - Local jails and other confinement facilities (including police lockups) (%)
People in Group quarters - Military disciplinary barracks (%)
People in Group quarters - State prisons (%)
People in Group quarters - Other types of correctional institutions (%)
People in Group quarters - Nursing homes (%)
People in Group quarters - Hospitals/wards, hospices, and schools for the handicapped (%)
People in Group quarters - Hospitals/wards and hospices for chronically ill (%)
People in Group quarters - Hospices or homes for chronically ill (%)
People in Group quarters - Military hospitals or wards for chronically ill (%)
People in Group quarters - Other hospitals or wards for chronically ill (%)
People in Group quarters - Hospitals or wards for drug/alcohol abuse (%)
People in Group quarters - Mental (Psychiatric) hospitals or wards (%)
People in Group quarters - Schools, hospitals, or wards for the mentally retarded (%)
People in Group quarters - Schools, hospitals, or wards for the physically handicapped (%)
People in Group quarters - Institutions for the deaf (%)
People in Group quarters - Institutions for the blind (%)
People in Group quarters - Orthopedic wards and institutions for the physically handicapped (%)
People in Group quarters - Wards in general hospitals for patients who have no usual home elsewhere (%)
People in Group quarters - Wards in military hospitals for patients who have no usual home elsewhere (%)
People in Group quarters - Juvenile institutions (%)
People in Group quarters - Long-term care (%)
People in Group quarters - Homes for abused, dependent, and neglected children (%)
People in Group quarters - Residential treatment centers for emotionally disturbed children (%)
People in Group quarters - Training schools for juvenile delinquents (%)
People in Group quarters - Short-term care, detention or diagnostic centers for delinquent children (%)
People in Group quarters - Type of juvenile institution unknown (%)
People in Group quarters - Noninstitutionalized population (%)
People in Group quarters - College dormitories (includes college quarters off campus) (%)
People in Group quarters - Military quarters (%)
People in Group quarters - On base (%)
People in Group quarters - Barracks, unaccompanied personnel housing (UPH), (Enlisted/Officer), ;and similar group living quarters for military personnel (%)
People in Group quarters - Transient quarters for temporary residents (%)
People in Group quarters - Military ships (%)
People in Group quarters - Group homes (%)
People in Group quarters - Homes or halfway houses for drug/alcohol abuse (%)
People in Group quarters - Homes for the mentally ill (%)
People in Group quarters - Homes for the mentally retarded (%)
People in Group quarters - Homes for the physically handicapped (%)
People in Group quarters - Other group homes (%)
People in Group quarters - Religious group quarters (%)
People in Group quarters - Dormitories (%)
People in Group quarters - Agriculture workers' dormitories on farms (%)
People in Group quarters - Job Corps and vocational training facilities (%)
People in Group quarters - Other workers' dormitories (%)
People in Group quarters - Crews of maritime vessels (%)
People in Group quarters - Other nonhousehold living situations (%)
People in Group quarters - Other noninstitutional group quarters (%)
Residents speaking English at home (%)
Residents speaking English at home - Born in the United States (%)
Residents speaking English at home - Native, born elsewhere (%)
Residents speaking English at home - Foreign born (%)
Residents speaking Spanish at home (%)
Residents speaking Spanish at home - Born in the United States (%)
Residents speaking Spanish at home - Native, born elsewhere (%)
Residents speaking Spanish at home - Foreign born (%)
Residents speaking other language at home (%)
Residents speaking other language at home - Born in the United States (%)
Residents speaking other language at home - Native, born elsewhere (%)
Residents speaking other language at home - Foreign born (%)
Class of Workers - Employee of private company (%)
Class of Workers - Self-employed in own incorporated business (%)
Class of Workers - Private not-for-profit wage and salary workers (%)
Class of Workers - Local government workers (%)
Class of Workers - State government workers (%)
Class of Workers - Federal government workers (%)
Class of Workers - Self-employed workers in own not incorporated business and Unpaid family workers (%)
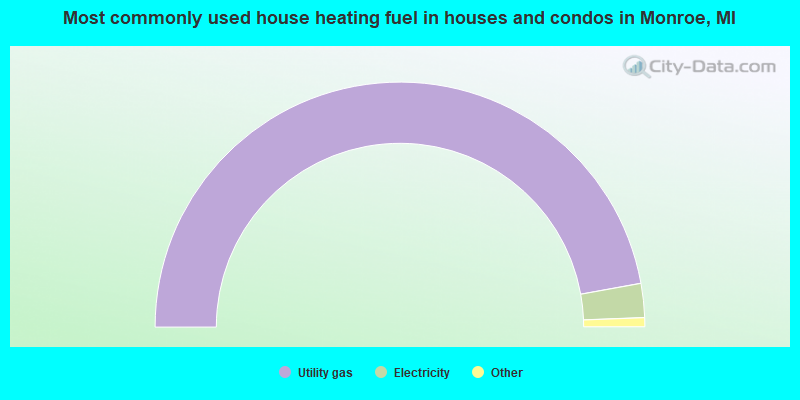
House heating fuel used in houses and condos - Utility gas (%)
House heating fuel used in houses and condos - Bottled, tank, or LP gas (%)
House heating fuel used in houses and condos - Electricity (%)
House heating fuel used in houses and condos - Fuel oil, kerosene, etc. (%)
House heating fuel used in houses and condos - Coal or coke (%)
House heating fuel used in houses and condos - Wood (%)
House heating fuel used in houses and condos - Solar energy (%)
House heating fuel used in houses and condos - Other fuel (%)
House heating fuel used in houses and condos - No fuel used (%)
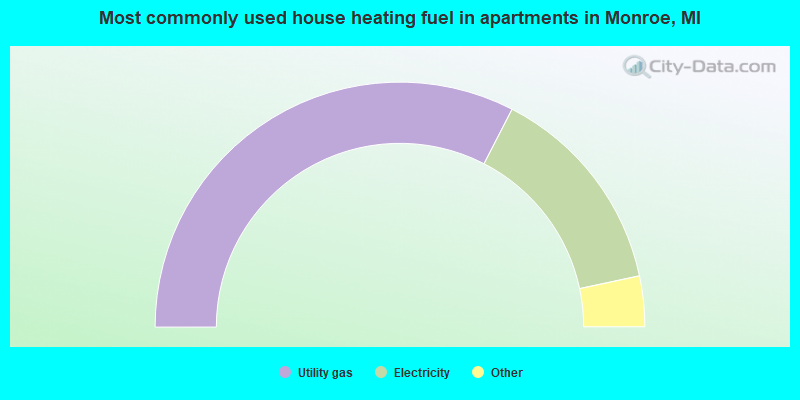
House heating fuel used in apartments - Utility gas (%)
House heating fuel used in apartments - Bottled, tank, or LP gas (%)
House heating fuel used in apartments - Electricity (%)
House heating fuel used in apartments - Fuel oil, kerosene, etc. (%)
House heating fuel used in apartments - Coal or coke (%)
House heating fuel used in apartments - Wood (%)
House heating fuel used in apartments - Solar energy (%)
House heating fuel used in apartments - Other fuel (%)
House heating fuel used in apartments - No fuel used (%)
Armed forces status - In Armed Forces (%)
Armed forces status - Civilian (%)
Armed forces status - Civilian - Veteran (%)
Armed forces status - Civilian - Nonveteran (%)
Fatal accidents locations in years 2005-2021
Fatal accidents locations in 2005
Fatal accidents locations in 2006
Fatal accidents locations in 2007
Fatal accidents locations in 2008
Fatal accidents locations in 2009
Fatal accidents locations in 2010
Fatal accidents locations in 2011
Fatal accidents locations in 2012
Fatal accidents locations in 2013
Fatal accidents locations in 2014
Fatal accidents locations in 2015
Fatal accidents locations in 2016
Fatal accidents locations in 2017
Fatal accidents locations in 2018
Fatal accidents locations in 2019
Fatal accidents locations in 2020
Fatal accidents locations in 2021
Alcohol use - People drinking some alcohol every month (%)
Alcohol use - People not drinking at all (%)
Alcohol use - Average days/month drinking alcohol
Alcohol use - Average drinks/week
Alcohol use - Average days/year people drink much
Audiometry - Average condition of hearing (%)
Audiometry - People that can hear a whisper from across a quiet room (%)
Audiometry - People that can hear normal voice from across a quiet room (%)
Audiometry - Ears ringing, roaring, buzzing (%)
Audiometry - Had a job exposure to loud noise (%)
Audiometry - Had off-work exposure to loud noise (%)
Blood Pressure & Cholesterol - Has high blood pressure (%)
Blood Pressure & Cholesterol - Checking blood pressure at home (%)
Blood Pressure & Cholesterol - Frequently checking blood cholesterol (%)
Blood Pressure & Cholesterol - Has high cholesterol level (%)
Consumer Behavior - Money monthly spent on food at supermarket/grocery store
Consumer Behavior - Money monthly spent on food at other stores
Consumer Behavior - Money monthly spent on eating out
Consumer Behavior - Money monthly spent on carryout/delivered foods
Consumer Behavior - Income spent on food at supermarket/grocery store (%)
Consumer Behavior - Income spent on food at other stores (%)
Consumer Behavior - Income spent on eating out (%)
Consumer Behavior - Income spent on carryout/delivered foods (%)
Current Health Status - General health condition (%)
Current Health Status - Blood donors (%)
Current Health Status - Has blood ever tested for HIV virus (%)
Current Health Status - Left-handed people (%)
Dermatology - People using sunscreen (%)
Diabetes - Diabetics (%)
Diabetes - Had a blood test for high blood sugar (%)
Diabetes - People taking insulin (%)
Diet Behavior & Nutrition - Diet health (%)
Diet Behavior & Nutrition - Milk product consumption (# of products/month)
Diet Behavior & Nutrition - Meals not home prepared (#/week)
Diet Behavior & Nutrition - Meals from fast food or pizza place (#/week)
Diet Behavior & Nutrition - Ready-to-eat foods (#/month)
Diet Behavior & Nutrition - Frozen meals/pizza (#/month)
Drug Use - People that ever used marijuana or hashish (%)
Drug Use - Ever used hard drugs (%)
Drug Use - Ever used any form of cocaine (%)
Drug Use - Ever used heroin (%)
Drug Use - Ever used methamphetamine (%)
Health Insurance - People covered by health insurance (%)
Kidney Conditions-Urology - Avg. # of times urinating at night
Medical Conditions - People with asthma (%)
Medical Conditions - People with anemia (%)
Medical Conditions - People with psoriasis (%)
Medical Conditions - People with overweight (%)
Medical Conditions - Elderly people having difficulties in thinking or remembering (%)
Medical Conditions - People who ever received blood transfusion (%)
Medical Conditions - People having trouble seeing even with glass/contacts (%)
Medical Conditions - People with arthritis (%)
Medical Conditions - People with gout (%)
Medical Conditions - People with congestive heart failure (%)
Medical Conditions - People with coronary heart disease (%)
Medical Conditions - People with angina pectoris (%)
Medical Conditions - People who ever had heart attack (%)
Medical Conditions - People who ever had stroke (%)
Medical Conditions - People with emphysema (%)
Medical Conditions - People with thyroid problem (%)
Medical Conditions - People with chronic bronchitis (%)
Medical Conditions - People with any liver condition (%)
Medical Conditions - People who ever had cancer or malignancy (%)
Mental Health - People who have little interest in doing things (%)
Mental Health - People feeling down, depressed, or hopeless (%)
Mental Health - People who have trouble sleeping or sleeping too much (%)
Mental Health - People feeling tired or having little energy (%)
Mental Health - People with poor appetite or overeating (%)
Mental Health - People feeling bad about themself (%)
Mental Health - People who have trouble concentrating on things (%)
Mental Health - People moving or speaking slowly or too fast (%)
Mental Health - People having thoughts they would be better off dead (%)
Oral Health - Average years since last visit a dentist
Oral Health - People embarrassed because of mouth (%)
Oral Health - People with gum disease (%)
Oral Health - General health of teeth and gums (%)
Oral Health - Average days a week using dental floss/device
Oral Health - Average days a week using mouthwash for dental problem
Oral Health - Average number of teeth
Pesticide Use - Households using pesticides to control insects (%)
Pesticide Use - Households using pesticides to kill weeds (%)
Physical Activity - People doing vigorous-intensity work activities (%)
Physical Activity - People doing moderate-intensity work activities (%)
Physical Activity - People walking or bicycling (%)
Physical Activity - People doing vigorous-intensity recreational activities (%)
Physical Activity - People doing moderate-intensity recreational activities (%)
Physical Activity - Average hours a day doing sedentary activities
Physical Activity - Average hours a day watching TV or videos
Physical Activity - Average hours a day using computer
Physical Functioning - People having limitations keeping them from working (%)
Physical Functioning - People limited in amount of work they can do (%)
Physical Functioning - People that need special equipment to walk (%)
Physical Functioning - People experiencing confusion/memory problems (%)
Physical Functioning - People requiring special healthcare equipment (%)
Prescription Medications - Average number of prescription medicines taking
Preventive Aspirin Use - Adults 40+ taking low-dose aspirin (%)
Reproductive Health - Vaginal deliveries (%)
Reproductive Health - Cesarean deliveries (%)
Reproductive Health - Deliveries resulted in a live birth (%)
Reproductive Health - Pregnancies resulted in a delivery (%)
Reproductive Health - Women breastfeeding newborns (%)
Reproductive Health - Women that had a hysterectomy (%)
Reproductive Health - Women that had both ovaries removed (%)
Reproductive Health - Women that have ever taken birth control pills (%)
Reproductive Health - Women taking birth control pills (%)
Reproductive Health - Women that have ever used Depo-Provera or injectables (%)
Reproductive Health - Women that have ever used female hormones (%)
Sexual Behavior - People 18+ that ever had sex (vaginal, anal, or oral) (%)
Sexual Behavior - Males 18+ that ever had vaginal sex with a woman (%)
Sexual Behavior - Males 18+ that ever performed oral sex on a woman (%)
Sexual Behavior - Males 18+ that ever had anal sex with a woman (%)
Sexual Behavior - Males 18+ that ever had any sex with a man (%)
Sexual Behavior - Females 18+ that ever had vaginal sex with a man (%)
Sexual Behavior - Females 18+ that ever performed oral sex on a man (%)
Sexual Behavior - Females 18+ that ever had anal sex with a man (%)
Sexual Behavior - Females 18+ that ever had any kind of sex with a woman (%)
Sexual Behavior - Average age people first had sex
Sexual Behavior - Average number of female sex partners in lifetime (males 18+)
Sexual Behavior - Average number of female vaginal sex partners in lifetime (males 18+)
Sexual Behavior - Average age people first performed oral sex on a woman (18+)
Sexual Behavior - Average number of woman performed oral sex on in lifetime (18+)
Sexual Behavior - Average number of male sex partners in lifetime (males 18+)
Sexual Behavior - Average number of male anal sex partners in lifetime (males 18+)
Sexual Behavior - Average age people first performed oral sex on a man (18+)
Sexual Behavior - Average number of male oral sex partners in lifetime (18+)
Sexual Behavior - People using protection when performing oral sex (%)
Sexual Behavior - Average number of times people have vaginal or anal sex a year
Sexual Behavior - People having sex without condom (%)
Sexual Behavior - Average number of male sex partners in lifetime (females 18+)
Sexual Behavior - Average number of male vaginal sex partners in lifetime (females 18+)
Sexual Behavior - Average number of female sex partners in lifetime (females 18+)
Sexual Behavior - Circumcised males 18+ (%)
Sleep Disorders - Average hours sleeping at night
Sleep Disorders - People that has trouble sleeping (%)
Smoking-Cigarette Use - People smoking cigarettes (%)
Taste & Smell - People 40+ having problems with smell (%)
Taste & Smell - People 40+ having problems with taste (%)
Taste & Smell - People 40+ that ever had wisdom teeth removed (%)
Taste & Smell - People 40+ that ever had tonsils teeth removed (%)
Taste & Smell - People 40+ that ever had a loss of consciousness because of a head injury (%)
Taste & Smell - People 40+ that ever had a broken nose or other serious injury to face or skull (%)
Taste & Smell - People 40+ that ever had two or more sinus infections (%)
Weight - Average height (inches)
Weight - Average weight (pounds)
Weight - Average BMI
Weight - People that are obese (%)
Weight - People that ever were obese (%)
Weight - People trying to lose weight (%)
Officers per 1,000 residents here:
2.08Michigan average:
1.86
Latest news from Monroe, MI collected exclusively by city-data.com from local newspapers, TV, and radio stations
Ancestries: American (19.0%), German (13.6%), English (8.1%), Irish (5.6%), Polish (5.2%), Italian (4.8%).
Current Local Time:
Land area: 9.04 square miles.
Population density: 2,244 people per square mile (low).
455 residents are foreign born (0.7% Asia , 0.6% Europe , 0.3% North America , 0.3% Latin America , 0.3% Africa ).
This city:
2.2%Michigan:
6.9%
Median real estate property taxes paid for housing units with mortgages in 2022: $2,164 (1.3%)Median real estate property taxes paid for housing units with no mortgage in 2022: $2,276 (1.4%)
Nearest city with pop. 50,000+: Toledo, OH
Nearest city with pop. 1,000,000+: Chicago, IL
Nearest cities:
Latitude: 41.92 N, Longitude: 83.39 W
Daytime population change due to commuting: +3,125 (+15.2%)Workers who live and work in this city: 3,050 (35.0%)
Single-family new house construction building permits:
2020: 3 buildings , average cost: $237,3002019: 1 building , cost: $102,0002018: 3 buildings , average cost: $281,8002017: 2 buildings , average cost: $183,5002016: 3 buildings , average cost: $155,5002015: 5 buildings , average cost: $147,7002014: 4 buildings , average cost: $164,9002013: 1 building , cost: $162,0002012: 1 building , cost: $174,8002010: 3 buildings , average cost: $143,0002009: 3 buildings , average cost: $84,0002008: 6 buildings , average cost: $159,5002007: 25 buildings , average cost: $138,7002006: 19 buildings , average cost: $120,1002005: 63 buildings , average cost: $143,5002004: 52 buildings , average cost: $129,8002003: 94 buildings , average cost: $125,1002002: 61 buildings , average cost: $139,4002001: 37 buildings , average cost: $91,0002000: 34 buildings , average cost: $91,0001999: 39 buildings , average cost: $91,0001998: 38 buildings , average cost: $91,0001997: 31 buildings , average cost: $91,000Unemployment in December 2023:
Most common occupations in Monroe, MI (%)
Both Males Females
Other production occupations, including supervisors (5.6%)
Other sales and related occupations, including supervisors (4.0%)
Laborers and material movers, hand (3.7%)
Building and grounds cleaning and maintenance occupations (3.7%)
Metal workers and plastic workers (3.4%)
Assemblers and fabricators (3.4%)
Other office and administrative support workers, including supervisors (3.1%)
Other production occupations, including supervisors (7.9%)
Metal workers and plastic workers (5.6%)
Laborers and material movers, hand (5.2%)
Electrical equipment mechanics and other installation, maintenance, and repair workers, including supervisors (4.8%)
Driver/sales workers and truck drivers (4.6%)
Assemblers and fabricators (4.5%)
Engineers (3.8%)
Secretaries and administrative assistants (5.2%)
Other office and administrative support workers, including supervisors (5.2%)
Other sales and related occupations, including supervisors (5.1%)
Preschool, kindergarten, elementary, and middle school teachers (4.7%)
Registered nurses (4.0%)
Building and grounds cleaning and maintenance occupations (3.6%)
Cashiers (3.5%)
Tornado activity:
Monroe-area historical tornado activity is above Michigan state average. It is 43% greater than the overall U.S. average.
On 6/8/1953, a category F4 (max. wind speeds 207-260 mph) tornado 10.0 miles away from the Monroe city center killed 4 people and injured 18 people and caused between $50,000 and $500,000 in damages.
On 4/11/1965, a category F4 tornado 11.9 miles away from the city center killed 23 people and injured 294 people and caused between $50,000,000 and $500,000,000 in damages.
Earthquake activity:
Monroe-area historical earthquake activity is significantly above Michigan state average. It is 38% smaller than the overall U.S. average. On 9/25/1998 at 19:52:52, a magnitude 5.2 (4.8 MB, 4.3 MS, 5.2 LG, 4.5 MW, Depth: 3.1 mi, Class: Moderate, Intensity: VI - VII) earthquake occurred 157.6 miles away from the city center On 1/31/1986 at 16:46:43, a magnitude 5.0 (5.0 MB) earthquake occurred 117.3 miles away from Monroe center On 7/12/1986 at 08:19:37, a magnitude 4.5 (4.5 MB, Class: Light, Intensity: IV - V) earthquake occurred 108.2 miles away from Monroe center On 7/27/1980 at 18:52:21, a magnitude 5.2 (5.1 MB, 4.7 MS, 5.0 UK, 5.2 UK) earthquake occurred 258.5 miles away from the city center On 8/23/2011 at 17:51:04, a magnitude 5.8 (5.8 MW, Depth: 3.7 mi) earthquake occurred 400.7 miles away from the city center On 5/2/2015 at 16:23:07, a magnitude 4.2 (4.2 MW, Depth: 2.8 mi) earthquake occurred 106.8 miles away from Monroe center Magnitude types: regional Lg-wave magnitude (LG), body-wave magnitude (MB), surface-wave magnitude (MS), moment magnitude (MW) Natural disasters: The number of natural disasters in Monroe County (9) is smaller than the US average (15).Major Disasters (Presidential) Declared: 4Emergencies Declared: 4Floods: 3, Storms: 3, Blizzard: 1, Hurricane: 1, Power Outage: 1, Snowstorm: 1, Tornado: 1, Winter Storm: 1, Other: 1 (Note: some incidents may be assigned to more than one category). Main business address for: MBT FINANCIAL CORP NATIONAL COMMERCIAL BANKS ), LA-Z-BOY INC HOUSEHOLD FURNITURE ).
Hospitals in Monroe: MERCY MEMORIAL HOSPICE OF MONR (725 NORTH MONROE STREET) MERCY MEMORIAL HOSPITAL SYSTEM (Voluntary non-profit - Other, 718 N MACOMB ST) Nursing Homes in Monroe: FOUNTAIN VIEW OF MONROE (1971 N MONROE STREET) GREENBROOK MANOR (481 VILLAGE GREEN LN) LUTHERAN HOME - MONROE (1236 S MONROE ST) LUTHERAN HOME FOR THE AGED (1236 S MONROE ST) MAGNUMCARE OF MONROE (1215 N TELEGRAPH RD) MEDILODGE OF MONROE, L L C (481 VILLAGE GREEN LANE) MERCY MEMORIAL NURSING CENTER (700 STEWART RD) SISTERS, SERVANTS OF THE IMMACULATE HEART OF MARY (610 WEST ELM AVENUE) Dialysis Facilities in Monroe: GREAT LAKES DIALYSIS - MONROE (992 S MONROE ST) Home Health Centers in Monroe: HOMECARE CONNECTION (700 STEWART RD, SUITE 102) PROGRESSIVE THERAPEUTIC HOME HEALTH CARE, INC (721 NORTH MACOMB STREET, SUITE #4)
Nuclear power plants:
Colleges/Universities in Monroe: Monroe County Community College Full-time enrollment: 2,553; Location: 1555 South Raisinville Road; Public; Website: www.monroeccc.edu)
Michigan College of Beauty-Monroe Full-time enrollment: 230; Location: 1020 S. Monroe St.; Private, for-profit; Website: MichiganCollegeBeauty.com)
Other colleges/universities with over 2000 students near Monroe:
University of Toledo (about 22 miles; Toledo, OH ; Full-time enrollment: 18,409)
Owens Community College (about 24 miles; Perrysburg, OH ; FT enrollment: 9,416)
Eastern Michigan University (about 26 miles; Ypsilanti, MI ; FT enrollment: 18,395)
Baker College of Allen Park (about 27 miles; Allen Park, MI ; FT enrollment: 2,693)
Washtenaw Community College (about 28 miles; Ann Arbor, MI ; FT enrollment: 8,452)
University of Michigan-Dearborn (about 29 miles; Dearborn, MI ; FT enrollment: 6,712)
Henry Ford Community College (about 30 miles; Dearborn, MI ; FT enrollment: 12,610)
Public high schools in Monroe: MONROE HIGH SCHOOL Students: 2,081, Location: 901 HERR RD, Grades: 9-12)JEFFERSON HIGH SCHOOL Students: 763, Location: 5707 WILLIAMS RD, Grades: 9-12)ORCHARD CENTER HIGH SCHOOL Students: 171, Location: 1750 OAK ST, Grades: 6-12)MONROE COUNTY YOUTH CENTER Students: 31, Location: 3600 SOUTH CUSTER RD, Grades: 5-12)MONROE COUNTY EDUCATION CENTER Students: 1, Location: 1091 SOUTH RAISINVILLE RD, Grades: KG-12)MONROE COUNTY MIDDLE COLLEGE Location: 1101 SOUTH RAISINVILLE RD, Grades: 9-12)
Private high schools in Monroe: ST MARY CATHOLIC CENTRAL HIGH SCHOOL Students: 448, Location: 108 W ELM AVE, Grades: 9-12)
MEADOW MONTESSORI SCHOOL Students: 167, Location: 1670 S RAISINVILLE RD, Grades: PK-12)
Biggest public elementary/middle schools in Monroe: CUSTER ELEMENTARY SCHOOL Students: 1,090, Location: 5003 WEST ALBAIN RD, Grades: PK-6)MONROE MIDDLE SCHOOL Students: 958, Location: 503 WASHINGTON ST, Grades: 7-8)TRIUMPH ACADEMY Students: 613, Location: 3000 VIVIAN RD, Grades: KG-8, Charter school )RAISINVILLE SCHOOL Students: 459, Location: 2300 NORTH RAISINVILLE RD, Grades: PK-6)MANOR ELEMENTARY SCHOOL Students: 413, Location: 1731 WEST LORAIN ST, Grades: PK-6)JEFFERSON ELEMENTARY 5TH/6TH Students: 372, Location: 5102 NORTH STONEY CREEK RD, Grades: 5-6)SODT ELEMENTARY SCHOOL Students: 326, Location: 2888 NADEAU RD, Grades: KG-4)WATERLOO SCHOOL Students: 300, Location: 1933 SOUTH CUSTER RD, Grades: PK-6)JEFFERSON MIDDLE SCHOOL Location: 5102 NORTH STONEY CREEK RD, Grades: 7-8)
ARBORWOOD ELEMENTARY SCHOOL Location: 1135 RIVERVIEW AVE, Grades: PK-6)
Private elementary/middle schools in Monroe: ST MARY SCHOOL Students: 317, Location: 151 N MONROE ST, Grades: PK-8)
ST JOHN ELEMENTARY SCHOOL Students: 233, Location: 521 S MONROE ST, Grades: PK-8)
ST MICHAEL SCHOOL Students: 195, Location: 510 W FRONT ST, Grades: UG-8)
TRINITY LUTHERAN SCHOOL Students: 139, Location: 315 SCOTT ST, Grades: PK-8)
HOLY GHOST LUTHERAN SCHOOL Students: 55, Location: 3563 HEISS RD, Grades: PK-8)
ZION LUTHERAN SCHOOL Students: 50, Location: 186 COLE RD, Grades: PK-8)
See full list of schools located in Monroe Library in Monroe: MONROE COUNTY LIBRARY SYSTEM Operating income: $8,221,037; Location: 840 SOUTH ROESSLER STREET; 498,304 books ; 27,777 audio materials ; 46,997 video materials ; 11 local licensed databases ; 1,462 print serial subscriptions )
Notable locations in Monroe: (A) , Port of Monroe (B) , River Basin Battlefield (C) , Monroe Station (D) , Monroe Community Ambulance Main Station (E) , Monroe Community Ambulance Monroe Mercy Hospital (F) , Monroe City Police Department (G) , Monroe County Sheriff's Office (H) , Monroe County Courthouse (I) , Dorsh Memorial Library (J) , Monroe Historical Museum (K) , Monroe Health Center (L) , Monroe City Fire Department 3 (M) , Monroe City Fire Department Station 1 (N) , Monroe City Fire Department 2 (O) . Display/hide their locations on the map
Main business address in Monroe include: (A) , LA-Z-BOY INC (B) . Display/hide their locations on the map
Churches in Monroe include: (A) , Carey Chapel (B) , Al Overstreet Evangelistic Church (C) , Elm Street Chapel (D) , First Church of Christ Scientist (E) , Church of God (F) , First Wesleyan Church (G) , Second Missionary Baptist Church (H) , Eagle's Nest Community Church (I) . Display/hide their locations on the map
Cemeteries: (1) , Trinity Cemetery (2) , Kentucky Soldiers Park Cemetery (3) , Zion Cemetery (4) , Woodland Cemetery (5) . Display/hide their locations on the map
Streams, rivers, and creeks: (A) , Mason Run (B) , River Raisin (C) . Display/hide their locations on the map
Parks in Monroe include: (1) , Manor Park (2) , Veterans Park (3) , Roessler Park (4) , Saint Mary's Park (5) , Soldiers and Sailors Park (6) , Hellenberg Park (7) , Munson Park (8) , Saint John the Baptist Catholic Church Historical Marker (9) . Display/hide their locations on the map
Tourist attractions: (1) , Flower Market (Water Parks & Slides; 8920 South Custer Road) (2) , Frenchtown Senior Citizens Center (2786 Vivian Road) (3) . Display/hide their approximate locations on the map
Hotels: (1) , Days Inn (1440 North Dixie Highway) (2) , Comfort Inn (6500 East Albain Road) (3) , Best Western Prestige Inn (1900 Welcome Way) (4) , Hampton Inn Monroe (1565 North Dixie Highway) (5) , Comfort Inn Monroe (6500 East Albain Road) (6) . Display/hide their approximate locations on the map
Court: (1) . Display/hide its approximate location on the map
Birthplace of: Frankie Biggz - Dance musician, Carl Ford - 2005 NFL player (Chicago Bears, born : Oct 8, 1980), Charles Lanman - Librarian, Christie Brinkley - (born 1954), model, Elizabeth Bacon Custer - Women writer, Evan Kasprzak - Dancer, Horace Thompson Carpenter - Illustrator, John James Hattstaedt - Music educator, Randy Richardville - Politician, Audie Cole - Football player.
Monroe County has a predicted average indoor radon screening level between 2 and 4 pCi/L (pico curies per liter) - Moderate Potential Drinking water stations with addresses in Monroe and their reported violations in the past:
FRENCHTOWN TOWNSHIP (Population served: 17,374, Surface water):
Past monitoring violations:
Monitoring and Reporting (DBP) - Between JUL-2008 and SEP-2008, Contaminant: CARBON, TOTAL. Follow-up actions: St Compliance achieved (OCT-27-2008), St Public Notif requested (NOV-12-2008), St Violation/Reminder Notice (NOV-12-2008), St Public Notif received (FEB-10-2009)
Monitoring and Reporting (DBP) - Between APR-2008 and JUN-2008, Contaminant: CARBON, TOTAL. Follow-up actions: St Public Notif requested (NOV-12-2008), St Violation/Reminder Notice (NOV-12-2008), St Compliance achieved (NOV-12-2008), St Public Notif received (FEB-10-2009)
Monitoring and Reporting (DBP) - Between JAN-2008 and MAR-2008, Contaminant: CARBON, TOTAL. Follow-up actions: St Compliance achieved (NOV-12-2008), St Public Notif requested (NOV-12-2008), St Violation/Reminder Notice (NOV-12-2008), St Public Notif received (FEB-10-2009)
Monitoring and Reporting (DBP) - Between OCT-2007 and DEC-2007, Contaminant: CARBON, TOTAL. Follow-up actions: St Compliance achieved (OCT-27-2008), St Public Notif requested (NOV-12-2008), St Violation/Reminder Notice (NOV-12-2008), St Public Notif received (FEB-10-2009)
Monitoring and Reporting (DBP) - Between JUL-2007 and SEP-2007, Contaminant: CARBON, TOTAL. Follow-up actions: St Compliance achieved (OCT-27-2008), St Violation/Reminder Notice (NOV-12-2008), St Public Notif requested (NOV-12-2008), St Public Notif received (FEB-10-2009)
Population served: 40, Groundwater):
Past monitoring violations:
One regular monitoring violation
Population served: 25, Groundwater):
Past health violations:
MCL, Monthly (TCR) - In SEP-2008, Contaminant: Coliform. Follow-up actions: St Public Notif requested (SEP-10-2008), St Unresolved (3 times from SEP-17-2008 to SEP-24-2008), St Compliance achieved (OCT-08-2008)
Population served: 25, Groundwater):
Past health violations:
MCL, Monthly (TCR) - In NOV-2009, Contaminant: Coliform. Follow-up actions: St Unresolved (2 times from NOV-06-2009 to APR-01-2010), St Tech Assistance Visit (MAY-05-2010), St Unresolved (MAY-26-2010), St Compliance achieved (JUN-29-2010)
MCL, Acute (TCR) - In JUN-2008, Contaminant: Coliform. Follow-up actions: St Public Notif requested (JUN-20-2008), St Public Notif received (JUN-23-2008), St Unresolved (3 times from JUL-02-2008 to AUG-08-2008), St Compliance achieved (JUL-08-2009)
MCL, Monthly (TCR) - In MAY-2006, Contaminant: Coliform. Follow-up actions: St Public Notif requested (MAY-24-2006), St Compliance achieved (JUN-30-2006)
Drinking water stations with addresses in Monroe that have no violations reported:
VIENNA PARK (Population served: 25, Primary Water Source Type: Groundwater)
Average household size: This city:
2.4 peopleMichigan:
2.5 people
Percentage of family households: This city:
64.1%Whole state:
66.0%
Percentage of households with unmarried partners: This city:
7.5%Whole state:
6.4%
Likely homosexual households (counted as self-reported same-sex unmarried-partner households)
Lesbian couples: 0.4% of all households Gay men: 0.2% of all households
People in group quarters in Monroe in 2010:
393 people in other noninstitutional facilities
88 people in nursing facilities/skilled-nursing facilities
67 people in group homes intended for adults
49 people in emergency and transitional shelters (with sleeping facilities) for people experiencing homelessness
12 people in correctional residential facilities
People in group quarters in Monroe in 2000:
258 people in other nonhousehold living situations
225 people in nursing homes
208 people in local jails and other confinement facilities (including police lockups)
54 people in other noninstitutional group quarters
29 people in homes for the mentally retarded
18 people in halfway houses
8 people in other group homes
4 people in homes for the mentally ill
3 people in mental (psychiatric) hospitals or wards
Banks with branches in Monroe (2011 data):
Monroe Bank & Trust: at 102 East Front Street, West Monroe Branch, North Dixie Branch, South Dixie Branch, South Monroe Branch, North Monroe Street Branch. Info updated 2008/10/10: Bank assets: $1,237.6 mil, Deposits: $1,022.4 mil, local headquarters , negative income in the last year , Commercial Lending Specialization, 25 total offices , Holding Company: Mbt Financial Corp.
Fifth Third Bank: South Monroe Branch, North Monroe Bkg. Ctr. Branch, Monroe Downtown Banking Center. Info updated 2009/10/05: Bank assets: $114,540.4 mil, Deposits: $89,689.1 mil, headquarters in Cincinnati, OH, positive income , Commercial Lending Specialization, 1378 total offices , Holding Company: Fifth Third Bancorp
PNC Bank, National Association: North Telegraph Road Branch, North Monroe Street Branch, North Dixie Branch. Info updated 2012/03/20: Bank assets: $263,309.6 mil, Deposits: $197,343.0 mil, headquarters in Wilmington, DE, positive income , Commercial Lending Specialization, 3085 total offices , Holding Company: Pnc Financial Services Group, Inc., The
Bank of America, National Association: Monroe-Sixth Branch at 602 South Monroe Street, branch established on 1923/01/01; Frenchtown Branch at 2322 North Monroe, branch established on 1923/01/01. Info updated 2009/11/18: Bank assets: $1,451,969.3 mil, Deposits: $1,077,176.8 mil, headquarters in Charlotte, NC, positive income , 5782 total offices , Holding Company: Bank Of America Corporation
Flagstar Bank, FSB: Monroe Branch at 2203 N. Telegraph Road, branch established on 2005/04/06. Info updated 2011/07/21: Bank assets: $13,623.5 mil, Deposits: $7,802.8 mil, headquarters in Troy, MI, negative income in the last year , Mortgage Lending Specialization, 135 total offices
KeyBank National Association: North Telegraph Branch at 1535 North Telegraph Road, branch established on 1990/03/12. Info updated 2008/03/03: Bank assets: $86,198.8 mil, Deposits: $64,214.8 mil, headquarters in Cleveland, OH, positive income , Commercial Lending Specialization, 1067 total offices , Holding Company: Keycorp
For population 15 years and over in Monroe:
Never married: 33.5%Now married: 43.5%Separated: 0.7%Widowed: 7.3%Divorced: 15.0% For population 25 years and over in Monroe:
High school or higher: 90.2%Bachelor's degree or higher: 18.9%Graduate or professional degree: 7.0%Unemployed: 3.4%Mean travel time to work (commute): 20.1 minutes
Education Gini index (Inequality in education) Here:
8.8Michigan average:
11.0
Religion statistics for Monroe, MI (based on Monroe County data)
Religion Adherents Congregations Catholic 31,981 15 Evangelical Protestant 24,845 90 Mainline Protestant 9,359 34 Other 2,309 7 Black Protestant 488 3 Orthodox 140 1 None 82,899 -
Source: Clifford Grammich, Kirk Hadaway, Richard Houseal, Dale E.Jones, Alexei Krindatch, Richie Stanley and Richard H.Taylor. 2012. 2010 U.S.Religion Census: Religious Congregations & Membership Study. Association of Statisticians of American Religious Bodies. Jones, Dale E., et al. 2002. Congregations and Membership in the United States 2000. Nashville, TN: Glenmary Research Center. Graphs represent county-level data
Food Environment Statistics: Number of grocery stores : 25Here :
1.63 / 10,000 pop.Michigan :
2.34 / 10,000 pop.
Number of supercenters and club stores : 1Monroe County :
0.07 / 10,000 pop.Michigan :
0.18 / 10,000 pop.
Number of convenience stores (no gas) : 20This county :
1.30 / 10,000 pop.State :
1.52 / 10,000 pop.
Number of convenience stores (with gas) : 33Monroe County :
2.15 / 10,000 pop.Michigan :
2.99 / 10,000 pop.
Number of full-service restaurants : 83Monroe County :
5.41 / 10,000 pop.Michigan :
6.80 / 10,000 pop.
Adult diabetes rate : Monroe County :
9.6%Michigan :
9.7%
Adult obesity rate : Monroe County :
30.2%Michigan :
29.7%
Low-income preschool obesity rate : Monroe County :
11.6%State :
13.4%
Health and Nutrition:
Average overall health of teeth and gums : People feeling badly about themselves : This city:
21.0%Michigan:
20.6%
People not drinking alcohol at all : Monroe:
10.0%Michigan:
10.4%
Average hours sleeping at night : Overweight people : This city:
34.6%State:
34.1%
General health condition : Average condition of hearing : Monroe:
79.3%Michigan:
79.6%
More about Health and Nutrition of Monroe, MI Residents
Local government employment and payroll (March 2022)
Function
Full-time employees
Monthly full-time payroll
Average yearly full-time wage
Part-time employees
Monthly part-time payroll
Police Protection - Officers
40 $237,277 $71,183 0 $0 Water Supply
29 $140,838 $58,278 0 $0 Sewerage
22 $96,391 $52,577 1 $1,733 Other Government Administration
17 $87,757 $61,946 0 $0 Firefighters
15 $85,173 $68,138 0 $0 Streets and Highways
14 $58,647 $50,269 0 $0 Financial Administration
10 $51,197 $61,436 0 $0 Housing and Community Development (Local)
10 $45,464 $54,557 2 $4,699 Police - Other
5 $23,310 $55,944 5 $5,939 Parks and Recreation
4 $19,878 $59,634 1 $1,200 Natural Resources
3 $12,832 $51,328 0 $0 Fire - Other
1 $3,176 $38,112 0 $0 Airports
0 $0 7 $9,166
Totals for Government
170 $861,940 $60,843 16 $22,738
Monroe government finances - Expenditure in 2021 (per resident):
Construction - Regular Highways: $3,196,000 ($157.48)
Air Transportation: $9,000 ($0.44)Current Operations - General - Other: $14,063,000 ($692.93)
Sewerage: $8,521,000 ($419.86)Parks and Recreation: $4,742,000 ($233.65)Regular Highways: $2,932,000 ($144.47)Housing and Community Development: $2,893,000 ($142.55)Solid Waste Management: $1,844,000 ($90.86)Central Staff Services: $1,634,000 ($80.51)Financial Administration: $992,000 ($48.88)Protective Inspection and Regulation - Other: $880,000 ($43.36)Police Protection: $830,000 ($40.90)Air Transportation: $424,000 ($20.89)Local Fire Protection: $364,000 ($17.94)General Public Buildings: $270,000 ($13.30)Judicial and Legal Services: $147,000 ($7.24)Libraries: $65,000 ($3.20)General - Interest on Debt: $2,188,000 ($107.81)
Intergovernmental to Local - Other - General - Other: $300,000 ($14.78)
Other - Sewerage: $286,000 ($14.09)Other - Police Protection: $56,000 ($2.76)Intergovernmental to State - Air Transportation: $2,000 ($0.10)
Other Capital Outlay - Parks and Recreation: $709,000 ($34.93)
General - Other: $607,000 ($29.91)Local Fire Protection: $35,000 ($1.72)Total Salaries and Wages: $12,933,000 ($637.25)
Water Utilities - Interest on Debt: $540,000 ($26.61)
Monroe government finances - Revenue in 2021 (per resident):
Charges - Sewerage: $10,542,000 ($519.44)
Other: $1,725,000 ($85.00)Air Transportation: $210,000 ($10.35)Parking Facilities: $46,000 ($2.27)Parks and Recreation: $26,000 ($1.28)Federal Intergovernmental - Housing and Community Development: $2,705,000 ($133.28)
Other: $906,000 ($44.64)Local Intergovernmental - Other: $400,000 ($19.71)
Miscellaneous - General Revenue - Other: $3,017,000 ($148.66)
Donations From Private Sources: $2,805,000 ($138.21)Rents: $597,000 ($29.42)Sale of Property: $250,000 ($12.32)Interest Earnings: $147,000 ($7.24)Fines and Forfeits: $29,000 ($1.43)Special Assessments: $16,000 ($0.79)Revenue - Water Utilities: $10,137,000 ($499.48)
State Intergovernmental - Highways: $2,681,000 ($132.10)
Other: $2,561,000 ($126.19)General Local Government Support: $2,347,000 ($115.64)Tax - Property: $17,740,000 ($874.11)
Other License: $898,000 ($44.25)Occupation and Business License - Other: $1,000 ($0.05)
Monroe government finances - Debt in 2021 (per resident):
Long Term Debt - Beginning Outstanding - Unspecified Public Purpose: $95,544,000 ($4707.76)
Outstanding Unspecified Public Purpose: $91,305,000 ($4498.89)Retired Unspecified Public Purpose: $14,843,000 ($731.36)Issue, Unspecified Public Purpose: $10,603,000 ($522.44)
Monroe government finances - Cash and Securities in 2021 (per resident):
Other Funds - Cash and Securities: $59,499,000 ($2931.71)
Businesses in Monroe, MI
Name Count Name Count
AT&T 2 La-Z-Boy 2 Ace Hardware 2 Lane Furniture 2 Advance Auto Parts 1 Lowe's 1 Aeropostale 1 MasterBrand Cabinets 8 American Eagle Outfitters 1 Maurices 1 Applebee's 1 Mazda 1 Arby's 2 McDonald's 4 AutoZone 2 Meijer 1 Bath & Body Works 1 Motel 6 1 Baymont Inn 1 Nike 6 Blockbuster 1 Nissan 1 Buffalo Wild Wings 1 Panera Bread 1 Burger King 1 Payless 1 CVS 1 Penske 1 Carson Pirie Scott 1 PetSmart 1 Chevrolet 1 Pizza Hut 1 Church's Chicken 1 Popeyes 1 Cold Stone Creamery 1 Quality 1 Comfort Inn 1 RadioShack 2 Cracker Barrel 1 Red Lobster 1 Curves 1 Red Roof Inn 1 Deb 1 Rite Aid 1 Dennys 1 Ruby Tuesday 1 DressBarn 1 SONIC Drive-In 1 Dressbarn 1 Sears 2 Fashion Bug 1 Sprint Nextel 1 FedEx 4 Staples 1 Finish Line 1 Subway 6 Firestone Complete Auto Care 1 T-Mobile 2 GNC 1 T.J.Maxx 1 GameStop 2 Taco Bell 2 Gap 1 Target 1 Goodwill 1 Tim Hortons 3 H&R Block 3 Toyota 1 Hilton 1 Toys"R"Us 1 Hobby Lobby 1 U-Haul 2 Holiday Inn 1 UPS 11 Honda 1 Verizon Wireless 1 Jones New York 1 Volkswagen 1 KFC 2 Walgreens 2 Kincaid 1 Walmart 1 Kmart 1 Wendy's 4 Knights Inn 1 White Castle 1 Kohl's 1 YMCA 1 Kroger 2
Strongest AM radio stations in Monroe:
WFDF (910 AM; 50 kW; FLINT, MI; Owner: ABC, INC.)
WJR (760 AM; 50 kW; DETROIT, MI; Owner: ABC, INC.)
WDFN (1130 AM; 50 kW; DETROIT, MI; Owner: AMFM RADIO LICENSES, L.L.C.)
WCHB (1200 AM; 50 kW; TAYLOR, MI; Owner: RADIO ONE OF DETROIT, LLC)
WRDT (560 AM; 0 kW; MONROE, MI; Owner: WMUZ RADIO, INC.)
WWJ (950 AM; 50 kW; DETROIT, MI; Owner: INFINITY BROADCASTING OPERATIONS, INC.)
WXYT (1270 AM; 50 kW; DETROIT, MI; Owner: INFINITY BROADCASTING CORP. OF DETROIT)
WTKA (1050 AM; 10 kW; ANN ARBOR, MI; Owner: CAPSTAR TX LIMITED PARTNERSHIP)
WNZK (690 AM; 2 kW; DEARBORN HEIGHTS, MI; Owner: BIRACH BROADCASTING CORPORATION)
WDEO (990 AM; 9 kW; YPSILANTI, MI; Owner: WORD BROADCASTERS, INC.)
WSPD (1370 AM; 5 kW; TOLEDO, OH; Owner: CITICASTERS LICENSES, L.P.)
WKNR (850 AM; 50 kW; CLEVELAND, OH; Owner: CARON BROADCASTING, INC.)
WXDX (1310 AM; 5 kW; DEARBORN, MI; Owner: AMFM RADIO LICENSES, L.L.C.)
Strongest FM radio stations in Monroe:
WJOF (88.1 FM; MONROE, MI; Owner: NORTHLAND COMMUNITY BROADCASTERS)
WEJY (97.5 FM; MONROE, MI; Owner: MONROE PUBLIC SCHOOLS)
WTWR-FM (98.3 FM; LUNA PIER, MI; Owner: CUMULUS LICENSING CORP.)
WGTE-FM (91.3 FM; TOLEDO, OH; Owner: THE PUBLIC B/C FOUNDATION OF NW OHIO)
WRVF (101.5 FM; TOLEDO, OH; Owner: CITICASTERS LICENSES, L.P.)
WIOT (104.7 FM; TOLEDO, OH; Owner: JACOR BROADCASTING CORPORATION)
WKKO (99.9 FM; TOLEDO, OH; Owner: CUMULUS LICENSING CORP.)
WAAQ (88.3 FM; ONSTED, MI; Owner: GREAT LAKES COMMUNITY BROADCASTING, INC.)
WOTL (90.3 FM; TOLEDO, OH; Owner: FAMILY STATIONS, INC.)
WMGC-FM (105.1 FM; DETROIT, MI; Owner: GREATER BOSTON RADIO, INC.)
WRIF (101.1 FM; DETROIT, MI; Owner: GREATER BOSTON RADIO, INC.)
WCSX (94.7 FM; BIRMINGHAM, MI; Owner: GREATER BOSTON RADIO, INC.)
WMXD (92.3 FM; DETROIT, MI; Owner: AMFM RADIO LICENSES, L.L.C.)
WDTW (106.7 FM; DETROIT, MI; Owner: AMFM RADIO LICENSES, L.L.C.)
WKRK-FM (97.1 FM; DETROIT, MI; Owner: INFINITY BROADCASTING OPERATIONS, INC.)
WWWM-FM (105.5 FM; SYLVANIA, OH; Owner: CUMULUS LICENSING CORP.)
WDVD (96.3 FM; DETROIT, MI; Owner: ABC, INC.)
WYCD (99.5 FM; DETROIT, MI; Owner: INFINITY BROADCASTING CORPORATION OF MICHIGAN)
WJZE (97.3 FM; OAK HARBOR, OH; Owner: RASP BROADCASTING ENTERPRISES, INC.)
WVKS (92.5 FM; TOLEDO, OH; Owner: CITICASTERS LICENSES, L.P.)
TV broadcast stations around Monroe:
WTOL (Channel 11; TOLEDO, OH; Owner: LIBCO, INC.)
WNWO-TV (Channel 24; TOLEDO, OH; Owner: RAYCOM NATIONAL, INC.)
WUPW (Channel 36; TOLEDO, OH; Owner: WUPW BROADCASTING, LLC)
WTVG (Channel 13; TOLEDO, OH; Owner: WTVG, INC.)
WGTE-TV (Channel 30; TOLEDO, OH; Owner: THE PUBLIC BROADCASTING FOUNDATION OF NW OHIO)
W22CO (Channel 22; TOLEDO, OH; Owner: NATIONAL MINORITY T.V., INC.)
WXYZ-TV (Channel 7; DETROIT, MI; Owner: CHANNEL 7 OF DETROIT, INC.)
WJBK (Channel 2; DETROIT, MI; Owner: FOX TELEVISION STATIONS, INC.)
WWJ-TV (Channel 62; DETROIT, MI; Owner: CBS BROADCASTING INC.)
WBTL-LP (Channel 34; TOLEDO, OH; Owner: VENTURE TECHNOLOGIES GROUP, LLC)
WDWB (Channel 20; DETROIT, MI; Owner: WXON LICENSE, INC.)
WNGT-LP (Channel 48; TOLEDO, OH; Owner: L & M VIDEO PRODUCTIONS, INC.)
W59DC (Channel 59; HOUGHTON LAKE, MI; Owner: MS COMMUNICATIONS, LLC)
WTVS (Channel 56; DETROIT, MI; Owner: DETROIT EDUC. TV FOUNDATION)
WKBD (Channel 50; DETROIT, MI; Owner: VIACOM STATIONS GROUP OF DETROIT INC.)
WBXD-CA (Channel 5; DETROIT, MI; Owner: THE BOX WORLDWIDE LLC)
WDIV-TV (Channel 4; DETROIT, MI; Owner: POST-NEWSWEEK STATIONS, MICHIGAN, INC.)
W64BM (Channel 64; TOLEDO, OH; Owner: VENTANA TELEVISION, INC.)
Medal of Honor Recipients
Medal of Honor Recipient born in Monroe: Charles F. Sancrainte.
National Bridge Inventory (NBI) Statistics 47 Number of bridges600ft / 183m Total length $890,000 Total costs1,029,358 Total average daily traffic185,311 Total average daily truck traffic
New bridges - historical statistics
6 1920-1929 2 1930-1939 18 1950-1959 3 1960-1969 3 1970-1979 4 1980-1989 7 2000-2009 4 2010-2019
See full National Bridge Inventory statistics for Monroe, MI
Home Mortgage Disclosure Act Aggregated Statistics For Year 2009(Based on 2 full and 7 partial tracts) A) FHA, FSA/RHS & VA B) Conventional C) Refinancings D) Home Improvement Loans E) Loans on Dwellings For 5+ Families F) Non-occupant Loans on G) Loans On Manufactured Number Average Value Number Average Value Number Average Value Number Average Value Number Average Value Number Average Value Number Average Value
LOANS ORIGINATED 57 $88,272 35 $69,876 111 $109,466 10 $33,917 2 $79,690 24 $68,375 2 $40,850 APPLICATIONS APPROVED, NOT ACCEPTED 6 $82,142 5 $47,020 12 $107,213 3 $11,547 0 $0 1 $84,430 2 $34,640 APPLICATIONS DENIED 10 $86,868 14 $52,663 73 $110,163 19 $28,003 0 $0 14 $64,260 1 $20,380 APPLICATIONS WITHDRAWN 9 $73,398 3 $55,283 25 $127,024 2 $28,905 0 $0 2 $22,480 0 $0 FILES CLOSED FOR INCOMPLETENESS 2 $91,310 1 $61,990 4 $115,745 0 $0 0 $0 1 $61,990 0 $0
Aggregated Statistics For Year 2008(Based on 2 full and 7 partial tracts) A) FHA, FSA/RHS & VA B) Conventional C) Refinancings D) Home Improvement Loans E) Loans on Dwellings For 5+ Families F) Non-occupant Loans on G) Loans On Manufactured Number Average Value Number Average Value Number Average Value Number Average Value Number Average Value Number Average Value Number Average Value
LOANS ORIGINATED 42 $104,678 54 $93,318 116 $108,001 23 $23,027 1 $386,970 44 $73,987 5 $32,114 APPLICATIONS APPROVED, NOT ACCEPTED 3 $80,493 13 $72,904 20 $113,156 9 $12,321 0 $0 7 $66,827 6 $34,723 APPLICATIONS DENIED 11 $105,388 58 $52,311 89 $113,101 41 $21,125 0 $0 14 $64,199 38 $38,321 APPLICATIONS WITHDRAWN 10 $99,647 10 $98,170 32 $136,257 3 $48,107 0 $0 5 $68,604 0 $0 FILES CLOSED FOR INCOMPLETENESS 0 $0 0 $0 9 $124,281 2 $34,900 0 $0 1 $92,040 0 $0
Aggregated Statistics For Year 2007(Based on 2 full and 7 partial tracts) A) FHA, FSA/RHS & VA B) Conventional C) Refinancings D) Home Improvement Loans F) Non-occupant Loans on G) Loans On Manufactured Number Average Value Number Average Value Number Average Value Number Average Value Number Average Value Number Average Value
LOANS ORIGINATED 13 $116,625 133 $108,024 188 $99,818 44 $26,999 26 $80,876 7 $44,573 APPLICATIONS APPROVED, NOT ACCEPTED 0 $0 16 $89,954 37 $112,972 9 $37,304 3 $105,040 4 $36,660 APPLICATIONS DENIED 2 $91,015 71 $60,037 182 $113,100 41 $46,344 16 $103,518 45 $35,126 APPLICATIONS WITHDRAWN 2 $103,750 15 $119,037 60 $122,808 3 $15,527 2 $126,755 0 $0 FILES CLOSED FOR INCOMPLETENESS 2 $75,695 8 $120,244 40 $120,680 1 $62,000 3 $94,227 0 $0
Aggregated Statistics For Year 2006(Based on 2 full and 7 partial tracts) A) FHA, FSA/RHS & VA B) Conventional C) Refinancings D) Home Improvement Loans F) Non-occupant Loans on G) Loans On Manufactured Number Average Value Number Average Value Number Average Value Number Average Value Number Average Value Number Average Value
LOANS ORIGINATED 8 $124,689 227 $97,148 250 $98,074 50 $33,724 62 $88,992 4 $44,455 APPLICATIONS APPROVED, NOT ACCEPTED 2 $58,745 38 $86,095 69 $98,129 10 $25,878 7 $74,354 5 $28,676 APPLICATIONS DENIED 3 $80,373 48 $85,901 233 $111,351 59 $44,418 14 $115,039 15 $33,765 APPLICATIONS WITHDRAWN 2 $162,940 26 $121,533 104 $123,202 9 $44,069 6 $88,365 0 $0 FILES CLOSED FOR INCOMPLETENESS 0 $0 6 $100,250 45 $133,812 2 $77,270 1 $98,340 0 $0
Aggregated Statistics For Year 2005(Based on 2 full and 7 partial tracts) A) FHA, FSA/RHS & VA B) Conventional C) Refinancings D) Home Improvement Loans F) Non-occupant Loans on G) Loans On Manufactured Number Average Value Number Average Value Number Average Value Number Average Value Number Average Value Number Average Value
LOANS ORIGINATED 24 $130,150 293 $108,340 336 $107,711 54 $47,555 60 $77,559 3 $58,270 APPLICATIONS APPROVED, NOT ACCEPTED 2 $145,665 42 $103,112 77 $110,473 11 $27,954 7 $79,346 7 $40,267 APPLICATIONS DENIED 4 $132,860 106 $74,952 243 $116,977 63 $32,612 22 $80,682 33 $40,935 APPLICATIONS WITHDRAWN 0 $0 46 $97,757 131 $124,048 18 $111,024 15 $89,467 3 $44,180 FILES CLOSED FOR INCOMPLETENESS 1 $110,610 21 $100,046 94 $126,933 2 $137,975 9 $101,141 0 $0
Aggregated Statistics For Year 2004(Based on 2 full and 7 partial tracts) A) FHA, FSA/RHS & VA B) Conventional C) Refinancings D) Home Improvement Loans E) Loans on Dwellings For 5+ Families F) Non-occupant Loans on G) Loans On Manufactured Number Average Value Number Average Value Number Average Value Number Average Value Number Average Value Number Average Value Number Average Value
LOANS ORIGINATED 30 $119,479 231 $119,243 382 $109,515 52 $46,652 2 $347,845 52 $87,335 8 $44,584 APPLICATIONS APPROVED, NOT ACCEPTED 2 $117,280 27 $87,388 55 $114,693 9 $32,076 0 $0 5 $91,354 12 $40,838 APPLICATIONS DENIED 6 $104,568 69 $65,340 178 $115,486 51 $31,722 4 $215,000 12 $74,469 35 $38,013 APPLICATIONS WITHDRAWN 2 $122,675 35 $115,740 123 $124,078 11 $80,685 0 $0 8 $89,690 1 $12,480 FILES CLOSED FOR INCOMPLETENESS 6 $131,205 8 $81,965 62 $124,306 2 $70,610 0 $0 6 $89,418 0 $0
Aggregated Statistics For Year 2003(Based on 2 full and 7 partial tracts) A) FHA, FSA/RHS & VA B) Conventional C) Refinancings D) Home Improvement Loans F) Non-occupant Loans on Number Average Value Number Average Value Number Average Value Number Average Value Number Average Value
LOANS ORIGINATED 40 $123,420 231 $121,521 723 $104,475 47 $15,238 49 $83,117 APPLICATIONS APPROVED, NOT ACCEPTED 0 $0 22 $118,853 88 $109,324 9 $9,763 8 $87,665 APPLICATIONS DENIED 4 $98,575 58 $82,797 226 $100,069 36 $12,554 15 $75,084 APPLICATIONS WITHDRAWN 6 $139,308 36 $116,266 147 $110,518 3 $36,097 7 $83,657 FILES CLOSED FOR INCOMPLETENESS 3 $118,660 4 $115,770 41 $106,354 2 $19,685 5 $70,924
Aggregated Statistics For Year 2002(Based on 2 full and 7 partial tracts) A) FHA, FSA/RHS & VA B) Conventional C) Refinancings D) Home Improvement Loans F) Non-occupant Loans on Number Average Value Number Average Value Number Average Value Number Average Value Number Average Value
LOANS ORIGINATED 43 $122,696 189 $108,420 524 $100,796 55 $12,220 45 $78,575 APPLICATIONS APPROVED, NOT ACCEPTED 0 $0 18 $77,138 76 $105,074 19 $18,515 7 $79,556 APPLICATIONS DENIED 3 $132,380 46 $51,117 162 $92,648 44 $12,892 8 $63,716 APPLICATIONS WITHDRAWN 4 $124,170 11 $113,126 103 $101,983 3 $16,023 3 $63,193 FILES CLOSED FOR INCOMPLETENESS 0 $0 3 $135,480 40 $108,582 1 $47,960 1 $87,900
Aggregated Statistics For Year 2001(Based on 2 full and 7 partial tracts) A) FHA, FSA/RHS & VA B) Conventional C) Refinancings D) Home Improvement Loans E) Loans on Dwellings For 5+ Families F) Non-occupant Loans on Number Average Value Number Average Value Number Average Value Number Average Value Number Average Value Number Average Value
LOANS ORIGINATED 32 $112,947 151 $104,129 492 $92,607 92 $16,528 1 $428,010 42 $71,110 APPLICATIONS APPROVED, NOT ACCEPTED 1 $143,580 25 $70,738 66 $89,345 12 $26,064 0 $0 4 $61,730 APPLICATIONS DENIED 5 $92,910 83 $47,720 187 $79,238 58 $14,302 0 $0 12 $56,638 APPLICATIONS WITHDRAWN 6 $114,802 16 $68,870 95 $84,392 11 $19,583 0 $0 5 $60,118 FILES CLOSED FOR INCOMPLETENESS 0 $0 2 $41,105 32 $94,345 2 $16,105 0 $0 1 $61,610
Aggregated Statistics For Year 2000(Based on 2 full and 7 partial tracts) A) FHA, FSA/RHS & VA B) Conventional C) Refinancings D) Home Improvement Loans F) Non-occupant Loans on Number Average Value Number Average Value Number Average Value Number Average Value Number Average Value
LOANS ORIGINATED 31 $102,446 162 $106,637 157 $71,909 99 $13,977 18 $143,836 APPLICATIONS APPROVED, NOT ACCEPTED 0 $0 44 $59,738 40 $70,786 30 $13,831 3 $31,773 APPLICATIONS DENIED 3 $99,353 157 $46,283 98 $65,004 54 $20,712 8 $61,625 APPLICATIONS WITHDRAWN 2 $125,550 17 $82,380 37 $72,978 7 $45,080 1 $130,260 FILES CLOSED FOR INCOMPLETENESS 0 $0 2 $60,690 15 $84,117 0 $0 0 $0
Aggregated Statistics For Year 1999(Based on 2 full and 7 partial tracts) A) FHA, FSA/RHS & VA B) Conventional C) Refinancings D) Home Improvement Loans F) Non-occupant Loans on Number Average Value Number Average Value Number Average Value Number Average Value Number Average Value
LOANS ORIGINATED 31 $100,765 175 $84,126 280 $77,391 96 $15,925 36 $58,581 APPLICATIONS APPROVED, NOT ACCEPTED 2 $85,265 52 $44,974 53 $71,906 21 $18,405 5 $55,828 APPLICATIONS DENIED 3 $108,783 161 $39,776 96 $64,210 54 $12,124 7 $51,966 APPLICATIONS WITHDRAWN 3 $98,053 10 $82,804 66 $73,087 8 $54,672 4 $57,910 FILES CLOSED FOR INCOMPLETENESS 1 $55,000 4 $66,960 15 $75,473 0 $0 1 $25,760
Detailed mortgage data for all 9 tracts in Monroe, MI
Private Mortgage Insurance Companies Aggregated Statistics For Year 2009(Based on 1 full and 5 partial tracts) A) Conventional B) Refinancings Number Average Value Number Average Value
LOANS ORIGINATED 3 $90,123 1 $184,790 APPLICATIONS APPROVED, NOT ACCEPTED 2 $148,145 1 $215,460 APPLICATIONS DENIED 2 $136,315 0 $0 APPLICATIONS WITHDRAWN 0 $0 1 $125,370 FILES CLOSED FOR INCOMPLETENESS 0 $0 0 $0
Aggregated Statistics For Year 2008(Based on 2 full and 6 partial tracts) A) Conventional B) Refinancings C) Non-occupant Loans on Number Average Value Number Average Value Number Average Value
LOANS ORIGINATED 18 $120,839 10 $144,954 2 $106,070 APPLICATIONS APPROVED, NOT ACCEPTED 9 $111,954 7 $151,830 0 $0 APPLICATIONS DENIED 2 $153,995 0 $0 0 $0 APPLICATIONS WITHDRAWN 1 $158,010 0 $0 0 $0 FILES CLOSED FOR INCOMPLETENESS 0 $0 2 $146,060 3 $114,233
Aggregated Statistics For Year 2007(Based on 2 full and 7 partial tracts) A) Conventional B) Refinancings C) Non-occupant Loans on Number Average Value Number Average Value Number Average Value
LOANS ORIGINATED 65 $116,922 23 $141,988 4 $91,088 APPLICATIONS APPROVED, NOT ACCEPTED 8 $137,351 10 $127,293 0 $0 APPLICATIONS DENIED 0 $0 3 $119,090 0 $0 APPLICATIONS WITHDRAWN 2 $174,115 4 $138,860 0 $0 FILES CLOSED FOR INCOMPLETENESS 0 $0 0 $0 0 $0
Aggregated Statistics For Year 2006(Based on 2 full and 7 partial tracts) A) Conventional B) Refinancings C) Non-occupant Loans on Number Average Value Number Average Value Number Average Value
LOANS ORIGINATED 52 $122,484 21 $137,058 3 $93,957 APPLICATIONS APPROVED, NOT ACCEPTED 5 $116,060 10 $142,606 3 $91,797 APPLICATIONS DENIED 1 $141,410 2 $183,630 0 $0 APPLICATIONS WITHDRAWN 2 $99,275 1 $178,750 1 $61,980 FILES CLOSED FOR INCOMPLETENESS 0 $0 0 $0 0 $0
Aggregated Statistics For Year 2005(Based on 2 full and 7 partial tracts) A) Conventional B) Refinancings C) Non-occupant Loans on Number Average Value Number Average Value Number Average Value
LOANS ORIGINATED 55 $127,752 25 $127,129 5 $59,556 APPLICATIONS APPROVED, NOT ACCEPTED 7 $108,410 10 $128,383 1 $63,210 APPLICATIONS DENIED 0 $0 0 $0 0 $0 APPLICATIONS WITHDRAWN 4 $132,428 1 $196,840 0 $0 FILES CLOSED FOR INCOMPLETENESS 0 $0 0 $0 0 $0
Aggregated Statistics For Year 2004(Based on 2 full and 7 partial tracts) A) Conventional B) Refinancings C) Non-occupant Loans on Number Average Value Number Average Value Number Average Value
LOANS ORIGINATED 57 $127,785 25 $139,879 5 $81,274 APPLICATIONS APPROVED, NOT ACCEPTED 10 $130,625 12 $135,462 2 $87,495 APPLICATIONS DENIED 0 $0 0 $0 0 $0 APPLICATIONS WITHDRAWN 2 $306,910 3 $159,730 0 $0 FILES CLOSED FOR INCOMPLETENESS 0 $0 0 $0 0 $0
Aggregated Statistics For Year 2003(Based on 2 full and 7 partial tracts) A) Conventional B) Refinancings C) Non-occupant Loans on Number Average Value Number Average Value Number Average Value
LOANS ORIGINATED 75 $125,908 62 $128,621 14 $81,856 APPLICATIONS APPROVED, NOT ACCEPTED 8 $141,250 18 $126,061 0 $0 APPLICATIONS DENIED 1 $97,340 1 $170,170 0 $0 APPLICATIONS WITHDRAWN 1 $122,190 6 $145,798 0 $0 FILES CLOSED FOR INCOMPLETENESS 0 $0 0 $0 0 $0
Aggregated Statistics For Year 2002(Based on 2 full and 7 partial tracts) A) Conventional B) Refinancings C) Non-occupant Loans on Number Average Value Number Average Value Number Average Value
LOANS ORIGINATED 61 $111,888 51 $128,104 5 $80,136 APPLICATIONS APPROVED, NOT ACCEPTED 6 $106,635 10 $142,056 1 $67,940 APPLICATIONS DENIED 1 $182,060 2 $149,455 0 $0 APPLICATIONS WITHDRAWN 0 $0 5 $113,560 0 $0 FILES CLOSED FOR INCOMPLETENESS 0 $0 0 $0 0 $0
Aggregated Statistics For Year 2001(Based on 2 full and 7 partial tracts) A) Conventional B) Refinancings C) Non-occupant Loans on Number Average Value Number Average Value Number Average Value
LOANS ORIGINATED 51 $117,216 48 $122,124 3 $76,770 APPLICATIONS APPROVED, NOT ACCEPTED 8 $109,269 11 $100,305 0 $0 APPLICATIONS DENIED 1 $58,350 2 $91,850 1 $72,190 APPLICATIONS WITHDRAWN 1 $82,830 1 $135,040 0 $0 FILES CLOSED FOR INCOMPLETENESS 0 $0 0 $0 0 $0
Aggregated Statistics For Year 2000(Based on 2 full and 7 partial tracts) A) Conventional B) Refinancings C) Non-occupant Loans on Number Average Value Number Average Value Number Average Value
LOANS ORIGINATED 57 $111,866 8 $102,604 3 $67,020 APPLICATIONS APPROVED, NOT ACCEPTED 5 $116,078 4 $124,520 0 $0 APPLICATIONS DENIED 0 $0 0 $0 0 $0 APPLICATIONS WITHDRAWN 0 $0 1 $71,510 0 $0 FILES CLOSED FOR INCOMPLETENESS 0 $0 0 $0 0 $0
Aggregated Statistics For Year 1999(Based on 2 full and 7 partial tracts) A) Conventional B) Refinancings C) Non-occupant Loans on Number Average Value Number Average Value Number Average Value
LOANS ORIGINATED 59 $108,251 20 $94,601 2 $105,845 APPLICATIONS APPROVED, NOT ACCEPTED 3 $141,797 1 $147,070 0 $0 APPLICATIONS DENIED 2 $100,270 1 $102,620 0 $0 APPLICATIONS WITHDRAWN 0 $0 0 $0 0 $0 FILES CLOSED FOR INCOMPLETENESS 0 $0 0 $0 0 $0
Fire-safe hotels and motels in Monroe, Michigan:
Baymont Inn & Suites, 14774 Laplaisance Rd, Monroe, Michigan 48162 Phone: (734) 384-1600, Fax: (734) 384-1180
Hampton Inn, 1565 N Dixie Hwy, Monroe, Michigan 48162 Phone: (734) 289-5700, Fax: (734) 289-3300
Holiday Inn Express & Suites, 1687 N Dixie Hwy, Monroe, Michigan 48162 Phone: (734) 720-9706
Americas Best Value Inn & Suites, 1885 Welcome Way, Monroe, Michigan 48162 Phone: (734) 289-1080, Fax: (734) 289-2711
Days Inn & Suites, 1900 Welcome Way, Monroe, Michigan 48162 Phone: (734) 289-2330, Fax: (734) 289-3683
All 5 fire-safe hotels and motels in Monroe, Michigan
Most common first names in Monroe, MI among deceased individuals Name Count Lived (average)
Mary 428 79.1 years William 379 72.4 years John 338 74.5 years James 280 69.2 years Robert 257 68.8 years Charles 213 74.6 years George 206 74.1 years Helen 194 79.9 years Margaret 169 79.3 years Joseph 166 74.3 years
Most common last names in Monroe, MI among deceased individuals Last name Count Lived (average)
Smith 137 72.7 years Miller 119 75.7 years Johnson 96 74.4 years Duvall 71 72.6 years Williams 59 73.8 years Moore 58 73.1 years Jones 56 72.4 years Hoffman 55 79.8 years Navarre 54 79.3 years Turner 53 73.8 years
Monroe compared to Michigan state average:
Unemployed percentage significantly below state average. Black race population percentage significantly below state average. Hispanic race population percentage below state average. Median age below state average. Foreign-born population percentage significantly below state average. Length of stay since moving in above state average. House age above state average.
#82 on the list of "Top 101 cities with the largest percentage of people in other nonhousehold living situations (population 1,000+)"
#47 on the list of "Top 101 counties with the largest increase in the number of deaths per 1000 residents 2000-2006 to 2007-2013 (pop. 50,000+)"
#60 on the list of "Top 101 counties with the largest number of people moving out compared to moving in (pop. 50,000+)"
#75 on the list of "Top 101 counties with the lowest ground withdrawal of fresh water for public supply (pop. 50,000+)"
#83 on the list of "Top 101 counties with the lowest number of births per 1000 residents 2007-2013"
Top Patent Applicants
Clinton E. Carey (162)
Robert L. Doubler (16)
Jeffrey Iott (9)
Richard E. Marshall (8)
Thomas E. Heck (6)
Dale Rathbun, Ii (6)
Robert A. Oklejas (6)
Loren John Lohmeyer, Iii (5)
Pratima V. Addepalli (5)
David B. Sutton (5)
Total of 392 patent applications in 2008-2024.

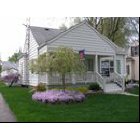


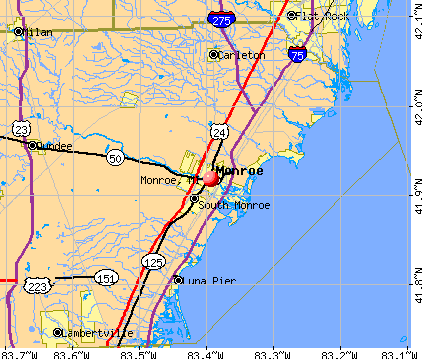


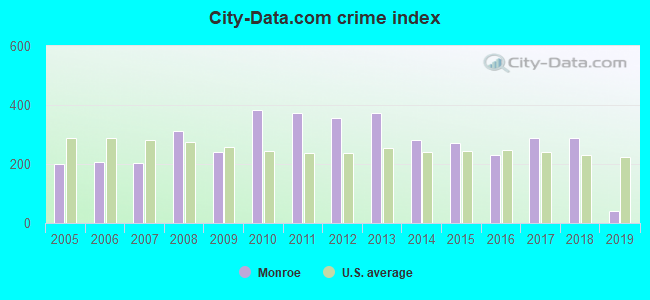
 Recent articles from our blog. Our writers, many of them Ph.D. graduates or candidates, create easy-to-read articles on a wide variety of topics.


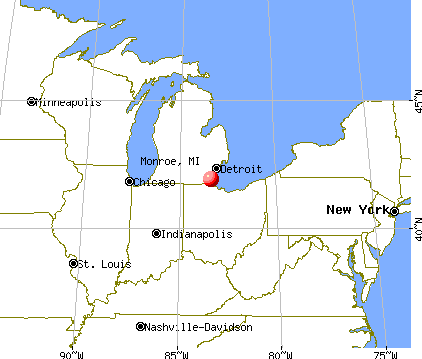
 (19.8 miles
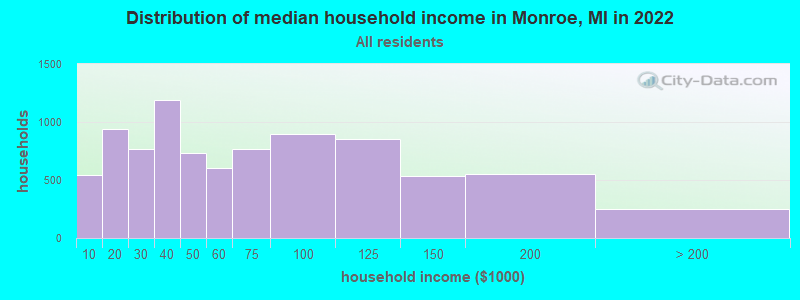
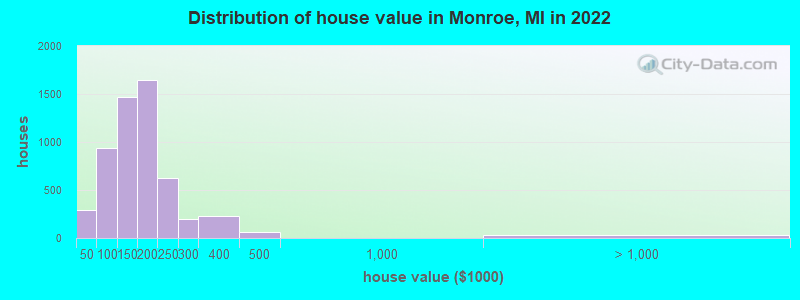
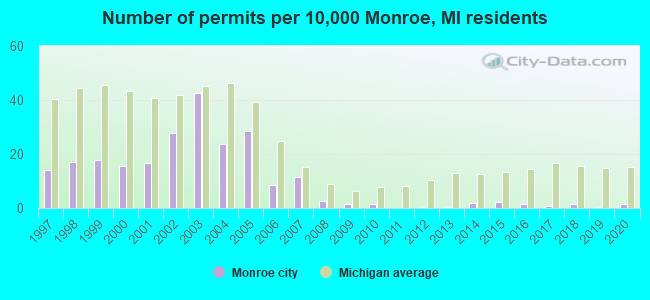
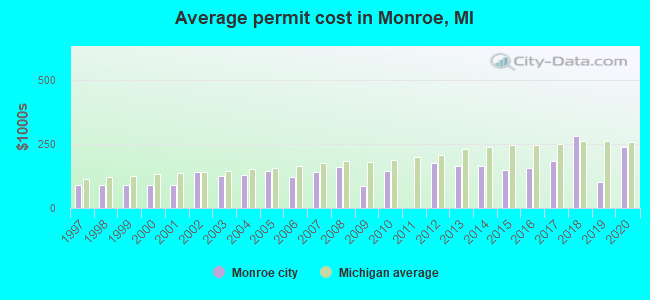
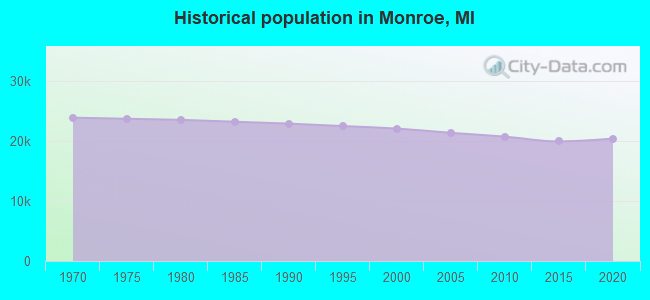
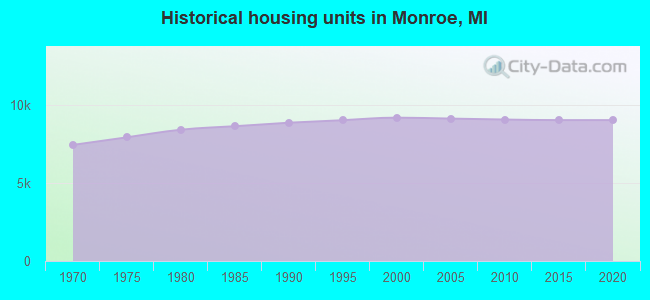
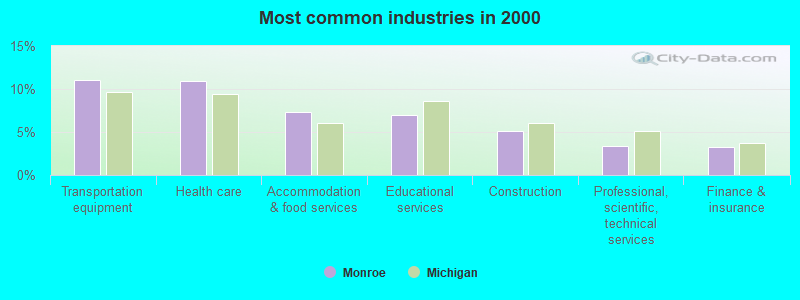
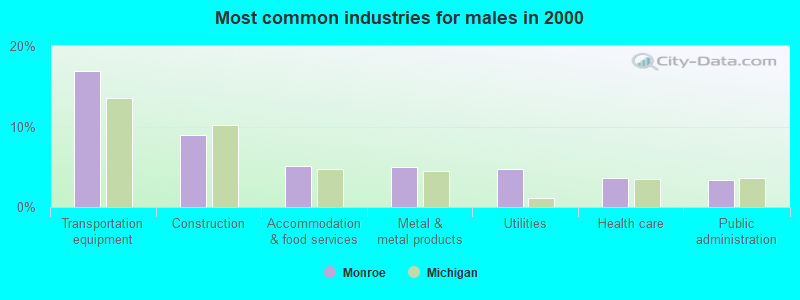
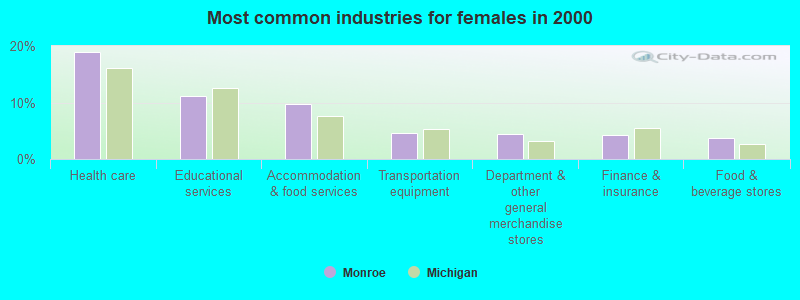
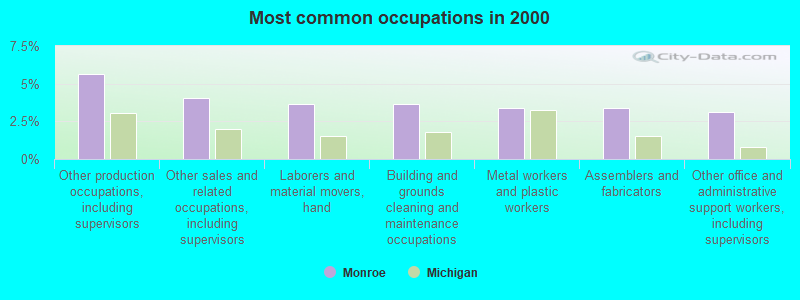
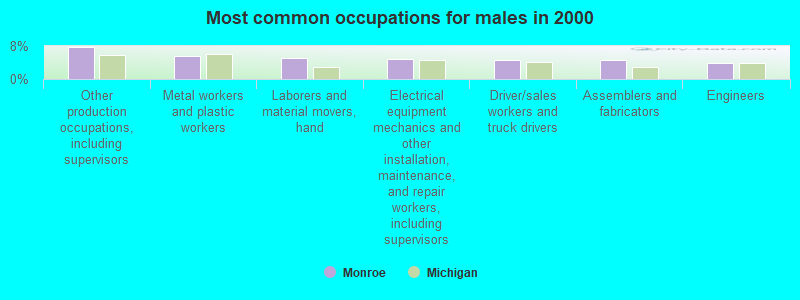
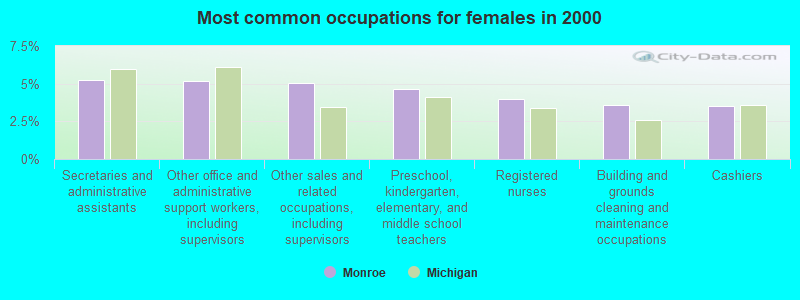
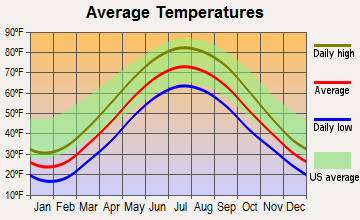
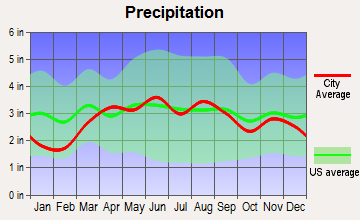
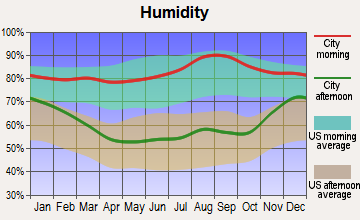
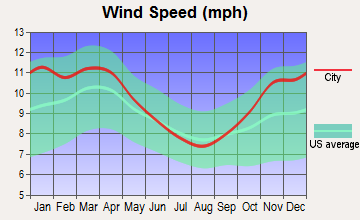
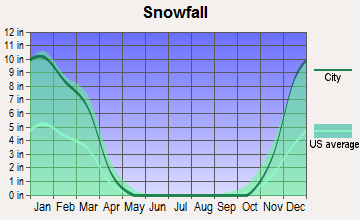
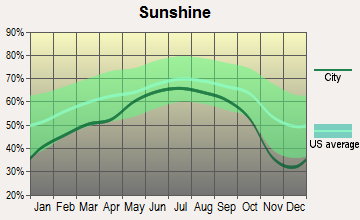
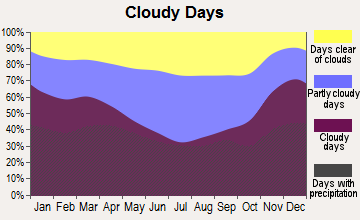
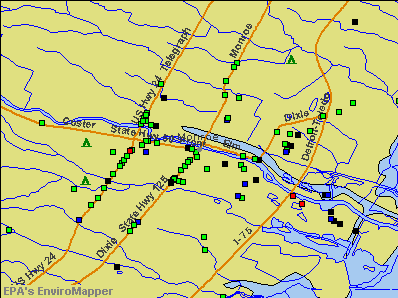

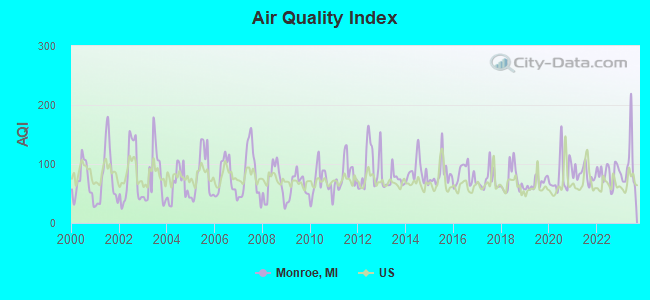
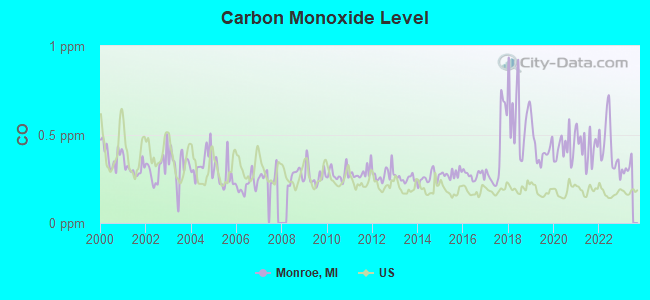
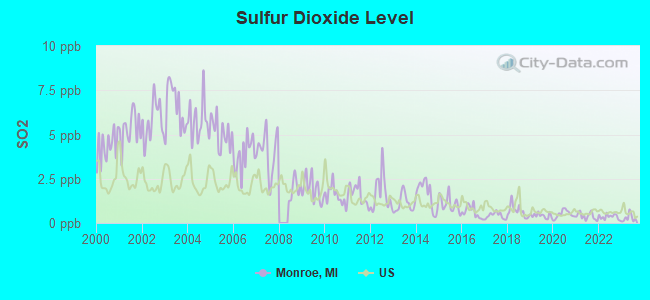
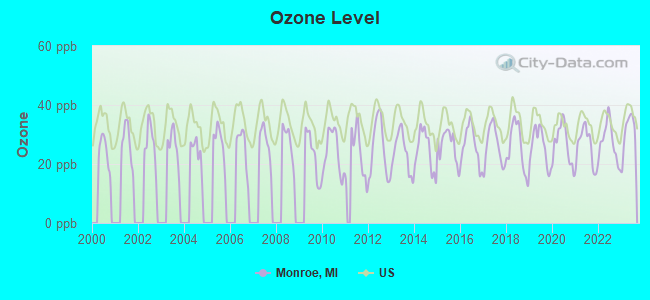
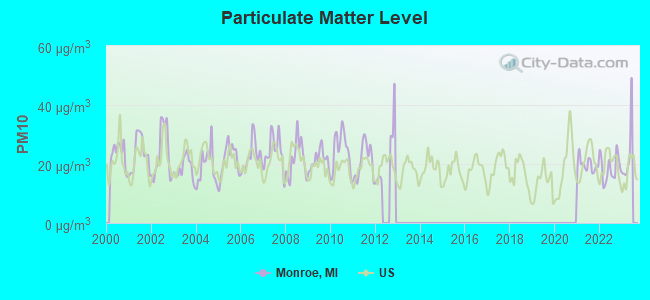
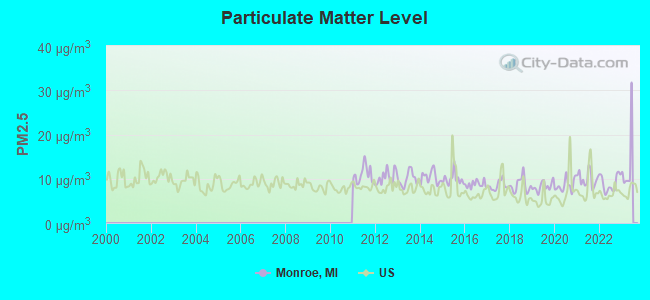
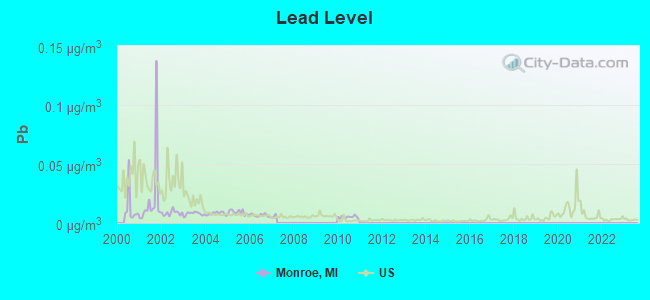

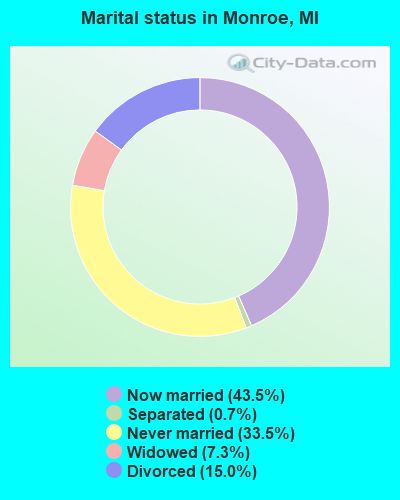
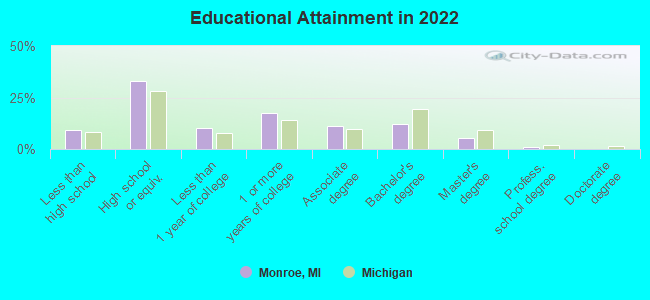
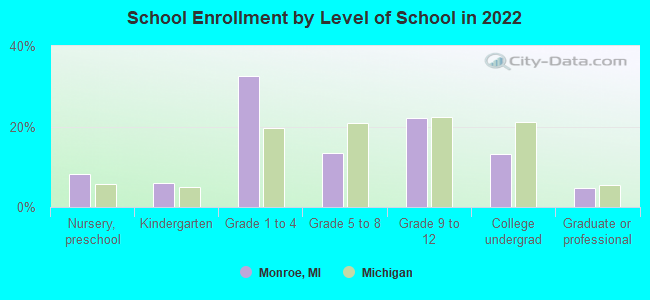
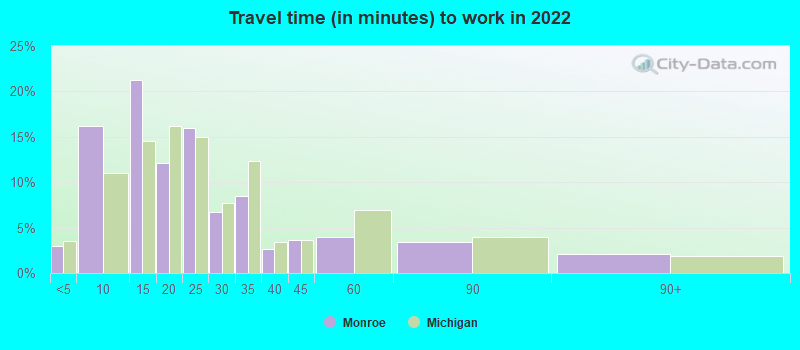
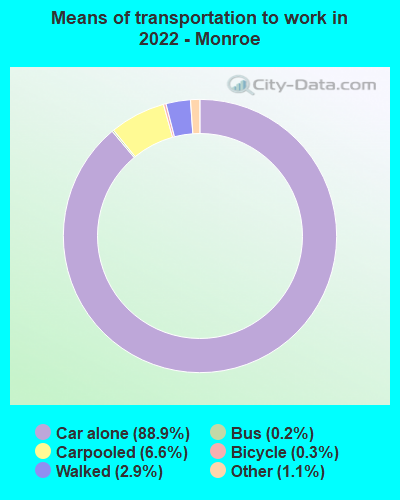
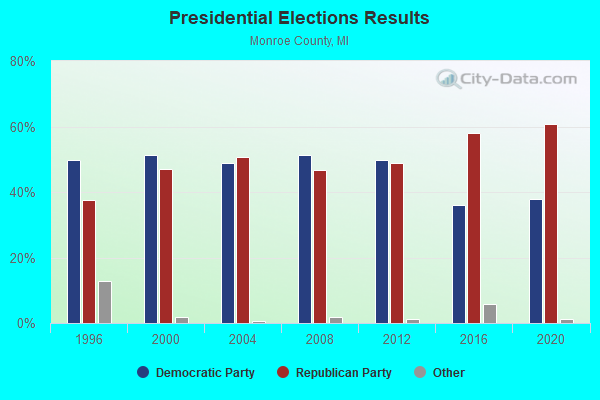

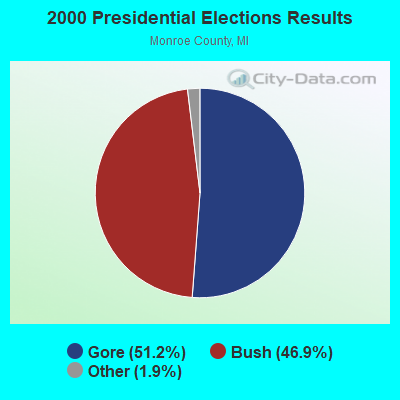
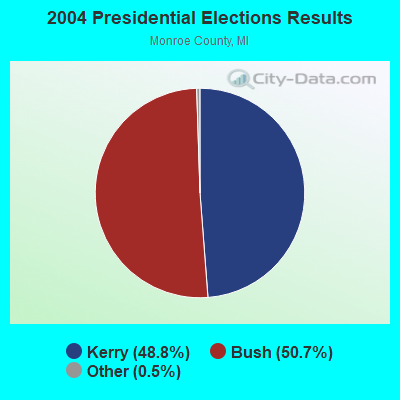
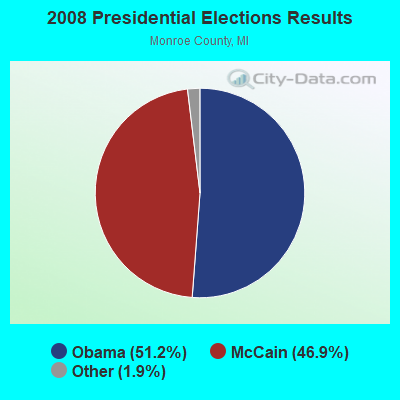

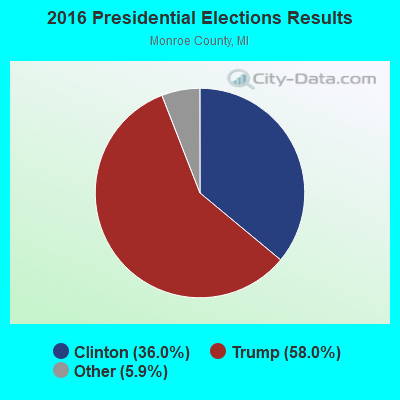
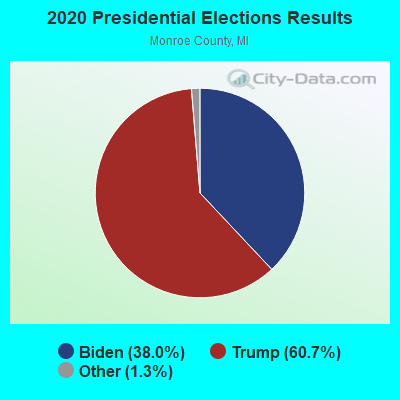
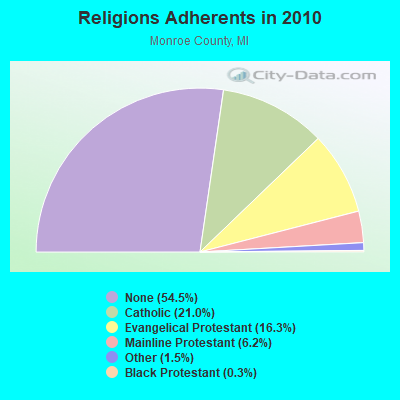
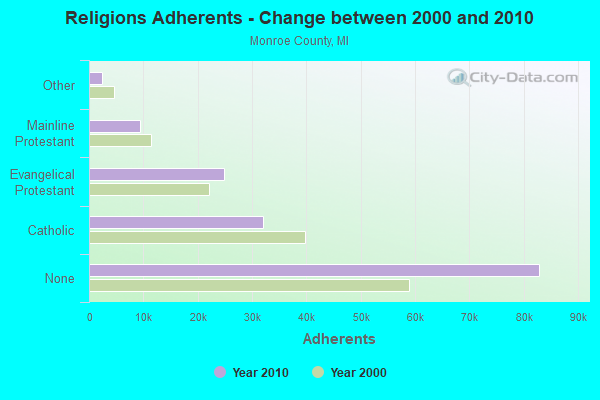
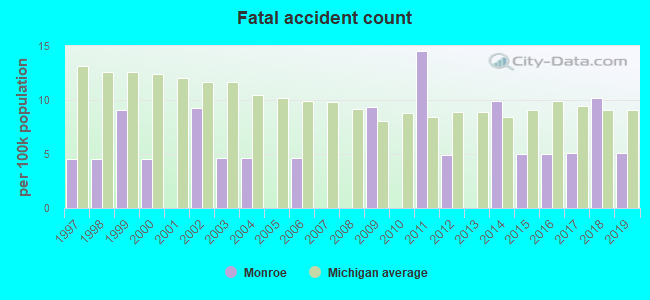
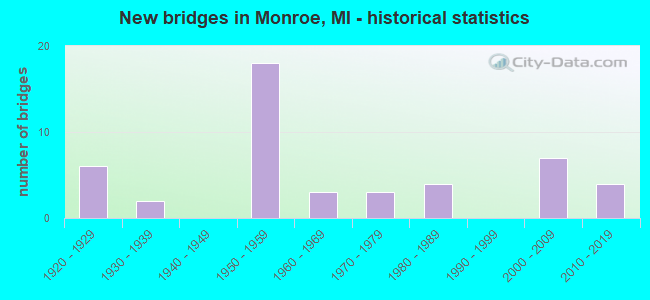
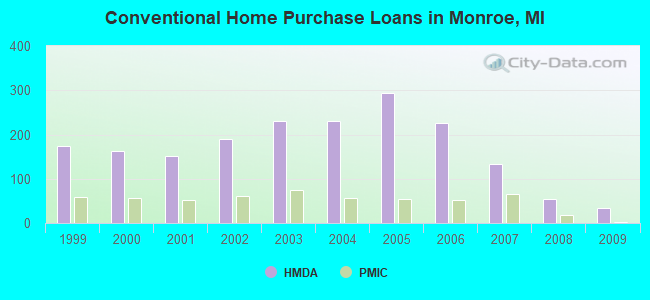
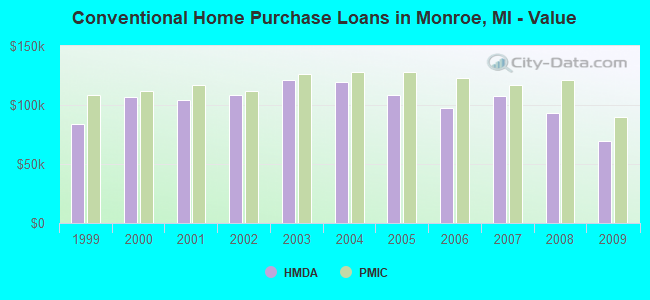
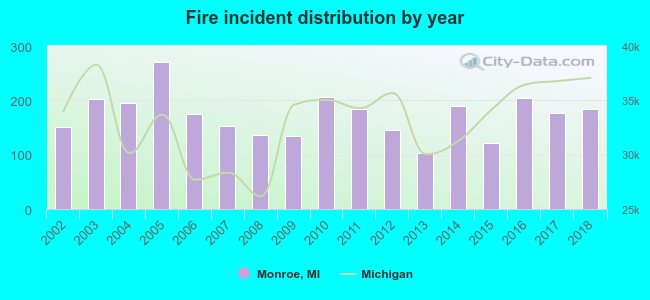 Based on the data from the years 2002 - 2018 the average number of fires per year is 172. The highest number of fire incidents - 270 took place in 2005, and the least - 103 in 2013. The data has a growing trend.
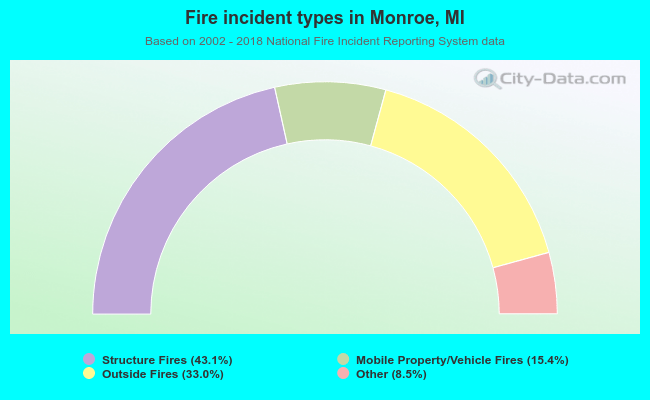 When looking into fire subcategories, the most reports belonged to: Structure Fires (43.1%), and Outside Fires (33.0%).