Roswell, Georgia Submit your own pictures of this city and show them to the world
OSM Map
General Map
Google Map
MSN Map
OSM Map
General Map
Google Map
MSN Map
OSM Map
General Map
Google Map
MSN Map
OSM Map
General Map
Google Map
MSN Map
Please wait while loading the map...
Population in 2022: 92,950 (100% urban, 0% rural). Population change since 2000: +17.2%Males: 43,086 Females: 49,864
March 2022 cost of living index in Roswell: 102.0 (near average, U.S. average is 100) Percentage of residents living in poverty in 2022: 6.4%for White Non-Hispanic residents , 7.9% for Black residents , 15.4% for Hispanic or Latino residents , 7.6% for American Indian residents , 22.1% for other race residents , 8.3% for two or more races residents )
Profiles of local businesses
Business Search - 14 Million verified businesses
Data:
Median household income ($)
Median household income (% change since 2000)
Household income diversity
Ratio of average income to average house value (%)
Ratio of average income to average rent
Median household income ($) - White
Median household income ($) - Black or African American
Median household income ($) - Asian
Median household income ($) - Hispanic or Latino
Median household income ($) - American Indian and Alaska Native
Median household income ($) - Multirace
Median household income ($) - Other Race
Median household income for houses/condos with a mortgage ($)
Median household income for apartments without a mortgage ($)
Races - White alone (%)
Races - White alone (% change since 2000)
Races - Black alone (%)
Races - Black alone (% change since 2000)
Races - American Indian alone (%)
Races - American Indian alone (% change since 2000)
Races - Asian alone (%)
Races - Asian alone (% change since 2000)
Races - Hispanic (%)
Races - Hispanic (% change since 2000)
Races - Native Hawaiian and Other Pacific Islander alone (%)
Races - Native Hawaiian and Other Pacific Islander alone (% change since 2000)
Races - Two or more races (%)
Races - Two or more races (% change since 2000)
Races - Other race alone (%)
Races - Other race alone (% change since 2000)
Racial diversity
Unemployment (%)
Unemployment (% change since 2000)
Unemployment (%) - White
Unemployment (%) - Black or African American
Unemployment (%) - Asian
Unemployment (%) - Hispanic or Latino
Unemployment (%) - American Indian and Alaska Native
Unemployment (%) - Multirace
Unemployment (%) - Other Race
Population density (people per square mile)
Population - Males (%)
Population - Females (%)
Population - Males (%) - White
Population - Males (%) - Black or African American
Population - Males (%) - Asian
Population - Males (%) - Hispanic or Latino
Population - Males (%) - American Indian and Alaska Native
Population - Males (%) - Multirace
Population - Males (%) - Other Race
Population - Females (%) - White
Population - Females (%) - Black or African American
Population - Females (%) - Asian
Population - Females (%) - Hispanic or Latino
Population - Females (%) - American Indian and Alaska Native
Population - Females (%) - Multirace
Population - Females (%) - Other Race
Coronavirus confirmed cases (Apr 27, 2024)
Deaths caused by coronavirus (Apr 27, 2024)
Coronavirus confirmed cases (per 100k population) (Apr 27, 2024)
Deaths caused by coronavirus (per 100k population) (Apr 27, 2024)
Daily increase in number of cases (Apr 27, 2024)
Weekly increase in number of cases (Apr 27, 2024)
Cases doubled (in days) (Apr 27, 2024)
Hospitalized patients (Apr 18, 2022)
Negative test results (Apr 18, 2022)
Total test results (Apr 18, 2022)
COVID Vaccine doses distributed (per 100k population) (Sep 19, 2023)
COVID Vaccine doses administered (per 100k population) (Sep 19, 2023)
COVID Vaccine doses distributed (Sep 19, 2023)
COVID Vaccine doses administered (Sep 19, 2023)
Likely homosexual households (%)
Likely homosexual households (% change since 2000)
Likely homosexual households - Lesbian couples (%)
Likely homosexual households - Lesbian couples (% change since 2000)
Likely homosexual households - Gay men (%)
Likely homosexual households - Gay men (% change since 2000)
Cost of living index
Median gross rent ($)
Median contract rent ($)
Median monthly housing costs ($)
Median house or condo value ($)
Median house or condo value ($ change since 2000)
Mean house or condo value by units in structure - 1, detached ($)
Mean house or condo value by units in structure - 1, attached ($)
Mean house or condo value by units in structure - 2 ($)
Mean house or condo value by units in structure by units in structure - 3 or 4 ($)
Mean house or condo value by units in structure - 5 or more ($)
Mean house or condo value by units in structure - Boat, RV, van, etc. ($)
Mean house or condo value by units in structure - Mobile home ($)
Median house or condo value ($) - White
Median house or condo value ($) - Black or African American
Median house or condo value ($) - Asian
Median house or condo value ($) - Hispanic or Latino
Median house or condo value ($) - American Indian and Alaska Native
Median house or condo value ($) - Multirace
Median house or condo value ($) - Other Race
Median resident age
Resident age diversity
Median resident age - Males
Median resident age - Females
Median resident age - White
Median resident age - Black or African American
Median resident age - Asian
Median resident age - Hispanic or Latino
Median resident age - American Indian and Alaska Native
Median resident age - Multirace
Median resident age - Other Race
Median resident age - Males - White
Median resident age - Males - Black or African American
Median resident age - Males - Asian
Median resident age - Males - Hispanic or Latino
Median resident age - Males - American Indian and Alaska Native
Median resident age - Males - Multirace
Median resident age - Males - Other Race
Median resident age - Females - White
Median resident age - Females - Black or African American
Median resident age - Females - Asian
Median resident age - Females - Hispanic or Latino
Median resident age - Females - American Indian and Alaska Native
Median resident age - Females - Multirace
Median resident age - Females - Other Race
Commute - mean travel time to work (minutes)
Travel time to work - Less than 5 minutes (%)
Travel time to work - Less than 5 minutes (% change since 2000)
Travel time to work - 5 to 9 minutes (%)
Travel time to work - 5 to 9 minutes (% change since 2000)
Travel time to work - 10 to 19 minutes (%)
Travel time to work - 10 to 19 minutes (% change since 2000)
Travel time to work - 20 to 29 minutes (%)
Travel time to work - 20 to 29 minutes (% change since 2000)
Travel time to work - 30 to 39 minutes (%)
Travel time to work - 30 to 39 minutes (% change since 2000)
Travel time to work - 40 to 59 minutes (%)
Travel time to work - 40 to 59 minutes (% change since 2000)
Travel time to work - 60 to 89 minutes (%)
Travel time to work - 60 to 89 minutes (% change since 2000)
Travel time to work - 90 or more minutes (%)
Travel time to work - 90 or more minutes (% change since 2000)
Marital status - Never married (%)
Marital status - Now married (%)
Marital status - Separated (%)
Marital status - Widowed (%)
Marital status - Divorced (%)
Median family income ($)
Median family income (% change since 2000)
Median non-family income ($)
Median non-family income (% change since 2000)
Median per capita income ($)
Median per capita income (% change since 2000)
Median family income ($) - White
Median family income ($) - Black or African American
Median family income ($) - Asian
Median family income ($) - Hispanic or Latino
Median family income ($) - American Indian and Alaska Native
Median family income ($) - Multirace
Median family income ($) - Other Race
Median year house/condo built
Median year apartment built
Year house built - Built 2005 or later (%)
Year house built - Built 2000 to 2004 (%)
Year house built - Built 1990 to 1999 (%)
Year house built - Built 1980 to 1989 (%)
Year house built - Built 1970 to 1979 (%)
Year house built - Built 1960 to 1969 (%)
Year house built - Built 1950 to 1959 (%)
Year house built - Built 1940 to 1949 (%)
Year house built - Built 1939 or earlier (%)
Average household size
Household density (households per square mile)
Average household size - White
Average household size - Black or African American
Average household size - Asian
Average household size - Hispanic or Latino
Average household size - American Indian and Alaska Native
Average household size - Multirace
Average household size - Other Race
Occupied housing units (%)
Vacant housing units (%)
Owner occupied housing units (%)
Renter occupied housing units (%)
Vacancy status - For rent (%)
Vacancy status - For sale only (%)
Vacancy status - Rented or sold, not occupied (%)
Vacancy status - For seasonal, recreational, or occasional use (%)
Vacancy status - For migrant workers (%)
Vacancy status - Other vacant (%)
Residents with income below the poverty level (%)
Residents with income below 50% of the poverty level (%)
Children below poverty level (%)
Poor families by family type - Married-couple family (%)
Poor families by family type - Male, no wife present (%)
Poor families by family type - Female, no husband present (%)
Poverty status for native-born residents (%)
Poverty status for foreign-born residents (%)
Poverty among high school graduates not in families (%)
Poverty among people who did not graduate high school not in families (%)
Residents with income below the poverty level (%) - White
Residents with income below the poverty level (%) - Black or African American
Residents with income below the poverty level (%) - Asian
Residents with income below the poverty level (%) - Hispanic or Latino
Residents with income below the poverty level (%) - American Indian and Alaska Native
Residents with income below the poverty level (%) - Multirace
Residents with income below the poverty level (%) - Other Race
Air pollution - Air Quality Index (AQI)
Air pollution - CO
Air pollution - NO2
Air pollution - SO2
Air pollution - Ozone
Air pollution - PM10
Air pollution - PM25
Air pollution - Pb
Crime - Murders per 100,000 population
Crime - Rapes per 100,000 population
Crime - Robberies per 100,000 population
Crime - Assaults per 100,000 population
Crime - Burglaries per 100,000 population
Crime - Thefts per 100,000 population
Crime - Auto thefts per 100,000 population
Crime - Arson per 100,000 population
Crime - City-data.com crime index
Crime - Violent crime index
Crime - Property crime index
Crime - Murders per 100,000 population (5 year average)
Crime - Rapes per 100,000 population (5 year average)
Crime - Robberies per 100,000 population (5 year average)
Crime - Assaults per 100,000 population (5 year average)
Crime - Burglaries per 100,000 population (5 year average)
Crime - Thefts per 100,000 population (5 year average)
Crime - Auto thefts per 100,000 population (5 year average)
Crime - Arson per 100,000 population (5 year average)
Crime - City-data.com crime index (5 year average)
Crime - Violent crime index (5 year average)
Crime - Property crime index (5 year average)
1996 Presidential Elections Results (%) - Democratic Party (Clinton)
1996 Presidential Elections Results (%) - Republican Party (Dole)
1996 Presidential Elections Results (%) - Other
2000 Presidential Elections Results (%) - Democratic Party (Gore)
2000 Presidential Elections Results (%) - Republican Party (Bush)
2000 Presidential Elections Results (%) - Other
2004 Presidential Elections Results (%) - Democratic Party (Kerry)
2004 Presidential Elections Results (%) - Republican Party (Bush)
2004 Presidential Elections Results (%) - Other
2008 Presidential Elections Results (%) - Democratic Party (Obama)
2008 Presidential Elections Results (%) - Republican Party (McCain)
2008 Presidential Elections Results (%) - Other
2012 Presidential Elections Results (%) - Democratic Party (Obama)
2012 Presidential Elections Results (%) - Republican Party (Romney)
2012 Presidential Elections Results (%) - Other
2016 Presidential Elections Results (%) - Democratic Party (Clinton)
2016 Presidential Elections Results (%) - Republican Party (Trump)
2016 Presidential Elections Results (%) - Other
2020 Presidential Elections Results (%) - Democratic Party (Biden)
2020 Presidential Elections Results (%) - Republican Party (Trump)
2020 Presidential Elections Results (%) - Other
Ancestries Reported - Arab (%)
Ancestries Reported - Czech (%)
Ancestries Reported - Danish (%)
Ancestries Reported - Dutch (%)
Ancestries Reported - English (%)
Ancestries Reported - French (%)
Ancestries Reported - French Canadian (%)
Ancestries Reported - German (%)
Ancestries Reported - Greek (%)
Ancestries Reported - Hungarian (%)
Ancestries Reported - Irish (%)
Ancestries Reported - Italian (%)
Ancestries Reported - Lithuanian (%)
Ancestries Reported - Norwegian (%)
Ancestries Reported - Polish (%)
Ancestries Reported - Portuguese (%)
Ancestries Reported - Russian (%)
Ancestries Reported - Scotch-Irish (%)
Ancestries Reported - Scottish (%)
Ancestries Reported - Slovak (%)
Ancestries Reported - Subsaharan African (%)
Ancestries Reported - Swedish (%)
Ancestries Reported - Swiss (%)
Ancestries Reported - Ukrainian (%)
Ancestries Reported - United States (%)
Ancestries Reported - Welsh (%)
Ancestries Reported - West Indian (%)
Ancestries Reported - Other (%)
Educational Attainment - No schooling completed (%)
Educational Attainment - Less than high school (%)
Educational Attainment - High school or equivalent (%)
Educational Attainment - Less than 1 year of college (%)
Educational Attainment - 1 or more years of college (%)
Educational Attainment - Associate degree (%)
Educational Attainment - Bachelor's degree (%)
Educational Attainment - Master's degree (%)
Educational Attainment - Professional school degree (%)
Educational Attainment - Doctorate degree (%)
School Enrollment - Nursery, preschool (%)
School Enrollment - Kindergarten (%)
School Enrollment - Grade 1 to 4 (%)
School Enrollment - Grade 5 to 8 (%)
School Enrollment - Grade 9 to 12 (%)
School Enrollment - College undergrad (%)
School Enrollment - Graduate or professional (%)
School Enrollment - Not enrolled in school (%)
School enrollment - Public schools (%)
School enrollment - Private schools (%)
School enrollment - Not enrolled (%)
Median number of rooms in houses and condos
Median number of rooms in apartments
Housing units lacking complete plumbing facilities (%)
Housing units lacking complete kitchen facilities (%)
Density of houses
Urban houses (%)
Rural houses (%)
Households with people 60 years and over (%)
Households with people 65 years and over (%)
Households with people 75 years and over (%)
Households with one or more nonrelatives (%)
Households with no nonrelatives (%)
Population in households (%)
Family households (%)
Nonfamily households (%)
Population in families (%)
Family households with own children (%)
Median number of bedrooms in owner occupied houses
Mean number of bedrooms in owner occupied houses
Median number of bedrooms in renter occupied houses
Mean number of bedrooms in renter occupied houses
Median number of vehichles in owner occupied houses
Mean number of vehichles in owner occupied houses
Median number of vehichles in renter occupied houses
Mean number of vehichles in renter occupied houses
Mortgage status - with mortgage (%)
Mortgage status - with second mortgage (%)
Mortgage status - with home equity loan (%)
Mortgage status - with both second mortgage and home equity loan (%)
Mortgage status - without a mortgage (%)
Average family size
Average family size - White
Average family size - Black or African American
Average family size - Asian
Average family size - Hispanic or Latino
Average family size - American Indian and Alaska Native
Average family size - Multirace
Average family size - Other Race
Geographical mobility - Same house 1 year ago (%)
Geographical mobility - Moved within same county (%)
Geographical mobility - Moved from different county within same state (%)
Geographical mobility - Moved from different state (%)
Geographical mobility - Moved from abroad (%)
Place of birth - Born in state of residence (%)
Place of birth - Born in other state (%)
Place of birth - Native, outside of US (%)
Place of birth - Foreign born (%)
Housing units in structures - 1, detached (%)
Housing units in structures - 1, attached (%)
Housing units in structures - 2 (%)
Housing units in structures - 3 or 4 (%)
Housing units in structures - 5 to 9 (%)
Housing units in structures - 10 to 19 (%)
Housing units in structures - 20 to 49 (%)
Housing units in structures - 50 or more (%)
Housing units in structures - Mobile home (%)
Housing units in structures - Boat, RV, van, etc. (%)
House/condo owner moved in on average (years ago)
Renter moved in on average (years ago)
Year householder moved into unit - Moved in 1999 to March 2000 (%)
Year householder moved into unit - Moved in 1995 to 1998 (%)
Year householder moved into unit - Moved in 1990 to 1994 (%)
Year householder moved into unit - Moved in 1980 to 1989 (%)
Year householder moved into unit - Moved in 1970 to 1979 (%)
Year householder moved into unit - Moved in 1969 or earlier (%)
Means of transportation to work - Drove car alone (%)
Means of transportation to work - Carpooled (%)
Means of transportation to work - Public transportation (%)
Means of transportation to work - Bus or trolley bus (%)
Means of transportation to work - Streetcar or trolley car (%)
Means of transportation to work - Subway or elevated (%)
Means of transportation to work - Railroad (%)
Means of transportation to work - Ferryboat (%)
Means of transportation to work - Taxicab (%)
Means of transportation to work - Motorcycle (%)
Means of transportation to work - Bicycle (%)
Means of transportation to work - Walked (%)
Means of transportation to work - Other means (%)
Working at home (%)
Industry diversity
Most Common Industries - Agriculture, forestry, fishing and hunting, and mining (%)
Most Common Industries - Agriculture, forestry, fishing and hunting (%)
Most Common Industries - Mining, quarrying, and oil and gas extraction (%)
Most Common Industries - Construction (%)
Most Common Industries - Manufacturing (%)
Most Common Industries - Wholesale trade (%)
Most Common Industries - Retail trade (%)
Most Common Industries - Transportation and warehousing, and utilities (%)
Most Common Industries - Transportation and warehousing (%)
Most Common Industries - Utilities (%)
Most Common Industries - Information (%)
Most Common Industries - Finance and insurance, and real estate and rental and leasing (%)
Most Common Industries - Finance and insurance (%)
Most Common Industries - Real estate and rental and leasing (%)
Most Common Industries - Professional, scientific, and management, and administrative and waste management services (%)
Most Common Industries - Professional, scientific, and technical services (%)
Most Common Industries - Management of companies and enterprises (%)
Most Common Industries - Administrative and support and waste management services (%)
Most Common Industries - Educational services, and health care and social assistance (%)
Most Common Industries - Educational services (%)
Most Common Industries - Health care and social assistance (%)
Most Common Industries - Arts, entertainment, and recreation, and accommodation and food services (%)
Most Common Industries - Arts, entertainment, and recreation (%)
Most Common Industries - Accommodation and food services (%)
Most Common Industries - Other services, except public administration (%)
Most Common Industries - Public administration (%)
Occupation diversity
Most Common Occupations - Management, business, science, and arts occupations (%)
Most Common Occupations - Management, business, and financial occupations (%)
Most Common Occupations - Management occupations (%)
Most Common Occupations - Business and financial operations occupations (%)
Most Common Occupations - Computer, engineering, and science occupations (%)
Most Common Occupations - Computer and mathematical occupations (%)
Most Common Occupations - Architecture and engineering occupations (%)
Most Common Occupations - Life, physical, and social science occupations (%)
Most Common Occupations - Education, legal, community service, arts, and media occupations (%)
Most Common Occupations - Community and social service occupations (%)
Most Common Occupations - Legal occupations (%)
Most Common Occupations - Education, training, and library occupations (%)
Most Common Occupations - Arts, design, entertainment, sports, and media occupations (%)
Most Common Occupations - Healthcare practitioners and technical occupations (%)
Most Common Occupations - Health diagnosing and treating practitioners and other technical occupations (%)
Most Common Occupations - Health technologists and technicians (%)
Most Common Occupations - Service occupations (%)
Most Common Occupations - Healthcare support occupations (%)
Most Common Occupations - Protective service occupations (%)
Most Common Occupations - Fire fighting and prevention, and other protective service workers including supervisors (%)
Most Common Occupations - Law enforcement workers including supervisors (%)
Most Common Occupations - Food preparation and serving related occupations (%)
Most Common Occupations - Building and grounds cleaning and maintenance occupations (%)
Most Common Occupations - Personal care and service occupations (%)
Most Common Occupations - Sales and office occupations (%)
Most Common Occupations - Sales and related occupations (%)
Most Common Occupations - Office and administrative support occupations (%)
Most Common Occupations - Natural resources, construction, and maintenance occupations (%)
Most Common Occupations - Farming, fishing, and forestry occupations (%)
Most Common Occupations - Construction and extraction occupations (%)
Most Common Occupations - Installation, maintenance, and repair occupations (%)
Most Common Occupations - Production, transportation, and material moving occupations (%)
Most Common Occupations - Production occupations (%)
Most Common Occupations - Transportation occupations (%)
Most Common Occupations - Material moving occupations (%)
People in Group quarters - Institutionalized population (%)
People in Group quarters - Correctional institutions (%)
People in Group quarters - Federal prisons and detention centers (%)
People in Group quarters - Halfway houses (%)
People in Group quarters - Local jails and other confinement facilities (including police lockups) (%)
People in Group quarters - Military disciplinary barracks (%)
People in Group quarters - State prisons (%)
People in Group quarters - Other types of correctional institutions (%)
People in Group quarters - Nursing homes (%)
People in Group quarters - Hospitals/wards, hospices, and schools for the handicapped (%)
People in Group quarters - Hospitals/wards and hospices for chronically ill (%)
People in Group quarters - Hospices or homes for chronically ill (%)
People in Group quarters - Military hospitals or wards for chronically ill (%)
People in Group quarters - Other hospitals or wards for chronically ill (%)
People in Group quarters - Hospitals or wards for drug/alcohol abuse (%)
People in Group quarters - Mental (Psychiatric) hospitals or wards (%)
People in Group quarters - Schools, hospitals, or wards for the mentally retarded (%)
People in Group quarters - Schools, hospitals, or wards for the physically handicapped (%)
People in Group quarters - Institutions for the deaf (%)
People in Group quarters - Institutions for the blind (%)
People in Group quarters - Orthopedic wards and institutions for the physically handicapped (%)
People in Group quarters - Wards in general hospitals for patients who have no usual home elsewhere (%)
People in Group quarters - Wards in military hospitals for patients who have no usual home elsewhere (%)
People in Group quarters - Juvenile institutions (%)
People in Group quarters - Long-term care (%)
People in Group quarters - Homes for abused, dependent, and neglected children (%)
People in Group quarters - Residential treatment centers for emotionally disturbed children (%)
People in Group quarters - Training schools for juvenile delinquents (%)
People in Group quarters - Short-term care, detention or diagnostic centers for delinquent children (%)
People in Group quarters - Type of juvenile institution unknown (%)
People in Group quarters - Noninstitutionalized population (%)
People in Group quarters - College dormitories (includes college quarters off campus) (%)
People in Group quarters - Military quarters (%)
People in Group quarters - On base (%)
People in Group quarters - Barracks, unaccompanied personnel housing (UPH), (Enlisted/Officer), ;and similar group living quarters for military personnel (%)
People in Group quarters - Transient quarters for temporary residents (%)
People in Group quarters - Military ships (%)
People in Group quarters - Group homes (%)
People in Group quarters - Homes or halfway houses for drug/alcohol abuse (%)
People in Group quarters - Homes for the mentally ill (%)
People in Group quarters - Homes for the mentally retarded (%)
People in Group quarters - Homes for the physically handicapped (%)
People in Group quarters - Other group homes (%)
People in Group quarters - Religious group quarters (%)
People in Group quarters - Dormitories (%)
People in Group quarters - Agriculture workers' dormitories on farms (%)
People in Group quarters - Job Corps and vocational training facilities (%)
People in Group quarters - Other workers' dormitories (%)
People in Group quarters - Crews of maritime vessels (%)
People in Group quarters - Other nonhousehold living situations (%)
People in Group quarters - Other noninstitutional group quarters (%)
Residents speaking English at home (%)
Residents speaking English at home - Born in the United States (%)
Residents speaking English at home - Native, born elsewhere (%)
Residents speaking English at home - Foreign born (%)
Residents speaking Spanish at home (%)
Residents speaking Spanish at home - Born in the United States (%)
Residents speaking Spanish at home - Native, born elsewhere (%)
Residents speaking Spanish at home - Foreign born (%)
Residents speaking other language at home (%)
Residents speaking other language at home - Born in the United States (%)
Residents speaking other language at home - Native, born elsewhere (%)
Residents speaking other language at home - Foreign born (%)
Class of Workers - Employee of private company (%)
Class of Workers - Self-employed in own incorporated business (%)
Class of Workers - Private not-for-profit wage and salary workers (%)
Class of Workers - Local government workers (%)
Class of Workers - State government workers (%)
Class of Workers - Federal government workers (%)
Class of Workers - Self-employed workers in own not incorporated business and Unpaid family workers (%)
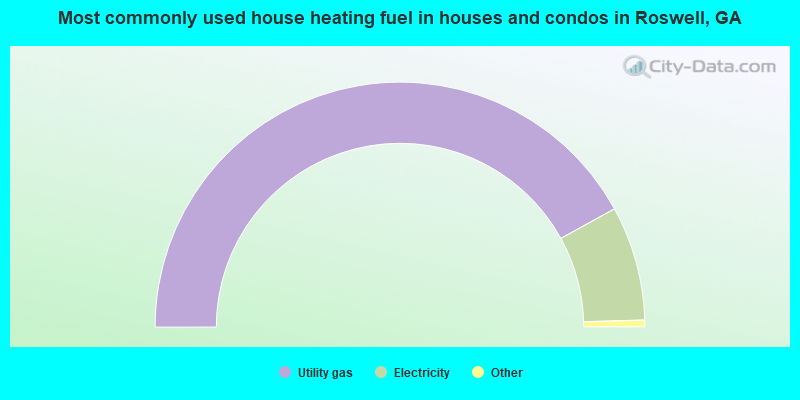
House heating fuel used in houses and condos - Utility gas (%)
House heating fuel used in houses and condos - Bottled, tank, or LP gas (%)
House heating fuel used in houses and condos - Electricity (%)
House heating fuel used in houses and condos - Fuel oil, kerosene, etc. (%)
House heating fuel used in houses and condos - Coal or coke (%)
House heating fuel used in houses and condos - Wood (%)
House heating fuel used in houses and condos - Solar energy (%)
House heating fuel used in houses and condos - Other fuel (%)
House heating fuel used in houses and condos - No fuel used (%)
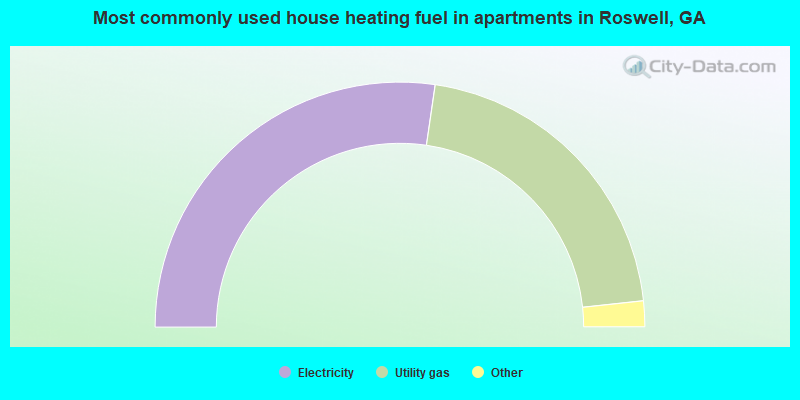
House heating fuel used in apartments - Utility gas (%)
House heating fuel used in apartments - Bottled, tank, or LP gas (%)
House heating fuel used in apartments - Electricity (%)
House heating fuel used in apartments - Fuel oil, kerosene, etc. (%)
House heating fuel used in apartments - Coal or coke (%)
House heating fuel used in apartments - Wood (%)
House heating fuel used in apartments - Solar energy (%)
House heating fuel used in apartments - Other fuel (%)
House heating fuel used in apartments - No fuel used (%)
Armed forces status - In Armed Forces (%)
Armed forces status - Civilian (%)
Armed forces status - Civilian - Veteran (%)
Armed forces status - Civilian - Nonveteran (%)
Fatal accidents locations in years 2005-2021
Fatal accidents locations in 2005
Fatal accidents locations in 2006
Fatal accidents locations in 2007
Fatal accidents locations in 2008
Fatal accidents locations in 2009
Fatal accidents locations in 2010
Fatal accidents locations in 2011
Fatal accidents locations in 2012
Fatal accidents locations in 2013
Fatal accidents locations in 2014
Fatal accidents locations in 2015
Fatal accidents locations in 2016
Fatal accidents locations in 2017
Fatal accidents locations in 2018
Fatal accidents locations in 2019
Fatal accidents locations in 2020
Fatal accidents locations in 2021
Alcohol use - People drinking some alcohol every month (%)
Alcohol use - People not drinking at all (%)
Alcohol use - Average days/month drinking alcohol
Alcohol use - Average drinks/week
Alcohol use - Average days/year people drink much
Audiometry - Average condition of hearing (%)
Audiometry - People that can hear a whisper from across a quiet room (%)
Audiometry - People that can hear normal voice from across a quiet room (%)
Audiometry - Ears ringing, roaring, buzzing (%)
Audiometry - Had a job exposure to loud noise (%)
Audiometry - Had off-work exposure to loud noise (%)
Blood Pressure & Cholesterol - Has high blood pressure (%)
Blood Pressure & Cholesterol - Checking blood pressure at home (%)
Blood Pressure & Cholesterol - Frequently checking blood cholesterol (%)
Blood Pressure & Cholesterol - Has high cholesterol level (%)
Consumer Behavior - Money monthly spent on food at supermarket/grocery store
Consumer Behavior - Money monthly spent on food at other stores
Consumer Behavior - Money monthly spent on eating out
Consumer Behavior - Money monthly spent on carryout/delivered foods
Consumer Behavior - Income spent on food at supermarket/grocery store (%)
Consumer Behavior - Income spent on food at other stores (%)
Consumer Behavior - Income spent on eating out (%)
Consumer Behavior - Income spent on carryout/delivered foods (%)
Current Health Status - General health condition (%)
Current Health Status - Blood donors (%)
Current Health Status - Has blood ever tested for HIV virus (%)
Current Health Status - Left-handed people (%)
Dermatology - People using sunscreen (%)
Diabetes - Diabetics (%)
Diabetes - Had a blood test for high blood sugar (%)
Diabetes - People taking insulin (%)
Diet Behavior & Nutrition - Diet health (%)
Diet Behavior & Nutrition - Milk product consumption (# of products/month)
Diet Behavior & Nutrition - Meals not home prepared (#/week)
Diet Behavior & Nutrition - Meals from fast food or pizza place (#/week)
Diet Behavior & Nutrition - Ready-to-eat foods (#/month)
Diet Behavior & Nutrition - Frozen meals/pizza (#/month)
Drug Use - People that ever used marijuana or hashish (%)
Drug Use - Ever used hard drugs (%)
Drug Use - Ever used any form of cocaine (%)
Drug Use - Ever used heroin (%)
Drug Use - Ever used methamphetamine (%)
Health Insurance - People covered by health insurance (%)
Kidney Conditions-Urology - Avg. # of times urinating at night
Medical Conditions - People with asthma (%)
Medical Conditions - People with anemia (%)
Medical Conditions - People with psoriasis (%)
Medical Conditions - People with overweight (%)
Medical Conditions - Elderly people having difficulties in thinking or remembering (%)
Medical Conditions - People who ever received blood transfusion (%)
Medical Conditions - People having trouble seeing even with glass/contacts (%)
Medical Conditions - People with arthritis (%)
Medical Conditions - People with gout (%)
Medical Conditions - People with congestive heart failure (%)
Medical Conditions - People with coronary heart disease (%)
Medical Conditions - People with angina pectoris (%)
Medical Conditions - People who ever had heart attack (%)
Medical Conditions - People who ever had stroke (%)
Medical Conditions - People with emphysema (%)
Medical Conditions - People with thyroid problem (%)
Medical Conditions - People with chronic bronchitis (%)
Medical Conditions - People with any liver condition (%)
Medical Conditions - People who ever had cancer or malignancy (%)
Mental Health - People who have little interest in doing things (%)
Mental Health - People feeling down, depressed, or hopeless (%)
Mental Health - People who have trouble sleeping or sleeping too much (%)
Mental Health - People feeling tired or having little energy (%)
Mental Health - People with poor appetite or overeating (%)
Mental Health - People feeling bad about themself (%)
Mental Health - People who have trouble concentrating on things (%)
Mental Health - People moving or speaking slowly or too fast (%)
Mental Health - People having thoughts they would be better off dead (%)
Oral Health - Average years since last visit a dentist
Oral Health - People embarrassed because of mouth (%)
Oral Health - People with gum disease (%)
Oral Health - General health of teeth and gums (%)
Oral Health - Average days a week using dental floss/device
Oral Health - Average days a week using mouthwash for dental problem
Oral Health - Average number of teeth
Pesticide Use - Households using pesticides to control insects (%)
Pesticide Use - Households using pesticides to kill weeds (%)
Physical Activity - People doing vigorous-intensity work activities (%)
Physical Activity - People doing moderate-intensity work activities (%)
Physical Activity - People walking or bicycling (%)
Physical Activity - People doing vigorous-intensity recreational activities (%)
Physical Activity - People doing moderate-intensity recreational activities (%)
Physical Activity - Average hours a day doing sedentary activities
Physical Activity - Average hours a day watching TV or videos
Physical Activity - Average hours a day using computer
Physical Functioning - People having limitations keeping them from working (%)
Physical Functioning - People limited in amount of work they can do (%)
Physical Functioning - People that need special equipment to walk (%)
Physical Functioning - People experiencing confusion/memory problems (%)
Physical Functioning - People requiring special healthcare equipment (%)
Prescription Medications - Average number of prescription medicines taking
Preventive Aspirin Use - Adults 40+ taking low-dose aspirin (%)
Reproductive Health - Vaginal deliveries (%)
Reproductive Health - Cesarean deliveries (%)
Reproductive Health - Deliveries resulted in a live birth (%)
Reproductive Health - Pregnancies resulted in a delivery (%)
Reproductive Health - Women breastfeeding newborns (%)
Reproductive Health - Women that had a hysterectomy (%)
Reproductive Health - Women that had both ovaries removed (%)
Reproductive Health - Women that have ever taken birth control pills (%)
Reproductive Health - Women taking birth control pills (%)
Reproductive Health - Women that have ever used Depo-Provera or injectables (%)
Reproductive Health - Women that have ever used female hormones (%)
Sexual Behavior - People 18+ that ever had sex (vaginal, anal, or oral) (%)
Sexual Behavior - Males 18+ that ever had vaginal sex with a woman (%)
Sexual Behavior - Males 18+ that ever performed oral sex on a woman (%)
Sexual Behavior - Males 18+ that ever had anal sex with a woman (%)
Sexual Behavior - Males 18+ that ever had any sex with a man (%)
Sexual Behavior - Females 18+ that ever had vaginal sex with a man (%)
Sexual Behavior - Females 18+ that ever performed oral sex on a man (%)
Sexual Behavior - Females 18+ that ever had anal sex with a man (%)
Sexual Behavior - Females 18+ that ever had any kind of sex with a woman (%)
Sexual Behavior - Average age people first had sex
Sexual Behavior - Average number of female sex partners in lifetime (males 18+)
Sexual Behavior - Average number of female vaginal sex partners in lifetime (males 18+)
Sexual Behavior - Average age people first performed oral sex on a woman (18+)
Sexual Behavior - Average number of woman performed oral sex on in lifetime (18+)
Sexual Behavior - Average number of male sex partners in lifetime (males 18+)
Sexual Behavior - Average number of male anal sex partners in lifetime (males 18+)
Sexual Behavior - Average age people first performed oral sex on a man (18+)
Sexual Behavior - Average number of male oral sex partners in lifetime (18+)
Sexual Behavior - People using protection when performing oral sex (%)
Sexual Behavior - Average number of times people have vaginal or anal sex a year
Sexual Behavior - People having sex without condom (%)
Sexual Behavior - Average number of male sex partners in lifetime (females 18+)
Sexual Behavior - Average number of male vaginal sex partners in lifetime (females 18+)
Sexual Behavior - Average number of female sex partners in lifetime (females 18+)
Sexual Behavior - Circumcised males 18+ (%)
Sleep Disorders - Average hours sleeping at night
Sleep Disorders - People that has trouble sleeping (%)
Smoking-Cigarette Use - People smoking cigarettes (%)
Taste & Smell - People 40+ having problems with smell (%)
Taste & Smell - People 40+ having problems with taste (%)
Taste & Smell - People 40+ that ever had wisdom teeth removed (%)
Taste & Smell - People 40+ that ever had tonsils teeth removed (%)
Taste & Smell - People 40+ that ever had a loss of consciousness because of a head injury (%)
Taste & Smell - People 40+ that ever had a broken nose or other serious injury to face or skull (%)
Taste & Smell - People 40+ that ever had two or more sinus infections (%)
Weight - Average height (inches)
Weight - Average weight (pounds)
Weight - Average BMI
Weight - People that are obese (%)
Weight - People that ever were obese (%)
Weight - People trying to lose weight (%)
According to our research of Georgia and other state lists, there were 42 registered sex offenders living in Roswell, Georgia as of April 27, 2024 . The ratio of all residents to sex offenders in Roswell is 2,297 to 1.The ratio of registered sex offenders to all residents in this city is much lower than the state average.
The City-Data.com crime index weighs serious crimes and violent crimes more heavily. Higher means more crime, U.S. average is 246.1. It adjusts for the number of visitors and daily workers commuting into cities.
- means the value is smaller than the state average.
- means the value is about the same as the state average.
- means the value is bigger than the state average.
Crime rate in Roswell detailed stats: murders, rapes, robberies, assaults, burglaries, thefts, arson Officers per 1,000 residents here:
1.57Georgia average:
2.45
Latest news from Roswell, GA collected exclusively by city-data.com from local newspapers, TV, and radio stations
Ancestries: American (10.8%), English (10.0%), German (5.4%), Irish (4.4%), European (3.8%), Italian (3.5%).
Current Local Time:
Land area: 38.0 square miles.
Population density: 2,445 people per square mile (low).
18,696 residents are foreign born (10.4% Latin America , 4.4% Asia ).
This city:
19.9%Georgia:
10.4%
Median real estate property taxes paid for housing units with mortgages in 2022: $3,985 (0.8%)Median real estate property taxes paid for housing units with no mortgage in 2022: $4,166 (0.8%)
Nearest city with pop. 200,000+: Atlanta, GA
Nearest city with pop. 1,000,000+: Chicago, IL
Nearest cities:
Latitude: 34.03 N, Longitude: 84.34 W
Daytime population change due to commuting: +2,771 (+3.0%)Workers who live and work in this city: 26,428 (52.9%)
Property values in Roswell, GA
Roswell tourist attractions:
Single-family new house construction building permits:
2022: 123 buildings , average cost: $582,3002021: 199 buildings , average cost: $467,9002020: 265 buildings , average cost: $380,1002019: 245 buildings , average cost: $397,7002018: 209 buildings , average cost: $339,9002017: 244 buildings , average cost: $348,7002016: 287 buildings , average cost: $382,0002015: 258 buildings , average cost: $380,6002014: 172 buildings , average cost: $413,4002013: 138 buildings , average cost: $259,7002012: 148 buildings , average cost: $262,7002011: 128 buildings , average cost: $309,4002010: 60 buildings , average cost: $268,5002009: 48 buildings , average cost: $296,5002008: 91 buildings , average cost: $288,4002007: 201 buildings , average cost: $384,2002006: 289 buildings , average cost: $259,3002005: 249 buildings , average cost: $274,5002004: 345 buildings , average cost: $186,5002003: 459 buildings , average cost: $163,5002002: 269 buildings , average cost: $186,0002001: 426 buildings , average cost: $166,4002000: 382 buildings , average cost: $184,6001999: 307 buildings , average cost: $156,5001998: 329 buildings , average cost: $138,2001997: 347 buildings , average cost: $134,200Unemployment in December 2023:
Population change in the 1990s: +30,459 (+62.3%).
Tornado activity:
Roswell-area historical tornado activity is slightly above Georgia state average. It is 60% greater than the overall U.S. average.
On 11/22/1992, a category F4 (max. wind speeds 207-260 mph) tornado 10.6 miles away from the Roswell city center injured 46 people and caused between $5,000,000 and $50,000,000 in damages.
On 4/3/1974, a category F4 tornado 23.3 miles away from the city center killed 6 people and injured 30 people and caused between $500,000 and $5,000,000 in damages.
Earthquake activity:
Roswell-area historical earthquake activity is significantly above Georgia state average. It is 59% greater than the overall U.S. average. On 4/29/2003 at 08:59:39, a magnitude 4.9 (4.4 MB, 4.6 MW, 4.9 LG, Class: Light, Intensity: IV - V) earthquake occurred 80.1 miles away from Roswell center On 8/2/1974 at 08:52:09, a magnitude 4.9 (4.3 MB, 4.9 LG) earthquake occurred 107.1 miles away from the city center On 4/29/2003 at 08:59:39, a magnitude 4.6 (4.6 MW, Depth: 12.3 mi) earthquake occurred 80.1 miles away from Roswell center On 11/30/1973 at 07:48:41, a magnitude 4.7 (4.7 MB, 4.6 ML) earthquake occurred 124.0 miles away from the city center On 1/18/1999 at 07:00:53, a magnitude 4.8 (4.8 MB, 4.0 LG, Depth: 0.6 mi) earthquake occurred 173.0 miles away from Roswell center On 12/12/2018 at 09:14:43, a magnitude 4.4 (4.4 MW, Depth: 4.9 mi) earthquake occurred 111.4 miles away from the city center Magnitude types: regional Lg-wave magnitude (LG), body-wave magnitude (MB), local magnitude (ML), moment magnitude (MW) Natural disasters: The number of natural disasters in Fulton County (15) is near the US average (15).Major Disasters (Presidential) Declared: 10Emergencies Declared: 4Tornadoes: 5, Floods: 4, Storms: 4, Winter Storms: 4, Hurricanes: 3, Heavy Rains: 2, Drought: 1, Snowfall: 1, Tropical Storm: 1, Wind: 1, Other: 1 (Note: some incidents may be assigned to more than one category). Main business address for: WITNESS SYSTEMS INC SERVICES-PREPACKAGED SOFTWARE ).
Hospitals and medical centers in Roswell: NORTH FULTON HOSPITAL (Proprietary, 3000 HOSPITAL BOULEVARD) GREAT OAKS NH (1109 GREEN DR)
ROSWELL NURSING AND REHAB CENTER (1109 GREEN STREET)
DIALYSIS AMERICA INC ALPHARETTA DIALYSIS CENTER (1260 UPPER HEMBREE ROAD)
NORTH FULTON DIALYSIS (1250 NORTH MEADOW PKWY)
RENAL CARE PARTNERS OF ROSWELL (11660 ALPHARETTA HWY, SUITE 650)
GUARDIAN HOME CARE, LLC (11660 ALPHARETTA HWY, SUITE 440)
Heliports located in Roswell: Amtrak station near Roswell: 17 miles: ATLANTA (1688 PEACHTREE ST. NW) Services: ticket office, partially wheelchair accessible, enclosed waiting area, public restrooms, public payphones, vending machines, paid short-term parking, paid long-term parking, taxi stand, public transit connection.
College/University in Roswell: Paul Mitchell the School-Esani Full-time enrollment: 277; Location: 1003 Mansell Rd; Private, for-profit; Website: www.esani.com)
Colleges/universities with over 2000 students nearest to Roswell:
The Art Institute of Atlanta (about 7 miles; Atlanta, GA ; Full-time enrollment: 3,140)
Strayer University-Georgia (about 12 miles; Atlanta, GA ; FT enrollment: 4,447)
Southern Polytechnic State University (about 13 miles; Marietta, GA ; FT enrollment: 5,258)
Kennesaw State University (about 14 miles; Kennesaw, GA ; FT enrollment: 21,215)
Chattahoochee Technical College (about 14 miles; Marietta, GA ; FT enrollment: 8,173)
Emory University (about 17 miles; Atlanta, GA ; FT enrollment: 14,382)
Gwinnett Technical College (about 17 miles; Lawrenceville, GA ; FT enrollment: 5,138)
Public high schools in Roswell:
Private high schools in Roswell: BLESSED TRINITY CATHOLIC HIGH SCHOOL Students: 968, Location: 11320 WOODSTOCK RD, Grades: 9-12)
ST FRANCIS DAY SCHOOL Students: 690, Location: 9375 WILLEO RD, Grades: KG-12)
THE COTTAGE SCHOOL Students: 128, Location: 700 GRIMES BRIDGE RD, Grades: 6-12)
EATON ACADEMY Students: 112, Location: 1000 OLD ROSWELL LAKES PKWY STE 100, Grades: 1-12)CHRYSALIS EXPERIENTIAL ACADEMY Students: 49, Location: 10 MANSELL CT E STE 500, Grades: 6-12)
Biggest public elementary/middle schools in Roswell: SWEET APPLE ELEMENTARY SCHOOL Students: 915, Location: 12025 ETRIS RD, Grades: PK-5)ELKINS POINTE MIDDLE SCHOOL Students: 905, Location: 11290 ELKINS RD, Grades: 6-8)NORTHWOOD ELEMENTARY SCHOOL Students: 892, Location: 10200 WOOTEN RD, Grades: PK-5)MIMOSA ELEMENTARY SCHOOL Students: 863, Location: 1550 WARSAW RD, Grades: PK-5)ROSWELL NORTH ELEMENTARY SCHOOL Students: 861, Location: 10525 WOODSTOCK RD, Grades: PK-5)CRABAPPLE MIDDLE SCHOOL Students: 855, Location: 10700 CRABAPPLE RD, Grades: 6-8)MOUNTAIN PARK ELEMENTARY SCHOOL Students: 842, Location: 11895 MOUNTAIN PARK RD, Grades: PK-5)HEMBREE SPRINGS ELEMENTARY SCHOOL Students: 829, Location: 815 HEMBREE RD, Grades: PK-5)RIVER EVES ELEMENTARY SCHOOL Students: 741, Location: 9000 EVES RD, Grades: PK-5)HILLSIDE ELEMENTARY SCHOOL Students: 726, Location: 9250 SCOTT RD, Grades: PK-5)Private elementary/middle schools in Roswell: QUEEN OF ANGELS CATHOLIC SCHOOL Students: 504, Location: 11340 WOODSTOCK RD, Grades: KG-8)
HIGH MEADOWS SCHOOL Students: 382, Location: 1055 WILLEO RD, Grades: PK-8)
THE ATLANTA ACADEMY Students: 222, Location: 2000 HOLCOMB WOODS PKWY, Grades: PK-8)
THE SWIFT SCHOOL Students: 166, Location: 300 GRIMES BRIDGE RD, Grades: 1-7)
VILLAGE MONTESSORI SCHOOL Students: 125, Location: 1610 WOODSTOCK RD, Grades: PK-6)
ILM ACADEMY Students: 91, Location: 11660 ALPHARETTA HWY STE 155, Grades: PK-4)
See full list of schools located in Roswell User-submitted facts and corrections:
AMANA ACADEMY PUBLIC CHARTER SCHOOL (Students: 200; Location: 1565 HOLCOMB BRIDGE ROAD; Grades: K - 08)
AMANA ACADEMY PUBLIC CHARTER SCHOOL (Students: 200; Location: 1565 HOLCOMB BRIDGE ROAD; Grades: K - 08)
Georgia State University near the center of Atlanta should be included amongst Colleges/Universites
added by JJC
Fellowship Christian Schools needs to be added to your high school list. They offer grades K - 12th at 480 W. Crossville Rd., 30075. The high school's number is 770-993-1650.
Notable locations in Roswell: (A) , Brookfield West Golf Course (B) , Horseshoe Bend Golf Course (C) , Willow Springs Country Club (D) , Crossings at Roswell (E) , Roswell Training Facility (F) , Roswell Fire Department Station 5 (G) , Roswell Fire Department Station 4 (H) , Roswell Fire Department Station 2 (I) , Roswell Fire Department Station 3 (J) , Roswell Jail (K) , Roswell Police Station (L) , Roswell Cultural Arts Center (M) , Roswell City Hall (N) , Fulton County Library - Roswell Branch (O) , Roswell Fire Department Station 1 (P) , Fire Station Number 4 (Q) , Roswell Fire Department Headquarters (R) . Display/hide their locations on the map
Shopping Centers: (1) , Crossville Village Shopping Center (2) , Grimes Square Shopping Center (3) , Holcomb Bridge Crossing Shopping Center (4) , Holcomb Place Shopping Center (5) , Holcomb Woods Shopping Center (6) , Kings Creek Shopping Center (7) , Midtown Plaza Shopping Center (8) , Northbrook Shopping Center (9) . Display/hide their locations on the map
Main business address in Roswell: (A) . Display/hide its location on the map
Churches in Roswell include: (A) , Christ United Methodist Church (B) , Roswell Church of Christ (C) , Fellowship Bible Church (D) , Northside Church of Christ (E) , Congregation Beth Hallel (F) , North United Methodist Church (G) , First Church of Christ (H) , Northside Baptist Church (I) . Display/hide their locations on the map
Cemeteries: (1) , Founder Cemetery (2) , Lebanon Cemetery (3) , Pleasant Hill Cemetery (4) . Display/hide their locations on the map
Lakes and reservoirs: (A) , Martin Lake (B) , Lake Arrida (C) , Kings Road Lake (D) , Lake Charles (E) , Pine Grove Road Lake (F) , Horse Shoe Bend Lake (G) , Horse Shoe Bend Lake South (H) . Display/hide their locations on the map
Streams, rivers, and creeks: (A) , Seven Branch (B) , Crooked Creek (C) , Big Creek (D) . Display/hide their locations on the map
Parks in Roswell include: (1) , City Square Park (2) , Roswell Historic District (3) , Waller Park (4) , Woodstock Park (5) , Centennial High School Football Stadium (6) . Display/hide their locations on the map
Tourist attractions: (1) , Fulton County Government - Parks & Recreation Government Ctr- Recreation Facilities & Serv (Nature Centers; 9135 Willeo Road) (2) , Chattahoochee Nature Center (Nature Centers; 9135 Willeo Road) (3) , National Park Service (Recreation Areas; 227 South Atlanta Street) (4) , Cover Ups (Amusement & Theme Parks; 3000 Northfield Place) (5) , Andretti Speed Laboratory (Amusement & Theme Parks; 11000 Alpharetta Highway) (6) , Game Exchange Southeast Inc (Arcades & Amusements; Roswell) (7) , Casino Tours Limited (Tours & Charters; 625 Colonial Park Drive Suite 201) (8) . Display/hide their approximate locations on the map
Hotels: (1) , Brookwood Inn - Roswell (9995 Old Dogwood Rd) (2) , Four Seasons of Roswell Antiques (352 South Atlanta Street) (3) , Comfort Suites (3000 Mansell Road) (4) , Apartments Home (281 South Atlanta Street) (5) . Display/hide their approximate locations on the map
Birthplace of: Chad Fortune - Professional wrestler, Jeff Bower (American football) - Football player and coach, Jermaine Phillips - 2005 NFL player (Tampa Bay Buccaneers, born : Mar 27, 1979), Tyler Flowers - Baseball player, Alex Voss - Baseball player, Chris Reis - Football player, Evan Brock - College basketball player (Alabama Crimson Tide), Isaac Jones - College basketball player (Char. Southern Buccaneers), James Pattman Jr. - College basketball player (Florida A&M Rattlers).
Fulton County has a predicted average indoor radon screening level greater than 4 pCi/L (pico curies per liter) - Highest Potential Drinking water stations with addresses in Roswell and their reported violations in the past:
ASPEN WOODS LAKE (Population served: 364, Groundwater):
Past monitoring violations:
6 routine major monitoring violations
4 regular monitoring violations
Average household size: This city:
2.6 peopleGeorgia:
2.6 people
Percentage of family households: This city:
69.0%Whole state:
68.5%
Percentage of households with unmarried partners: This city:
5.1%Whole state:
5.9%
Likely homosexual households (counted as self-reported same-sex unmarried-partner households)
Lesbian couples: 0.4% of all households Gay men: 0.5% of all households
People in group quarters in Roswell in 2010:
305 people in nursing facilities/skilled-nursing facilities
123 people in group homes intended for adults
51 people in local jails and other municipal confinement facilities
37 people in emergency and transitional shelters (with sleeping facilities) for people experiencing homelessness
People in group quarters in Roswell in 2000:
266 people in other noninstitutional group quarters
208 people in other group homes
55 people in homes for the mentally retarded
50 people in other types of correctional institutions
39 people in other nonhousehold living situations
7 people in other workers' dormitories
3 people in wards in general hospitals for patients who have no usual home elsewhere
Banks with most branches in Roswell (2011 data):
Wells Fargo Bank, National Association: Mansell Road Branch, King Road Branch, Magnolia Street Branch, Old Alabama Branch, Shallowford Corners Center Branch. Info updated 2011/04/05: Bank assets: $1,161,490.0 mil, Deposits: $905,653.0 mil, headquarters in Sioux Falls, SD, positive income , 6395 total offices , Holding Company: Wells Fargo & Company
SunTrust Bank: Holcomb Bridge Kroger Branch, Kings Plaza Branch, Roswell Branch, Hardscrable Branch, North Fulton Hospital Branch. Info updated 2010/05/27: Bank assets: $171,291.7 mil, Deposits: $129,833.2 mil, headquarters in Atlanta, GA, positive income , Commercial Lending Specialization, 1716 total offices , Holding Company: Suntrust Banks, Inc.
JPMorgan Chase Bank, National Association: Holcomb Bridge And Old Alabama Branc, Shallowford And Johnson Ferry Branch, Roswell - Mansell - Branch, Roswell Corner Branch. Info updated 2011/11/10: Bank assets: $1,811,678.0 mil, Deposits: $1,190,738.0 mil, headquarters in Columbus, OH, positive income , International Specialization, 5577 total offices , Holding Company: Jpmorgan Chase & Co.
Bank of America, National Association: Roswell Branch, Holcomb Bridge Branch, Crossville Branch. Info updated 2009/11/18: Bank assets: $1,451,969.3 mil, Deposits: $1,077,176.8 mil, headquarters in Charlotte, NC, positive income , 5782 total offices , Holding Company: Bank Of America Corporation
Fifth Third Bank: Sandy Plains Financial Branch at 4701 Sandy Plains Road, branch established on 2005/11/09; Mansell Village Bank Mart Branch at 570 East Crossville Road, branch established on 2009/06/15. Info updated 2009/10/05: Bank assets: $114,540.4 mil, Deposits: $89,689.1 mil, headquarters in Cincinnati, OH, positive income , Commercial Lending Specialization, 1378 total offices , Holding Company: Fifth Third Bancorp
Branch Banking and Trust Company: North Roswell Branch at 11650 Alpharetta Highway, branch established on 1992/01/18; Roswell Main Branch at 525 East Crossville Road, branch established on 2004/06/14. Info updated 2010/03/29: Bank assets: $168,867.6 mil, Deposits: $127,549.5 mil, headquarters in Winston Salem, NC, positive income , Commercial Lending Specialization, 1793 total offices , Holding Company: Bb&T Corporation
Community & Southern Bank: Roswell Branch at 10485 Alpharetta Street, branch established on 2008/05/20; Roswell Branch at 900 Woodstock Road, branch established on 2011/10/17. Info updated 2010/09/20: Bank assets: $2,188.5 mil, Deposits: $1,690.2 mil, headquarters in Carrollton, GA, positive income , Commercial Lending Specialization, 39 total offices , Holding Company: Community & Southern Holdings, Inc.
Fidelity Bank: Roswell Branch at 1325 Hembree Road, branch established on 1994/07/25; Roswell-Crabapple Branch at 10920 Crabapple Road, branch established on 1989/10/04. Info updated 2011/10/24: Bank assets: $2,231.8 mil, Deposits: $1,889.9 mil, headquarters in Atlanta, GA, positive income , Commercial Lending Specialization, 31 total offices , Holding Company: Fidelity Southern Corporation
Regions Bank: Roswell Branch at 865 Woodstock Road, branch established on 1988/06/30. Info updated 2011/02/24: Bank assets: $123,368.2 mil, Deposits: $98,301.3 mil, headquarters in Birmingham, AL, positive income , Commercial Lending Specialization, 1778 total offices , Holding Company: Regions Financial Corporation
3 other banks with 3 local branches
For population 15 years and over in Roswell:
Never married: 30.6%Now married: 53.3%Separated: 0.9%Widowed: 3.2%Divorced: 12.0% For population 25 years and over in Roswell:
High school or higher: 96.4%Bachelor's degree or higher: 66.7%Graduate or professional degree: 21.8%Unemployed: 2.7%Mean travel time to work (commute): 18.6 minutes
Education Gini index (Inequality in education) Here:
8.7Georgia average:
12.2
Religion statistics for Roswell, GA (based on Fulton County data)
Religion Adherents Congregations Evangelical Protestant 204,409 357 Mainline Protestant 166,727 153 Catholic 91,391 18 Black Protestant 90,642 135 Other 50,075 86 Orthodox 2,496 6 None 314,841 -
Source: Clifford Grammich, Kirk Hadaway, Richard Houseal, Dale E.Jones, Alexei Krindatch, Richie Stanley and Richard H.Taylor. 2012. 2010 U.S.Religion Census: Religious Congregations & Membership Study. Association of Statisticians of American Religious Bodies. Jones, Dale E., et al. 2002. Congregations and Membership in the United States 2000. Nashville, TN: Glenmary Research Center. Graphs represent county-level data
Food Environment Statistics: Number of grocery stores : 190Fulton County :
1.91 / 10,000 pop.Georgia :
1.91 / 10,000 pop.
Number of supercenters and club stores : 7Here :
0.07 / 10,000 pop.State :
0.15 / 10,000 pop.
Number of convenience stores (no gas) : 59This county :
0.59 / 10,000 pop.Georgia :
0.86 / 10,000 pop.
Number of convenience stores (with gas) : 298Fulton County :
3.00 / 10,000 pop.Georgia :
5.12 / 10,000 pop.
Number of full-service restaurants : 1,102Fulton County :
11.10 / 10,000 pop.Georgia :
7.41 / 10,000 pop.
Adult diabetes rate : This county :
8.6%State :
10.4%
Adult obesity rate : Fulton County :
23.2%Georgia :
27.8%
Low-income preschool obesity rate : Health and Nutrition:
Average overall health of teeth and gums : Roswell:
49.3%Georgia:
46.5%
People feeling badly about themselves : People not drinking alcohol at all : Roswell:
9.0%Georgia:
10.8%
Average hours sleeping at night : Overweight people : Roswell:
33.5%Georgia:
33.5%
General health condition : Average condition of hearing : This city:
81.0%State:
80.8%
More about Health and Nutrition of Roswell, GA Residents
Local government employment and payroll (March 2022)
Function
Full-time employees
Monthly full-time payroll
Average yearly full-time wage
Part-time employees
Monthly part-time payroll
Police Protection - Officers
153 $981,290 $76,964 4 $7,763 Parks and Recreation
105 $601,298 $68,720 147 $168,427 Streets and Highways
62 $314,054 $60,785 1 $1,689 Solid Waste Management
52 $234,216 $54,050 3 $871 Other Government Administration
46 $302,037 $78,792 16 $26,731 Police - Other
42 $194,188 $55,482 3 $5,308 Financial Administration
41 $231,570 $67,777 3 $2,355 Other and Unallocable
29 $154,564 $63,958 1 $1,579 Water Supply
17 $86,007 $60,711 0 $0 Firefighters
16 $117,122 $87,842 194 $533,269 Sewerage
11 $51,151 $55,801 0 $0 Judicial and Legal
8 $60,853 $91,280 2 $3,324 Correction
3 $16,490 $65,960 0 $0 Fire - Other
3 $16,359 $65,436 1 $868
Totals for Government
588 $3,361,200 $68,596 375 $752,183
Roswell government finances - Expenditure in 2021 (per resident):
Construction - Regular Highways: $12,796,000 ($137.67)
General Public Buildings: $859,000 ($9.24)Parks and Recreation: $690,000 ($7.42)Sewerage: $363,000 ($3.91)Current Operations - Police Protection: $21,451,000 ($230.78)
Central Staff Services: $16,283,000 ($175.18)General - Other: $14,314,000 ($154.00)Parks and Recreation: $12,233,000 ($131.61)Solid Waste Management: $11,344,000 ($122.04)Local Fire Protection: $9,229,000 ($99.29)Regular Highways: $8,399,000 ($90.36)Financial Administration: $7,704,000 ($82.88)Judicial and Legal Services: $2,287,000 ($24.60)General Public Buildings: $2,046,000 ($22.01)Housing and Community Development: $1,940,000 ($20.87)Water Utilities: $1,564,000 ($16.83)Sewerage: $1,544,000 ($16.61)Miscellaneous Commercial Activities - Other: $57,000 ($0.61)General - Interest on Debt: $1,061,000 ($11.41)
Intergovernmental to Local - Other - General - Other: $619,000 ($6.66)
Other Capital Outlay - General - Other: $2,382,000 ($25.63)
Financial Administration: $1,172,000 ($12.61)Parks and Recreation: $538,000 ($5.79)Police Protection: $72,000 ($0.77)Central Staff Services: $24,000 ($0.26)Local Fire Protection: $13,000 ($0.14)Water Utilities - Interest on Debt: $90,000 ($0.97)
Roswell government finances - Revenue in 2021 (per resident):
Charges - Other: $19,115,000 ($205.65)
Solid Waste Management: $11,362,000 ($122.24)Sewerage: $5,060,000 ($54.44)Parks and Recreation: $4,517,000 ($48.60)Miscellaneous Commercial Activities: $400,000 ($4.30)Parking Facilities: $37,000 ($0.40)Federal Intergovernmental - Other: $4,223,000 ($45.43)
Local Intergovernmental - General Local Government Support: $43,995,000 ($473.32)
Other: $384,000 ($4.13)Miscellaneous - General Revenue - Other: $3,456,000 ($37.18)
Fines and Forfeits: $1,090,000 ($11.73)Interest Earnings: $664,000 ($7.14)Rents: $247,000 ($2.66)Sale of Property: $194,000 ($2.09)Donations From Private Sources: $44,000 ($0.47)Special Assessments: $17,000 ($0.18)Revenue - Water Utilities: $2,193,000 ($23.59)
State Intergovernmental - Other: $844,000 ($9.08)
Housing and Community Development: $653,000 ($7.03)General Local Government Support: $514,000 ($5.53)Tax - Property: $31,765,000 ($341.74)
Insurance Premiums Sales: $7,094,000 ($76.32)Public Utilities Sales: $5,758,000 ($61.95)Other License: $2,559,000 ($27.53)Occupation and Business License - Other: $1,798,000 ($19.34)Alcoholic Beverage Sales: $1,625,000 ($17.48)Other Selective Sales: $1,280,000 ($13.77)Alcoholic Beverage License: $652,000 ($7.01)Other: $224,000 ($2.41)
Roswell government finances - Debt in 2021 (per resident):
Long Term Debt - Beginning Outstanding - Unspecified Public Purpose: $28,787,000 ($309.70)
Outstanding Unspecified Public Purpose: $26,685,000 ($287.09)Retired Unspecified Public Purpose: $3,320,000 ($35.72)Issue, Unspecified Public Purpose: $1,219,000 ($13.11)
Roswell government finances - Cash and Securities in 2021 (per resident):
Bond Funds - Cash and Securities: $18,277,000 ($196.63)
Other Funds - Cash and Securities: $118,351,000 ($1273.28)
Sinking Funds - Cash and Securities: $2,277,000 ($24.50)
11.63% of this county's 2021 resident taxpayers lived in other counties in 2020 ($85,149 average adjusted gross income )
Here:
11.63%Georgia average:
10.21%
0.01% of residents moved from foreign countries ($76 average AGI )Fulton County:
0.01%Georgia average:
0.04%
Top counties from which taxpayers relocated into this county between 2020 and 2021:
12.21% of this county's 2020 resident taxpayers moved to other counties in 2021 ($93,086 average adjusted gross income )
Here:
12.21%Georgia average:
9.60%
0.01% of residents moved to foreign countries ($58 average AGI )Fulton County:
0.01%Georgia average:
0.03%
Top counties to which taxpayers relocated from this county between 2020 and 2021:
Businesses in Roswell, GA
Name Count Name Count
AT&T 3 Marshalls 1 Advance Auto Parts 1 MasterBrand Cabinets 4 Arby's 2 Mazda 1 Audi 1 McDonald's 4 AutoZone 1 New Balance 1 BMW 1 Nike 10 Bally Total Fitness 1 Nissan 1 Best Western 1 Office Depot 2 Blockbuster 1 OfficeMax 1 Brunswick Bowling & Billiards 1 Olive Garden 1 Budget Car Rental 1 Outback 1 Burger King 2 Outback Steakhouse 1 CVS 4 Panda Express 1 Chick-Fil-A 2 Penske 1 Chipotle 1 PetSmart 1 Curves 1 Pizza Hut 2 DHL 2 Publix Super Markets 4 Dairy Queen 1 Quiznos 1 Discount Tire 1 RadioShack 2 Domino's Pizza 1 Red Lobster 1 Dunkin Donuts 4 Rite Aid 1 FedEx 11 SONIC Drive-In 1 Firestone Complete Auto Care 1 Sprint Nextel 1 GNC 1 Staples 1 GameStop 1 Starbucks 6 H&R Block 1 Steak 'n Shake 1 Haworth 1 Studio 6 1 Hilton 1 Subway 6 Hobby Lobby 1 T-Mobile 4 Holiday Inn 1 T.J.Maxx 1 Home Depot 2 Taco Bell 2 Honda 1 Target 1 Hyundai 1 Toyota 1 IHOP 1 Trader Joe's 1 InTown Suites 1 U-Haul 2 KFC 2 UPS 25 Kohl's 2 Vans 1 Kroger 3 Waffle House 3 LA Fitness 3 Walgreens 2 La Quinta 1 Walmart 1 Little Caesars Pizza 2 Wendy's 3 Marriott 1 Whole Foods Market 1
Strongest AM radio stations in Roswell:
WCNN (680 AM; 50 kW; NORTH ATLANTA, GA; Owner: DICKEY BROADCASTING COMPANY)
WSB (750 AM; 50 kW; ATLANTA, GA; Owner: CXR HOLDINGS, INC.)
WGST (640 AM; 50 kW; ATLANTA, GA; Owner: CITICASTERS LICENSES, L.P.)
WAZX (1550 AM; 50 kW; SMYRNA, GA; Owner: GA-MEX BROADCASTING, INC.)
WQXI (790 AM; 28 kW; ATLANTA, GA; Owner: JEFFERSON-PILOT COMMUNICATIONS COMPANY OF GEORGIA)
WFTD (1080 AM; daytime; 50 kW; MARIETTA, GA; Owner: PRIETO ENTERPRISES, INC.)
WMLB (1160 AM; 50 kW; EAST POINT, GA; Owner: ATLANTA AREA BROADCASTING, INC.)
WGUN (1010 AM; 50 kW; ATLANTA, GA; Owner: WGUN, INC.)
WAOK (1380 AM; 50 kW; ATLANTA, GA; Owner: INFINITY BROADCASTING OPERATIONS, INC.)
WGKA (1190 AM; 25 kW; ATLANTA, GA; Owner: SALEM MEDIA OF GEORGIA, INC.)
WLTA (1400 AM; 1 kW; ALPHARETTA, GA; Owner: SALEM MEDIA OF GEORGIA, INC.)
WAOS (1600 AM; 20 kW; AUSTELL, GA; Owner: LA FAVORITA, INC.)
WAFS (920 AM; 5 kW; ATLANTA, GA; Owner: THE MOODY BIBLE INSTITUTE OF CHICAGO)
Strongest FM radio stations in Roswell:
WLCL (105.7 FM; CANTON, GA; Owner: CHEROKEE BROADCASTING CO., INC.)
W265BD (100.9 FM; WOODSTOCK, GA; Owner: IMMANUEL BROADCASTING NETWORK, INC.)
WKHX-FM (101.5 FM; MARIETTA, GA; Owner: ABC, INC.)
WJZZ-FM (107.5 FM; ROSWELL, GA; Owner: ROA LICENSES, LLC)
WKLS (96.1 FM; ATLANTA, GA; Owner: CITICASTERS LICENSES, L.P.)
WLTM (94.9 FM; ATLANTA, GA; Owner: CITICASTERS LICENSES, L.P.)
WWWQ (100.5 FM; ANNISTON, AL; Owner: WNNX LICO, INC.)
WNNX (99.7 FM; ATLANTA, GA; Owner: WNNX LICO, INC.)
WWEV-FM (91.5 FM; CUMMING, GA; Owner: CURRICULUM DEVELOPMENT FOUNDATION)
WSB-FM (98.5 FM; ATLANTA, GA; Owner: CXR HOLDINGS, INC.)
WSTR (94.1 FM; SMYRNA, GA; Owner: JEFFERSON-PILOT COMMUNICATIONS COMPANY OF GEORGIA)
WVEE (103.3 FM; ATLANTA, GA; Owner: INFINITY BROADCASTING OPERATIONS, INC.)
WZGC (92.9 FM; ATLANTA, GA; Owner: INFINITY BROADCASTING CORP. OF ATLANTA)
WABE (90.1 FM; ATLANTA, GA; Owner: BOARD OF EDUCATION, CITY OF ATLANTA)
WFOX (97.1 FM; GAINESVILLE, GA; Owner: COX RADIO, INC.)
WRFG (89.3 FM; ATLANTA, GA; Owner: RADIO FREE GEORGIA BROADCASTING FOUNDATION INC)
W221AW (92.1 FM; NORTH CANTON, GA; Owner: IMMANUEL BROADCASTING NETWORK, INC.)
W214AS (90.7 FM; WALESKA, GA; Owner: CALVARY CHAPEL OF TWIN FALLS, INC.)
WYAY (106.7 FM; GAINESVILLE, GA; Owner: ABC, INC.)
WFSH-FM (104.7 FM; ATHENS, GA; Owner: SOUTH TEXAS BROADCASTING, INC.)
TV broadcast stations around Roswell:
WSKC-LP (Channel 59; ATLANTA, GA; Owner: KM LPTV OF ATLANTA, L.L.C.)
WUVG (Channel 34; ATHENS, GA; Owner: UNIVISION ATLANTA LLC)
WAGA (Channel 5; ATLANTA, GA; Owner: FOX TELEVISION STATIONS, INC.)
WATL (Channel 36; ATLANTA, GA; Owner: WATL, LLC)
WTBS (Channel 17; ATLANTA, GA; Owner: SUPERSTATION, INC.)
WGCL-TV (Channel 46; ATLANTA, GA; Owner: MEREDITH CORPORATION)
WSB-TV (Channel 2; ATLANTA, GA; Owner: WSB-TV HOLDINGS, INC.)
WXIA-TV (Channel 11; ATLANTA, GA; Owner: GANNETT GEORGIA, L.P.)
W38CU (Channel 38; ATLANTA, GA; Owner: KOREAN AMERICAN TV BROADCASTING CORP.)
WIRE-CA (Channel 40; ATLANTA, GA; Owner: COMMERCIAL BROADCASTING CORP.)
WANN-LP (Channel 32; ATLANTA, GA; Owner: PRISM BROADCASTING NETWORK, INC.)
WDTA-LP (Channel 53; FAYETTEVILLE, GA; Owner: WORD OF GOD FELLOWSHIP, INC.)
WHSG (Channel 63; MONROE, GA; Owner: TRINITY BROADCASTING NETWORK)
WPBA (Channel 30; ATLANTA, GA; Owner: BOARD OF EDUCATION OF THE CITY OF ATLANTA)
WUPA (Channel 69; ATLANTA, GA; Owner: VIACOM STATIONS GROUP OF ATLANTA INC.)
WTHC-LP (Channel 42; ATLANTA, GA; Owner: THE ATLANTA CHANNEL, INC.)
WANX-LP (Channel 26; ATLANTA, GA; Owner: PRISM BROADCASTING NETWORK, INC.)
W24AL (Channel 24; ATLANTA, GA; Owner: VENTANA TELEVISION, INC.)
WATC (Channel 57; ATLANTA, GA; Owner: COMMUNITY TELEVISION, INC.)
W50AB (Channel 50; HIAWASSEE, GA; Owner: GEORGIA PUBLIC TELECOMMUNICATIONS COMMISSION)
WPXA (Channel 14; ROME, GA; Owner: PAXSON ATLANTA LICENSE, INC.)
W55BM (Channel 55; MARIETTA, GA; Owner: TRINITY BROADCASTING NETWORK)
WGTV (Channel 8; ATHENS, GA; Owner: GEORGIA PUBLIC TELECOMMUNICATIONS COMMISSION)
National Bridge Inventory (NBI) Statistics 43 Number of bridges558ft / 170m Total length $51,133,000 Total costs1,040,378 Total average daily traffic14,801 Total average daily truck traffic
New bridges - historical statistics
1 1920-1929 1 1930-1939 1 1940-1949 4 1950-1959 12 1960-1969 9 1970-1979 5 1980-1989 1 1990-1999 6 2000-2009 1 2010-2019
See full National Bridge Inventory statistics for Roswell, GA
Home Mortgage Disclosure Act Aggregated Statistics For Year 2009(Based on 5 full and 7 partial tracts) A) FHA, FSA/RHS & VA B) Conventional C) Refinancings D) Home Improvement Loans E) Loans on Dwellings For 5+ Families F) Non-occupant Loans on G) Loans On Manufactured Number Average Value Number Average Value Number Average Value Number Average Value Number Average Value Number Average Value Number Average Value
LOANS ORIGINATED 306 $210,892 459 $269,723 2,619 $243,781 57 $152,594 2 $5,061,485 72 $180,706 1 $350,000 APPLICATIONS APPROVED, NOT ACCEPTED 13 $236,463 49 $364,124 224 $243,507 13 $81,659 0 $0 7 $292,331 0 $0 APPLICATIONS DENIED 34 $188,848 64 $250,483 693 $258,981 36 $100,645 0 $0 42 $159,391 0 $0 APPLICATIONS WITHDRAWN 45 $203,283 70 $259,239 529 $240,269 22 $308,047 0 $0 28 $172,277 0 $0 FILES CLOSED FOR INCOMPLETENESS 9 $220,591 15 $250,383 143 $258,135 6 $300,128 0 $0 3 $257,547 0 $0
Aggregated Statistics For Year 2008(Based on 5 full and 7 partial tracts) A) FHA, FSA/RHS & VA B) Conventional C) Refinancings D) Home Improvement Loans E) Loans on Dwellings For 5+ Families F) Non-occupant Loans on G) Loans On Manufactured Number Average Value Number Average Value Number Average Value Number Average Value Number Average Value Number Average Value Number Average Value
LOANS ORIGINATED 166 $206,472 775 $265,201 1,066 $246,448 93 $107,421 6 $2,109,802 119 $191,931 3 $46,680 APPLICATIONS APPROVED, NOT ACCEPTED 14 $161,228 86 $262,515 199 $219,160 30 $58,911 0 $0 17 $233,158 1 $66,000 APPLICATIONS DENIED 34 $216,425 98 $250,558 502 $256,323 85 $87,702 0 $0 49 $151,666 2 $78,905 APPLICATIONS WITHDRAWN 21 $231,814 120 $233,636 322 $255,020 26 $132,087 0 $0 41 $165,055 0 $0 FILES CLOSED FOR INCOMPLETENESS 5 $240,474 35 $263,480 67 $287,228 17 $99,578 0 $0 7 $145,293 0 $0
Aggregated Statistics For Year 2007(Based on 5 full and 7 partial tracts) A) FHA, FSA/RHS & VA B) Conventional C) Refinancings D) Home Improvement Loans E) Loans on Dwellings For 5+ Families F) Non-occupant Loans on G) Loans On Manufactured Number Average Value Number Average Value Number Average Value Number Average Value Number Average Value Number Average Value Number Average Value
LOANS ORIGINATED 57 $183,978 1,605 $236,498 1,302 $215,345 170 $116,746 3 $8,892,173 192 $188,981 0 $0 APPLICATIONS APPROVED, NOT ACCEPTED 2 $142,455 179 $215,370 292 $196,243 37 $98,627 0 $0 30 $189,685 1 $33,970 APPLICATIONS DENIED 9 $176,049 229 $251,490 715 $235,206 129 $74,583 0 $0 74 $181,376 1 $66,540 APPLICATIONS WITHDRAWN 5 $168,574 197 $266,871 363 $226,216 51 $129,109 0 $0 25 $185,584 0 $0 FILES CLOSED FOR INCOMPLETENESS 1 $144,000 59 $284,086 126 $253,053 24 $68,046 0 $0 7 $243,683 1 $188,230
Aggregated Statistics For Year 2006(Based on 5 full and 7 partial tracts) A) FHA, FSA/RHS & VA B) Conventional C) Refinancings D) Home Improvement Loans E) Loans on Dwellings For 5+ Families F) Non-occupant Loans on Number Average Value Number Average Value Number Average Value Number Average Value Number Average Value Number Average Value
LOANS ORIGINATED 57 $172,261 2,334 $197,319 1,577 $211,092 194 $93,185 3 $5,336,723 246 $167,472 APPLICATIONS APPROVED, NOT ACCEPTED 2 $234,640 246 $199,336 329 $188,403 45 $68,099 0 $0 38 $206,681 APPLICATIONS DENIED 9 $176,408 327 $257,230 728 $241,225 125 $83,999 0 $0 56 $269,532 APPLICATIONS WITHDRAWN 7 $148,866 274 $248,788 493 $219,548 29 $100,894 1 $110,690 39 $218,882 FILES CLOSED FOR INCOMPLETENESS 0 $0 53 $228,096 155 $229,035 14 $102,393 0 $0 8 $198,724
Aggregated Statistics For Year 2005(Based on 5 full and 7 partial tracts) A) FHA, FSA/RHS & VA B) Conventional C) Refinancings D) Home Improvement Loans E) Loans on Dwellings For 5+ Families F) Non-occupant Loans on G) Loans On Manufactured Number Average Value Number Average Value Number Average Value Number Average Value Number Average Value Number Average Value Number Average Value
LOANS ORIGINATED 53 $180,730 2,514 $194,220 1,898 $207,888 165 $100,068 3 $16,267,733 299 $171,767 0 $0 APPLICATIONS APPROVED, NOT ACCEPTED 2 $190,680 180 $200,046 337 $174,728 30 $73,333 0 $0 29 $151,797 1 $52,000 APPLICATIONS DENIED 8 $192,712 292 $197,772 676 $219,670 89 $78,846 2 $674,000 54 $209,564 2 $29,065 APPLICATIONS WITHDRAWN 7 $151,489 294 $242,228 560 $222,242 56 $164,897 0 $0 59 $213,093 0 $0 FILES CLOSED FOR INCOMPLETENESS 1 $210,790 75 $227,622 194 $240,858 3 $74,983 0 $0 15 $343,255 0 $0
Aggregated Statistics For Year 2004(Based on 5 full and 7 partial tracts) A) FHA, FSA/RHS & VA B) Conventional C) Refinancings D) Home Improvement Loans E) Loans on Dwellings For 5+ Families F) Non-occupant Loans on G) Loans On Manufactured Number Average Value Number Average Value Number Average Value Number Average Value Number Average Value Number Average Value Number Average Value
LOANS ORIGINATED 81 $168,456 2,319 $201,649 2,085 $204,953 130 $78,183 4 $425,508 258 $154,363 2 $63,465 APPLICATIONS APPROVED, NOT ACCEPTED 3 $177,907 201 $218,420 282 $185,901 32 $57,422 0 $0 31 $137,992 1 $98,250 APPLICATIONS DENIED 15 $139,015 281 $257,716 639 $201,990 112 $63,697 0 $0 53 $173,790 6 $105,865 APPLICATIONS WITHDRAWN 7 $148,924 227 $228,726 429 $179,976 51 $80,995 0 $0 38 $143,322 0 $0 FILES CLOSED FOR INCOMPLETENESS 5 $160,750 66 $197,866 170 $201,860 20 $58,980 0 $0 6 $116,587 0 $0
Aggregated Statistics For Year 2003(Based on 5 full and 7 partial tracts) A) FHA, FSA/RHS & VA B) Conventional C) Refinancings D) Home Improvement Loans E) Loans on Dwellings For 5+ Families F) Non-occupant Loans on Number Average Value Number Average Value Number Average Value Number Average Value Number Average Value Number Average Value
LOANS ORIGINATED 80 $146,266 2,060 $203,333 6,673 $187,561 91 $58,901 1 $36,236,000 333 $148,613 APPLICATIONS APPROVED, NOT ACCEPTED 2 $171,500 152 $225,584 522 $180,944 32 $41,000 0 $0 30 $183,860 APPLICATIONS DENIED 14 $143,983 186 $240,495 695 $189,978 86 $48,132 1 $15,000,000 51 $161,930 APPLICATIONS WITHDRAWN 8 $135,260 188 $210,997 582 $189,163 17 $64,088 0 $0 40 $159,144 FILES CLOSED FOR INCOMPLETENESS 0 $0 52 $215,963 147 $204,903 8 $56,770 0 $0 7 $206,559
Aggregated Statistics For Year 2002(Based on 5 full and 2 partial tracts) A) FHA, FSA/RHS & VA B) Conventional C) Refinancings D) Home Improvement Loans E) Loans on Dwellings For 5+ Families F) Non-occupant Loans on Number Average Value Number Average Value Number Average Value Number Average Value Number Average Value Number Average Value
LOANS ORIGINATED 85 $148,819 1,374 $181,378 2,960 $188,086 89 $45,266 2 $1,542,500 195 $136,311 APPLICATIONS APPROVED, NOT ACCEPTED 3 $129,397 91 $248,384 293 $162,005 33 $34,368 0 $0 20 $105,108 APPLICATIONS DENIED 7 $115,240 100 $192,441 434 $184,927 62 $41,355 0 $0 31 $128,803 APPLICATIONS WITHDRAWN 7 $161,919 98 $174,738 345 $174,535 19 $49,266 0 $0 24 $166,248 FILES CLOSED FOR INCOMPLETENESS 0 $0 26 $163,195 156 $200,471 1 $25,000 0 $0 3 $218,000
Aggregated Statistics For Year 2001(Based on 5 full and 2 partial tracts) A) FHA, FSA/RHS & VA B) Conventional C) Refinancings D) Home Improvement Loans F) Non-occupant Loans on Number Average Value Number Average Value Number Average Value Number Average Value Number Average Value
LOANS ORIGINATED 165 $140,119 1,325 $176,446 2,260 $178,452 105 $44,335 176 $134,229 APPLICATIONS APPROVED, NOT ACCEPTED 4 $159,745 85 $173,762 197 $161,636 40 $43,059 6 $99,827 APPLICATIONS DENIED 10 $142,717 122 $162,316 378 $149,307 63 $30,940 23 $133,542 APPLICATIONS WITHDRAWN 10 $135,909 97 $197,276 308 $163,872 25 $25,933 24 $130,985 FILES CLOSED FOR INCOMPLETENESS 1 $159,000 19 $266,799 66 $190,685 2 $15,365 4 $125,120
Aggregated Statistics For Year 2000(Based on 5 full and 2 partial tracts) A) FHA, FSA/RHS & VA B) Conventional C) Refinancings D) Home Improvement Loans E) Loans on Dwellings For 5+ Families F) Non-occupant Loans on Number Average Value Number Average Value Number Average Value Number Average Value Number Average Value Number Average Value
LOANS ORIGINATED 115 $130,296 1,306 $177,318 443 $151,021 115 $34,958 1 $58,000 85 $126,750 APPLICATIONS APPROVED, NOT ACCEPTED 5 $121,780 85 $179,226 88 $160,304 53 $35,266 0 $0 8 $138,024 APPLICATIONS DENIED 12 $129,844 160 $181,677 178 $122,895 48 $39,981 0 $0 25 $129,554 APPLICATIONS WITHDRAWN 16 $125,546 122 $171,058 162 $106,615 20 $84,851 0 $0 17 $86,816 FILES CLOSED FOR INCOMPLETENESS 0 $0 23 $234,387 48 $146,384 2 $24,980 0 $0 6 $131,722
Aggregated Statistics For Year 1999(Based on 5 full and 4 partial tracts) A) FHA, FSA/RHS & VA B) Conventional C) Refinancings D) Home Improvement Loans E) Loans on Dwellings For 5+ Families F) Non-occupant Loans on Number Average Value Number Average Value Number Average Value Number Average Value Number Average Value Number Average Value
LOANS ORIGINATED 247 $128,995 1,945 $164,486 1,178 $160,542 103 $34,514 1 $10,566,900 143 $101,694 APPLICATIONS APPROVED, NOT ACCEPTED 2 $142,125 140 $179,445 165 $136,390 53 $26,433 0 $0 20 $74,153 APPLICATIONS DENIED 21 $128,234 176 $158,683 320 $147,329 71 $31,830 0 $0 15 $96,877 APPLICATIONS WITHDRAWN 19 $107,708 171 $157,283 264 $134,834 28 $73,086 0 $0 13 $142,125 FILES CLOSED FOR INCOMPLETENESS 2 $109,760 27 $172,998 66 $155,049 10 $43,990 0 $0 6 $140,115
Detailed mortgage data for all 12 tracts in Roswell, GA
Private Mortgage Insurance Companies Aggregated Statistics For Year 2009(Based on 5 full and 7 partial tracts) A) Conventional B) Refinancings C) Non-occupant Loans on Number Average Value Number Average Value Number Average Value
LOANS ORIGINATED 106 $261,775 92 $255,288 0 $0 APPLICATIONS APPROVED, NOT ACCEPTED 20 $253,575 53 $278,646 1 $63,000 APPLICATIONS DENIED 10 $263,369 14 $266,572 0 $0 APPLICATIONS WITHDRAWN 5 $267,392 13 $242,541 0 $0 FILES CLOSED FOR INCOMPLETENESS 2 $121,935 3 $236,093 0 $0
Aggregated Statistics For Year 2008(Based on 5 full and 7 partial tracts) A) Conventional B) Refinancings C) Non-occupant Loans on Number Average Value Number Average Value Number Average Value
LOANS ORIGINATED 257 $239,213 125 $253,248 19 $205,398 APPLICATIONS APPROVED, NOT ACCEPTED 79 $283,818 67 $268,452 14 $311,392 APPLICATIONS DENIED 22 $240,510 13 $304,491 15 $278,637 APPLICATIONS WITHDRAWN 11 $307,080 19 $254,907 2 $250,000 FILES CLOSED FOR INCOMPLETENESS 10 $230,475 3 $221,647 4 $238,698
Aggregated Statistics For Year 2007(Based on 5 full and 7 partial tracts) A) Conventional B) Refinancings C) Non-occupant Loans on Number Average Value Number Average Value Number Average Value
LOANS ORIGINATED 300 $230,495 104 $247,580 16 $175,496 APPLICATIONS APPROVED, NOT ACCEPTED 40 $231,692 37 $278,283 4 $196,245 APPLICATIONS DENIED 6 $305,042 0 $0 0 $0 APPLICATIONS WITHDRAWN 11 $249,583 13 $321,765 1 $212,520 FILES CLOSED FOR INCOMPLETENESS 1 $331,880 0 $0 0 $0
Aggregated Statistics For Year 2006(Based on 5 full and 7 partial tracts) A) Conventional B) Refinancings C) Non-occupant Loans on Number Average Value Number Average Value Number Average Value
LOANS ORIGINATED 167 $222,377 67 $235,668 13 $175,190 APPLICATIONS APPROVED, NOT ACCEPTED 25 $215,130 20 $238,719 2 $239,635 APPLICATIONS DENIED 0 $0 0 $0 0 $0 APPLICATIONS WITHDRAWN 12 $199,845 4 $425,312 0 $0 FILES CLOSED FOR INCOMPLETENESS 2 $281,920 0 $0 0 $0
Aggregated Statistics For Year 2005(Based on 5 full and 7 partial tracts) A) Conventional B) Refinancings C) Non-occupant Loans on Number Average Value Number Average Value Number Average Value
LOANS ORIGINATED 168 $204,443 83 $224,413 16 $163,790 APPLICATIONS APPROVED, NOT ACCEPTED 28 $193,789 23 $263,321 10 $191,535 APPLICATIONS DENIED 2 $283,285 1 $171,000 1 $120,570 APPLICATIONS WITHDRAWN 18 $307,363 10 $225,907 3 $214,740 FILES CLOSED FOR INCOMPLETENESS 1 $207,000 1 $465,780 0 $0
Aggregated Statistics For Year 2004(Based on 5 full and 7 partial tracts) A) Conventional B) Refinancings C) Non-occupant Loans on Number Average Value Number Average Value Number Average Value
LOANS ORIGINATED 207 $208,301 125 $204,716 26 $163,630 APPLICATIONS APPROVED, NOT ACCEPTED 31 $202,250 43 $207,830 6 $177,303 APPLICATIONS DENIED 2 $216,065 5 $294,660 1 $293,000 APPLICATIONS WITHDRAWN 11 $216,676 14 $187,441 1 $355,050 FILES CLOSED FOR INCOMPLETENESS 1 $147,830 4 $230,855 0 $0
Aggregated Statistics For Year 2003(Based on 5 full and 7 partial tracts) A) Conventional B) Refinancings C) Non-occupant Loans on Number Average Value Number Average Value Number Average Value
LOANS ORIGINATED 322 $205,621 394 $187,112 35 $148,243 APPLICATIONS APPROVED, NOT ACCEPTED 44 $217,570 81 $199,882 11 $193,485 APPLICATIONS DENIED 8 $449,390 6 $178,385 3 $392,500 APPLICATIONS WITHDRAWN 23 $231,390 24 $197,042 6 $133,192 FILES CLOSED FOR INCOMPLETENESS 1 $86,310 3 $154,117 1 $86,310
Aggregated Statistics For Year 2002(Based on 5 full and 2 partial tracts) A) Conventional B) Refinancings C) Non-occupant Loans on Number Average Value Number Average Value Number Average Value
LOANS ORIGINATED 322 $195,171 232 $191,301 29 $159,679 APPLICATIONS APPROVED, NOT ACCEPTED 34 $183,474 40 $176,858 5 $106,058 APPLICATIONS DENIED 6 $181,562 5 $231,164 0 $0 APPLICATIONS WITHDRAWN 19 $181,123 15 $194,307 1 $156,150 FILES CLOSED FOR INCOMPLETENESS 2 $278,680 2 $224,555 0 $0
Aggregated Statistics For Year 2001(Based on 5 full and 2 partial tracts) A) Conventional B) Refinancings C) Non-occupant Loans on Number Average Value Number Average Value Number Average Value
LOANS ORIGINATED 376 $174,451 182 $180,700 36 $136,387 APPLICATIONS APPROVED, NOT ACCEPTED 40 $191,120 29 $171,399 7 $144,959 APPLICATIONS DENIED 4 $277,725 6 $181,997 0 $0 APPLICATIONS WITHDRAWN 8 $202,615 8 $158,765 1 $235,220 FILES CLOSED FOR INCOMPLETENESS 1 $285,560 0 $0 0 $0
Aggregated Statistics For Year 2000(Based on 5 full and 2 partial tracts) A) Conventional B) Refinancings C) Non-occupant Loans on Number Average Value Number Average Value Number Average Value
LOANS ORIGINATED 402 $171,114 39 $187,122 19 $118,449 APPLICATIONS APPROVED, NOT ACCEPTED 41 $166,577 8 $188,829 6 $117,750 APPLICATIONS DENIED 12 $198,211 1 $264,000 3 $145,667 APPLICATIONS WITHDRAWN 3 $146,000 3 $163,593 1 $99,000 FILES CLOSED FOR INCOMPLETENESS 2 $181,000 0 $0 0 $0
Aggregated Statistics For Year 1999(Based on 5 full and 4 partial tracts) A) Conventional B) Refinancings C) Non-occupant Loans on Number Average Value Number Average Value Number Average Value
LOANS ORIGINATED 637 $163,706 124 $161,389 31 $100,185 APPLICATIONS APPROVED, NOT ACCEPTED 53 $151,387 23 $166,581 5 $105,024 APPLICATIONS DENIED 26 $149,920 5 $195,346 2 $99,430 APPLICATIONS WITHDRAWN 23 $146,610 6 $212,288 2 $56,345 FILES CLOSED FOR INCOMPLETENESS 4 $148,172 0 $0 0 $0
Fire-safe hotels and motels in Roswell, Georgia:
Baymont Inn & Suites, 1500 Market Blvd, Roswell, Georgia 30076 Phone: (770) 992-7200, Fax: (770) 993-7133
Doubletree Hotel Atlanta/Roswell-Alpharetta Area, 1075 Holcomb Bridge Rd, Roswell, Georgia 30076 Phone: (770) 992-9600, Fax: (770) 993-6539
La Quinta Inn & Suites, 575 Old Holcomb Bridge Rd, Roswell, Georgia 30076 Phone: (770) 552-0200, Fax: (770) 552-0110
In Town Suites Roswell, 1175 Hembree Rd, Roswell, Georgia 30075 Phone: (770) 410-9094, Fax: (770) 569-5849
Holiday Inn Atlanta/Roswell, 909 Holcomb Bridge Rd, Roswell, Georgia 30076 Phone: (770) 817-1414, Fax: (770) 817-1515
Best Western Plus Roswell, 907 Holcomb Bridge Rd, Roswell, Georgia 30076 Phone: (770) 552-5599, Fax: (770) 552-8180
All 6 fire-safe hotels and motels in Roswell, Georgia
Most common first names in Roswell, GA among deceased individuals Name Count Lived (average)
Mary 234 80.2 years William 201 74.7 years James 198 74.8 years John 179 76.8 years Robert 154 71.9 years Charles 123 73.6 years George 96 74.4 years Ruth 94 83.1 years Margaret 91 81.5 years Elizabeth 86 82.5 years
Most common last names in Roswell, GA among deceased individuals Last name Count Lived (average)
Smith 120 77.0 years Johnson 70 78.4 years Brown 53 75.9 years Williams 48 78.0 years Jones 44 79.3 years Thompson 33 77.9 years Moore 33 75.5 years Davis 32 77.3 years Martin 30 78.0 years Harris 29 79.6 years
Roswell compared to Georgia state average:
Median household income above state average. Median house value above state average. Unemployed percentage significantly below state average. Black race population percentage below state average. Foreign-born population percentage significantly above state average. Number of rooms per house above state average. Percentage of population with a bachelor's degree or higher significantly above state average. Roswell, GA compared to other similar cities:
#15 on the list of "Top 101 cities with largest percentage of females in industries: construction (population 50,000+)"
#18 on the list of "Top 101 cities with largest percentage of females in industries: real estate and rental and leasing (population 50,000+)"
#19 on the list of "Top 101 cities with largest percentage of females in industries: administrative and support and waste management services (population 50,000+)"
#26 on the list of "Top 101 cities with largest percentage of females in occupations: management occupations (population 50,000+)"
#30 on the list of "Top 101 cities with largest percentage of females in occupations: sales and related occupations (population 50,000+)"
#37 on the list of "Top 101 cities with largest percentage of males in industries: accommodation and food services (population 50,000+)"
#38 on the list of "Top 101 cities with the largest racial income disparity between any two races with at least 2,000 householders"
#40 on the list of "Top 101 cities with largest percentage of females in occupations: architecture and engineering occupations (population 50,000+)"
#42 on the list of "Top 101 cities with largest percentage of males in occupations: management occupations (population 50,000+)"
#42 on the list of "Top 101 larger cities with the largest decrease or smallest increase in household income from 2000 (population 50,000+)"
#42 on the list of "Top 101 cities with the highest percentage of workers working at home, population 50,000+"
#45 on the list of "Top 101 cities with largest percentage of males in occupations: food preparation and serving related occupations (population 50,000+)"
#52 on the list of "Top 101 cities with the smallest city-data.com crime index per police officer (population 50,000+)"
#52 on the list of "Top 101 cities with largest percentage of males in industries: professional, scientific, and technical services (population 50,000+)"
#54 on the list of "Top 101 cities with largest percentage population increases in the 1990s) (population 50,000+)"
#57 on the list of "Top 101 cities with largest percentage of males in occupations: legal occupations (population 50,000+)"
#62 on the list of "Top 101 cities with the lowest number of arson incidents per 100,000 residents (population 50,000+)"
#64 on the list of "Top 101 cities with the lowest number of rapes per 100,000 residents (population 50,000+)"
#69 on the list of "Top 100 best educated cities (highest percentage of bachelor degree holding residents) (pop. 50,000+)"
#70 on the list of "Top 101 cities with the highest average yearly precipitation (population 50,000+)"
#26 (30075) on the list of "Top 101 zip codes with the most beauty salons in 2005"
#5 on the list of "Top 101 counties with the most Mainline Protestant adherents"
#6 on the list of "Top 101 counties with the most Black Protestant adherents"
#9 on the list of "Top 101 counties with the most Black Protestant congregations"
#11 on the list of "Top 101 counties with the highest percentage of residents relocating from other counties between 2010 and 2011 (pop. 50,000+)"
#13 on the list of "Top 101 counties with the highest percentage of residents relocating to other counties in 2011 (pop. 50,000+)"
Top Patent Applicants
Matthew B. Trevathan (66)
Mark Austin (56)
Mario Kosseifi (54)
Mark J. Enzmann (46)
Sheldon Kent Meredith (41)
John Alson Hicks, Iii (39)
Kavita Chavda (38)
Jonathan Reeves (28)
Nagesh Kadaba (27)
Adrianne Luu (22)
Total of 2253 patent applications in 2008-2024.
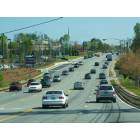
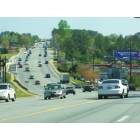

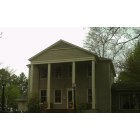


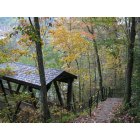

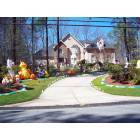

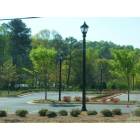


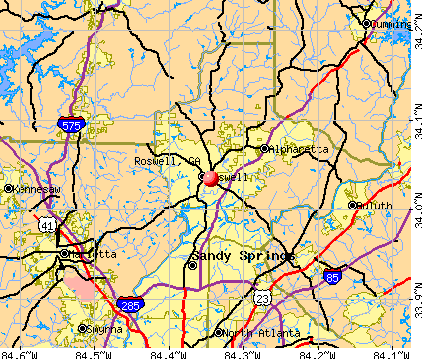


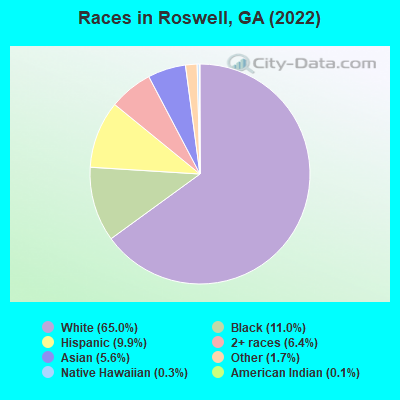
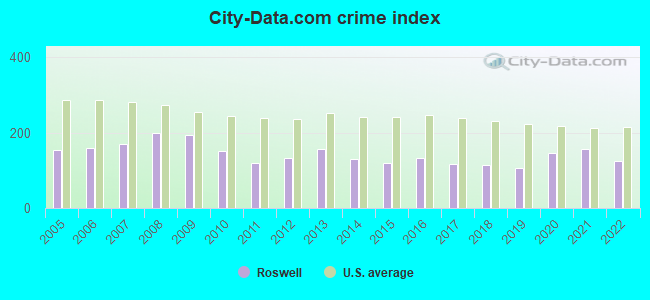
 Recent articles from our blog. Our writers, many of them Ph.D. graduates or candidates, create easy-to-read articles on a wide variety of topics.


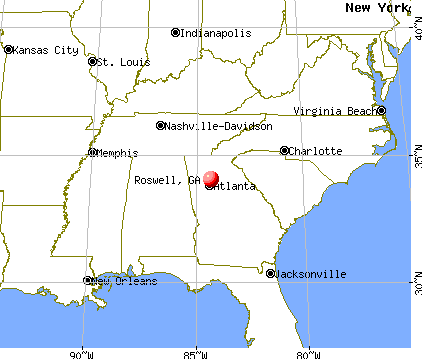
 (19.3 miles
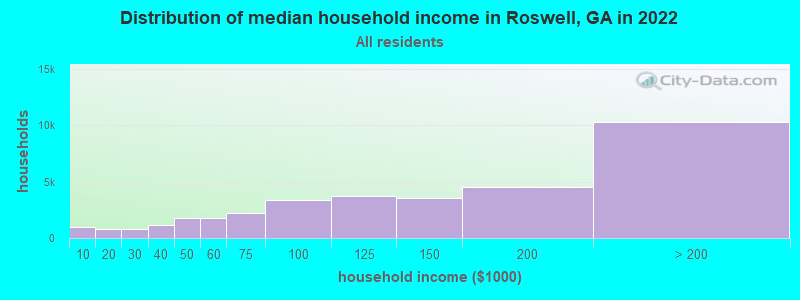
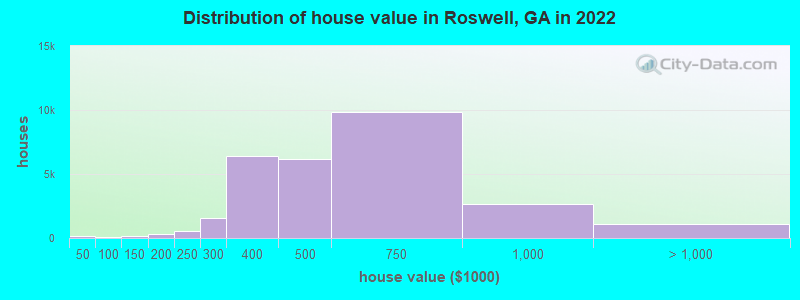
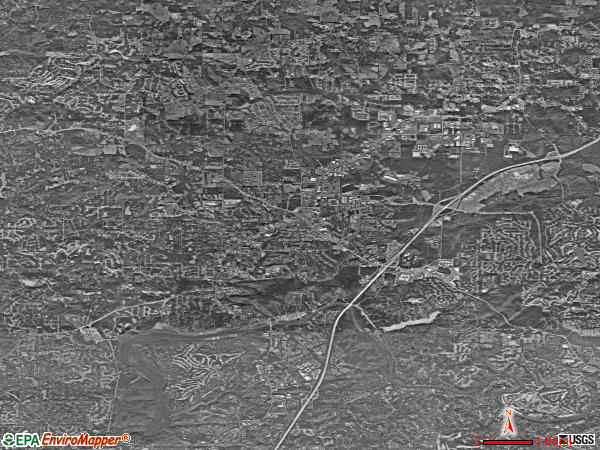
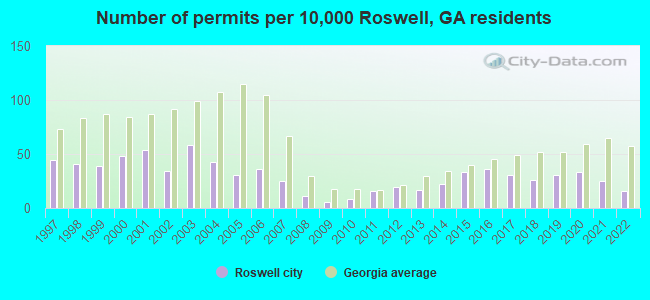
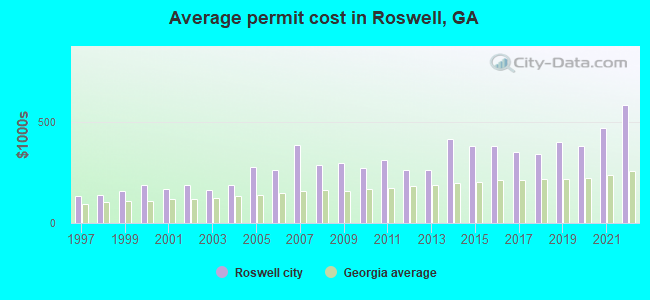
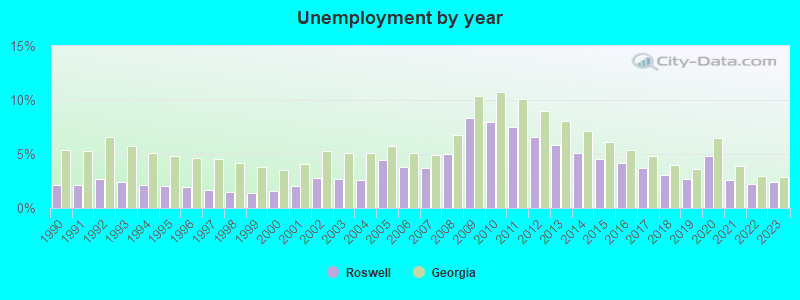
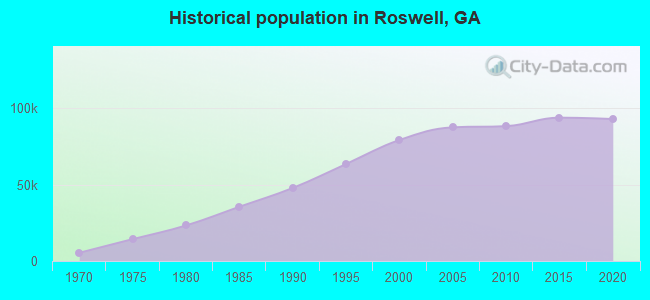
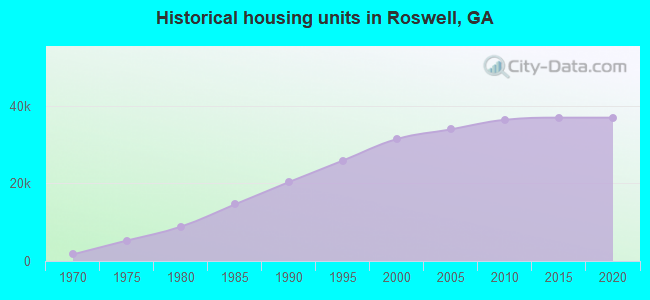
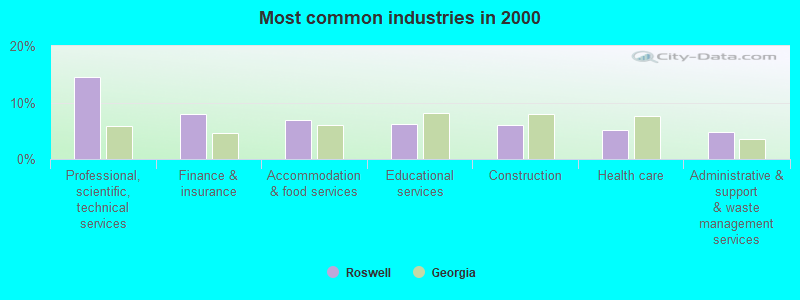
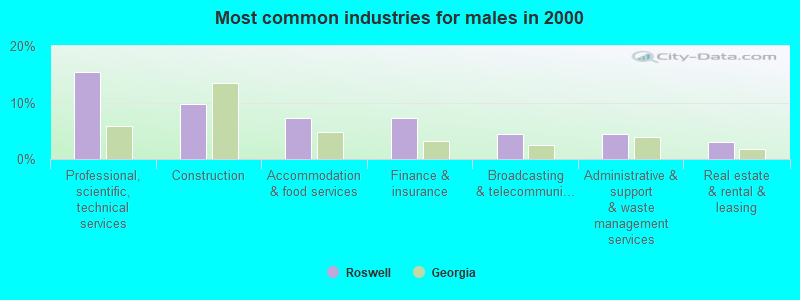
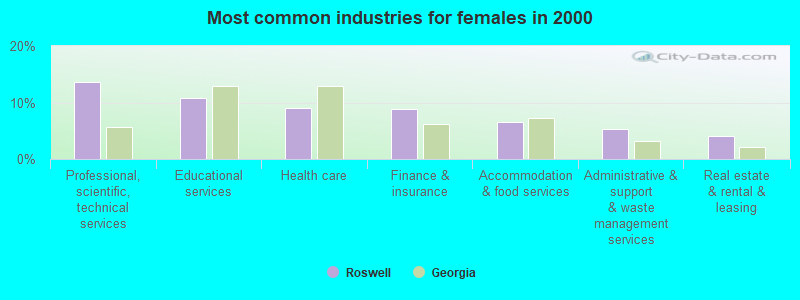
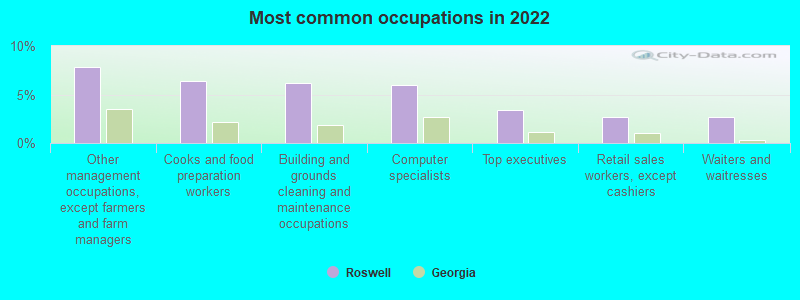
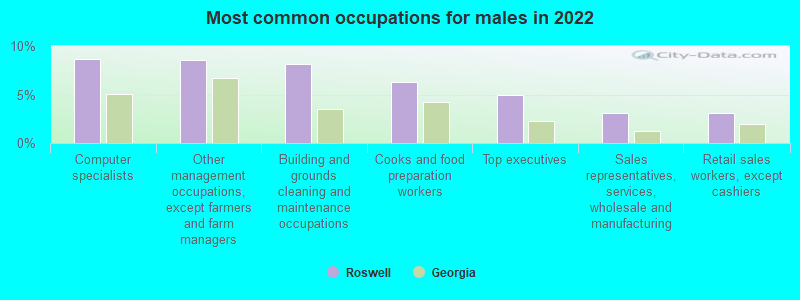
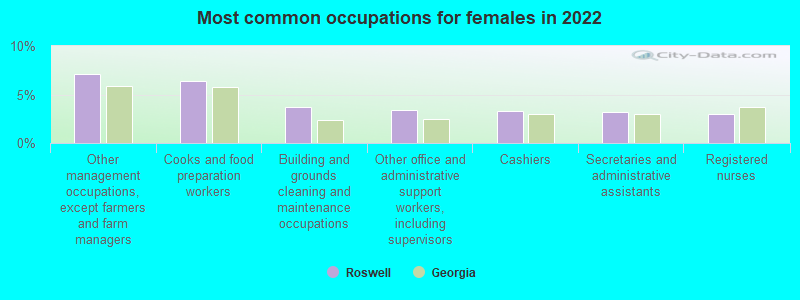
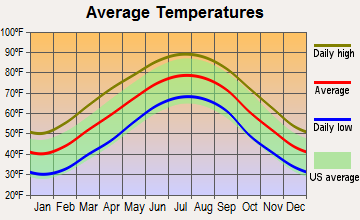
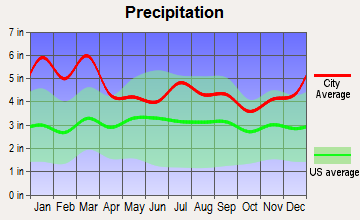
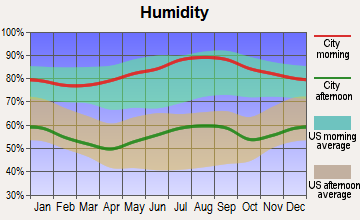
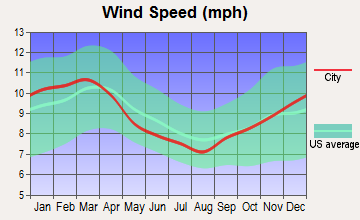
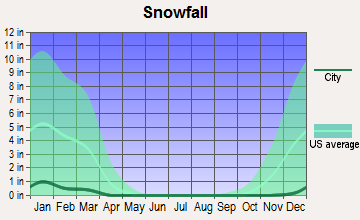
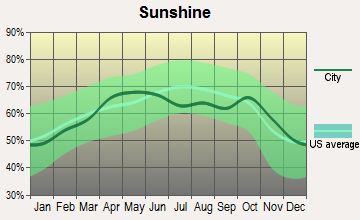
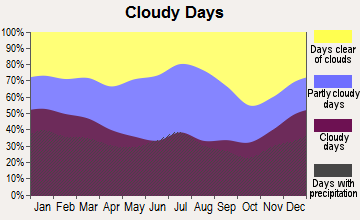
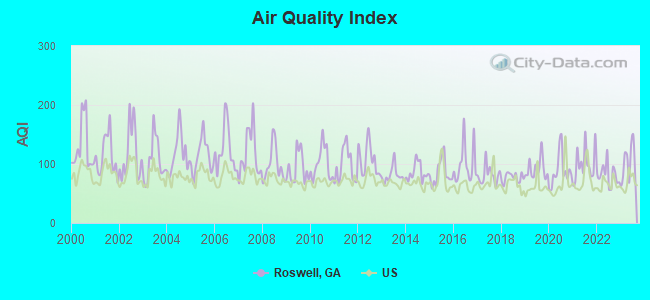
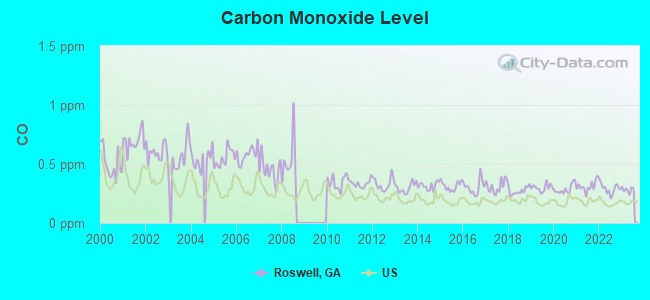
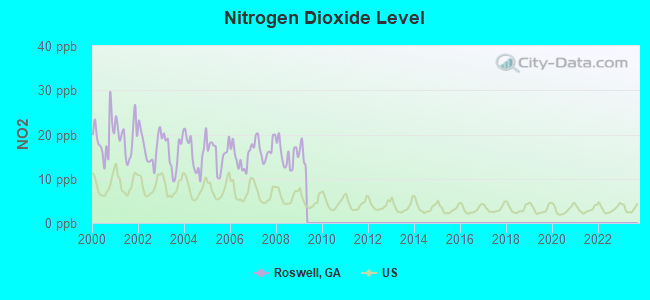
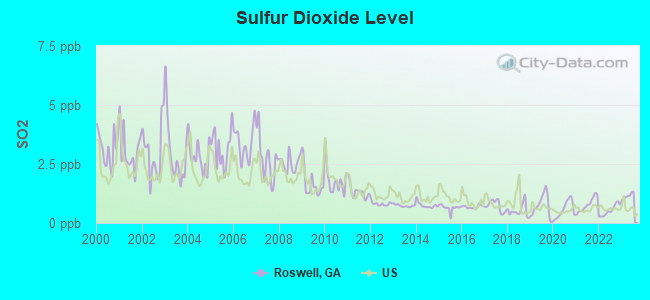
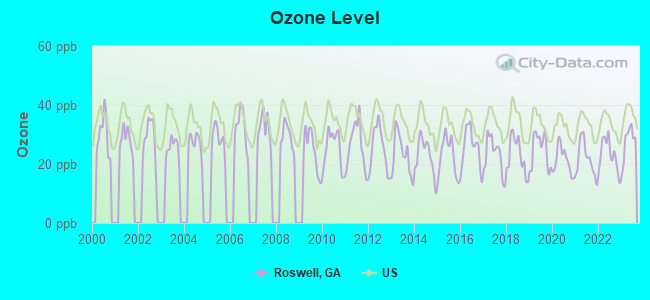
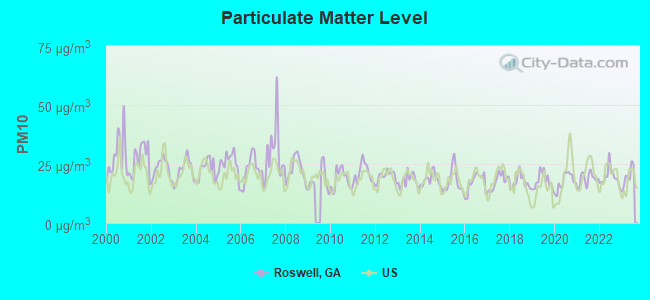
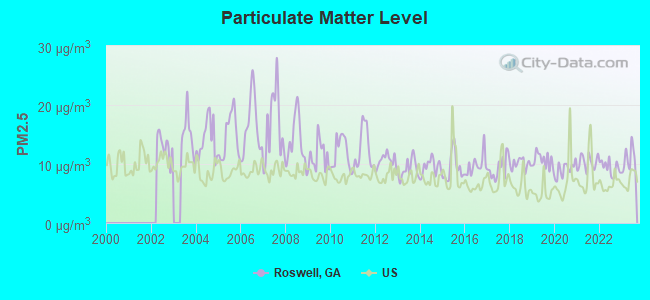
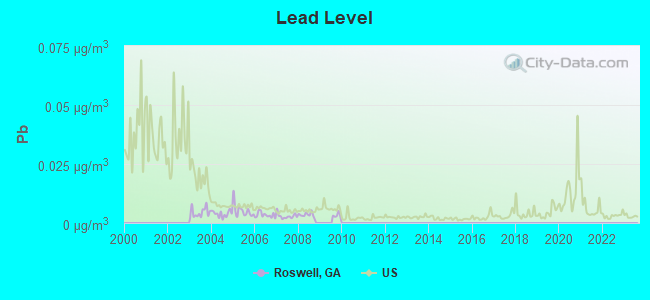
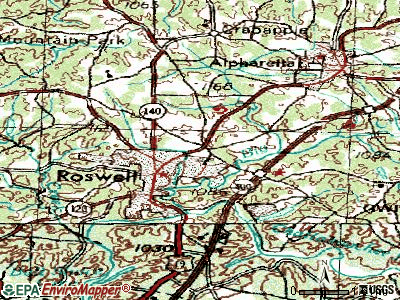
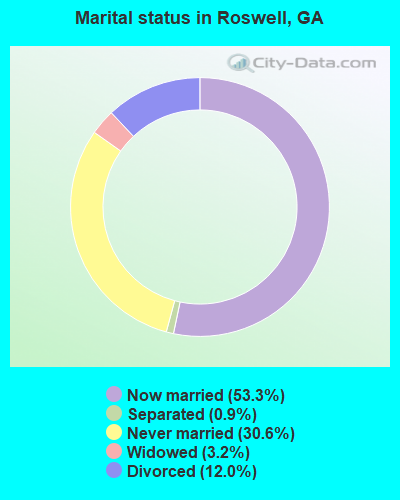
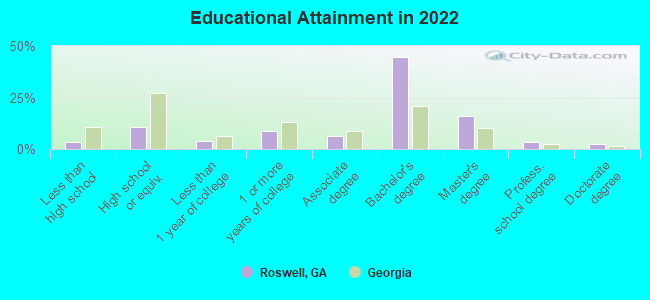
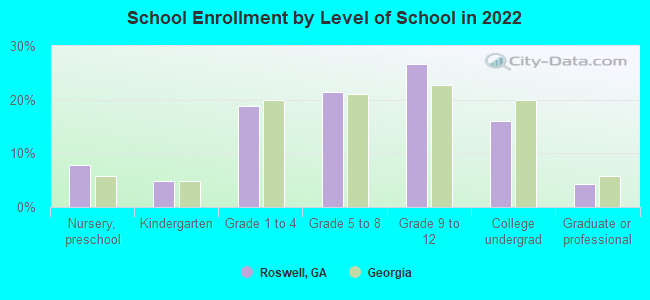
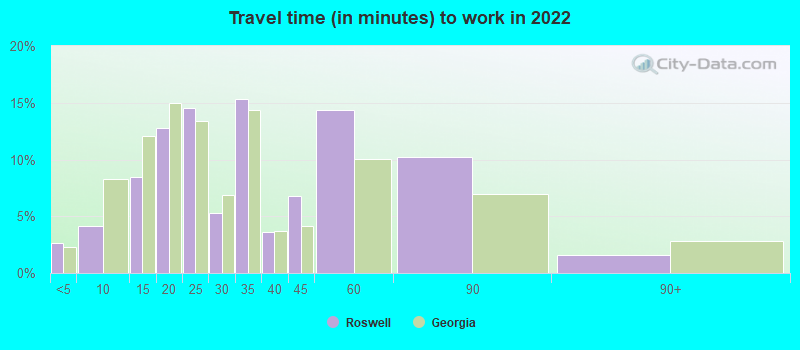
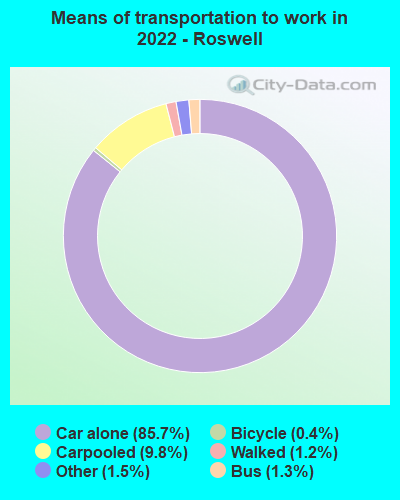
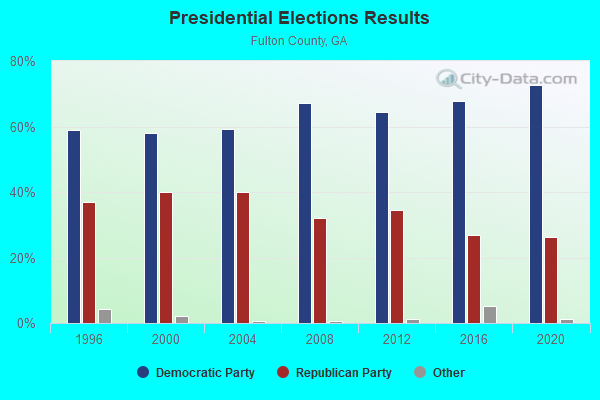
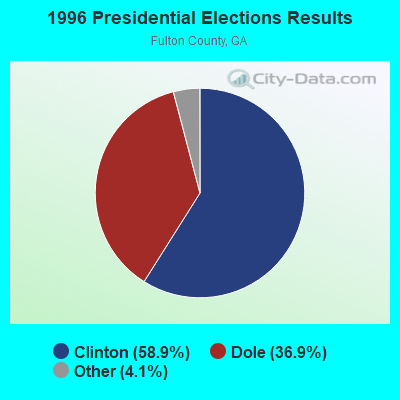
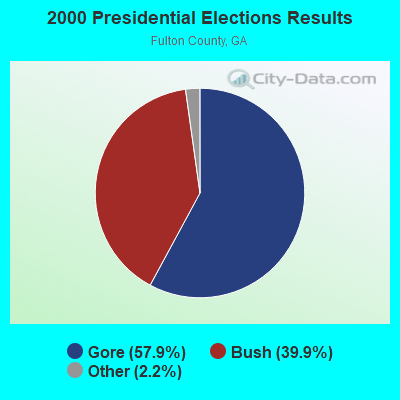
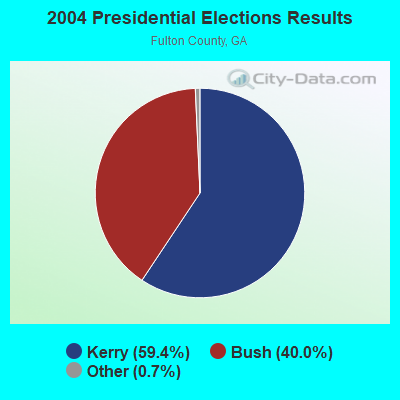
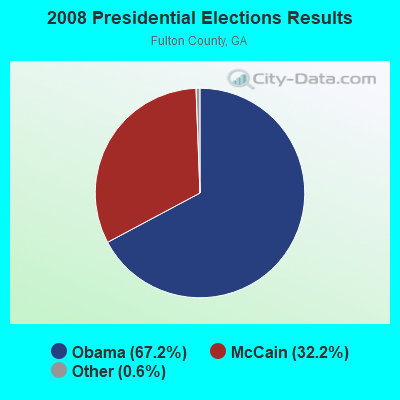
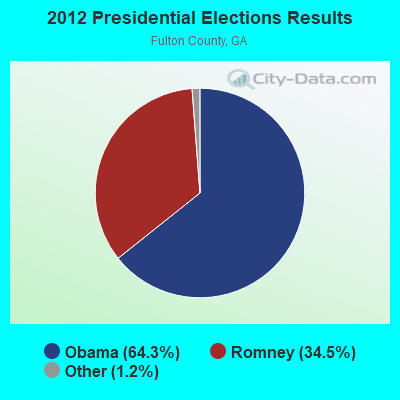
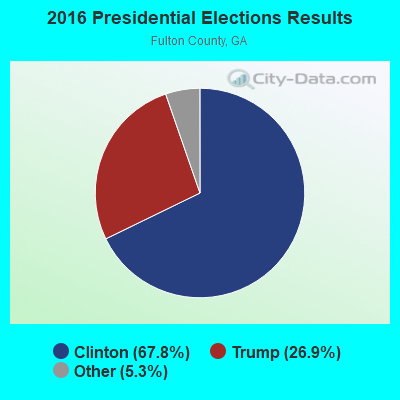
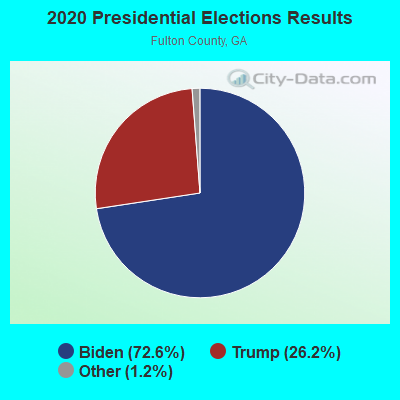
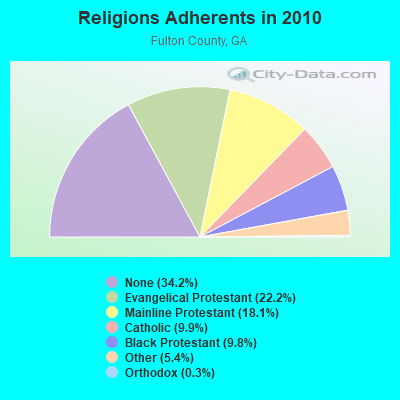
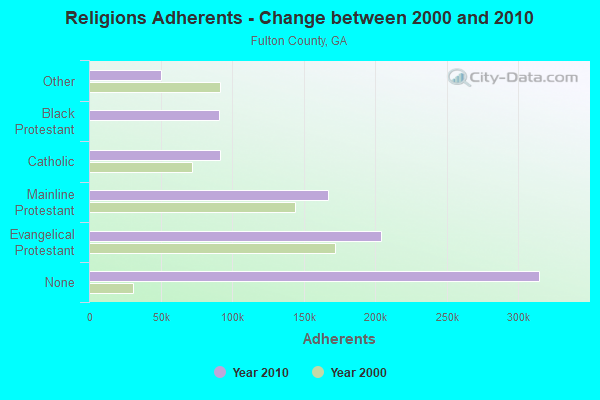
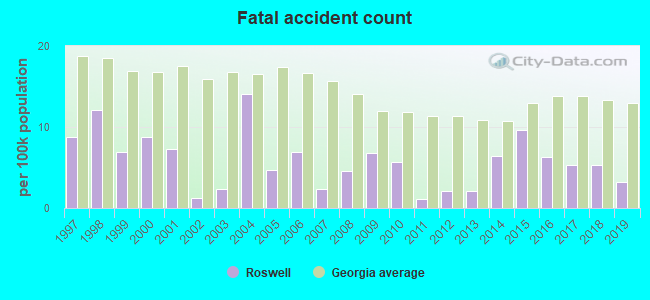
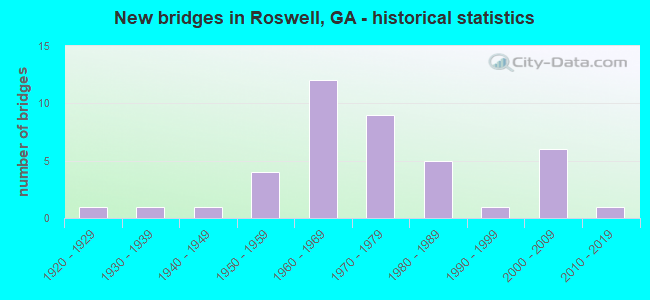
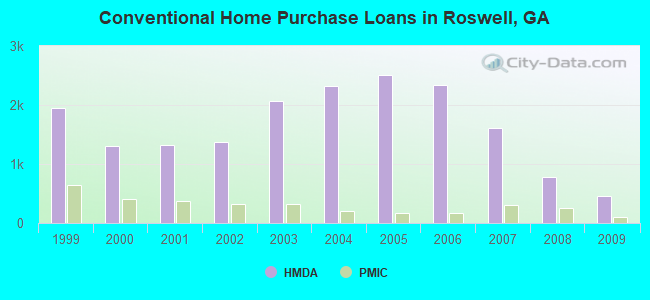
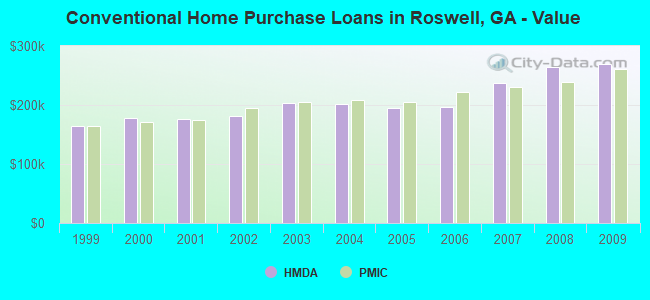
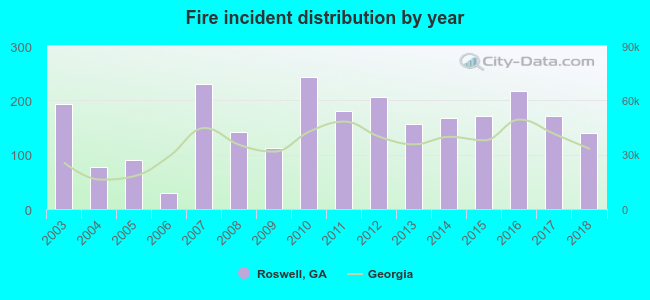 According to the data from the years 2003 - 2018 the average number of fire incidents per year is 158. The highest number of reported fires - 243 took place in 2010, and the least - 30 in 2006. The data has a declining trend.
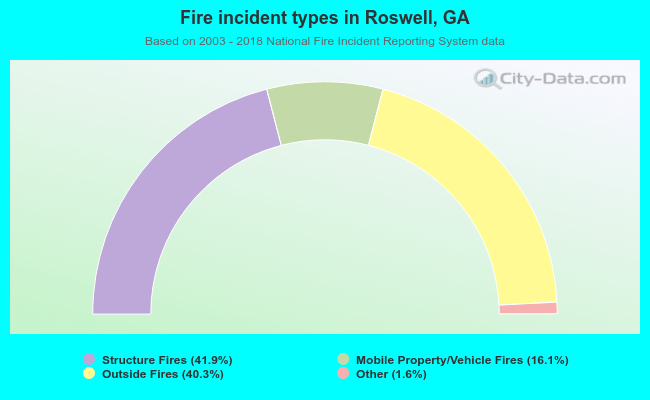 When looking into fire subcategories, the most reports belonged to: Structure Fires (41.9%), and Outside Fires (40.3%).