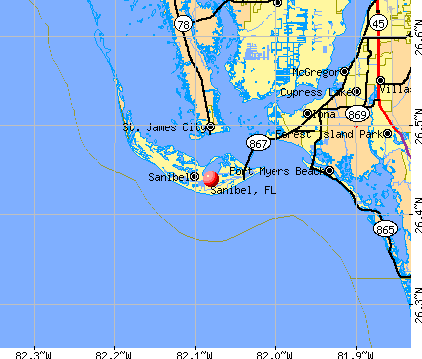
Sanibel, Florida
Sanibel: Sunset at Sanibel, Florida
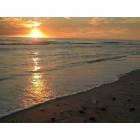
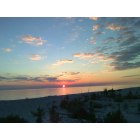
Sanibel: Sanibel Island Beach Sunset
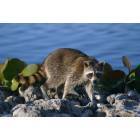
Sanibel: Racoon wanders along the water in Ding Darling nature preserve
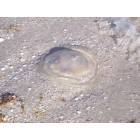
Sanibel: Jelly fish
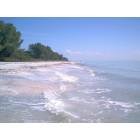
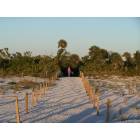
Sanibel: Sanibel Island Beach
Sanibel: morning view of the gulf on Sanibel Island
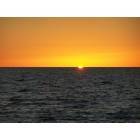
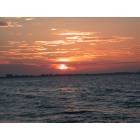
Sanibel: sunset on the gulf
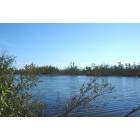
Sanibel: Sanibel Island waterway at Bowman
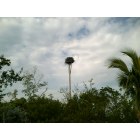
Sanibel: Osprey Nest - Lighthouse Point - Sanibel Island
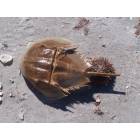
Sanibel: Sanibel Island
Sanibel: Sanibel Island
- see
24
more - add
your


Submit your own pictures of this city and show them to the world
- OSM Map
- General Map
- Google Map
- MSN Map
Population change since 2000: +6.9%
 |
| Males: 3,088 | |
| Females: 3,394 |
| Median resident age: | 69.2 years |
| Florida median age: | 42.7 years |
Zip codes: 33957.
| Sanibel: | $114,426 |
| FL: | $69,303 |
Estimated per capita income in 2022: $117,057 (it was $66,912 in 2000)
Sanibel city income, earnings, and wages data
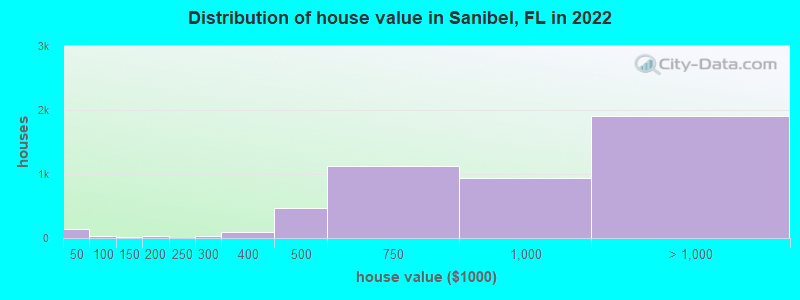
Estimated median house or condo value in 2022: over $1,000,000 (it was $380,500 in 2000)
| Sanibel: | over $1,000,000 |
| FL: | $354,100 |
Mean prices in 2022: all housing units: over $1,000,000; detached houses: over $1,000,000; townhouses or other attached units: $844,254; in 2-unit structures: $716,344; in 3-to-4-unit structures: $944,231; in 5-or-more-unit structures: over $1,000,000; mobile homes: $214,208
Median gross rent in 2022: $1,108.
(9.3% for White Non-Hispanic residents, 40.4% for Hispanic or Latino residents, 50.0% for American Indian residents, 100.0% for other race residents)
Detailed information about poverty and poor residents in Sanibel, FL


Compare current foreclosures near Sanibel, FL:
| Photo | Address | Area | Beds / Baths | Price | Details |
|---|---|---|---|---|---|

|
#1
Serenity Ln
Sanibel, FL 33957
|
1,955 sq. feet
|
2 baths 2 beds |
show details | |

|
#2
SW 40th Ter
Cape Coral, FL 33914
|
1,975 sq. feet
|
2 baths 3 beds |
$509,600
|
show details |

|
#3
Greendale Pl
Cape Coral, FL 33991
|
1,509 sq. feet
|
2 baths 3 beds |
$395,000
|
show details |

|
#4
SE 15th Ter
Cape Coral, FL 33990
|
1,710 sq. feet
|
2 baths 3 beds |
show details | |

|
#5
SW 21st Ave
Cape Coral, FL 33991
|
3,013 sq. feet
|
3 baths 4 beds |
show details | |

|
#6
NW 25th Ave
Cape Coral, FL 33993
|
2,023 sq. feet
|
2 baths 3 beds |
show details | |

|
#7
SE 45th St
Cape Coral, FL 33904
|
1,724 sq. feet
|
2 baths 3 beds |
show details | |

|
#8
St
Cape Coral, FL 33904
|
1,302 sq. feet
|
2 baths 3 beds |
show details | |

|
#9
Papaya St
Saint James City, FL 33956
|
1,249 sq. feet
|
1 baths 2 beds |
show details | |

|
#10
NW 11th Ter
Cape Coral, FL 33993
|
2,231 sq. feet
|
2 baths 4 beds |
show details |
| Photo | Address | Area | Beds / Baths | Price | Details |
|---|---|---|---|---|---|

|
#11
SE 5th Ave
Cape Coral, FL 33990
|
1,852 sq. feet
|
2 baths 3 beds |
show details | |

|
#12
Wilshire Dr
Fort Myers, FL 33919
|
1,527 sq. feet
|
2 baths 3 beds |
show details | |

|
#13
SE 16th Pl # A
Cape Coral, FL 33904
|
1,704 sq. feet
|
4 baths 4 beds |
show details | |

|
#14
Whiskey Creek Dr Apt 704
Fort Myers, FL 33919
|
1,132 sq. feet
|
2 baths 2 beds |
show details | |

|
#15
SE 17th St
Cape Coral, FL 33990
|
1,472 sq. feet
|
2 baths 3 beds |
show details | |

|
#16
SW 3rd St
Cape Coral, FL 33991
|
1,422 sq. feet
|
2 baths 3 beds |
show details | |

|
#17
SE 8th Pl
Cape Coral, FL 33990
|
1,216 sq. feet
|
2 baths 3 beds |
show details | |

|
#18
Pine Valley Dr Apt 207
Fort Myers, FL 33907
|
700 sq. feet
|
1 baths 1 beds |
show details | |

|
#19
SE 15th Ave
Cape Coral, FL 33990
|
1,554 sq. feet
|
2 baths 3 beds |
show details | |

|
#20
Ceitus Pkwy
Cape Coral, FL 33991
|
2,869 sq. feet
|
4 baths 4 beds |
show details |
| Photo | Address | Area | Beds / Baths | Price | Details |
|---|---|---|---|---|---|

|
#21
SW 7th Ave
Cape Coral, FL 33991
|
1,712 sq. feet
|
2 baths 4 beds |
show details | |

|
#22
Chablis Ln
Fort Myers, FL 33919
|
2,343 sq. feet
|
3 baths 3 beds |
show details | |

|
#23
Grove Ave
Bokeelia, FL 33922
|
1,192 sq. feet
|
2 baths 3 beds |
show details | |

|
#24
SW 3rd Ter
Cape Coral, FL 33991
|
2,253 sq. feet
|
3 baths 4 beds |
show details | |

|
#25
SW 4th Ln
Cape Coral, FL 33991
|
2,016 sq. feet
|
2 baths 3 beds |
show details | |

|
#26
SW 1st St
Cape Coral, FL 33991
|
1,754 sq. feet
|
2 baths 4 beds |
show details | |

|
#27
NW 12th St
Cape Coral, FL 33993
|
1,278 sq. feet
|
2 baths 3 beds |
show details | |

|
#28
Park Meadows Dr Apt 1
Fort Myers, FL 33907
|
1,722 sq. feet
|
2 baths 3 beds |
show details | |

|
#29
Andover St
Fort Myers, FL 33907
|
1,376 sq. feet
|
2 baths 2 beds |
show details | |

|
#30
Timberlakes Dr Apt 202
Fort Myers, FL 33908
|
1,746 sq. feet
|
3 baths 3 beds |
show details |
| Photo | Address | Area | Beds / Baths | Price | Details |
|---|---|---|---|---|---|

|
#31
SE 19th Ln
Cape Coral, FL 33990
|
1,506 sq. feet
|
2 baths 3 beds |
show details | |

|
#32
NW 3rd St
Cape Coral, FL 33993
|
1,670 sq. feet
|
2 baths 3 beds |
show details | |

|
#33
Colby Dr Apt 2205
Fort Myers, FL 33919
|
1,092 sq. feet
|
2 baths 2 beds |
show details | |

|
#34
Lennex Ln
Fort Myers, FL 33919
|
888 sq. feet
|
2 baths 2 beds |
show details | |

|
#35
SE 29th Ter
Cape Coral, FL 33904
|
2,464 sq. feet
|
2 baths 3 beds |
show details | |

|
#36
Sandel Wood Cir W
Fort Myers, FL 33908
|
1,763 sq. feet
|
2 baths 3 beds |
show details | |

|
#37
Bethany Ct N
Fort Myers, FL 33919
|
1,510 sq. feet
|
2 baths 3 beds |
show details | |

|
#38
Aviation Pkwy
Cape Coral, FL 33904
|
1,755 sq. feet
|
2 baths 3 beds |
show details | |

|
#39
SE 29th St
Cape Coral, FL 33904
|
1,162 sq. feet
|
2 baths 3 beds |
show details | |

|
#40
SE 8th Ave
Cape Coral, FL 33904
|
1,922 sq. feet
|
2 baths 3 beds |
show details |
| Photo | Address | Area | Beds / Baths | Price | Details |
|---|---|---|---|---|---|

|
#41
Candlewood Dr
Fort Myers, FL 33919
|
1,544 sq. feet
|
2 baths 3 beds |
show details | |

|
#42
SW 14th Ter
Cape Coral, FL 33991
|
1,220 sq. feet
|
2 baths 3 beds |
show details | |

|
#43
SW 12th Ln
Cape Coral, FL 33991
|
1,272 sq. feet
|
2 baths 3 beds |
show details | |

|
#44
SE 23rd Ter
Cape Coral, FL 33990
|
1,351 sq. feet
|
2 baths 3 beds |
show details | |

|
#45
SE 26th Ter
Cape Coral, FL 33904
|
1,625 sq. feet
|
2 baths 3 beds |
show details | |

|
#46
SE 21st Ter
Cape Coral, FL 33990
|
2,123 sq. feet
|
2 baths 4 beds |
show details | |

|
#47
NE 9th Pl
Cape Coral, FL 33909
|
1,292 sq. feet
|
2 baths 3 beds |
show details | |

|
#48
N Flossmoor Rd
Fort Myers, FL 33919
|
1,409 sq. feet
|
2 baths 3 beds |
show details | |

|
#49
SE 8th Pl
Cape Coral, FL 33990
|
1,212 sq. feet
|
2 baths 3 beds |
show details | |

|
Check over 1 million property listings on Foreclosure.com!
|
browse all offers | |||


- 6,39793.6%White alone
- 731.1%Asian alone
- 731.1%Two or more races
- 640.9%Hispanic
- 450.7%Black alone
- 210.3%American Indian alone
Races in Sanibel detailed stats: ancestries, foreign born residents, place of birth
According to our research of Florida and other state lists, there was 1 registered sex offender living in Sanibel, Florida as of April 26, 2024.
The ratio of all residents to sex offenders in Sanibel is 7,471 to 1.
The ratio of registered sex offenders to all residents in this city is much lower than the state average.
Type |
2009 |
2010 |
2011 |
2012 |
2013 |
2014 |
2015 |
2016 |
2017 |
2018 |
2019 |
2020 |
|---|---|---|---|---|---|---|---|---|---|---|---|---|
| Murders (per 100,000) | 0 (0.0) | 0 (0.0) | 0 (0.0) | 0 (0.0) | 0 (0.0) | 0 (0.0) | 0 (0.0) | 0 (0.0) | 0 (0.0) | 0 (0.0) | 0 (0.0) | 0 (0.0) |
| Rapes (per 100,000) | 0 (0.0) | 0 (0.0) | 0 (0.0) | 0 (0.0) | 0 (0.0) | 0 (0.0) | 0 (0.0) | 1 (13.5) | 2 (26.6) | 2 (26.7) | 0 (0.0) | 0 (0.0) |
| Robberies (per 100,000) | 0 (0.0) | 1 (15.5) | 0 (0.0) | 0 (0.0) | 1 (14.6) | 0 (0.0) | 0 (0.0) | 0 (0.0) | 0 (0.0) | 0 (0.0) | 0 (0.0) | 0 (0.0) |
| Assaults (per 100,000) | 3 (53.6) | 2 (30.9) | 5 (76.3) | 3 (44.8) | 4 (58.6) | 5 (71.2) | 4 (55.5) | 5 (67.6) | 3 (40.0) | 0 (0.0) | 3 (39.9) | 2 (26.6) |
| Burglaries (per 100,000) | 14 (250.0) | 18 (278.3) | 24 (366.0) | 29 (433.4) | 53 (776.3) | 33 (469.9) | 25 (347.0) | 43 (581.5) | 9 (119.9) | 11 (146.7) | 3 (39.9) | 3 (39.9) |
| Thefts (per 100,000) | 94 (1,678) | 89 (1,376) | 88 (1,342) | 76 (1,136) | 148 (2,168) | 73 (1,039) | 56 (777.2) | 41 (554.4) | 47 (626.2) | 58 (773.5) | 42 (558.1) | 34 (452.7) |
| Auto thefts (per 100,000) | 3 (53.6) | 1 (15.5) | 3 (45.8) | 6 (89.7) | 4 (58.6) | 1 (14.2) | 2 (27.8) | 2 (27.0) | 0 (0.0) | 0 (0.0) | 0 (0.0) | 1 (13.3) |
| Arson (per 100,000) | 0 (0.0) | 1 (15.5) | 0 (0.0) | 0 (0.0) | 0 (0.0) | 0 (0.0) | 0 (0.0) | 3 (40.6) | 0 (0.0) | 0 (0.0) | 0 (0.0) | 0 (0.0) |
| City-Data.com crime index | 99.6 | 86.6 | 98.2 | 91.9 | 161.9 | 89.8 | 68.7 | 89.4 | 62.8 | 62.6 | 33.1 | 27.3 |
The City-Data.com crime index weighs serious crimes and violent crimes more heavily. Higher means more crime, U.S. average is 246.1. It adjusts for the number of visitors and daily workers commuting into cities.
Crime rate in Sanibel detailed stats: murders, rapes, robberies, assaults, burglaries, thefts, arson
Full-time law enforcement employees in 2021, including police officers: 40 (25 officers - 21 male; 4 female).
| Officers per 1,000 residents here: | 3.32 |
| Florida average: | 2.33 |
 Recent articles from our blog. Our writers, many of them Ph.D. graduates or candidates, create easy-to-read articles on a wide variety of topics.


 | Visiting Sanibel, How Crowded Is It Right Now (COVID-preocupied) (2 replies) |
| Where to propose on Sanibel? (11 replies) |
| Question about fireworks on Sanibel (1 reply) |
| Jobs/Economic Profile of Sanibel's Residents (6 replies) |
| Looking for annual rental on Sanibel (0 replies) |
| Just got back from Sanibel/Captiva/Ft Myers beaches (2 replies) |
Latest news from Sanibel, FL collected exclusively by city-data.com from local newspapers, TV, and radio stations
Ancestries: American (27.8%), Irish (12.7%), English (11.7%), German (9.8%), Italian (5.7%), European (4.1%).
Current Local Time: EST time zone
Elevation: 6 feet
Land area: 17.2 square miles.
Population density: 377 people per square mile (very low).
350 residents are foreign born (2.9% Europe, 0.8% Asia, 0.8% North America, 0.6% Latin America).
| This city: | 5.1% |
| Florida: | 21.1% |
Median real estate property taxes paid for housing units with mortgages in 2022: $6,937 (0.8%)
Median real estate property taxes paid for housing units with no mortgage in 2022: $10,016 (0.8%)
Nearest city with pop. 50,000+: Cape Coral, FL  (15.1 miles , pop. 102,286).
Nearest city with pop. 200,000+: St. Petersburg, FL (99.7 miles , pop. 248,232).
Nearest city with pop. 1,000,000+: Houston, TX (843.0 miles , pop. 1,953,631).
Nearest cities:
), ), )Latitude: 26.44 N, Longitude: 82.08 W
Daytime population change due to commuting: +3,307 (+48.4%)
Workers who live and work in this city: 1,650 (79.0%)
Area code commonly used in this area: 239
Property values in Sanibel, FL

Sanibel, Florida accommodation & food services, waste management - Economy and Business Data
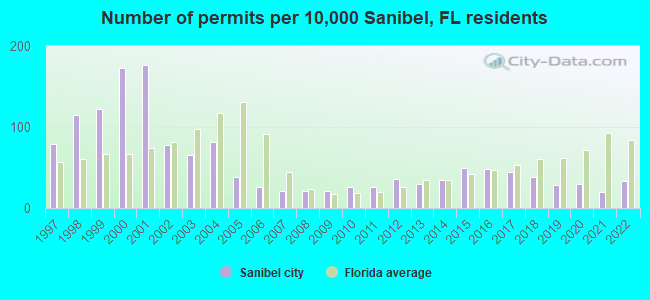
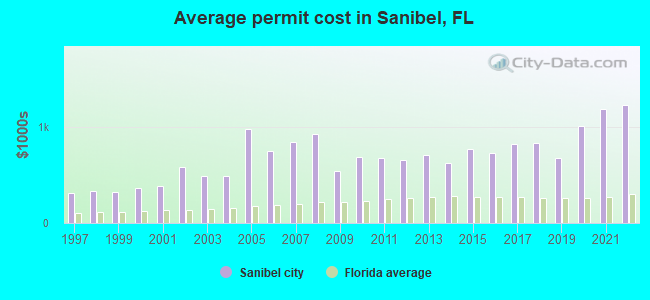
Single-family new house construction building permits:
- 2022: 20 buildings, average cost: $1,224,400
- 2021: 12 buildings, average cost: $1,183,400
- 2020: 18 buildings, average cost: $1,007,700
- 2019: 17 buildings, average cost: $673,200
- 2018: 23 buildings, average cost: $826,000
- 2017: 27 buildings, average cost: $824,100
- 2016: 29 buildings, average cost: $727,200
- 2015: 30 buildings, average cost: $768,100
- 2014: 21 buildings, average cost: $623,200
- 2013: 18 buildings, average cost: $704,300
- 2012: 22 buildings, average cost: $653,700
- 2011: 16 buildings, average cost: $677,700
- 2010: 16 buildings, average cost: $685,100
- 2009: 13 buildings, average cost: $542,400
- 2008: 13 buildings, average cost: $924,400
- 2007: 13 buildings, average cost: $843,100
- 2006: 16 buildings, average cost: $746,800
- 2005: 23 buildings, average cost: $974,000
- 2004: 49 buildings, average cost: $491,200
- 2003: 40 buildings, average cost: $482,700
- 2002: 47 buildings, average cost: $583,300
- 2001: 107 buildings, average cost: $384,600
- 2000: 105 buildings, average cost: $362,100
- 1999: 74 buildings, average cost: $319,200
- 1998: 70 buildings, average cost: $337,000
- 1997: 48 buildings, average cost: $309,700
| Here: | 3.0% |
| Florida: | 2.9% |
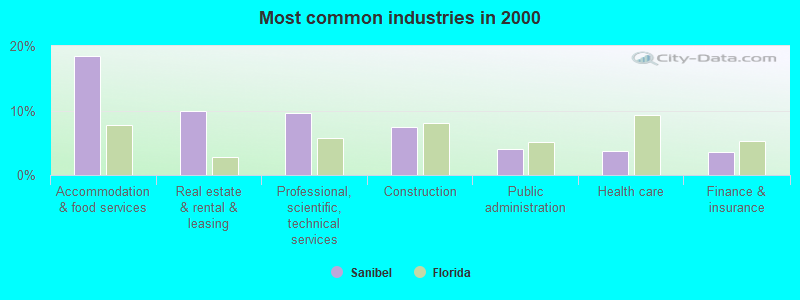
- Accommodation & food services (18.5%)
- Real estate & rental & leasing (10.0%)
- Professional, scientific, technical services (9.5%)
- Construction (7.4%)
- Public administration (4.1%)
- Health care (3.7%)
- Finance & insurance (3.5%)
- Accommodation & food services (18.8%)
- Construction (11.7%)
- Professional, scientific, technical services (11.2%)
- Real estate & rental & leasing (6.5%)
- Public administration (6.4%)
- Finance & insurance (5.4%)
- Food & beverage stores (2.7%)
- Accommodation & food services (18.0%)
- Real estate & rental & leasing (14.5%)
- Professional, scientific, technical services (7.4%)
- Educational services (6.6%)
- Health care (6.0%)
- Other direct selling establishments (4.8%)
- Used merchandise, gift, novelty, souvenir, other miscellaneous stores (4.6%)
- Other management occupations, except farmers and farm managers (14.1%)
- Other sales and related occupations, including supervisors (11.9%)
- Top executives (6.1%)
- Retail sales workers, except cashiers (3.4%)
- Sales representatives, services, wholesale and manufacturing (3.2%)
- Building and grounds cleaning and maintenance occupations (3.2%)
- Waiters and waitresses (3.1%)
- Other management occupations, except farmers and farm managers (16.8%)
- Other sales and related occupations, including supervisors (8.8%)
- Top executives (6.6%)
- Other financial specialists (3.9%)
- Sales representatives, services, wholesale and manufacturing (3.4%)
- Driver/sales workers and truck drivers (3.2%)
- Lawyers (3.1%)
- Other sales and related occupations, including supervisors (15.8%)
- Other management occupations, except farmers and farm managers (10.6%)
- Retail sales workers, except cashiers (6.9%)
- Top executives (5.5%)
- Art and design workers (5.1%)
- Secretaries and administrative assistants (4.4%)
- Preschool, kindergarten, elementary, and middle school teachers (4.3%)
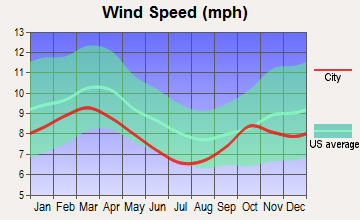
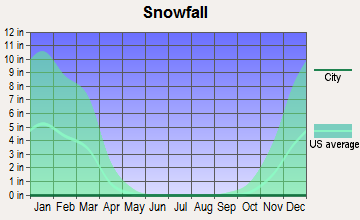
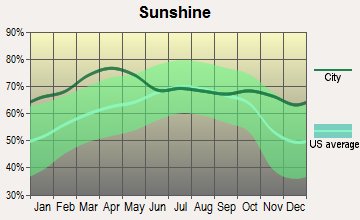
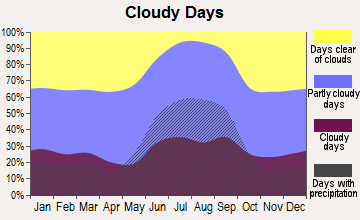
Average climate in Sanibel, Florida
Based on data reported by over 4,000 weather stations
|
|

(lower is better)
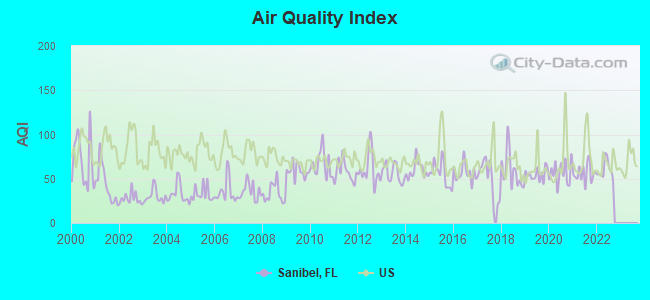
Air Quality Index (AQI) level in 2022 was 59.9. This is better than average.
| City: | 59.9 |
| U.S.: | 72.6 |
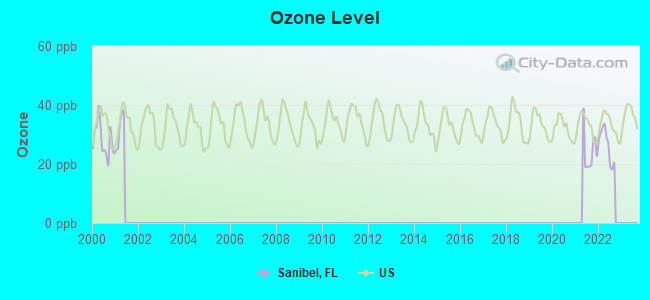
Ozone [ppb] level in 2022 was 26.5. This is better than average. Closest monitor was 15.2 miles away from the city center.
| City: | 26.5 |
| U.S.: | 33.3 |
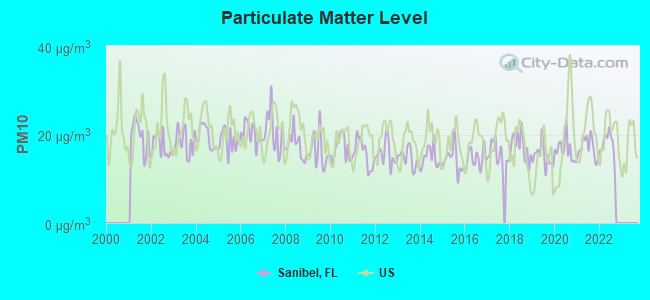
Particulate Matter (PM10) [µg/m3] level in 2022 was 17.9. This is about average. Closest monitor was 16.8 miles away from the city center.
| City: | 17.9 |
| U.S.: | 19.2 |
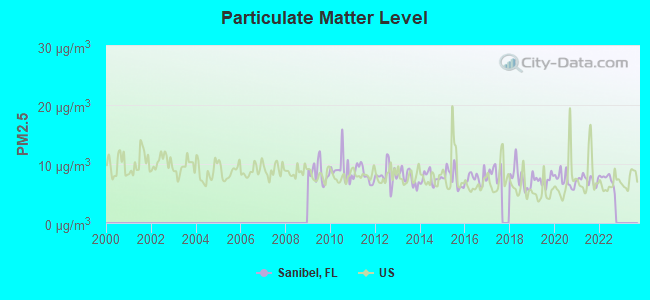
Particulate Matter (PM2.5) [µg/m3] level in 2022 was 7.37. This is about average. Closest monitor was 16.8 miles away from the city center.
| City: | 7.37 |
| U.S.: | 8.11 |
Tornado activity:
Sanibel-area historical tornado activity is below Florida state average. It is 40% smaller than the overall U.S. average.
On 10/31/1960, a category F2 (max. wind speeds 113-157 mph) tornado 2.0 miles away from the Sanibel city center killed one person and caused between $500 and $5000 in damages.
On 6/18/1972, a category F2 tornado 2.5 miles away from the city center caused between $5000 and $50,000 in damages.
Earthquake activity:
Sanibel-area historical earthquake activity is above Florida state average. It is 93% smaller than the overall U.S. average.On 9/10/2006 at 14:56:08, a magnitude 5.9 (5.9 MB, 5.5 MS, 5.8 MW, Class: Moderate, Intensity: VI - VII) earthquake occurred 282.3 miles away from the city center
On 3/31/1992 at 14:59:39, a magnitude 3.8 (3.8 MB, Depth: 3.1 mi, Class: Light, Intensity: II - III) earthquake occurred 228.4 miles away from the city center
On 4/18/1997 at 14:57:35, a magnitude 3.9 (3.9 MB, Depth: 20.5 mi) earthquake occurred 281.4 miles away from Sanibel center
On 10/24/1997 at 08:35:17, a magnitude 4.9 (4.8 MB, 4.2 MS, 4.9 LG, Depth: 6.2 mi, Class: Light, Intensity: IV - V) earthquake occurred 451.5 miles away from the city center
On 5/6/2018 at 16:47:09, a magnitude 4.6 (4.6 MB, Depth: 6.2 mi) earthquake occurred 417.9 miles away from the city center
On 6/23/2016 at 17:20:29, a magnitude 3.8 (3.8 ML) earthquake occurred 293.6 miles away from Sanibel center
Magnitude types: regional Lg-wave magnitude (LG), body-wave magnitude (MB), local magnitude (ML), surface-wave magnitude (MS), moment magnitude (MW)
Natural disasters:
The number of natural disasters in Lee County (23) is greater than the US average (15).Major Disasters (Presidential) Declared: 13
Emergencies Declared: 5
Causes of natural disasters: Hurricanes: 11, Tropical Storms: 6, Fires: 5, Freeze: 1, Other: 1 (Note: some incidents may be assigned to more than one category).
Hospitals and medical centers near Sanibel:
- SHELL POINT NURSING PAVILION (Nursing Home, about 8 miles away; FORT MYERS, FL)
- BMA - SOUTH FT MYERS (Dialysis Facility, about 12 miles away; FORT MYERS, FL)
- LODGE AT CYPRESS COVE, THE (Nursing Home, about 12 miles away; FORT MYERS, FL)
- HEALTHPARK CARE CENTER, INC (Nursing Home, about 12 miles away; FORT MYERS, FL)
- FORT MYERS SOUTH DIALYSIS (Dialysis Facility, about 13 miles away; FORT MYERS, FL)
- INNOVATIVE SENIOR CARE HOME HEALTH OF TAMPA LLC (Home Health Center, about 14 miles away; FORT MYERS, FL)
- CAPE CORAL SOUTH DIALYSIS (Dialysis Facility, about 14 miles away; CAPE CORAL, FL)
Heliports located in Sanibel:
See details about Heliports located in Sanibel, FLColleges/universities with over 2000 students nearest to Sanibel:
- Edison State College (about 15 miles; Fort Myers, FL; Full-time enrollment: 10,649)
- Florida Gulf Coast University (about 20 miles; Fort Myers, FL; FT enrollment: 11,165)
- Hodges University (about 24 miles; Naples, FL; FT enrollment: 2,132)
- State College of Florida-Manatee-Sarasota (about 76 miles; Bradenton, FL; FT enrollment: 8,012)
- Eckerd College (about 97 miles; Saint Petersburg, FL; FT enrollment: 2,437)
- University of South Florida-St Petersburg (about 98 miles; St. Petersburg, FL; FT enrollment: 4,459)
- Hillsborough Community College (about 106 miles; Tampa, FL; FT enrollment: 19,838)
Public elementary/middle school in Sanibel:
- THE SANIBEL SCHOOL (Students: 418, Location: 3840 SANIBEL CAPTIVA RD, Grades: PK-8)
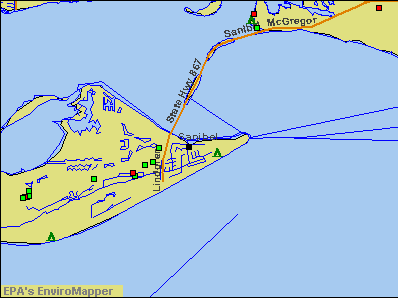
Points of interest:
Notable locations in Sanibel: Sanibel Island Lighthouse (A), Baileys Center (B), Sanibel Fire and Rescue District Station 1 (C), Sanibel Fire and Rescue District Station 2 (D), Lee County Emergency Medical Services (E), Sanibel Police Department (F). Display/hide their locations on the map
Shopping Centers: Periwinkle Place Shopping Center (1), Tahitian Garden Shopping Center (2). Display/hide their locations on the map
Churches in Sanibel include: Tropic Isles Baptist Church (A), Sanibel Community Church (B), First Baptist Church Sanibel (C), Sanibel Congregational United Church of Christ (D). Display/hide their locations on the map
Cemetery: Sanibel Cemetery (1). Display/hide its location on the map
Lakes: Hardworking Bayou (A), Old Blind Pass (B), Clam Bayou (C), Ladyfinger Lake (D), Dinken Bayou (E), Sanibel Bayou (F). Display/hide their locations on the map
Beach: Dixie Beach (A). Display/hide its location on the map
Tourist attractions: The Sanibel-Captiva Conservation Foundation (Nature Centers; 3333 Sanibel Captiva Road) (1), Conservation Center (Nature Centers; 3333 Sanibel Captiva Road) (2), Clinic for the Rehabilitation of Wildlife (Recreation Areas; 3883 Sanibel Captiva Road) (3), Cottages to Castles of Sanibel and Captiva Islands (2427 Periwinkle Way) (4), Adventures in Paradise (Tours & Charters; 14341 Port Comfort Road) (5). Display/hide their approximate locations on the map
Hotels: Brennen's Tarpon Tale Inn (367 Periwinkle Way) (1), Anchor Inn of Sanibel Island (1245 Periwinkle Way) (2), Captiva Island Inn Bed & Breakfast (11509 Andy Rosse Lane) (3), Blue Dolphin Beach Cottages (4227 West Gulf Drive) (4), Beach Road Inn (764 Beach Road) (5), A Team (1539 Periwinkle Way) (6), Colony Resort (419 East Gulf Drive) (7). Display/hide their approximate locations on the map
| This city: | 1.9 people |
| Florida: | 2.5 people |
| This city: | 67.7% |
| Whole state: | 65.2% |
| This city: | 3.6% |
| Whole state: | 7.3% |
Likely homosexual households (counted as self-reported same-sex unmarried-partner households)
- Lesbian couples: 0.5% of all households
- Gay men: 0.4% of all households
Banks with branches in Sanibel (2011 data):
- Sanibel Captiva Community Bank: at 2475 Library Way, branch established on 2003/01/21; Periwinkle Branch at 1037 Periwinkle Way, branch established on 2004/11/08. Info updated 2006/11/03: Bank assets: $224.8 mil, Deposits: $178.1 mil, local headquarters, positive income, Commercial Lending Specialization, 3 total offices
- Wells Fargo Bank, National Association: Sanibel Island Branch at 2407 Palm Ridge Road, branch established on 1934/09/01. Info updated 2011/04/05: Bank assets: $1,161,490.0 mil, Deposits: $905,653.0 mil, headquarters in Sioux Falls, SD, positive income, 6395 total offices, Holding Company: Wells Fargo & Company
- Bank of America, National Association: Sanibel Main Branch at 2450 Periwinkle Way, branch established on 1988/02/04. Info updated 2009/11/18: Bank assets: $1,451,969.3 mil, Deposits: $1,077,176.8 mil, headquarters in Charlotte, NC, positive income, 5782 total offices, Holding Company: Bank Of America Corporation
For population 15 years and over in Sanibel:
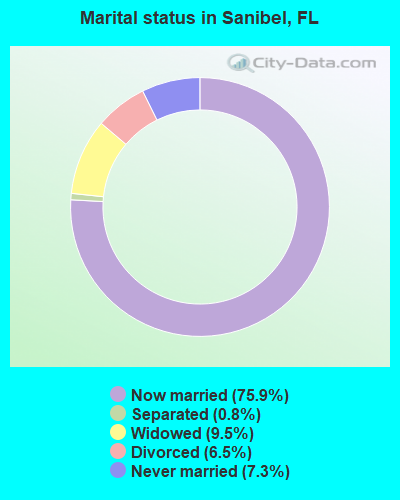
- Never married: 7.3%
- Now married: 75.9%
- Separated: 0.8%
- Widowed: 9.5%
- Divorced: 6.5%
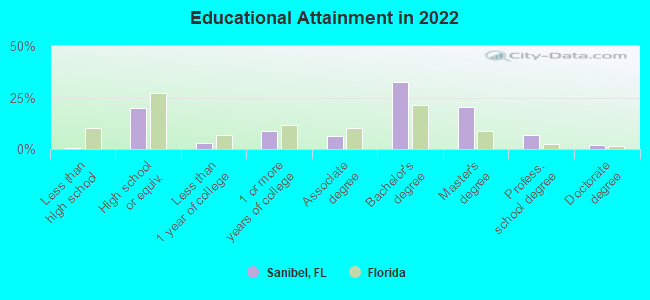
For population 25 years and over in Sanibel:
- High school or higher: 99.4%
- Bachelor's degree or higher: 59.2%
- Graduate or professional degree: 28.1%
- Unemployed: 2.5%
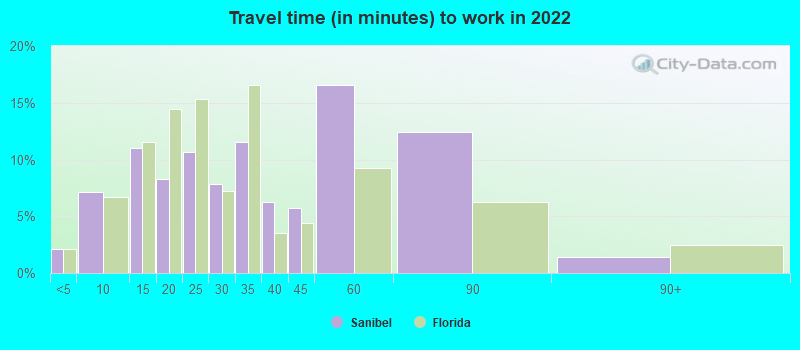
- Mean travel time to work (commute): 12.0 minutes
| Here: | 9.1 |
| Florida average: | 12.2 |
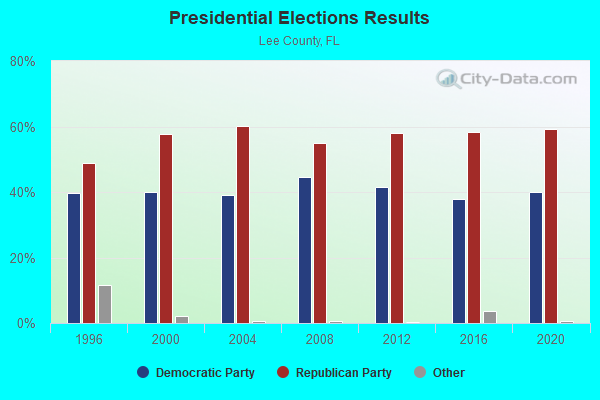
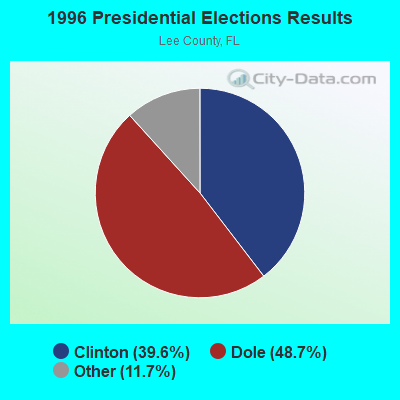
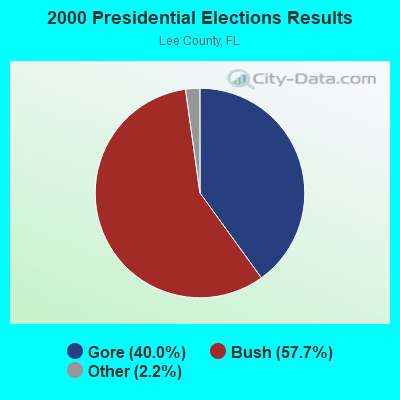
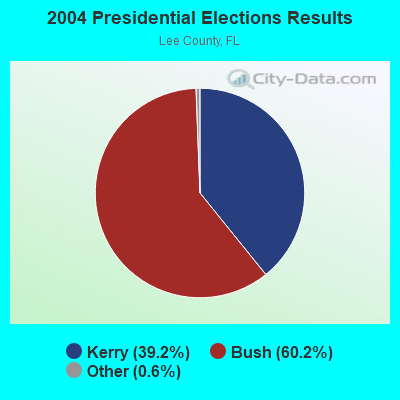
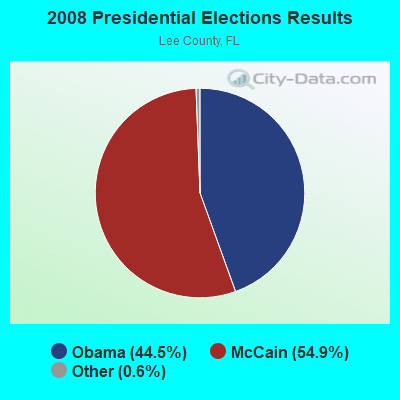
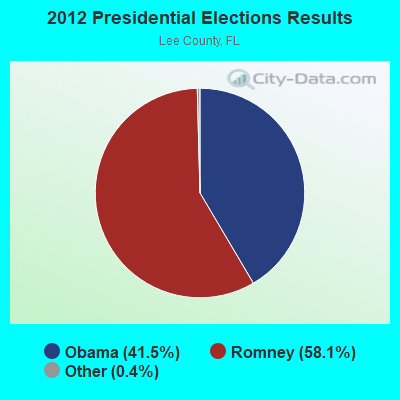

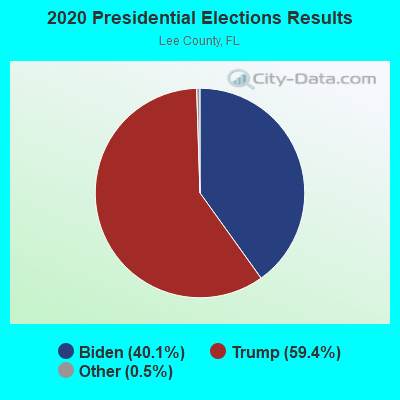
Graphs represent county-level data. Detailed 2008 Election Results
Religion statistics for Sanibel, FL (based on Lee County data)
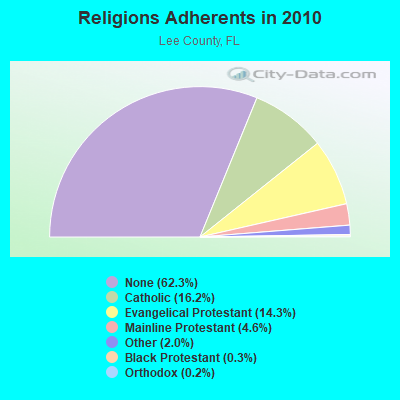

| Religion | Adherents | Congregations |
|---|---|---|
| Catholic | 100,300 | 20 |
| Evangelical Protestant | 88,687 | 288 |
| Mainline Protestant | 28,605 | 62 |
| Other | 12,684 | 45 |
| Black Protestant | 1,919 | 11 |
| Orthodox | 970 | 4 |
| None | 385,589 | - |
Food Environment Statistics:
| Lee County: | 1.96 / 10,000 pop. |
| Florida: | 2.04 / 10,000 pop. |
| This county: | 0.19 / 10,000 pop. |
| State: | 0.11 / 10,000 pop. |
| Lee County: | 0.85 / 10,000 pop. |
| Florida: | 1.28 / 10,000 pop. |
| Here: | 2.84 / 10,000 pop. |
| Florida: | 3.04 / 10,000 pop. |
| Here: | 8.64 / 10,000 pop. |
| Florida: | 7.45 / 10,000 pop. |
| This county: | 10.1% |
| State: | 9.2% |
| This county: | 24.9% |
| Florida: | 23.7% |
| This county: | 15.4% |
| Florida: | 14.0% |
Health and Nutrition:
| Sanibel: | 61.5% |
| Florida: | 51.4% |
| Here: | 57.8% |
| State: | 49.4% |
| Sanibel: | 27.9 |
| Florida: | 28.6 |
| Here: | 13.3% |
| State: | 19.5% |
| Sanibel: | 7.0 |
| Florida: | 6.9 |
| Sanibel: | 32.2% |
| State: | 34.7% |
| Sanibel: | 62.9% |
| State: | 57.0% |
| Here: | 73.1% |
| State: | 79.2% |
More about Health and Nutrition of Sanibel, FL Residents
| Local government employment and payroll (March 2022) | |||||
| Function | Full-time employees | Monthly full-time payroll | Average yearly full-time wage | Part-time employees | Monthly part-time payroll |
|---|---|---|---|---|---|
| Streets and Highways | 31 | $282,644 | $109,411 | 0 | $0 |
| Police Protection - Officers | 26 | $220,214 | $101,637 | 0 | $0 |
| Other Government Administration | 18 | $106,107 | $70,738 | 0 | $0 |
| Financial Administration | 15 | $106,822 | $85,458 | 0 | $0 |
| Sewerage | 14 | $90,434 | $77,515 | 1 | $2,936 |
| Police - Other | 13 | $61,228 | $56,518 | 14 | $24,150 |
| Parks and Recreation | 10 | $46,817 | $56,180 | 13 | $23,712 |
| Natural Resources | 5 | $31,142 | $74,741 | 0 | $0 |
| Other and Unallocable | 5 | $23,360 | $56,064 | 0 | $0 |
| Totals for Government | 137 | $968,768 | $84,856 | 28 | $50,798 |
Sanibel government finances - Expenditure in 2017 (per resident):
- Construction - Regular Highways: $164,000 ($25.30)
- Current Operations - Sewerage: $6,537,000 ($1008.49)
Regular Highways: $4,405,000 ($679.57)
Parking Facilities: $4,131,000 ($637.30)
Police Protection: $4,067,000 ($627.43)
Parks and Recreation: $3,452,000 ($532.55)
Central Staff Services: $3,217,000 ($496.30)
Housing and Community Development: $1,827,000 ($281.86)
General - Other: $1,092,000 ($168.47)
Financial Administration: $995,000 ($153.50)
Protective Inspection and Regulation - Other: $765,000 ($118.02)
Judicial and Legal Services: $555,000 ($85.62)
Natural Resources - Other: $505,000 ($77.91)
Solid Waste Management: $52,000 ($8.02)
Health - Other: $25,000 ($3.86)
- General - Interest on Debt: $884,000 ($136.38)
- Other Capital Outlay - Police Protection: $84,000 ($12.96)
Parks and Recreation: $37,000 ($5.71)
Central Staff Services: $20,000 ($3.09)
Financial Administration: $2,000 ($0.31)
Sanibel government finances - Revenue in 2017 (per resident):
- Charges - Sewerage: $6,609,000 ($1019.59)
Parking Facilities: $2,817,000 ($434.59)
Other: $2,167,000 ($334.31)
Parks and Recreation: $714,000 ($110.15)
Housing and Community Development: $637,000 ($98.27)
Solid Waste Management: $220,000 ($33.94)
Natural Resources - Other: $3,000 ($0.46)
- Federal Intergovernmental - Other: $20,000 ($3.09)
General Local Government Support: $11,000 ($1.70)
- Local Intergovernmental - Highways: $3,355,000 ($517.59)
Other: $865,000 ($133.45)
General Local Government Support: $27,000 ($4.17)
- Miscellaneous - Interest Earnings: $431,000 ($66.49)
Special Assessments: $264,000 ($40.73)
Fines and Forfeits: $244,000 ($37.64)
General Revenue - Other: $226,000 ($34.87)
Rents: $140,000 ($21.60)
Sale of Property: $78,000 ($12.03)
Donations From Private Sources: $30,000 ($4.63)
- State Intergovernmental - General Local Government Support: $750,000 ($115.71)
Highways: $6,000 ($0.93)
- Tax - Property: $10,046,000 ($1549.83)
Motor Fuels Sales: $1,754,000 ($270.60)
Occupation and Business License - Other: $1,238,000 ($190.99)
Other License: $975,000 ($150.42)
Public Utilities Sales: $538,000 ($83.00)
Other Selective Sales: $170,000 ($26.23)
Sanibel government finances - Debt in 2017 (per resident):
- Long Term Debt - Beginning Outstanding - Unspecified Public Purpose: $26,813,000 ($4136.53)
Outstanding Unspecified Public Purpose: $23,490,000 ($3623.88)
Retired Unspecified Public Purpose: $7,904,000 ($1219.38)
Issue, Unspecified Public Purpose: $6,515,000 ($1005.09)
Sanibel government finances - Cash and Securities in 2017 (per resident):
- Bond Funds - Cash and Securities: $2,379,000 ($367.02)
- Other Funds - Cash and Securities: $9,573,000 ($1476.86)
- Sinking Funds - Cash and Securities: $292,000 ($45.05)
10.20% of this county's 2021 resident taxpayers lived in other counties in 2020 ($122,429 average adjusted gross income)
| Here: | 10.20% |
| Florida average: | 8.80% |
0.02% of residents moved from foreign countries ($105 average AGI)
Lee County: 0.02% Florida average: 0.05%
Top counties from which taxpayers relocated into this county between 2020 and 2021:
| from Collier County, FL | |
| from Miami-Dade County, FL | |
| from Broward County, FL |
6.43% of this county's 2020 resident taxpayers moved to other counties in 2021 ($74,267 average adjusted gross income)
| Here: | 6.43% |
| Florida average: | 7.45% |
0.02% of residents moved to foreign countries ($109 average AGI)
Lee County: 0.02% Florida average: 0.04%
Top counties to which taxpayers relocated from this county between 2020 and 2021:
| to Collier County, FL | |
| to Charlotte County, FL | |
| to Hillsborough County, FL |
| Businesses in Sanibel, FL | ||||
| Name | Count | Name | Count | |
|---|---|---|---|---|
| 7-Eleven | 2 | FedEx | 5 | |
| Ace Hardware | 1 | Holiday Inn | 1 | |
| CVS | 1 | MasterBrand Cabinets | 1 | |
| Chico's | 1 | True Value | 1 | |
| Dairy Queen | 1 | UPS | 5 | |
| Dunkin Donuts | 1 | |||
Strongest AM radio stations in Sanibel:
- WPTK (1200 AM; 10 kW; PINE ISLAND CENTER, FL; Owner: FORT MYERS BROADCASTING COMPANY)
- WWCN (770 AM; 10 kW; NORTH FORT MYERS, FL; Owner: WJPT LICENSE LIMITED PARTNERSHIP)
- WMYR (1410 AM; 5 kW; FORT MYERS, FL; Owner: KATHLEEN HECKSHER)
- WJNA (640 AM; 38 kW; ROYAL PALM BEACH, FL; Owner: SOUTH FLORIDA RADIO, INC.)
- WWFE (670 AM; 50 kW; MIAMI, FL; Owner: FENIX BROADCASTING CORP.)
- WAQI (710 AM; 50 kW; MIAMI, FL; Owner: LICENSE CORPORATION #1)
- WNOG (1270 AM; 5 kW; NAPLES, FL; Owner: MERIDIAN BROADCASTING, INC.)
- WMGG (820 AM; 50 kW; LARGO, FL; Owner: MEGA COMMUNICATIONS OF ST. PETERSBURG LICENSEE)
- WFLF (540 AM; 50 kW; PINE HILLS, FL; Owner: CLEAR CHANNEL BROADCASTING LICENSES, INC.)
- WQYK (1010 AM; 50 kW; SEFFNER, FL; Owner: INFINITY BROADCASTING CORPORATION OF TAMPA)
- WVCG (1080 AM; 50 kW; CORAL GABLES, FL; Owner: RADIO ONE LICENSES, LLC)
- WVOI (1480 AM; 10 kW; MARCO ISLAND, FL; Owner: ALL FINANCIAL NETWORK, INC.)
- WCRM (1350 AM; 2 kW; FORT MYERS, FL; Owner: MANNA CHRISTIAN MISSIONS, INC.)
Strongest FM radio stations in Sanibel:
- WRXK-FM (96.1 FM; BONITA SPRINGS, FL; Owner: WRXK LICENSE LIMITED PARTNERSHIP)
- WXKB (103.9 FM; CAPE CORAL, FL; Owner: WXKB LICENSE LIMITED PARTNERSHIP)
- WTLQ-FM (97.7 FM; PUNTA RASSA, FL; Owner: FORT MYERS BROADCASTING COMPANY)
- WWGR (101.9 FM; FORT MYERS, FL; Owner: RENDA BROADCASTING CORP. OF NEVADA)
- WINK-FM (96.9 FM; FORT MYERS, FL; Owner: FORT MYERS BROADCASTING COMPANY)
- WARO (94.5 FM; NAPLES, FL; Owner: MERIDIAN BROADCASTING, INC.)
- WJGO (102.9 FM; TICE, FL; Owner: RENDA BROADCASTING CORPORATION OF NEVADA)
- WNRW (98.5 FM; SAN CARLOS PARK, FL; Owner: BEL MEADE BROADCASTING COMPANY, INC.)
- WSOR (90.9 FM; NAPLES, FL; Owner: THE MOODY BIBLE INSTITUTE OF CHICAGO)
- WBTT (105.5 FM; NAPLES PARK, FL; Owner: CLEAR CHANNEL BROADCASTING LICENSES, INC.)
- WDRR (107.1 FM; LEHIGH ACRES, FL; Owner: CLEAR CHANNEL BROADCASTING LICENSES, INC.)
- WJBX (99.3 FM; FORT MYERS BEACH, FL; Owner: WJBX LICENSE LIMITED PARTNERSHIP)
- WJPT (106.3 FM; FORT MYERS, FL; Owner: WJPT LICENSE LIMITED PARTNERSHIP)
- WOLZ (95.3 FM; FORT MYERS, FL; Owner: CLEAR CHANNEL BROADCASTING LICENSES, INC.)
- WCKT (100.1 FM; PORT CHARLOTTE, FL; Owner: CLEAR CHANNEL BROADCASTING LICENSES, INC.)
- WAVV (101.1 FM; MARCO, FL; Owner: ALPINE BROADCASTING CORP., INC.)
- WIKX (92.9 FM; CHARLOTTE HARBOR, FL; Owner: CITICASTERS LICENSES, L.P.)
- WJYO (91.5 FM; FORT MYERS, FL; Owner: TOCCOA FALLS COLLEGE)
- WGCU-FM (90.1 FM; FT. MYERS, FL; Owner: BOARD OF TRUSTEES, FLORIDA GULF COAST UNIVERSITY)
- WAYJ (88.7 FM; FORT MYERS, FL; Owner: WAY-FM MEDIA GROUP. INC.)
TV broadcast stations around Sanibel:
- WINK-TV (Channel 11; FORT MYERS, FL; Owner: FORT MYERS BROADCASTING COMPANY)
- WZVN-TV (Channel 26; NAPLES, FL; Owner: MONTCLAIR COMMUNICATIONS, INC.)
- WTIG-LP (Channel 2; NAPLES, FL; Owner: TIGER EYE BROADCASTING CORPORATION)
- WTVK (Channel 46; NAPLES, FL; Owner: ACME TELEVISION LICENSES OF FLORIDA, LLC)
- WFTX (Channel 36; CAPE CORAL, FL; Owner: EMMIS TELEVISION LICENSE CORPORATION)
- WRXY-TV (Channel 49; TICE, FL; Owner: WEST COAST CHRISTIAN TELEVISION, INC)
- WBBH-TV (Channel 20; FORT MYERS, FL; Owner: WATERMAN BROADCASTING CORP. OF FLORIDA)
- W22CL (Channel 22; FORT MYERS, FL; Owner: ARKANSAS MEDIA, LLC)
- WDPX-LP (Channel 18; FORT MYERS, FL; Owner: TIGER EYE BROADCASTING CORP.)
- WGCU (Channel 30; FT. MYERS, FL; Owner: BOARD OF TRUSTEES, FLORIDA GULF COAST UNIVERSITY)
- WVEA-TV (Channel 62; VENICE, FL; Owner: ENTRAVISION HOLDINGS, LLC)
- WLZE-LP (Channel 65; FORT MYERS, FL; Owner: TIGER EYE BROADCASTING CORPORATION)
- WTPH-LP (Channel 14; FORT MYERS, FL; Owner: TRI-MEDIA GROUP, INC.)
- WEVU-CA (Channel 4; FORT MYERS, FL; Owner: CALOOSA TELEVISION CORPORATION)
- W56DW (Channel 56; NAPLES, FL; Owner: TRINITY BROADCASTING NETWORK)
- W38CO (Channel 38; FORT MYERS, FL; Owner: TRINITY BROADCASTING NETWORK)
- National Bridge Inventory (NBI) Statistics
- 11Number of bridges
- 758ft / 231mTotal length
- 65,431Total average daily traffic
- 3,577Total average daily truck traffic
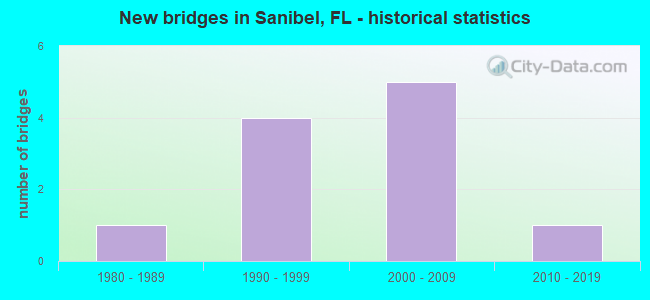
- New bridges - historical statistics
- 11980-1989
- 41990-1999
- 52000-2009
- 12010-2019
FCC Registered Antenna Towers: 22 (See the full list of FCC Registered Antenna Towers)
FCC Registered Private Land Mobile Towers: 1 (See the full list of FCC Registered Private Land Mobile Towers in Sanibel, FL)
FCC Registered Broadcast Land Mobile Towers: 9 (See the full list of FCC Registered Broadcast Land Mobile Towers)
FCC Registered Microwave Towers: 10 (See the full list of FCC Registered Microwave Towers in this town)
FCC Registered Paging Towers: 1 (See the full list of FCC Registered Paging Towers)
FCC Registered Amateur Radio Licenses: 66 (See the full list of FCC Registered Amateur Radio Licenses in Sanibel)
FAA Registered Aircraft: 14 (See the full list of FAA Registered Aircraft in Sanibel)
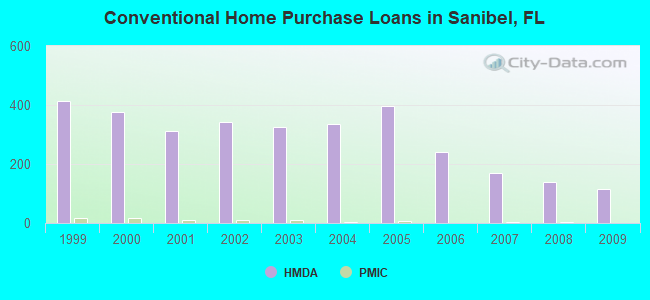
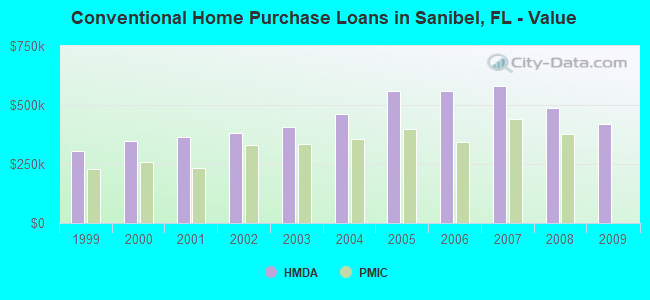
| Home Mortgage Disclosure Act Aggregated Statistics For Year 2009 (Based on 2 full tracts) | ||||||||||||
| A) FHA, FSA/RHS & VA Home Purchase Loans | B) Conventional Home Purchase Loans | C) Refinancings | D) Home Improvement Loans | F) Non-occupant Loans on < 5 Family Dwellings (A B C & D) | G) Loans On Manufactured Home Dwelling (A B C & D) | |||||||
|---|---|---|---|---|---|---|---|---|---|---|---|---|
| Number | Average Value | Number | Average Value | Number | Average Value | Number | Average Value | Number | Average Value | Number | Average Value | |
| LOANS ORIGINATED | 0 | $0 | 114 | $417,596 | 217 | $347,419 | 9 | $257,222 | 185 | $382,551 | 1 | $20,000 |
| APPLICATIONS APPROVED, NOT ACCEPTED | 0 | $0 | 9 | $381,000 | 36 | $369,167 | 0 | $0 | 23 | $330,478 | 0 | $0 |
| APPLICATIONS DENIED | 0 | $0 | 17 | $453,941 | 117 | $351,615 | 0 | $0 | 77 | $334,377 | 0 | $0 |
| APPLICATIONS WITHDRAWN | 1 | $344,000 | 13 | $525,077 | 48 | $368,688 | 2 | $278,500 | 30 | $347,833 | 0 | $0 |
| FILES CLOSED FOR INCOMPLETENESS | 0 | $0 | 0 | $0 | 12 | $511,333 | 1 | $100,000 | 6 | $377,333 | 0 | $0 |
Detailed HMDA statistics for the following Tracts: 0802.01 , 0802.02
| Private Mortgage Insurance Companies Aggregated Statistics For Year 2009 (Based on 1 full tract) | ||||
| B) Refinancings | C) Non-occupant Loans on < 5 Family Dwellings (A & B) | |||
|---|---|---|---|---|
| Number | Average Value | Number | Average Value | |
| LOANS ORIGINATED | 0 | $0 | 0 | $0 |
| APPLICATIONS APPROVED, NOT ACCEPTED | 0 | $0 | 0 | $0 |
| APPLICATIONS DENIED | 1 | $379,000 | 1 | $379,000 |
| APPLICATIONS WITHDRAWN | 0 | $0 | 0 | $0 |
| FILES CLOSED FOR INCOMPLETENESS | 0 | $0 | 0 | $0 |
Detailed PMIC statistics for the following Tracts: 0802.01 , 0802.02
2003 - 2018 National Fire Incident Reporting System (NFIRS) incidents
- Fire incident types reported to NFIRS in Sanibel, FL
- 19848.1%Outside Fires
- 12129.4%Structure Fires
- 5814.1%Mobile Property/Vehicle Fires
- 358.5%Other
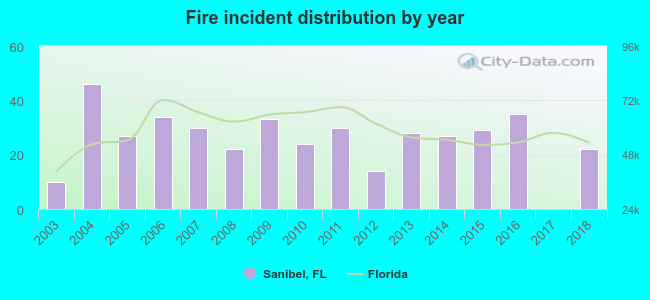 Based on the data from the years 2003 - 2018 the average number of fire incidents per year is 26. The highest number of fire incidents - 46 took place in 2004, and the least - 0 in 2017. The data has a growing trend.
 When looking into fire subcategories, the most reports belonged to: Outside Fires (48.1%), and Structure Fires (29.4%).
Fire-safe hotels and motels in Sanibel, Florida:
- Gulf Breeze Cottages, 1081 Shell Basket Ln, Sanibel, Florida 33957 , Phone: (239) 472-1626, Fax: (239) 472-4664
- Villa Capri Motel, 1245 Periwinkle Way, Sanibel, Florida 33957
- Shalimar Resort, 2823 W Gulf Dr, Sanibel, Florida 33957 , Phone: (239) 472-1353, Fax: (239) 472-6430
- Kona Kai Motel, 1539 Periwinkle Way, Sanibel, Florida 33957
- Sanibel Inn, 937 Gulf Dr, Sanibel, Florida 33957 , Phone: (239) 472-3181, Fax: (239) 472-5234
- Song Of The Sea, 863 E Gulf Dr, Sanibel, Florida 33957 , Phone: (239) 472-2220, Fax: (239) 472-8569
| Most common first names in Sanibel, FL among deceased individuals | ||
| Name | Count | Lived (average) |
|---|---|---|
| William | 56 | 76.5 years |
| John | 56 | 76.5 years |
| Robert | 52 | 76.9 years |
| Mary | 37 | 83.3 years |
| Charles | 31 | 78.2 years |
| James | 29 | 75.1 years |
| Helen | 25 | 83.4 years |
| George | 24 | 76.1 years |
| Edward | 23 | 75.0 years |
| Thomas | 22 | 75.6 years |
| Most common last names in Sanibel, FL among deceased individuals | ||
| Last name | Count | Lived (average) |
|---|---|---|
| Smith | 13 | 77.2 years |
| Jones | 11 | 84.5 years |
| Miller | 10 | 80.9 years |
| Murphy | 8 | 79.0 years |
| Johnson | 6 | 79.5 years |
| Hunter | 6 | 78.2 years |
| Irwin | 6 | 81.7 years |
| Brown | 6 | 76.0 years |
| Simmons | 6 | 80.5 years |
| White | 6 | 74.8 years |
- 93.5%Electricity
- 2.5%Utility gas
- 2.1%Bottled, tank, or LP gas
- 1.9%No fuel used
- 94.7%Electricity
- 2.8%Utility gas
- 2.5%Bottled, tank, or LP gas
Sanibel compared to Florida state average:
- Median household income above state average.
- Median house value significantly above state average.
- Unemployed percentage significantly below state average.
- Black race population percentage significantly below state average.
- Hispanic race population percentage significantly below state average.
- Median age significantly above state average.
- Foreign-born population percentage significantly below state average.
- Renting percentage significantly below state average.
- Length of stay since moving in significantly above state average.
- Number of college students below state average.
- Percentage of population with a bachelor's degree or higher significantly above state average.
Sanibel on our top lists:
- #3 on the list of "Top 101 cities with largest percentage of females in industries: real estate and rental and leasing (population 5,000+)"
- #12 on the list of "Top 101 cities with the most people born in other U.S. states (population 5,000+)"
- #15 on the list of "Top 101 cities with the most users submitting photos to our site per 10,000 residents (population 5,000+)"
- #15 on the list of "Top 101 cities with largest percentage of males in industries: real estate and rental and leasing (population 5,000+)"
- #22 on the list of "Top 101 cities with the highest percentage of workers working at home, population 5,000+"
- #29 on the list of "Top 101 cities with largest percentage of males in occupations: management occupations (population 5,000+)"
- #36 on the list of "Top 101 cities with largest percentage of females in occupations: management occupations (population 5,000+)"
- #42 on the list of "Top 101 cities with largest percentage of females in occupations: fire fighting and prevention workers including supervisors (population 5,000+)"
- #78 on the list of "Top 101 cities with largest percentage of males in industries: health care and social assistance (population 5,000+)"
- #98 on the list of "Top 100 cities with oldest residents"
- #22 (33957) on the list of "Top 101 zip codes with the smallest percentage of returns reporting salary or wage in 2012 (pop 5,000+)"
- #24 (33957) on the list of "Top 101 zip codes with the largest percentage of taxpayers reporting net capital gain/loss in 2012 (pop 5,000+)"
- #28 (33957) on the list of "Top 101 zip codes with the largest percentage of taxpayers reporting taxable interest in 2012 (pop 5,000+)"
- #39 (33957) on the list of "Top 101 zip codes with the largest percentage of taxpayers using charity contributions deductions in 2012 (pop 5,000+)"
- #91 (33957) on the list of "Top 101 zip codes with the highest 2012 average Adjusted Gross Income (AGI) for individuals (pop 5,000+)"
- #13 on the list of "Top 101 counties with the largest decrease in the number of deaths per 1000 residents 2000-2006 to 2007-2013 (pop. 50,000+)"
- #34 on the list of "Top 101 counties with the largest number of people moving in compared to moving out (pop. 50,000+)"
- #37 on the list of "Top 101 counties with the largest number of people without health insurance coverage in 2000 (pop. 50,000+)"
- #43 on the list of "Top 101 counties with the highest ground withdrawal of fresh water for public supply"
- #60 on the list of "Top 101 counties with the largest increase in the number of infant deaths per 1000 residents 2000-2006 to 2007-2013 (pop. 50,000+)"

|
|
Total of 35 patent applications in 2008-2024.