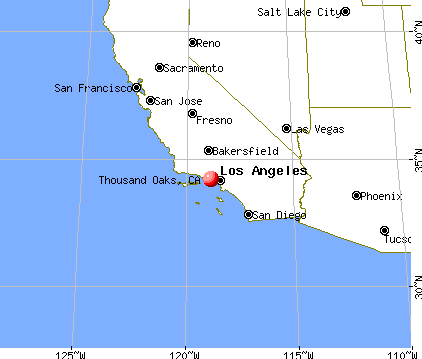
Thousand Oaks, California

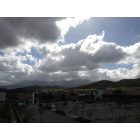
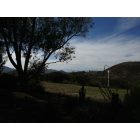
Thousand Oaks: Thousand Oaks Sunset
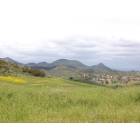
Thousand Oaks: Thousand Oaks, Newbury Park Meadow April 2006
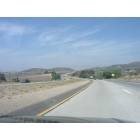
Thousand Oaks: 23N Towards Moorpark
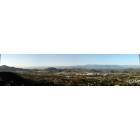
Thousand Oaks: A Panorama of the Newbury Park Area of Thousand Oaks, CA
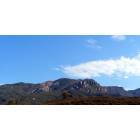
Thousand Oaks: Mounty Boney, Newbury Park - Thousand Oaks, CA
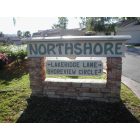
Thousand Oaks: Entrance to the Northshore Community
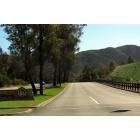
Thousand Oaks: Lynn Road

Thousand Oaks: Borchard road in the morning
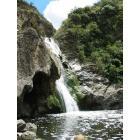
Thousand Oaks: Paradise Falls, Wildwood Park
Thousand Oaks: Dos Vientos shopping area with the Santa Monica Mountains behind
Thousand Oaks: View from the botanical garden
- see
24
more - add
your


Submit your own pictures of this city and show them to the world
- OSM Map
- General Map
- Google Map
- MSN Map
Population change since 2000: +6.2%
 |
| Males: 61,279 | |
| Females: 62,986 |
| Median resident age: | 45.1 years |
| California median age: | 37.9 years |
Zip codes: 91360.
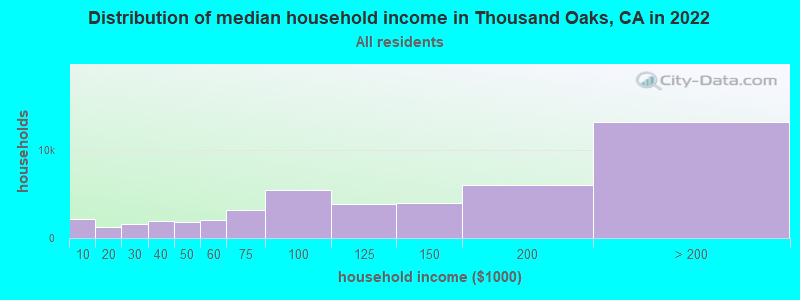
| Thousand Oaks: | $124,811 |
| CA: | $91,551 |
Estimated per capita income in 2022: $62,303 (it was $34,314 in 2000)
Thousand Oaks city income, earnings, and wages data
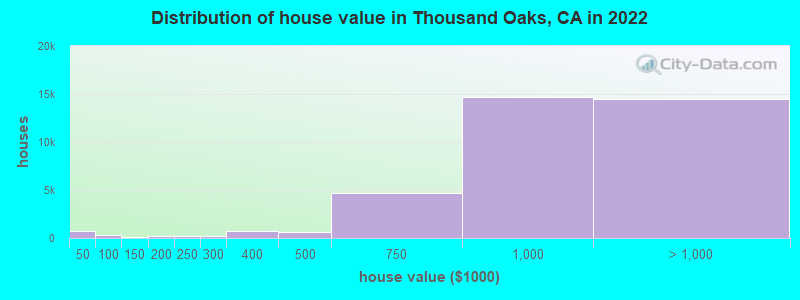
Estimated median house or condo value in 2022: $937,900 (it was $312,900 in 2000)
| Thousand Oaks: | $937,900 |
| CA: | $715,900 |
Mean prices in 2022: all housing units: over $1,000,000; detached houses: over $1,000,000; townhouses or other attached units: $660,869; in 3-to-4-unit structures: $585,677; in 5-or-more-unit structures: $382,001; mobile homes: $222,514
Median gross rent in 2022: $2,334.
(9.2% for White Non-Hispanic residents, 17.6% for Black residents, 9.1% for Hispanic or Latino residents, 23.7% for American Indian residents, 5.8% for Native Hawaiian and other Pacific Islander residents, 15.1% for other race residents, 7.5% for two or more races residents)
Detailed information about poverty and poor residents in Thousand Oaks, CA


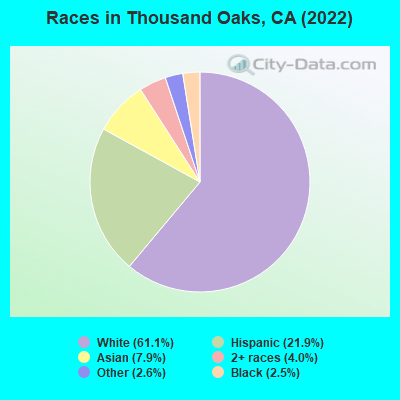
- 75,89261.1%White alone
- 27,27021.9%Hispanic
- 9,7947.9%Asian alone
- 5,0174.0%Two or more races
- 3,2242.6%Other race alone
- 3,0602.5%Black alone
According to our research of California and other state lists, there were 40 registered sex offenders living in Thousand Oaks, California as of April 26, 2024.
The ratio of all residents to sex offenders in Thousand Oaks is 3,223 to 1.
The ratio of registered sex offenders to all residents in this city is much lower than the state average.
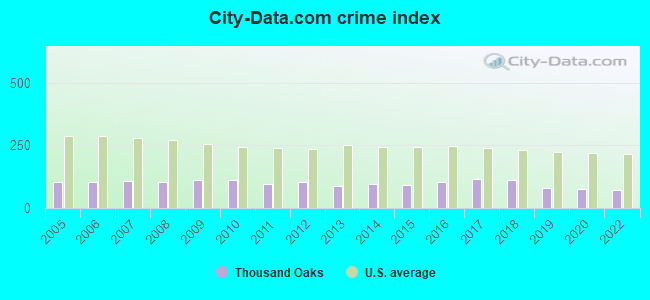
The City-Data.com crime index weighs serious crimes and violent crimes more heavily. Higher means more crime, U.S. average is 246.1. It adjusts for the number of visitors and daily workers commuting into cities.
- means the value is smaller than the state average.- means the value is about the same as the state average.
- means the value is much bigger than the state average.
Crime rate in Thousand Oaks detailed stats: murders, rapes, robberies, assaults, burglaries, thefts, arson
Full-time law enforcement employees in 2015, including police officers: 1 (1 officers - 1 male; 0 female).
| Officers per 1,000 residents here: | 0.01 |
| California average: | 1.98 |
 Recent articles from our blog. Our writers, many of them Ph.D. graduates or candidates, create easy-to-read articles on a wide variety of topics.


 | Thousand Oaks vs Mission Viejo Areas (2 replies) |
| Commuting from Thousand Oaks/Simi Valley to Studio City (4 replies) |
| Pet limits in Ventura? Thousand Oaks specifically (25 replies) |
| Newbury Park vs. Thousand Oaks (28 replies) |
| Air quality in Thousand Oaks (3 replies) |
| MS13 in Thousand Oaks (8 replies) |
Latest news from Thousand Oaks, CA collected exclusively by city-data.com from local newspapers, TV, and radio stations
Ancestries: European (10.2%), English (5.7%), American (5.4%), German (5.3%), Italian (4.3%), Irish (4.2%).
Current Local Time: PST time zone
Elevation: 900 feet
Land area: 54.9 square miles.
Population density: 2,265 people per square mile (low).
23,103 residents are foreign born (7.3% Asia, 6.8% Latin America, 3.0% Europe).
| This city: | 18.5% |
| California: | 26.5% |
Median real estate property taxes paid for housing units with mortgages in 2022: $7,172 (0.8%)
Median real estate property taxes paid for housing units with no mortgage in 2022: $4,631 (0.5%)
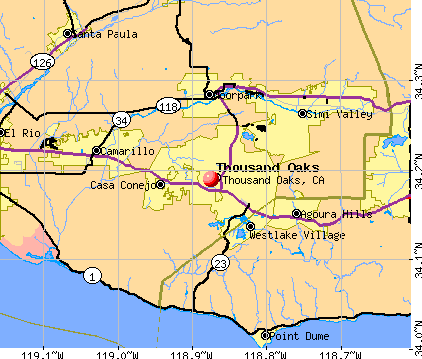
Nearest city with pop. 200,000+: Los Angeles, CA  (29.5 miles , pop. 3,694,820).
Nearest cities:
), ), ), ), ), Latitude: 34.19 N, Longitude: 118.88 W
Daytime population change due to commuting: +10,330 (+8.3%)
Workers who live and work in this city: 32,643 (53.8%)
Area code: 805
Thousand Oaks tourist attractions:
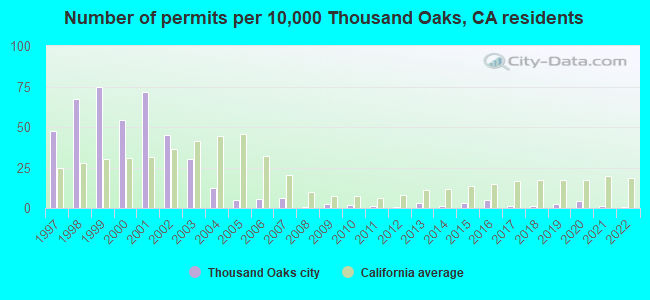
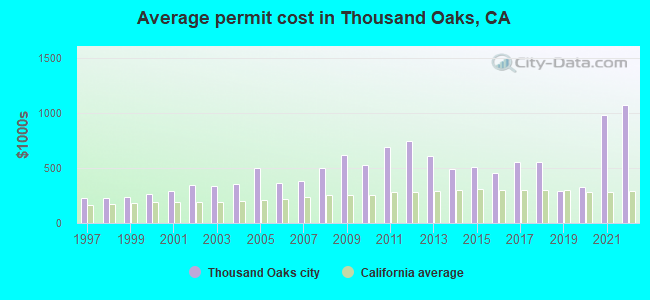
Single-family new house construction building permits:
- 2022: 7 buildings, average cost: $1,073,800
- 2021: 16 buildings, average cost: $982,400
- 2020: 50 buildings, average cost: $331,100
- 2019: 31 buildings, average cost: $293,200
- 2018: 18 buildings, average cost: $553,600
- 2017: 17 buildings, average cost: $553,600
- 2016: 61 buildings, average cost: $459,100
- 2015: 39 buildings, average cost: $507,800
- 2014: 16 buildings, average cost: $489,000
- 2013: 37 buildings, average cost: $609,900
- 2012: 9 buildings, average cost: $745,000
- 2011: 18 buildings, average cost: $690,100
- 2010: 20 buildings, average cost: $525,800
- 2009: 28 buildings, average cost: $613,700
- 2008: 10 buildings, average cost: $499,900
- 2007: 71 buildings, average cost: $383,800
- 2006: 64 buildings, average cost: $364,200
- 2005: 61 buildings, average cost: $497,500
- 2004: 145 buildings, average cost: $354,500
- 2003: 357 buildings, average cost: $335,700
- 2002: 529 buildings, average cost: $340,900
- 2001: 836 buildings, average cost: $287,000
- 2000: 639 buildings, average cost: $268,400
- 1999: 871 buildings, average cost: $237,000
- 1998: 784 buildings, average cost: $225,400
- 1997: 553 buildings, average cost: $223,900
| Here: | 3.9% |
| California: | 5.1% |
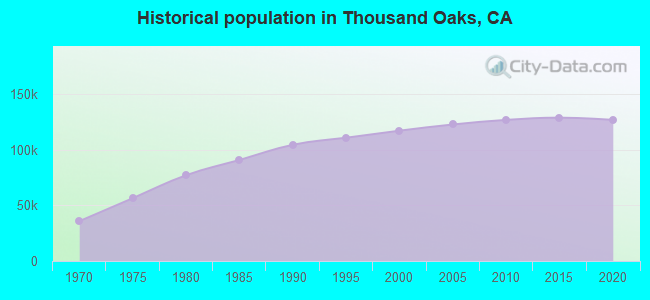
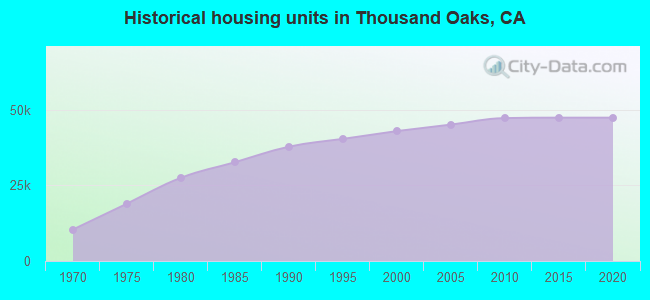
Population change in the 1990s: +12,831 (+12.3%).
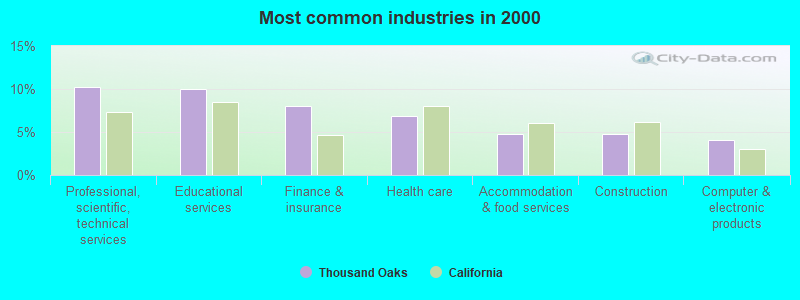
- Professional, scientific, technical services (10.3%)
- Educational services (9.9%)
- Finance & insurance (8.1%)
- Health care (6.8%)
- Accommodation & food services (4.8%)
- Construction (4.8%)
- Computer & electronic products (4.1%)
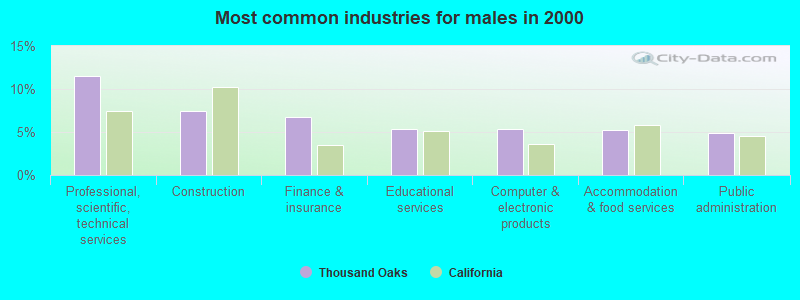
- Professional, scientific, technical services (11.5%)
- Construction (7.4%)
- Finance & insurance (6.8%)
- Educational services (5.4%)
- Computer & electronic products (5.3%)
- Accommodation & food services (5.2%)
- Public administration (4.9%)
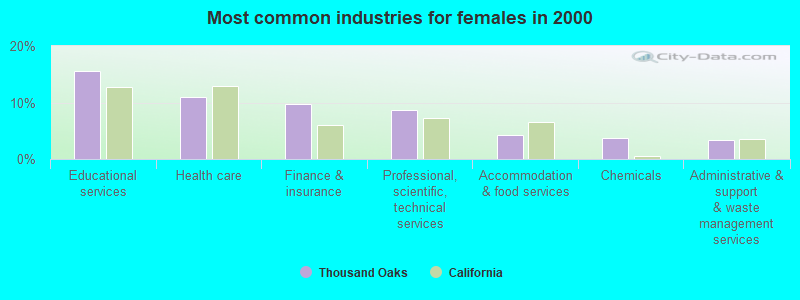
- Educational services (15.6%)
- Health care (11.0%)
- Finance & insurance (9.7%)
- Professional, scientific, technical services (8.8%)
- Accommodation & food services (4.3%)
- Chemicals (3.6%)
- Administrative & support & waste management services (3.4%)
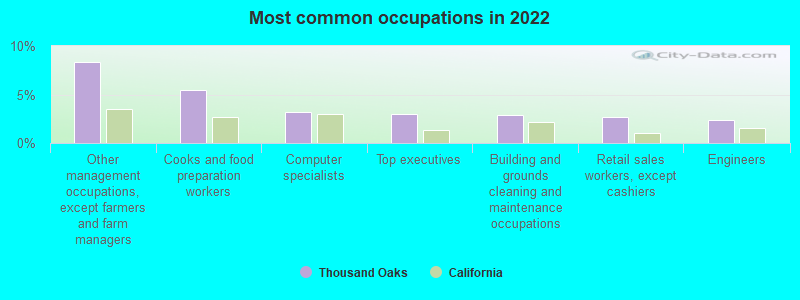
- Other management occupations, except farmers and farm managers (8.4%)
- Cooks and food preparation workers (5.5%)
- Computer specialists (3.2%)
- Top executives (3.0%)
- Building and grounds cleaning and maintenance occupations (2.9%)
- Retail sales workers, except cashiers (2.7%)
- Engineers (2.4%)
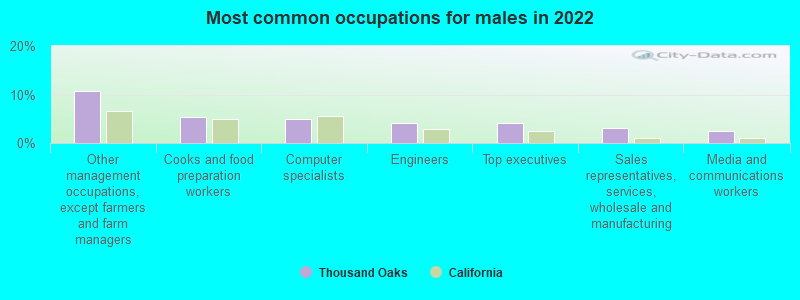
- Other management occupations, except farmers and farm managers (10.6%)
- Cooks and food preparation workers (5.3%)
- Computer specialists (4.9%)
- Engineers (4.1%)
- Top executives (4.1%)
- Sales representatives, services, wholesale and manufacturing (3.0%)
- Media and communications workers (2.5%)
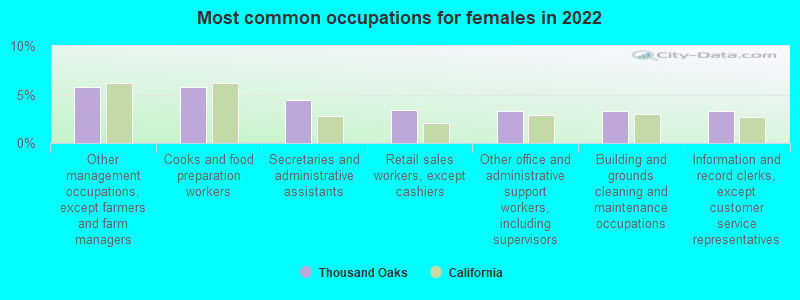
- Other management occupations, except farmers and farm managers (5.8%)
- Cooks and food preparation workers (5.7%)
- Secretaries and administrative assistants (4.4%)
- Retail sales workers, except cashiers (3.4%)
- Other office and administrative support workers, including supervisors (3.3%)
- Building and grounds cleaning and maintenance occupations (3.3%)
- Information and record clerks, except customer service representatives (3.3%)
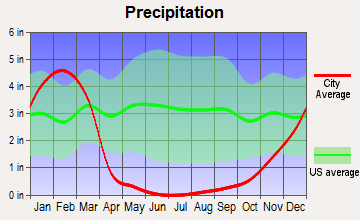
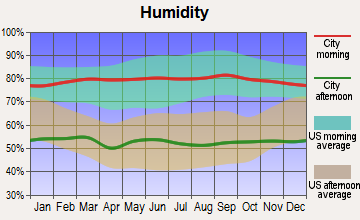
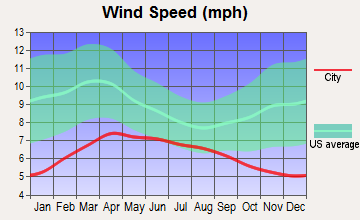
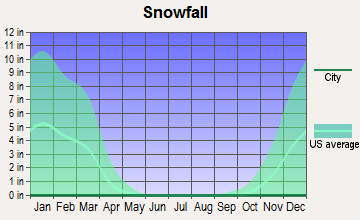
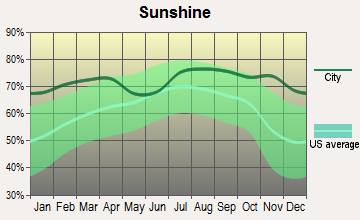
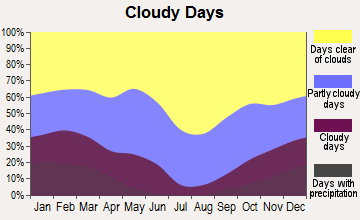
Average climate in Thousand Oaks, California
Based on data reported by over 4,000 weather stations

|
|


(lower is better)
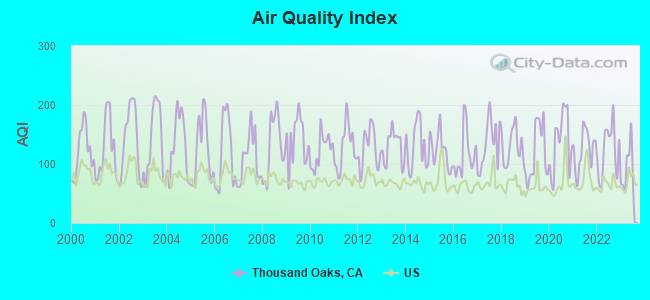
Air Quality Index (AQI) level in 2023 was 93.0. This is worse than average.
| City: | 93.0 |
| U.S.: | 72.6 |
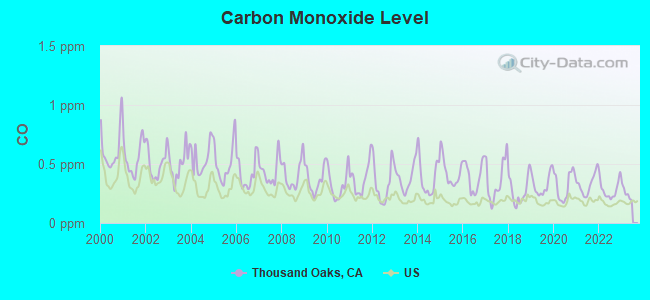
Carbon Monoxide (CO) [ppm] level in 2022 was 0.284. This is about average. Closest monitor was 9.5 miles away from the city center.
| City: | 0.284 |
| U.S.: | 0.251 |
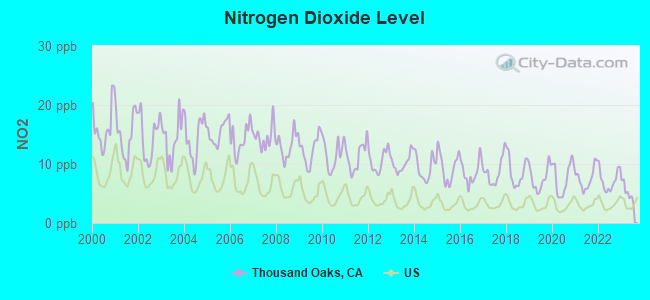
Nitrogen Dioxide (NO2) [ppb] level in 2023 was 5.29. This is about average. Closest monitor was 1.5 miles away from the city center.
| City: | 5.29 |
| U.S.: | 5.11 |
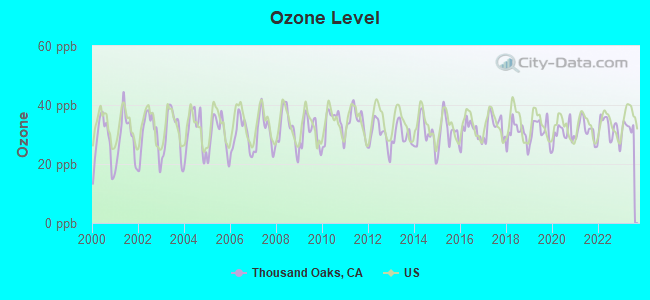
Ozone [ppb] level in 2023 was 32.5. This is about average. Closest monitor was 1.5 miles away from the city center.
| City: | 32.5 |
| U.S.: | 33.3 |
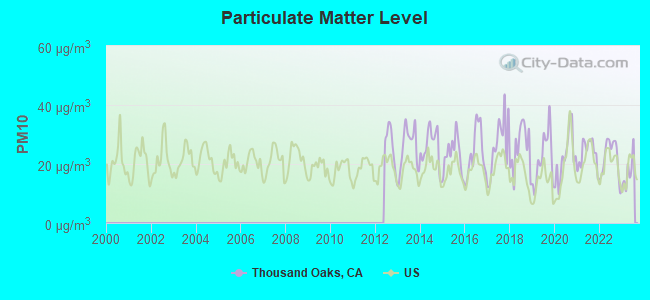
Particulate Matter (PM10) [µg/m3] level in 2023 was 17.1. This is about average. Closest monitor was 1.5 miles away from the city center.
| City: | 17.1 |
| U.S.: | 19.2 |
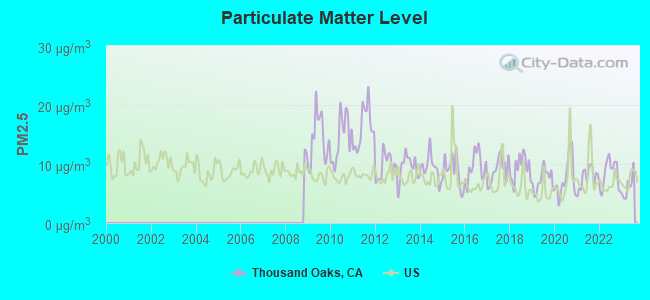
Particulate Matter (PM2.5) [µg/m3] level in 2023 was 6.18. This is better than average. Closest monitor was 1.5 miles away from the city center.
| City: | 6.18 |
| U.S.: | 8.11 |
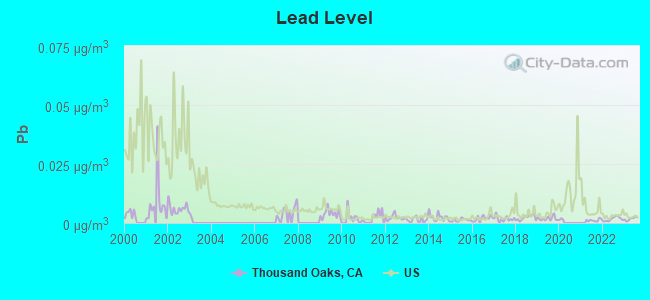
Lead (Pb) [µg/m3] level in 2023 was 0.00179. This is significantly better than average. Closest monitor was 9.5 miles away from the city center.
| City: | 0.00179 |
| U.S.: | 0.00931 |
Earthquake activity:
Thousand Oaks-area historical earthquake activity is significantly above California state average. It is 6815% greater than the overall U.S. average.On 7/21/1952 at 11:52:14, a magnitude 7.7 (7.7 UK, Class: Major, Intensity: VIII - XII) earthquake occurred 56.5 miles away from the city center, causing $50,000,000 total damage
On 6/28/1992 at 11:57:34, a magnitude 7.6 (6.2 MB, 7.6 MS, 7.3 MW, Depth: 0.7 mi) earthquake occurred 134.1 miles away from Thousand Oaks center, causing 3 deaths (1 shaking deaths, 2 other deaths) and 400 injuries, causing $100,000,000 total damage and $40,000,000 insured losses
On 11/4/1927 at 13:51:53, a magnitude 7.5 (7.5 UK) earthquake occurred 132.7 miles away from Thousand Oaks center
On 10/16/1999 at 09:46:44, a magnitude 7.4 (6.3 MB, 7.4 MS, 7.2 MW, 7.3 ML) earthquake occurred 141.1 miles away from Thousand Oaks center
On 1/17/1994 at 12:30:55, a magnitude 6.8 (6.4 MB, 6.8 MS, 6.7 MW, Depth: 11.4 mi, Class: Strong, Intensity: VII - IX) earthquake occurred 17.3 miles away from the city center, causing 60 deaths (60 shaking deaths) and 7000 injuries
On 4/21/1918 at 22:32:30, a magnitude 6.8 (6.8 UK) earthquake occurred 86.3 miles away from the city center
Magnitude types: body-wave magnitude (MB), local magnitude (ML), surface-wave magnitude (MS), moment magnitude (MW)
Natural disasters:
The number of natural disasters in Ventura County (36) is a lot greater than the US average (15).Major Disasters (Presidential) Declared: 24
Emergencies Declared: 2
Causes of natural disasters: Fires: 17, Floods: 16, Storms: 10, Landslides: 5, Mudslides: 4, Winter Storms: 4, Freezes: 2, Heavy Rains: 2, Earthquake: 1, Hurricane: 1, Snow: 1, Tornado: 1, Wind: 1, Other: 1 (Note: some incidents may be assigned to more than one category).

Main business address for: WELLPOINT HEALTH NETWORKS INC /DE/ (HOSPITAL & MEDICAL SERVICE PLANS), AMGEN INC (BIOLOGICAL PRODUCTS (NO DIAGNOSTIC SUBSTANCES)).
Hospitals in Thousand Oaks:
- LOS ROBLES HOSPITAL & MEDICAL CENTER (Proprietary, provides emergency services, 215 W JANSS RD)
- PROFESSIONAL HOME HEALTH HOSPICE (60 RANCHO ROAD SUITE 27)
- THOUSAND OAKS SURGICAL HOSPITAL (401 ROLLING OAKS DR)
Nursing Homes in Thousand Oaks:
- LOS ROBLES HOSPITAL AND MEDICAL CENTER D/P SNF (150 VIA MERIDA)
- OAKVIEW AT UNIVERSITY VILLAGE (3557 CAMPUS DR)
- THOUSAND OAKS HEALTHCARE CENTER (93 W AVENIDA DE LOS ARBOLES)
Dialysis Facilities in Thousand Oaks:
- DAVITA-DIALYSIS CENTER OF THOUSAND OAKS (375 ROLLING OAKS DRIVE, SUITE 100)
- FMC-CONEJO VALLEY RENAL CENTER (227 W. JANSS ROAD, SUITE 115)
Home Health Centers in Thousand Oaks:
- ACA HOME HEALTH CARE INC (223 E THOUSAND OAKS BLVD STE 407)
- ACCESS HOME HEALTH CARE LLC (455 E THOUSAND OAKS BLVD STE 105)
- ALLEVIATION HEALTHCARE SERVICES, INC (1429 E THOUSAND OAKS BLVD, STE 207)
- ALLIED HEALTHCARE PROFESSIONALS INC (100 MOODY COURT, SUITE 110)
- FLORENCE HOME HEALTH CARE (2521 E THOUSAND OAKS BLVD)
- LOS ROBLES HOME CARE SERVICES INC (68 LONG COURT STE 2C)
- ORCHID HOME HEALTH SERVICES INC (299 W HILLCREST DR STE 114)
- WEST COAST NURSING VENTURA INC (2955 E HILLCREST DR STE 121)
Heliports located in Thousand Oaks:
- East Valley Sheriff's Station Heliport (6CA4)
- Los Angeles County Fire Department Heliport (1CA9)
- Los Robles Regional Medical Center Heliport (CL82)
Amtrak stations near Thousand Oaks:
- 7 miles: MOORPARK (300 HIGH ST.) . Services: free short-term parking, public transit connection.
- 10 miles: CAMARILLO (30 LEWIS RD.) . Services: public payphones, public transit connection.
- 12 miles: SIMI VALLEY (5000 E. LOS ANGELES AVE.) . Services: public payphones, free short-term parking, call for taxi service, public transit connection.
College/University in Thousand Oaks:
Other colleges/universities with over 2000 students near Thousand Oaks:
- Moorpark College (about 8 miles; Moorpark, CA; Full-time enrollment: 9,338)
- California State University-Channel Islands (about 10 miles; Camarillo, CA; FT enrollment: 4,163)
- Pepperdine University (about 15 miles; Malibu, CA; FT enrollment: 6,722)
- Oxnard College (about 17 miles; Oxnard, CA; FT enrollment: 3,879)
- Los Angeles Pierce College (about 18 miles; Woodland Hills, CA; FT enrollment: 10,996)
- California State University-Northridge (about 21 miles; Northridge, CA; FT enrollment: 28,060)
- Ventura College (about 22 miles; Ventura, CA; FT enrollment: 8,460)
Public high schools in Thousand Oaks:
- THOUSAND OAKS HIGH (Students: 1,792, Location: 2323 N. MOORPARK RD., Grades: 9-12)
- CENTURY ACADEMY (Students: 1, Location: 1025 OLD FARM SCH RD., Grades: 6-12)
Private high schools in Thousand Oaks:
Biggest public elementary/middle schools in Thousand Oaks:
- COLINA MIDDLE (Students: 1,126, Location: 1500 E. HILLCREST DR., Grades: 6-8)
- LOS CERRITOS MIDDLE (Students: 1,039, Location: 2100 AVENIDA DE LAS FLORES, Grades: 6-8)
- LANG RANCH (Students: 508, Location: 2450 WHITECHAPEL PL., Grades: KG-5)
- MADRONA ELEMENTARY (Students: 383, Location: 612 CAMINO MANZANAS, Grades: KG-5)
- CONEJO ELEMENTARY (Students: 329, Location: 280 N. CONEJO SCH RD., Grades: KG-5)
- ASPEN ELEMENTARY (Students: 312, Location: 1870 OBERLIN AVE., Grades: KG-5)
- LADERA ELEMENTARY (Students: 268, Location: 1211 CALLE ALMENDRO, Grades: KG-5)
- WEATHERSFIELD ELEMENTARY (Students: 236, Location: 3151 DARLINGTON DR., Grades: KG-5)
- MEADOWS ARTS AND TECHNOLOGY ELEMENTARY (Students: 201, Location: 2000 LA GRANADA DR., Grades: KG-5, Charter school)
- REDWOOD MIDDLE (Location: 233 W. GAINSBOROUGH RD., Grades: 6-8)
Private elementary/middle schools in Thousand Oaks:
- ST PASCHAL BAYLON SCHOOL (Students: 326, Location: 154 E JANSS RD, Grades: KG-8)
- PINECREST SCHOOL-THOUSAND OAKS (Students: 282, Location: 449 E WILBUR RD, Grades: PK-5)
- ASCENSION LUTHERAN SCHOOL (Students: 198, Location: 1600 E HILLCREST DR, Grades: KG-8)
- BETHANY CHRISTIAN SCHOOL (Students: 162, Location: 200 BETHANY CT, Grades: KG-6)
- ST PATRICK'S EPISCOPAL DAY SCHOOL (Students: 124, Location: 1 CHURCH RD, Grades: KG-6)
- LITTLE OAKS SCHOOL (Students: 84, Location: 101 N SKYLINE DR, Grades: PK-5)
- CONEJO JEWISH DAY SCHOOL (Students: 79, Location: 1080 E JANS RD, Grades: KG-8)
- CHILDREN'S LEARNING CENTER MONTESSORI (Students: 20, Location: 2993 CRESCENT WAY, Grades: UG-1)
User-submitted facts and corrections:
- Churches should include my church CVCC Conejo Valley Congregational Church 750 Erbes Road Thousand Oaks, Ca. 91362 (805)381-0484
- Biggest Public Middle Schools in Thousand Oaks: Los Cerritos (Students: 1166) Colina (Students: 1147) Sequoia (Students:1137 Location: 2855 Borchard Road Grades 6-8) Redwood (Students: 1105) Sycamore Canyon (Students: 383 4601 Via Rio Grades 6-8) Sequoia and Sycamore Canyon have a mailing address of Newbury Park which is part of The City of Thousand Oaks.
- There is another public High School in Thousand Oaks: Newbury Park High School, established in 1967 is located in the area of Thousand Oaks known as Newbury Park. Students: 2150, Faculty: 101, staff: 62, Athletic Teams: 45, Clubs/Organizations: 34. (As of 2006)
Points of interest:
Notable locations in Thousand Oaks: Lang Ranch (A), Sunset Hills Country Club (B), Olsen Road Water Reclamation Plant (C), North Ranch Country Club (D), Lakeview Canyon Golf Course (E), Hill Canyon Treatment Plant (F), Los Robles Greens Country Club (G), Stage Coach Inn Museum (H), Rockwell International Science Center Library (I), Rockwell International Science Center (J), Conejo Valley Community Center (K), Cameron Center (L), Arts Council Center (M), Thousand Oaks Library (N), Thousand Oask Community Center (O), Old Meadows Community Center (P), North Ranch Area Community Center (Q), Goebel Senior Adult Center (R), Conejo Valley School District Office (S), Newbury Park Library (T). Display/hide their locations on the map
Shopping Centers: Westoaks-Hampshire Shopping Center (1), Westlake Plaza Shopping Center (2), Village Square Shopping Center (3), Village Court Shopping Center (4), Oaks Shopping Center (5), Evergreens Shopping Center (6), Sunset Plaza Shopping Center (7), Sun Plaza Shopping Center (8), Skyline Plaza Shopping Center (9). Display/hide their locations on the map
Main business address in Thousand Oaks include: WELLPOINT HEALTH NETWORKS INC /DE/ (A), AMGEN INC (B). Display/hide their locations on the map
Churches in Thousand Oaks include: Christ the King Lutheran Church (A), Conejo Valley Church of the Nazarene (B), Evangelical Free Church of the Conejo Valley (C), First Christian Church of Newbury Park (D), King of Glory Lutheran Church (E), Seventh Day Adventist Church (F), Church of Christ (G), Conejo Valley Baptist Church (H), First Baptist Church (I). Display/hide their locations on the map
Cemetery: Olson Cemetery (1). Display/hide its location on the map
Reservoir: Lake Eleanor (A). Display/hide its location on the map
Streams, rivers, and creeks: South Branch Arroyo Conejo (A), North Fork Arroyo Conejo (B), Lake Eleanor Creek (C). Display/hide their locations on the map
Parks in Thousand Oaks include: Arroyo Conejo Open Space (1), Banyan Park (2), Borchard Community Park (3), Cypress Park (4), Fort Wildwood Park (5), Hickory Park (6), Peppertree Playfield (7), Potrero Open Space (8), Rancho Conejo Open Space (9). Display/hide their locations on the map
Tourist attractions: Conejo Valley Botanic (Botanical Gardens; Po Box 1382) (1), Chumash Interpretive Center (Cultural Attractions- Events- & Facilities; 3290 Lang Ranch Parkway) (2). Display/hide their approximate locations on the map
Hotels: Best Western Oaks Lodge (12 Conejo Boulevard) (1), Best Western Thousand Oaks Inn (75 West Thousand Oaks Boulevard) (2), Best Value Inn - Thousand Oaks (Bv) (2850 Camino Dos Rios) (3). Display/hide their approximate locations on the map
Birthplace of: Jimmy Clausen - Football quarterback, Amanda Bynes - (born 1986), teen actress, Steve Connell - Activist, Tommy Walter - Musician and songwriter, Bryan Anderson (baseball) - Baseball player, Chance Myers - Soccer player, Taylor Knox - Surfer, Andrew Moore - College basketball player (USC Trojans), Berry Henson - Professional golfer, Casey Clausen - Football player.
Drinking water stations with addresses in Thousand Oaks and their reported violations in the past:
OAKS CAMPGROUND #1 (Serves MI, Population served: 75, Groundwater):Past monitoring violations:
- One regular monitoring violation
Drinking water stations with addresses in Thousand Oaks that have no violations reported:
- SANTA MONICA MT. REC AREA - CIRCLE X (Population served: 31, Primary Water Source Type: Groundwater)
- CALLEGUAS MUNICIPAL WATER DIST (Population served: 0, Primary Water Source Type: Surface water)
| This city: | 2.7 people |
| California: | 2.9 people |
| This city: | 72.8% |
| Whole state: | 68.7% |
| This city: | 4.5% |
| Whole state: | 7.2% |
Likely homosexual households (counted as self-reported same-sex unmarried-partner households)
- Lesbian couples: 0.3% of all households
- Gay men: 0.3% of all households
People in group quarters in Thousand Oaks in 2010:
- 1,210 people in college/university student housing
- 348 people in nursing facilities/skilled-nursing facilities
- 91 people in other noninstitutional facilities
- 51 people in workers' group living quarters and job corps centers
- 28 people in group homes intended for adults
- 9 people in residential treatment centers for adults
- 4 people in correctional residential facilities
People in group quarters in Thousand Oaks in 2000:
- 875 people in college dormitories (includes college quarters off campus)
- 634 people in other noninstitutional group quarters
- 253 people in nursing homes
- 89 people in other group homes
- 59 people in religious group quarters
- 24 people in homes for the mentally retarded
- 17 people in local jails and other confinement facilities (including police lockups)
Banks with most branches in Thousand Oaks (2011 data):
- U.S. Bank National Association: Avenida De Las Arboles Vons Branch, Thousand Oaks Ralphs Branch, Lindero Canyon Pavilions Branch, North Moorpark Road Vons Branch. Info updated 2012/01/30: Bank assets: $330,470.8 mil, Deposits: $236,091.5 mil, headquarters in Cincinnati, OH, positive income, 3121 total offices, Holding Company: U.S. Bancorp
- Bank of America, National Association: Oaks Mall Branch, Thousand Oaks Branch, North Ranch Pavillions Branch, Oakbrook Branch. Info updated 2009/11/18: Bank assets: $1,451,969.3 mil, Deposits: $1,077,176.8 mil, headquarters in Charlotte, NC, positive income, 5782 total offices, Holding Company: Bank Of America Corporation
- Wells Fargo Bank, National Association: Moorpark And Janss, Oakbrook Branch, Thousand Oaks Branch. Info updated 2011/04/05: Bank assets: $1,161,490.0 mil, Deposits: $905,653.0 mil, headquarters in Sioux Falls, SD, positive income, 6395 total offices, Holding Company: Wells Fargo & Company
- JPMorgan Chase Bank, National Association: Thousand Oaks - Moorpark Road Branch, Avenida De Los Arboles And Erbes Bra, Thousand Oaks Branch. Info updated 2011/11/10: Bank assets: $1,811,678.0 mil, Deposits: $1,190,738.0 mil, headquarters in Columbus, OH, positive income, International Specialization, 5577 total offices, Holding Company: Jpmorgan Chase & Co.
- OneWest Bank, FSB: Thousand Oaks Branch at 215 E. Thousand Oaks Blvd., branch established on 2008/07/11; Thousand Oaks Branch at 475 E Avenida De Los Arboles, branch established on 2008/11/17. Info updated 2011/07/21: Bank assets: $26,181.3 mil, Deposits: $15,408.4 mil, headquarters in Pasadena, CA, positive income, 79 total offices
- Bank of the West: Thousand Oaks Branch at 180 North Moorpark Road, branch established on 1998/03/23. Info updated 2009/11/16: Bank assets: $62,408.3 mil, Deposits: $43,995.2 mil, headquarters in San Francisco, CA, positive income, 647 total offices, Holding Company: Bnp Paribas
- Santa Barbara Bank & Trust, National Association: Thousand Oaks Branch at 33 West Thousand Oaks Boulevard, branch established on 1987/07/02. Info updated 2011/06/09: Bank assets: $5,847.9 mil, Deposits: $4,684.3 mil, headquarters in Santa Barbara, CA, positive income, Commercial Lending Specialization, 48 total offices, Holding Company: Sb Acquisition Company, Llc
- First California Bank: Thousand Oaks Branch at 11-A E Hillcrest Drive, branch established on 2003/10/15. Info updated 2011/02/22: Bank assets: $1,813.2 mil, Deposits: $1,428.5 mil, headquarters in Westlake Village, CA, positive income, Commercial Lending Specialization, 22 total offices, Holding Company: First California Financial Group, Inc.
- Pacific Western Bank: Thousand Oaks Branch at 550 N. Moorpark Road, branch established on 2007/12/03. Info updated 2011/03/14: Bank assets: $5,513.1 mil, Deposits: $4,614.5 mil, headquarters in Los Angeles, CA, positive income, Commercial Lending Specialization, 78 total offices, Holding Company: Capgen Capital Group Ii Lp
- 4 other banks with 4 local branches
For population 15 years and over in Thousand Oaks:
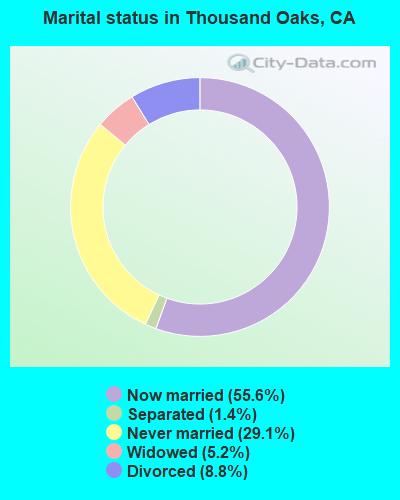
- Never married: 29.1%
- Now married: 55.6%
- Separated: 1.4%
- Widowed: 5.2%
- Divorced: 8.8%
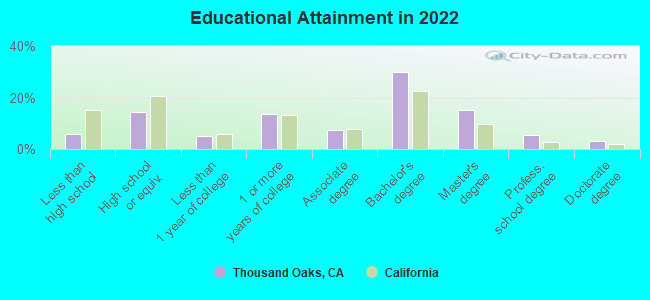
For population 25 years and over in Thousand Oaks:
- High school or higher: 94.2%
- Bachelor's degree or higher: 53.9%
- Graduate or professional degree: 23.9%
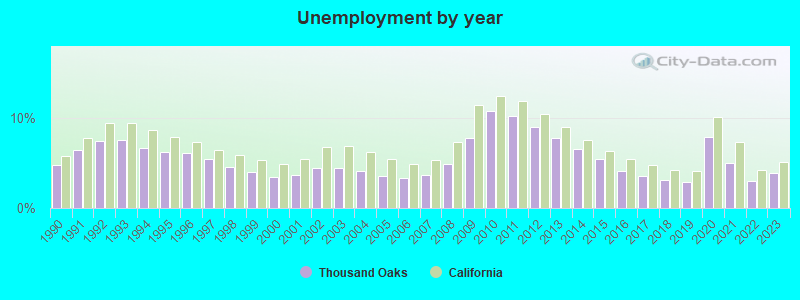
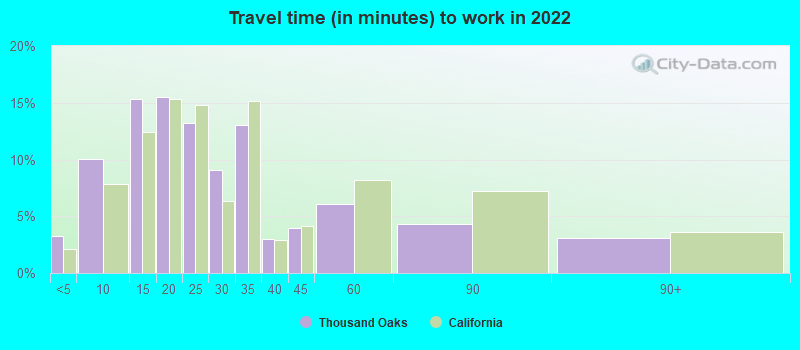
- Unemployed: 3.8%
- Mean travel time to work (commute): 18.6 minutes

| Here: | 11.2 |
| California average: | 15.5 |
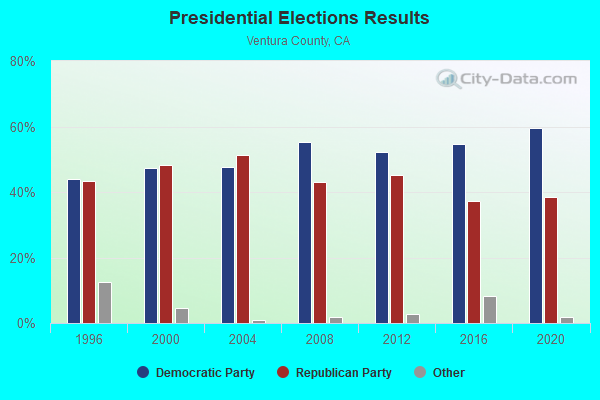
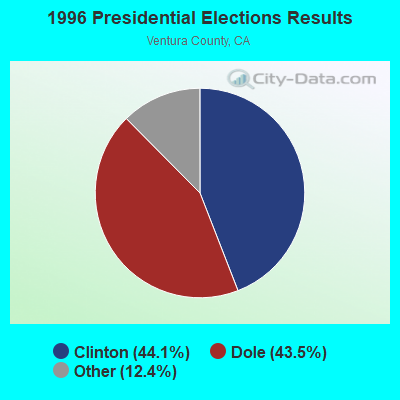
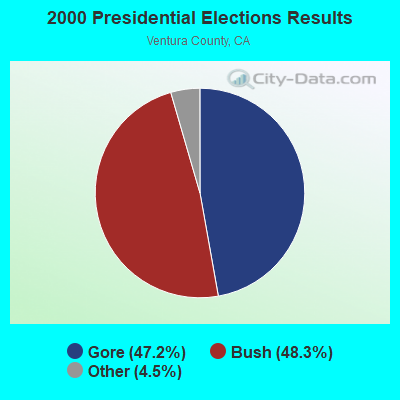
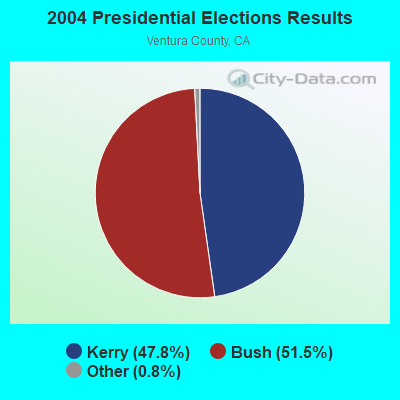
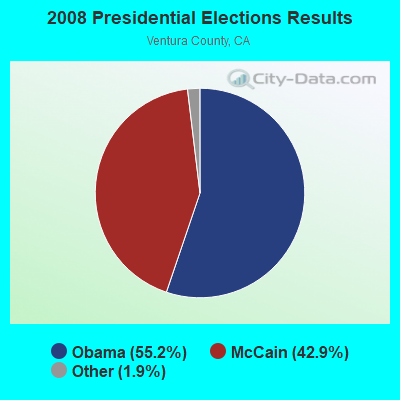
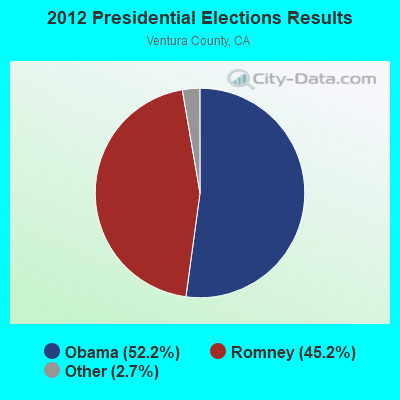
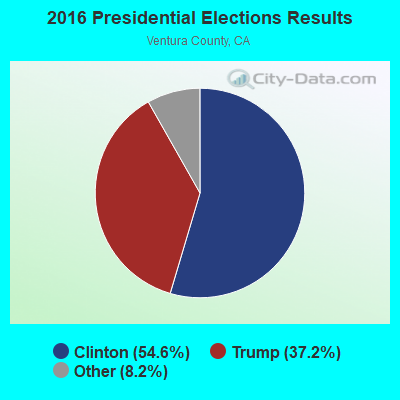
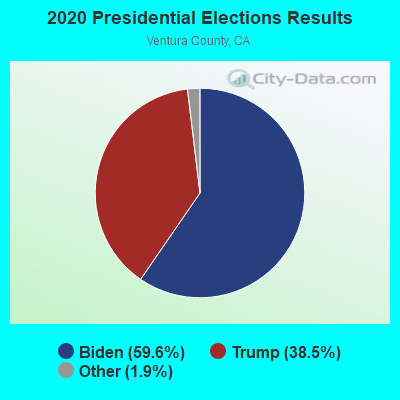
Graphs represent county-level data. Detailed 2008 Election Results
Neighborhoods in Thousand Oaks:
(Thousand Oaks, California Neighborhood Map)- Braemar Garden Homes neighborhood
- Braemar North Ranch neighborhood
- Brock Collection neighborhood
- Camelot neighborhood
- Casa de Oaks neighborhood
- Central Thousand Oaks neighborhood
- Chanteclair neighborhood
- Club View neighborhood
- Conejo Oaks neighborhood
- Country Club Estates neighborhood
- Downtown Thousand Oaks neighborhood
- East Hill neighborhood
- Emerald Forest neighborhood
- Fairgreen neighborhood
- Fairway Homes neighborhood
- Fairway Oaks neighborhood
- Fountainwood neighborhood
- Hidden Canyon neighborhood
- High Country neighborhood
- Hillcrest Terrace neighborhood
- Hillview neighborhood
- Island Forest neighborhood
- Kensington Park neighborhood
- Kevington neighborhood
- Las Flores Villas neighborhood
- Lynn Ranch neighborhood
- Lynn Ranch North neighborhood
- Lynn Shadows neighborhood
- Mapleknoll neighborhood
- Monte Sereno neighborhood
- Northoaks neighborhood
- Northwood neighborhood
- Oakbrook Townhomes neighborhood
- Oakbrook Village neighborhood
- Racquet Club Villas neighborhood
- Ranch View Estates neighborhood
- Ridgecrest neighborhood
- Signature Collection neighborhood
- Sunset Hills neighborhood
- Symphony of the Hill neighborhood
- The Groves neighborhood
- Town Oaks neighborhood
- Val D'Or neighborhood
- Verdigris neighborhood
- West Hill neighborhood
- Westlake Ranch neighborhood
- Westlake Village neighborhood
- Wildwood Park neighborhood
- Woodridge neighborhood
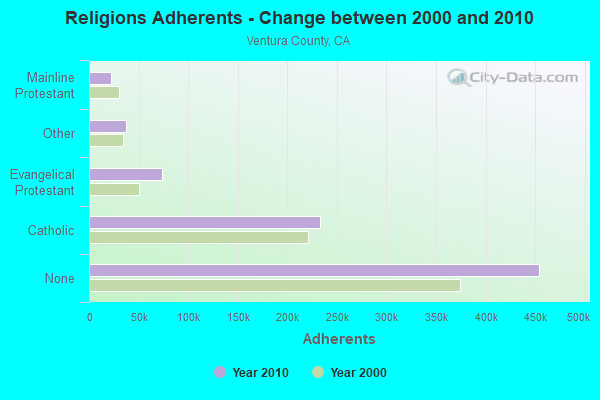
Religion statistics for Thousand Oaks, CA (based on Ventura County data)
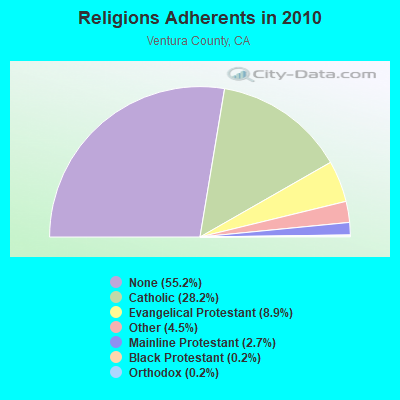
| Religion | Adherents | Congregations |
|---|---|---|
| Catholic | 232,571 | 20 |
| Evangelical Protestant | 73,341 | 268 |
| Other | 37,398 | 118 |
| Mainline Protestant | 22,006 | 65 |
| Black Protestant | 1,986 | 4 |
| Orthodox | 1,680 | 7 |
| None | 454,336 | - |
Food Environment Statistics:
| Here: | 1.97 / 10,000 pop. |
| State: | 2.14 / 10,000 pop. |
| This county: | 0.05 / 10,000 pop. |
| State: | 0.04 / 10,000 pop. |
| Ventura County: | 0.57 / 10,000 pop. |
| State: | 0.62 / 10,000 pop. |
| This county: | 1.69 / 10,000 pop. |
| State: | 1.49 / 10,000 pop. |
| Here: | 7.28 / 10,000 pop. |
| California: | 7.42 / 10,000 pop. |
| Ventura County: | 7.4% |
| California: | 7.3% |
| Ventura County: | 23.1% |
| California: | 21.3% |
| Ventura County: | 19.0% |
| State: | 17.9% |
Health and Nutrition:
| This city: | 51.6% |
| California: | 49.4% |
| Thousand Oaks: | 50.2% |
| California: | 48.0% |
| This city: | 28.1 |
| State: | 28.1 |
| Thousand Oaks: | 20.5% |
| State: | 20.2% |
| Thousand Oaks: | 9.4% |
| California: | 11.2% |
| Thousand Oaks: | 6.9 |
| California: | 6.8 |
| Thousand Oaks: | 33.7% |
| California: | 31.5% |
| This city: | 58.4% |
| State: | 56.4% |
| Thousand Oaks: | 80.0% |
| California: | 80.9% |
More about Health and Nutrition of Thousand Oaks, CA Residents
| Local government employment and payroll (March 2022) | |||||
| Function | Full-time employees | Monthly full-time payroll | Average yearly full-time wage | Part-time employees | Monthly part-time payroll |
|---|---|---|---|---|---|
| Streets and Highways | 114 | $822,375 | $86,566 | 6 | $11,753 |
| Other Government Administration | 46 | $501,007 | $130,697 | 12 | $22,559 |
| Financial Administration | 44 | $372,505 | $101,592 | 3 | $3,364 |
| Sewerage | 38 | $316,638 | $99,991 | 4 | $14,849 |
| Other and Unallocable | 36 | $316,528 | $105,509 | 0 | $0 |
| Local Libraries | 33 | $225,638 | $82,050 | 54 | $82,730 |
| Water Supply | 20 | $126,724 | $76,034 | 0 | $0 |
| Parks and Recreation | 13 | $110,951 | $102,416 | 51 | $92,063 |
| Judicial and Legal | 5 | $82,628 | $198,307 | 2 | $9,437 |
| Solid Waste Management | 4 | $38,329 | $114,987 | 0 | $0 |
| Housing and Community Development (Local) | 2 | $18,821 | $112,926 | 0 | $0 |
| Transit | 2 | $16,412 | $98,472 | 1 | $255 |
| Police - Other | 1 | $11,853 | $142,236 | 26 | $30,176 |
| Totals for Government | 358 | $2,960,409 | $99,232 | 159 | $267,187 |
Thousand Oaks government finances - Expenditure in 2017 (per resident):
- Construction - Regular Highways: $16,189,000 ($130.28)
Central Staff Services: $3,618,000 ($29.12)
Housing and Community Development: $2,367,000 ($19.05)
Sewerage: $2,310,000 ($18.59)
Water Utilities: $1,085,000 ($8.73)
Libraries: $510,000 ($4.10)
Transit Utilities: $232,000 ($1.87)
Parks and Recreation: $211,000 ($1.70)
- Current Operations - Police Protection: $28,504,000 ($229.38)
Central Staff Services: $21,845,000 ($175.79)
Regular Highways: $21,135,000 ($170.08)
Water Utilities: $19,789,000 ($159.25)
Sewerage: $12,654,000 ($101.83)
Parks and Recreation: $8,419,000 ($67.75)
Libraries: $7,869,000 ($63.32)
Transit Utilities: $7,670,000 ($61.72)
Financial Administration: $6,466,000 ($52.03)
Protective Inspection and Regulation - Other: $3,977,000 ($32.00)
Local Fire Protection: $3,206,000 ($25.80)
General - Other: $2,713,000 ($21.83)
Housing and Community Development: $1,772,000 ($14.26)
Solid Waste Management: $1,197,000 ($9.63)
Health - Other: $226,000 ($1.82)
- General - Interest on Debt: $1,090,000 ($8.77)
- Intergovernmental to Local - Other - Police Protection: $27,900,000 ($224.52)
Other - Parks and Recreation: $517,000 ($4.16)
Other - General - Other: $249,000 ($2.00)
Other - Water Utilities: $214,000 ($1.72)
Other - Health - Other: $203,000 ($1.63)
- Intergovernmental to State - Protective Inspection and Regulations - Other: $191,000 ($1.54)
- Other Capital Outlay - Sewerage: $1,402,000 ($11.28)
Libraries: $1,126,000 ($9.06)
Regular Highways: $122,000 ($0.98)
Protective Inspection and Regulation - Other: $75,000 ($0.60)
Solid Waste Management: $45,000 ($0.36)
Police Protection: $41,000 ($0.33)
- Total Salaries and Wages: $243,000 ($1.96)
Thousand Oaks government finances - Revenue in 2017 (per resident):
- Charges - Sewerage: $21,212,000 ($170.70)
Other: $16,381,000 ($131.82)
Parks and Recreation: $6,076,000 ($48.90)
Regular Highways: $1,649,000 ($13.27)
Solid Waste Management: $1,408,000 ($11.33)
- Federal Intergovernmental - Transit Utilities: $1,778,000 ($14.31)
Other: $910,000 ($7.32)
Housing and Community Development: $412,000 ($3.32)
- Local Intergovernmental - Transit Utilities: $4,977,000 ($40.05)
Other: $511,000 ($4.11)
- Miscellaneous - General Revenue - Other: $1,854,000 ($14.92)
Fines and Forfeits: $1,071,000 ($8.62)
Rents: $950,000 ($7.64)
Interest Earnings: $485,000 ($3.90)
Royalties: $189,000 ($1.52)
Special Assessments: $120,000 ($0.97)
Sale of Property: $87,000 ($0.70)
- Revenue - Water Utilities: $25,405,000 ($204.44)
Transit Utilities: $1,038,000 ($8.35)
- State Intergovernmental - Highways: $2,860,000 ($23.02)
Other: $711,000 ($5.72)
General Local Government Support: $109,000 ($0.88)
Transit Utilities: $9,000 ($0.07)
- Tax - Property: $34,540,000 ($277.95)
General Sales and Gross Receipts: $32,066,000 ($258.05)
Public Utilities Sales: $6,473,000 ($52.09)
Other License: $4,951,000 ($39.84)
Other Selective Sales: $4,538,000 ($36.52)
Occupation and Business License - Other: $2,234,000 ($17.98)
Other: $2,168,000 ($17.45)
Documentary and Stock Transfer: $1,075,000 ($8.65)
Thousand Oaks government finances - Debt in 2017 (per resident):
- Long Term Debt - Beginning Outstanding - Unspecified Public Purpose: $67,235,000 ($541.06)
Outstanding Unspecified Public Purpose: $62,226,000 ($500.75)
Beginning Outstanding - Public Debt for Private Purpose: $12,187,000 ($98.07)
Outstanding Nonguaranteed - Industrial Revenue: $11,934,000 ($96.04)
Retired Unspecified Public Purpose: $5,318,000 ($42.80)
Issue, Unspecified Public Purpose: $309,000 ($2.49)
Retired Nonguaranteed - Public Debt for Private Purpose: $253,000 ($2.04)
Thousand Oaks government finances - Cash and Securities in 2017 (per resident):
- Bond Funds - Cash and Securities: $37,738,000 ($303.69)
- Other Funds - Cash and Securities: $266,539,000 ($2144.92)
- Sinking Funds - Cash and Securities: $17,852,000 ($143.66)
4.96% of this county's 2021 resident taxpayers lived in other counties in 2020 ($110,211 average adjusted gross income)
| Here: | 4.96% |
| California average: | 5.19% |
0.03% of residents moved from foreign countries ($345 average AGI)
Ventura County: 0.03% California average: 0.03%
Top counties from which taxpayers relocated into this county between 2020 and 2021:
| from Los Angeles County, CA | |
| from Santa Barbara County, CA | |
| from Orange County, CA |
5.51% of this county's 2020 resident taxpayers moved to other counties in 2021 ($95,405 average adjusted gross income)
| Here: | 5.51% |
| California average: | 6.14% |
0.02% of residents moved to foreign countries ($247 average AGI)
Ventura County: 0.02% California average: 0.02%
Top counties to which taxpayers relocated from this county between 2020 and 2021:
| to Los Angeles County, CA | |
| to San Diego County, CA | |
| to Santa Barbara County, CA |
| Businesses in Thousand Oaks, CA | ||||
| Name | Count | Name | Count | |
|---|---|---|---|---|
| 24 Hour Fitness | 1 | Jones New York | 7 | |
| 7-Eleven | 3 | Journeys | 1 | |
| 99 Cents Only Stores | 1 | Just Tires | 1 | |
| ALDO | 1 | Justice | 1 | |
| AT&T | 2 | KFC | 1 | |
| Abercrombie & Fitch | 1 | Kroger | 1 | |
| Abercrombie Kids | 1 | La Quinta | 1 | |
| Aeropostale | 1 | Lane Furniture | 2 | |
| Albertsons | 1 | LensCrafters | 1 | |
| American Eagle Outfitters | 2 | Levi Strauss & Co. | 1 | |
| Ann Taylor | 1 | Little Caesars Pizza | 1 | |
| Apple Store | 1 | Macy's | 1 | |
| Arby's | 1 | Marriott | 2 | |
| BMW | 1 | Marshalls | 1 | |
| Baja Fresh Mexican Grill | 1 | MasterBrand Cabinets | 13 | |
| Bakers | 1 | Mazda | 1 | |
| Banana Republic | 1 | McDonald's | 1 | |
| Barnes & Noble | 1 | Men's Wearhouse | 1 | |
| Bath & Body Works | 1 | Motherhood Maternity | 2 | |
| Bed Bath & Beyond | 1 | New Balance | 3 | |
| Best Western | 1 | Nike | 8 | |
| Big O Tires | 1 | Nordstrom | 1 | |
| Blockbuster | 1 | Office Depot | 1 | |
| Brookstone | 1 | Old Navy | 1 | |
| Burger King | 2 | Outback | 1 | |
| Burlington Coat Factory | 1 | Outback Steakhouse | 1 | |
| CVS | 4 | Pac Sun | 1 | |
| Cache | 1 | Panda Express | 3 | |
| Carl\s Jr. | 1 | Panera Bread | 1 | |
| Charlotte Russe | 1 | Papa John's Pizza | 1 | |
| Chevrolet | 1 | Payless | 1 | |
| Chico's | 1 | PetSmart | 1 | |
| Chipotle | 1 | Pier 1 Imports | 1 | |
| Chuck E. Cheese's | 1 | Pizza Hut | 1 | |
| Cinnabon | 1 | Pottery Barn | 1 | |
| Clarks | 1 | RadioShack | 1 | |
| Cold Stone Creamery | 1 | Red Lobster | 1 | |
| Coldwater Creek | 1 | Rite Aid | 3 | |
| Curves | 1 | SAS Shoes | 1 | |
| DHL | 2 | Sears | 4 | |
| Decora Cabinetry | 1 | Sephora | 1 | |
| Dennys | 1 | Skechers USA | 1 | |
| Discount Tire | 1 | Soma Intimates | 1 | |
| Domino's Pizza | 1 | Sprint Nextel | 1 | |
| DressBarn | 1 | Starbucks | 9 | |
| Dressbarn | 1 | Subaru | 1 | |
| El Pollo Loco | 1 | T-Mobile | 3 | |
| Express | 1 | T.G.I. Driday's | 1 | |
| FedEx | 19 | Taco Bell | 3 | |
| Firestone Complete Auto Care | 2 | Target | 1 | |
| Ford | 1 | The Cheesecake Factory | 1 | |
| Forever 21 | 1 | The Room Place | 1 | |
| GNC | 4 | Torrid | 1 | |
| GameStop | 2 | Toyota | 1 | |
| Gap | 2 | Toys"R"Us | 1 | |
| Gymboree | 1 | Trader Joe's | 1 | |
| H&R Block | 4 | U-Haul | 2 | |
| Haagen-Dazs | 1 | UPS | 11 | |
| Hilton | 1 | Urban Outfitters | 1 | |
| Hollister Co. | 1 | Vans | 6 | |
| Home Depot | 1 | Victoria's Secret | 1 | |
| Hot Topic | 1 | Vons | 4 | |
| J. Jill | 1 | Walgreens | 1 | |
| J.Crew | 1 | Wendy's | 1 | |
| JCPenney | 1 | Wet Seal | 1 | |
| Jamba Juice | 2 | Whole Foods Market | 1 | |
| Johnny Rockets | 1 | YMCA | 2 | |
Strongest AM radio stations in Thousand Oaks:
- KACD (850 AM; 25 kW; THOUSAND OAKS, CA; Owner: CITICASTERS LICENSES, L.P.)
- KSPN (710 AM; 50 kW; LOS ANGELES, CA; Owner: KABC-AM RADIO, INC.)
- KSUR (1260 AM; 25 kW; BEVERLY HILLS, CA)
- KNX (1070 AM; 50 kW; LOS ANGELES, CA; Owner: INFINITY BROADCASTING OPERATIONS, INC.)
- KLAC (570 AM; 50 kW; LOS ANGELES, CA; Owner: AMFM RADIO LICENSES, L.L.C.)
- KFWB (980 AM; 50 kW; LOS ANGELES, CA; Owner: INFINITY BROADCASTING OPERATIONS, INC.)
- KVTA (1520 AM; 10 kW; PORT HUENEME, CA; Owner: GOLD COAST BROADCASTING LLC)
- KFI (640 AM; 50 kW; LOS ANGELES, CA; Owner: CAPSTAR TX LIMITED PARTNERSHIP)
- KBLA (1580 AM; 50 kW; SANTA MONICA, CA)
- KOXR (910 AM; 5 kW; OXNARD, CA; Owner: LAZER BROADCASTING CORPORATION)
- KIRN (670 AM; 35 kW; SIMI VALLEY, CA; Owner: LOTUS OXNARD CORP.)
- KMPC (1540 AM; 50 kW; LOS ANGELES, CA; Owner: ROSE CITY RADIO CORPORATION)
- KTNQ (1020 AM; 50 kW; LOS ANGELES, CA; Owner: KTNQ-AM LICENSE CORP.)
Strongest FM radio stations in Thousand Oaks:
- KMLT (92.7 FM; THOUSAND OAKS, CA; Owner: AMATURO GROUP OF L.A., LTD.)
- KCLU (88.3 FM; THOUSAND OAKS, CA; Owner: CALIFORNIA LUTHERAN UNIVERSITY)
- K272DI (102.3 FM; FILLMORE, CA; Owner: SANTA MONICA COMMUNITY COLLEGE DIST.)
- KCZN (96.7 FM; SANTA PAULA, CA; Owner: LAZER BROADCASTING CORPORATION)
- K220FR (91.9 FM; SIMI VALLEY, CA; Owner: LIFE ON THE WAY COMMUNICATIONS, INC.)
- KCSN (88.5 FM; NORTHRIDGE, CA; Owner: CALIFORNIA STATE UNIVERSITY, NORTHRIDGE)
- KKBT (100.3 FM; LOS ANGELES, CA; Owner: RADIO ONE LICENSES, LLC)
- KBBY-FM (95.1 FM; VENTURA, CA; Owner: CUMULUS LICENSING CORP.)
- KCRU (89.1 FM; OXNARD, CA; Owner: SANTA MONICA COMMUNITY COLLEGE DISTRICT)
- KRTH-FM (101.1 FM; LOS ANGELES, CA; Owner: INFINITY BROADCASTING OPERATIONS, INC.)
- KMRO-FM1 (90.3 FM; CAMARILLO, CA; Owner: THE ASSOCIATION FOR COMMUNITY EDUCATION, INC.)
- KZLA-FM (93.9 FM; LOS ANGELES, CA; Owner: EMMIS RADIO LICENSE CORPORATION)
- KPWR (105.9 FM; LOS ANGELES, CA; Owner: EMMIS RADIO LICENSE CORPORATION)
- KLSX (97.1 FM; LOS ANGELES, CA; Owner: INFINITY BROADCASTING OPERATIONS, INC.)
- KUSC (91.5 FM; LOS ANGELES, CA; Owner: UNIVERSITY OF SOUTHERN CALIFORNIA)
- K261AB (100.1 FM; NEWHALL, ETC., CA; Owner: RADIO ONE LICENSES, LLC)
- KKLA-FM (99.5 FM; LOS ANGELES, CA; Owner: NEW INSPIRATION BROADCASTING CO., INC.)
- KSSC (107.1 FM; VENTURA, CA; Owner: ENTRAVISION HOLDINGS, LLC)
- KCBS-FM (93.1 FM; LOS ANGELES, CA; Owner: INFINITY BROADCASTING OPERATIONS, INC.)
- KLFH (89.5 FM; OJAI, CA; Owner: SHEPHERD COMMUNICATIONS, INC.)
TV broadcast stations around Thousand Oaks:
- KTRO-LP (Channel 50; LANCASTER, CA; Owner: ROBERT D. ADELMAN)
- KADY-TV (Channel 63; OXNARD, CA; Owner: BILTMORE BROADCASTING, L.L.C.)
- KSMV-LP (Channel 33; LOS ANGELES, CA; Owner: KJLA, LLC)
- K25GV (Channel 25; OXNARD, CA; Owner: CAPITAL BROADCASTING CORP.)
- National Bridge Inventory (NBI) Statistics
- 87Number of bridges
- 1,122ft / 342mTotal length
- $1,528,000Total costs
- 5,638,282Total average daily traffic
- 542,569Total average daily truck traffic
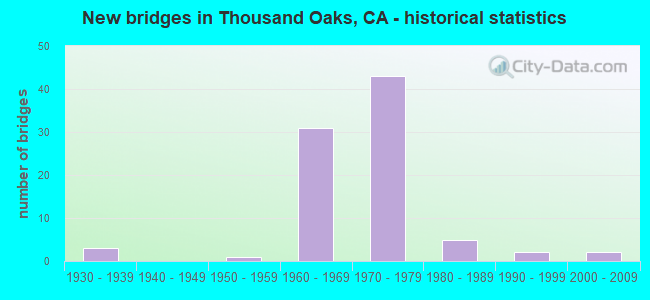
- New bridges - historical statistics
- 31930-1939
- 11950-1959
- 311960-1969
- 431970-1979
- 51980-1989
- 21990-1999
- 22000-2009
FCC Registered Antenna Towers: 41 (See the full list of FCC Registered Antenna Towers)
FCC Registered Commercial Land Mobile Towers: 3 (See the full list of FCC Registered Commercial Land Mobile Towers in Thousand Oaks, CA)
FCC Registered Private Land Mobile Towers: 5 (See the full list of FCC Registered Private Land Mobile Towers)
FCC Registered Broadcast Land Mobile Towers: 55 (See the full list of FCC Registered Broadcast Land Mobile Towers)
FCC Registered Microwave Towers: 66 (See the full list of FCC Registered Microwave Towers in this town)
FCC Registered Paging Towers: 20 (See the full list of FCC Registered Paging Towers)
FCC Registered Maritime Coast & Aviation Ground Towers: 1 (See the full list of FCC Registered Maritime Coast & Aviation Ground Towers)
FCC Registered Amateur Radio Licenses: 868 (See the full list of FCC Registered Amateur Radio Licenses in Thousand Oaks)
FAA Registered Aircraft Manufacturers and Dealers: 3 (See the full list of FAA Registered Manufacturers and Dealers in Thousand Oaks)
FAA Registered Aircraft: 97 (See the full list of FAA Registered Aircraft)
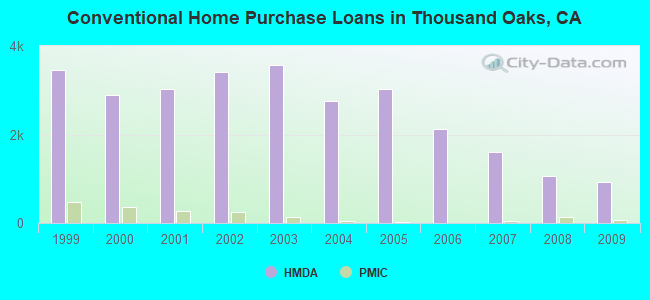
| Home Mortgage Disclosure Act Aggregated Statistics For Year 2009 (Based on 22 full and 4 partial tracts) | ||||||||||||
| A) FHA, FSA/RHS & VA Home Purchase Loans | B) Conventional Home Purchase Loans | C) Refinancings | D) Home Improvement Loans | F) Non-occupant Loans on < 5 Family Dwellings (A B C & D) | G) Loans On Manufactured Home Dwelling (A B C & D) | |||||||
|---|---|---|---|---|---|---|---|---|---|---|---|---|
| Number | Average Value | Number | Average Value | Number | Average Value | Number | Average Value | Number | Average Value | Number | Average Value | |
| LOANS ORIGINATED | 279 | $416,478 | 926 | $431,147 | 5,341 | $327,488 | 176 | $293,321 | 264 | $276,258 | 11 | $111,120 |
| APPLICATIONS APPROVED, NOT ACCEPTED | 35 | $398,411 | 126 | $482,016 | 518 | $368,643 | 17 | $181,765 | 37 | $282,724 | 3 | $111,010 |
| APPLICATIONS DENIED | 60 | $405,889 | 161 | $437,174 | 1,175 | $425,085 | 46 | $173,704 | 93 | $320,207 | 12 | $94,819 |
| APPLICATIONS WITHDRAWN | 46 | $401,851 | 150 | $443,682 | 886 | $384,705 | 26 | $178,802 | 57 | $264,961 | 0 | $0 |
| FILES CLOSED FOR INCOMPLETENESS | 7 | $373,610 | 23 | $403,741 | 212 | $387,632 | 9 | $146,007 | 10 | $306,179 | 0 | $0 |
Detailed mortgage data for all 26 tracts in Thousand Oaks, CA
| Private Mortgage Insurance Companies Aggregated Statistics For Year 2009 (Based on 21 full and 4 partial tracts) | ||||
| A) Conventional Home Purchase Loans | B) Refinancings | |||
|---|---|---|---|---|
| Number | Average Value | Number | Average Value | |
| LOANS ORIGINATED | 57 | $360,648 | 24 | $426,228 |
| APPLICATIONS APPROVED, NOT ACCEPTED | 22 | $400,667 | 18 | $422,374 |
| APPLICATIONS DENIED | 22 | $410,317 | 15 | $459,188 |
| APPLICATIONS WITHDRAWN | 10 | $441,601 | 1 | $493,000 |
| FILES CLOSED FOR INCOMPLETENESS | 2 | $415,185 | 1 | $413,790 |

2005 - 2018 National Fire Incident Reporting System (NFIRS) incidents
- Fire incident types reported to NFIRS in Thousand Oaks, CA
- 60036.6%Outside Fires
- 41625.4%Structure Fires
- 33420.4%Mobile Property/Vehicle Fires
- 29017.7%Other
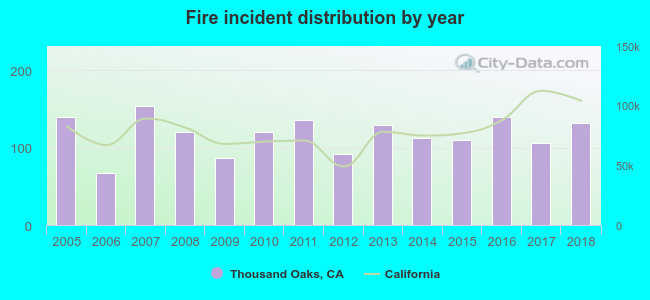 Based on the data from the years 2005 - 2018 the average number of fire incidents per year is 117. The highest number of reported fires - 154 took place in 2007, and the least - 67 in 2006. The data has a decreasing trend.
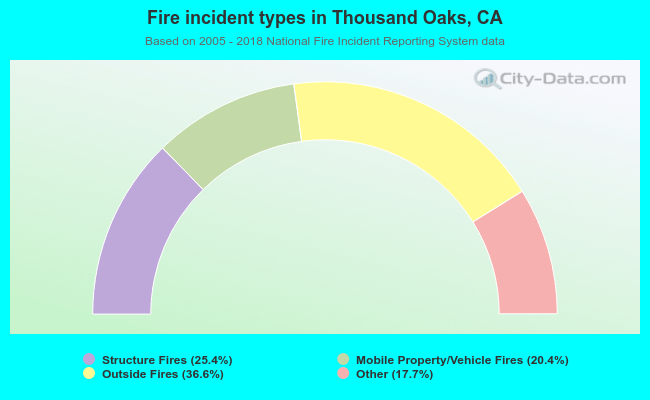 When looking into fire subcategories, the most incidents belonged to: Outside Fires (36.6%), and Structure Fires (25.4%).
Fire-safe hotels and motels in Thousand Oaks, California:
- Village Inn, 1425 Thousand Oaks Blvd, Thousand Oaks, California 91362 , Phone: (805) 496-0102
- Quality Inn & Suites, 12 Conejo Blvd, Thousand Oaks, California 91360 , Phone: (805) 495-7011, Fax: (805) 495-0647
- Palm Garden Hotel, 495 N Ventu Park Rd, Thousand Oaks, California 91320 , Phone: (805) 716-4200, Fax: (805) 716-4300
- La Quinta Inn & Suites-Thousand Oaks, 1320 Newbury Rd, Thousand Oaks, California 91320 , Phone: (805) 499-5910, Fax: (805) 498-5783
- Hampton Inn & Suites Thousand Oaks, 510 N Ventu Park Rd, Thousand Oaks, California 91320 , Phone: (805) 375-0376, Fax: (805) 375-0947
| Most common first names in Thousand Oaks, CA among deceased individuals | ||
| Name | Count | Lived (average) |
|---|---|---|
| John | 296 | 75.6 years |
| Mary | 271 | 80.8 years |
| William | 239 | 76.6 years |
| Robert | 217 | 72.0 years |
| James | 175 | 72.6 years |
| Helen | 143 | 82.9 years |
| Charles | 137 | 77.3 years |
| Margaret | 126 | 82.1 years |
| Joseph | 124 | 77.1 years |
| George | 121 | 77.7 years |
| Most common last names in Thousand Oaks, CA among deceased individuals | ||
| Last name | Count | Lived (average) |
|---|---|---|
| Smith | 81 | 80.5 years |
| Johnson | 66 | 77.4 years |
| Miller | 60 | 79.6 years |
| Anderson | 49 | 75.6 years |
| Brown | 40 | 79.0 years |
| Williams | 37 | 75.4 years |
| Jones | 36 | 77.4 years |
| Lewis | 29 | 78.8 years |
| Young | 29 | 72.8 years |
| Lee | 29 | 74.2 years |
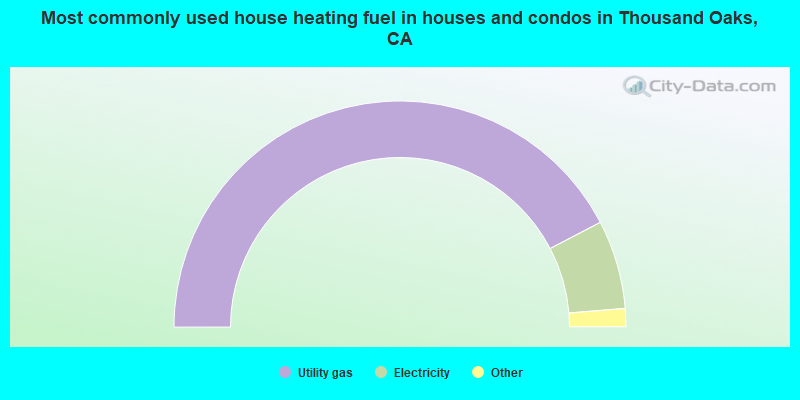
- 84.7%Utility gas
- 12.7%Electricity
- 1.0%Solar energy
- 0.9%Bottled, tank, or LP gas
- 0.5%No fuel used
- 0.2%Wood
- 0.1%Fuel oil, kerosene, etc.
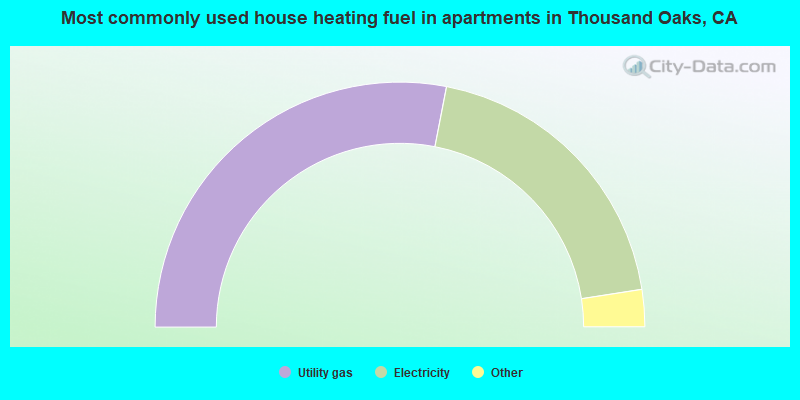
- 56.1%Utility gas
- 39.0%Electricity
- 3.7%No fuel used
- 0.8%Bottled, tank, or LP gas
- 0.2%Other fuel
- 0.2%Coal or coke
Thousand Oaks compared to California state average:
- Unemployed percentage significantly below state average.
- Black race population percentage below state average.
- Hispanic race population percentage below state average.
- Median age significantly above state average.
- Renting percentage below state average.
- Percentage of population with a bachelor's degree or higher above state average.
Thousand Oaks, CA compared to other similar cities:
Thousand Oaks on our top lists:
- #3 on the list of "Top 101 cities with the largest racial income disparity between any two races with at least 2,000 householders"
- #6 on the list of "Top 101 cities with the smallest sunshine amount differences during a year (population 50,000+)"
- #6 on the list of "Top 101 cities with largest percentage of males in occupations: arts, design, entertainment, sports, and media occupations (population 50,000+)"
- #6 on the list of "Top 101 cities with the highest cost per building permit(population 50,000+)"
- #22 on the list of "Top 100 safest cities (lowest city-data.com crime index) (pop. 50,000+)"
- #25 on the list of "Top 101 cities with the lowest number of burglaries per 100,000 residents (population 50,000+)"
- #26 on the list of "Top 101 cities with the most residents born in Other South Eastern Asia (population 500+)"
- #28 on the list of "Top 101 cities with largest percentage of males in occupations: management occupations (population 50,000+)"
- #31 on the list of "Top 100 cities with highest median household income (pop. 50,000+)"
- #32 on the list of "Top 101 cities with the lowest city-data.com crime index (population 50,000+)"
- #32 on the list of "Top 101 cities with the lowest average snowfall in a year (population 50,000+)"
- #39 on the list of "Top 101 cities with the highest percentage of workers working at home, population 50,000+"
- #40 on the list of "Top 101 cities with the largest differences between daily high and daily low temperatures (population 50,000+)"
- #41 on the list of "Top 101 cities with largest percentage of males in industries: information (population 50,000+)"
- #53 on the list of "Top 100 cities with highest median house value (pop. 50,000+)"
- #54 on the list of "Top 101 cities with the lowest number of auto thefts per 100,000 residents (population 50,000+)"
- #55 on the list of "Top 101 cities with the lowest number of thefts per 100,000 residents (population 50,000+)"
- #56 on the list of "Top 101 cities with largest percentage of females in industries: wholesale trade (population 50,000+)"
- #63 on the list of "Top 101 cities with largest percentage of males in occupations: life, physical, and social science occupations (population 50,000+)"
- #64 on the list of "Top 101 cities with the lowest number of murders per 100,000 residents (population 50,000+)"
- #16 on the list of "Top 101 counties with the highest lead air pollution readings in 2012 (µg/m3)"
- #18 on the list of "Top 101 counties with the lowest lead air pollution readings in 2012 (µg/m3)"
- #38 on the list of "Top 101 counties with the highest Particulate Matter (PM10) Annual air pollution readings in 2012 (µg/m3)"
- #44 on the list of "Top 101 counties with the highest surface withdrawal of fresh water for public supply (pop. 50,000+)"
- #44 on the list of "Top 101 counties with the most Other congregations (pop. 50,000+)"

|
|
Total of 2992 patent applications in 2008-2024.