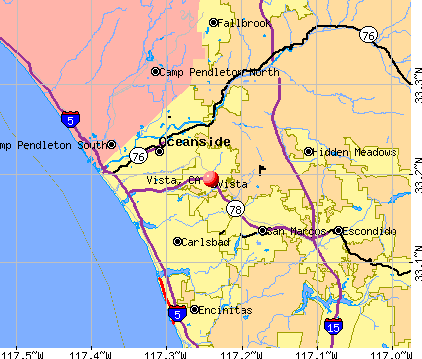
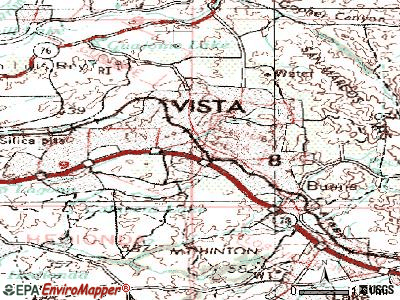
Vista, California
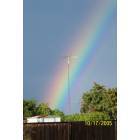
Vista: Rainbow over Vista
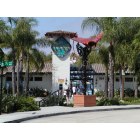
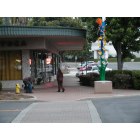
Vista: city of vista ca.
Vista: city of vista ca.
Vista: Moving to Vista from Canada
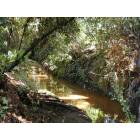
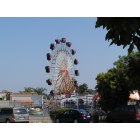
Vista
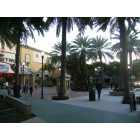
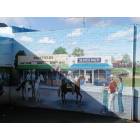
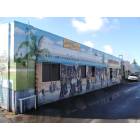
Vista: Down Town Vista
Vista: VISTA
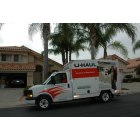
Vista: Moving to Vista from Calgary Canada
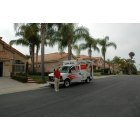
Vista: VISTA AT NIGHT
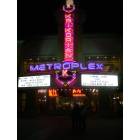
Vista: Krikorian
Vista: city of vista ca.
- see
33
more - add
your


Submit your own pictures of this city and show them to the world
- OSM Map
- General Map
- Google Map
- MSN Map
Population change since 2000: +8.8%
 |
| Males: 49,396 | |
| Females: 48,370 |
| Median resident age: | 38.3 years |
| California median age: | 37.9 years |
Zip codes: 92083.
| Vista: | $88,839 |
| CA: | $91,551 |
Estimated per capita income in 2022: $39,947 (it was $18,027 in 2000)
Vista city income, earnings, and wages data
Estimated median house or condo value in 2022: $739,500 (it was $188,700 in 2000)
| Vista: | $739,500 |
| CA: | $715,900 |
Mean prices in 2022: all housing units: $748,830; detached houses: $836,229; townhouses or other attached units: $574,490; in 2-unit structures: $477,072; in 3-to-4-unit structures: $574,633; in 5-or-more-unit structures: $916,335; mobile homes: $175,609; occupied boats, rvs, vans, etc.: $58,488
Median gross rent in 2022: $2,105.
(9.3% for White Non-Hispanic residents, 19.2% for Black residents, 8.9% for Hispanic or Latino residents, 7.8% for American Indian residents, 12.8% for Native Hawaiian and other Pacific Islander residents, 8.8% for other race residents, 12.2% for two or more races residents)
Detailed information about poverty and poor residents in Vista, CA


Compare current foreclosures in Vista, CA:
| Photo | Address | Area | Beds / Baths | Price | Details |
|---|---|---|---|---|---|

|
#1
Diamond Way Apt 249
Vista, CA 92083
|
878 sq. feet
|
2 baths 2 beds |
show details | |

|
#2
Seacrest Ct
Vista, CA 92081
|
1,535 sq. feet
|
2 baths 3 beds |
show details | |

|
#3
Via Subria
Vista, CA 92084
|
2,858 sq. feet
|
3 baths 4 beds |
show details | |

|
#4
El Vallecito
Vista, CA 92083
|
1,318 sq. feet
|
2 baths 3 beds |
show details | |

|
#5
Curtis Dr
Vista, CA 92084
|
2,260 sq. feet
|
2 baths 4 beds |
show details | |

|
#6
Little Gopher Canyon Rd
Vista, CA 92084
|
1,788 sq. feet
|
2 baths 2 beds |
show details | |

|
#7
Tylee St
Vista, CA 92083
|
1,120 sq. feet
|
1 baths 3 beds |
show details | |

|
#8
Burnt Maple Way
Vista, CA 92081
|
1,631 sq. feet
|
2 baths 3 beds |
show details | |

|
#9
Cameo Dr
Vista, CA 92083
|
2,049 sq. feet
|
3 baths 4 beds |
show details | |

|
#10
Pod Dr
Vista, CA 92084
|
1,498 sq. feet
|
2 baths 3 beds |
show details |
| Photo | Address | Area | Beds / Baths | Price | Details |
|---|---|---|---|---|---|

|
#11
Arcadia Ave
Vista, CA 92084
|
1,792 sq. feet
|
2 baths 4 beds |
show details | |

|
#12
Roma Dr
Vista, CA 92081
|
1,975 sq. feet
|
2 baths 3 beds |
show details | |

|
#13
Arcadia Ave
Vista, CA 92084
|
827 sq. feet
|
1 baths 2 beds |
show details | |

|
#14
Sycamore Ave Spc 204
Vista, CA 92083
|
1,000 sq. feet
|
1 baths 2 beds |
show details | |

|
#15
Rockhill Rd
Vista, CA 92084
|
1,561 sq. feet
|
2 baths 3 beds |
show details | |

|
#16
Countrywood Ln
Vista, CA 92081
|
2,833 sq. feet
|
3 baths 4 beds |
show details | |

|
#17
Pecan Ct
Vista, CA 92083
|
1,450 sq. feet
|
2 baths 3 beds |
show details | |

|
#18
Teelin Ave
Vista, CA 92083
|
2,285 sq. feet
|
3 baths 4 beds |
show details | |

|
#19
W Los Angeles Dr
Vista, CA 92083
|
935 sq. feet
|
1 baths 3 beds |
show details | |

|
#20
Majella Rd
Vista, CA 92084
|
1,676 sq. feet
|
3 baths 4 beds |
show details |
| Photo | Address | Area | Beds / Baths | Price | Details |
|---|---|---|---|---|---|

|
#21
Countryview Ln
Vista, CA 92081
|
1,654 sq. feet
|
3 baths 3 beds |
show details | |

|
#22
El Paso Alto
Vista, CA 92084
|
2,405 sq. feet
|
2 baths 3 beds |
show details | |

|
#23
N Santa Fe Ave Spc 12
Vista, CA 92084
|
500 sq. feet
|
1 baths 1 beds |
show details | |

|
#24
Prince Way
Vista, CA 92084
|
2,405 sq. feet
|
2 baths 3 beds |
show details | |

|
#25
Brookhaven Pass
Vista, CA 92081
|
2,667 sq. feet
|
3 baths 4 beds |
show details | |

|
#26
Burnt Maple Way
Vista, CA 92081
|
1,366 sq. feet
|
2 baths 3 beds |
show details | |

|
#27
Olive Ave Spc 64
Vista, CA 92083
|
1,618 sq. feet
|
2 baths 3 beds |
show details | |

|
#28
Promenade Cir
Vista, CA 92083
|
1,426 sq. feet
|
2 baths 3 beds |
show details | |

|
#29
Mar Vista Dr
Vista, CA 92083
|
1,923 sq. feet
|
2 baths 4 beds |
show details | |

|
#30
Bluegrass Rd
Vista, CA 92083
|
1,066 sq. feet
|
1 baths 3 beds |
show details |
| Photo | Address | Area | Beds / Baths | Price | Details |
|---|---|---|---|---|---|

|
#31
Rancho Vista Rd
Vista, CA 92083
|
1,504 sq. feet
|
2 baths 5 beds |
show details | |

|
#32
Marabou Ln
Vista, CA 92083
|
1,177 sq. feet
|
2 baths 3 beds |
show details | |

|
#33
Green Oak Rd
Vista, CA 92081
|
1,466 sq. feet
|
2 baths 3 beds |
show details | |

|
#34
E Bobier Dr Apt F4
Vista, CA 92084
|
- sq. feet
|
- baths - beds |
show details | |

|
#35
Bonair Rd Apt 58
Vista, CA 92084
|
- sq. feet
|
- baths - beds |
show details | |

|
#36
West Dr
Vista, CA 92083
|
- sq. feet
|
- baths - beds |
show details | |

|
#37
Via Santa Cruz
Vista, CA 92081
|
- sq. feet
|
- baths - beds |
show details | |

|
#38
Monte Vista Dr
Vista, CA 92084
|
- sq. feet
|
- baths - beds |
show details | |

|
#39
Sycamore Ave Apt 45
Vista, CA 92081
|
- sq. feet
|
- baths - beds |
show details | |

|
#40
Pala Vista Dr Spc 7
Vista, CA 92083
|
- sq. feet
|
- baths - beds |
show details |
| Photo | Address | Area | Beds / Baths | Price | Details |
|---|---|---|---|---|---|

|
#41
Grapevine Rd Apt 143
Vista, CA 92083
|
- sq. feet
|
- baths - beds |
show details | |

|
#42
S Melrose Dr Apt 52
Vista, CA 92081
|
- sq. feet
|
- baths - beds |
show details | |

|
#43
Lado De Loma Dr Apt 6
Vista, CA 92083
|
- sq. feet
|
- baths - beds |
show details | |

|
#44
Verano Way
Vista, CA 92081
|
- sq. feet
|
- baths - beds |
show details | |

|
#45
Hillside Ter Apt 72
Vista, CA 92084
|
- sq. feet
|
- baths - beds |
show details | |

|
#46
Eagle Crest Ln
Vista, CA 92081
|
- sq. feet
|
- baths - beds |
show details | |

|
#47
N Santa Fe Ave
Vista, CA 92083
|
- sq. feet
|
- baths - beds |
show details | |

|
#48
Saint Thomas Rd
Vista, CA 92081
|
- sq. feet
|
- baths - beds |
show details | |

|
#49
Weston Cir # 6
Vista, CA 92083
|
- sq. feet
|
- baths - beds |
show details | |

|
Check over 1 million property listings on Foreclosure.com!
|
browse all offers | |||


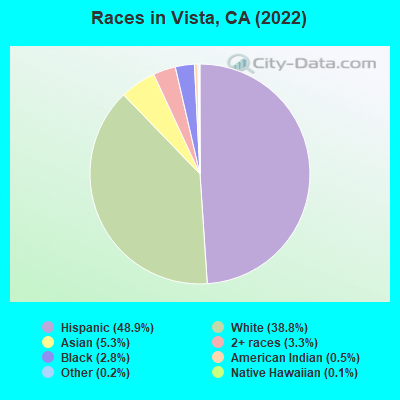
- 47,85348.9%Hispanic
- 37,91238.8%White alone
- 5,1905.3%Asian alone
- 3,1933.3%Two or more races
- 2,7382.8%Black alone
- 4930.5%American Indian alone
- 2430.2%Other race alone
- 1440.1%Native Hawaiian and Other
Pacific Islander alone
According to our research of California and other state lists, there were 101 registered sex offenders living in Vista, California as of April 27, 2024.
The ratio of all residents to sex offenders in Vista is 1,007 to 1.
The ratio of registered sex offenders to all residents in this city is lower than the state average.
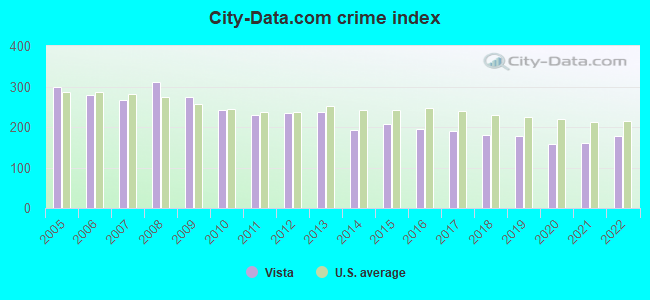
The City-Data.com crime index weighs serious crimes and violent crimes more heavily. Higher means more crime, U.S. average is 246.1. It adjusts for the number of visitors and daily workers commuting into cities.
- means the value is smaller than the state average.- means the value is about the same as the state average.
- means the value is bigger than the state average.
- means the value is much bigger than the state average.
Crime rate in Vista detailed stats: murders, rapes, robberies, assaults, burglaries, thefts, arson
Full-time law enforcement employees in 2015, including police officers: 1 (1 officers - 1 male; 0 female).
| Officers per 1,000 residents here: | 0.01 |
| California average: | 1.98 |
 Recent articles from our blog. Our writers, many of them Ph.D. graduates or candidates, create easy-to-read articles on a wide variety of topics.


Latest news from Vista, CA collected exclusively by city-data.com from local newspapers, TV, and radio stations
Vista, CA City Guides:
Ancestries: German (3.7%), Irish (3.3%), English (3.1%), Italian (2.3%), Swedish (1.9%), American (1.6%).
Current Local Time: PST time zone
Elevation: 340 feet
Land area: 18.7 square miles.
Population density: 5,233 people per square mile (average).
22,498 residents are foreign born (17.6% Latin America, 3.4% Asia).
| This city: | 23.0% |
| California: | 26.5% |
Median real estate property taxes paid for housing units with mortgages in 2022: $5,085 (0.7%)
Median real estate property taxes paid for housing units with no mortgage in 2022: $3,865 (0.6%)
Nearest city with pop. 200,000+: San Diego, CA  (29.2 miles , pop. 1,223,400).
Nearest cities:
)Latitude: 33.19 N, Longitude: 117.24 W
Daytime population change due to commuting: -6,922 (-7.1%)
Workers who live and work in this city: 18,220 (36.2%)
Area code: 760
Vista tourist attractions:
Vista, California accommodation & food services, waste management - Economy and Business Data
Single-family new house construction building permits:
- 2022: 91 buildings, average cost: $153,300
- 2021: 95 buildings, average cost: $127,400
- 2020: 261 buildings, average cost: $203,200
- 2019: 242 buildings, average cost: $232,300
- 2018: 180 buildings, average cost: $212,200
- 2017: 38 buildings, average cost: $328,900
- 2016: 100 buildings, average cost: $314,800
- 2015: 118 buildings, average cost: $290,900
- 2014: 54 buildings, average cost: $298,000
- 2013: 45 buildings, average cost: $312,100
- 2012: 42 buildings, average cost: $278,300
- 2011: 59 buildings, average cost: $286,700
- 2010: 54 buildings, average cost: $253,900
- 2009: 11 buildings, average cost: $292,200
- 2008: 9 buildings, average cost: $285,400
- 2007: 63 buildings, average cost: $271,700
- 2006: 63 buildings, average cost: $302,000
- 2005: 105 buildings, average cost: $106,300
- 2004: 76 buildings, average cost: $273,600
- 2003: 81 buildings, average cost: $236,700
- 2002: 288 buildings, average cost: $207,500
- 2001: 210 buildings, average cost: $256,400
- 2000: 158 buildings, average cost: $232,500
- 1999: 118 buildings, average cost: $230,800
- 1998: 135 buildings, average cost: $178,500
- 1997: 174 buildings, average cost: $139,500
| Here: | 4.7% |
| California: | 5.1% |
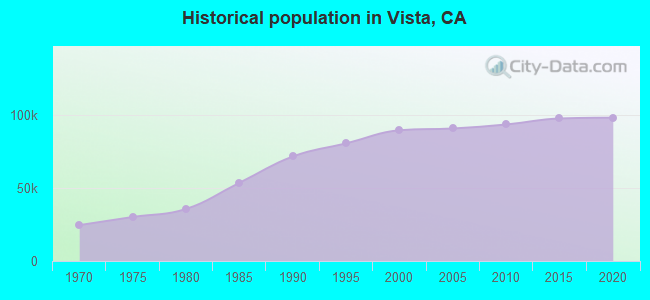
Population change in the 1990s: +17,537 (+24.2%).
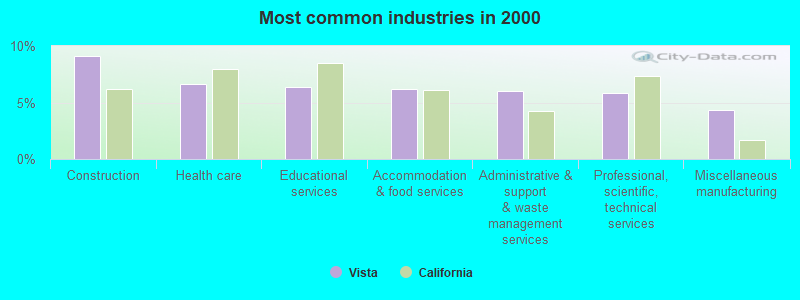
- Construction (9.2%)
- Health care (6.7%)
- Educational services (6.4%)
- Accommodation & food services (6.2%)
- Administrative & support & waste management services (6.0%)
- Professional, scientific, technical services (5.8%)
- Miscellaneous manufacturing (4.3%)
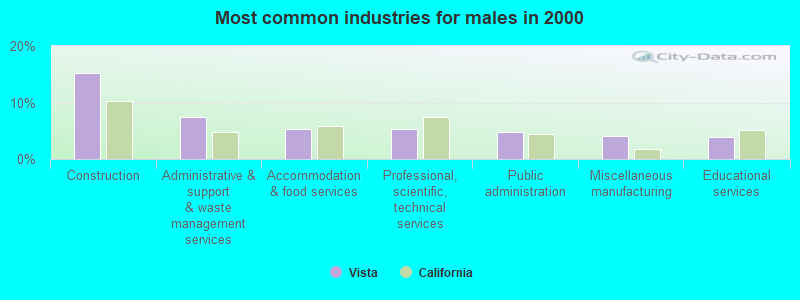
- Construction (15.2%)
- Administrative & support & waste management services (7.4%)
- Accommodation & food services (5.3%)
- Professional, scientific, technical services (5.2%)
- Public administration (4.8%)
- Miscellaneous manufacturing (4.2%)
- Educational services (3.8%)
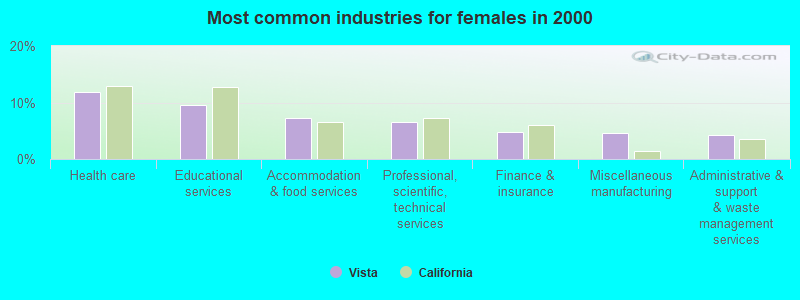
- Health care (11.9%)
- Educational services (9.5%)
- Accommodation & food services (7.2%)
- Professional, scientific, technical services (6.5%)
- Finance & insurance (4.7%)
- Miscellaneous manufacturing (4.5%)
- Administrative & support & waste management services (4.3%)
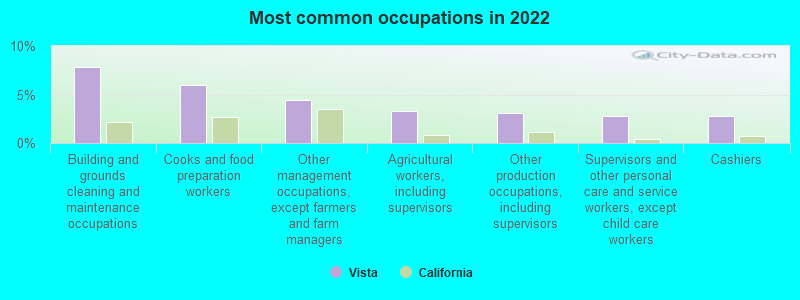
- Building and grounds cleaning and maintenance occupations (7.8%)
- Cooks and food preparation workers (6.0%)
- Other management occupations, except farmers and farm managers (4.4%)
- Agricultural workers, including supervisors (3.3%)
- Other production occupations, including supervisors (3.1%)
- Supervisors and other personal care and service workers, except child care workers (2.8%)
- Cashiers (2.7%)
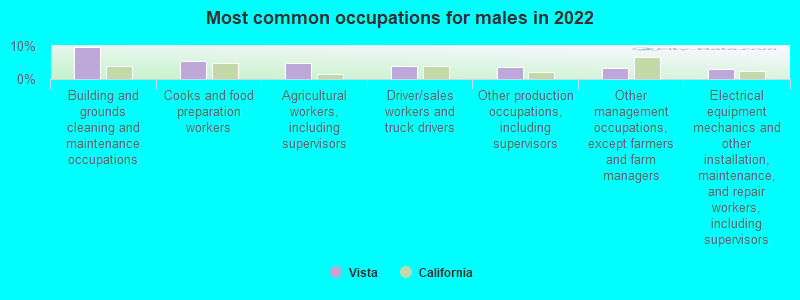
- Building and grounds cleaning and maintenance occupations (9.6%)
- Cooks and food preparation workers (5.6%)
- Agricultural workers, including supervisors (4.7%)
- Driver/sales workers and truck drivers (3.9%)
- Other production occupations, including supervisors (3.7%)
- Other management occupations, except farmers and farm managers (3.4%)
- Electrical equipment mechanics and other installation, maintenance, and repair workers, including supervisors (3.0%)

- Cooks and food preparation workers (6.5%)
- Other management occupations, except farmers and farm managers (5.8%)
- Building and grounds cleaning and maintenance occupations (5.6%)
- Supervisors and other personal care and service workers, except child care workers (4.5%)
- Cashiers (4.4%)
- Registered nurses (4.0%)
- Secretaries and administrative assistants (3.7%)
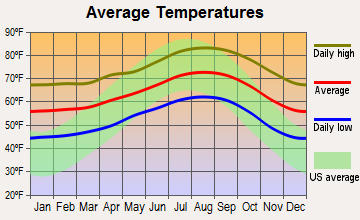
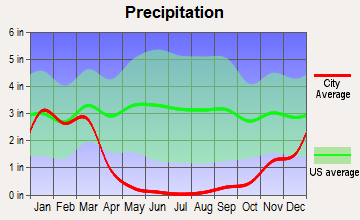
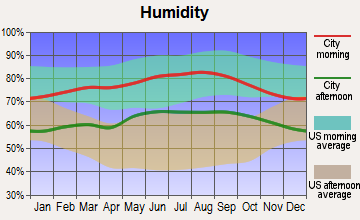
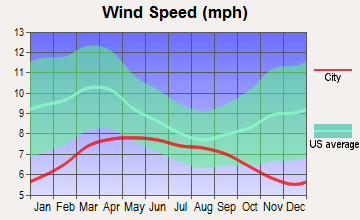
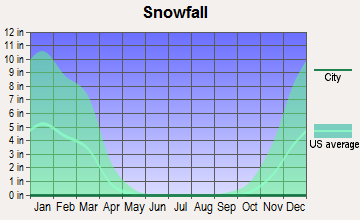
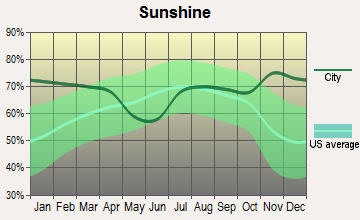
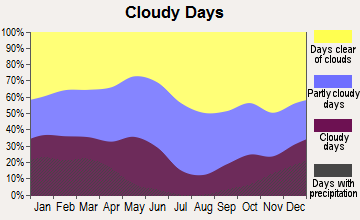
Average climate in Vista, California
Based on data reported by over 4,000 weather stations
|
|

(lower is better)
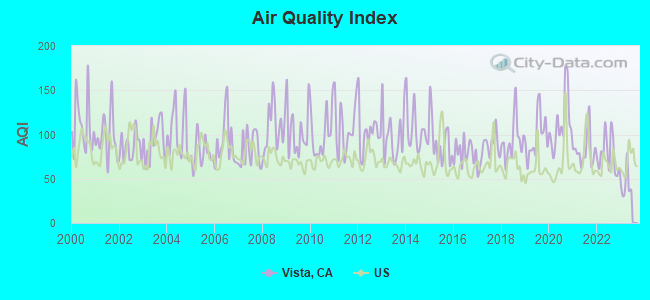
Air Quality Index (AQI) level in 2022 was 77.5. This is about average.
| City: | 77.5 |
| U.S.: | 72.6 |
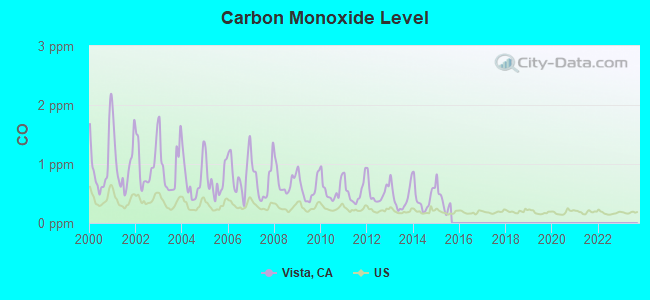
Carbon Monoxide (CO) [ppm] level in 2015 was 0.391. This is significantly worse than average. Closest monitor was 6.1 miles away from the city center.
| City: | 0.391 |
| U.S.: | 0.251 |
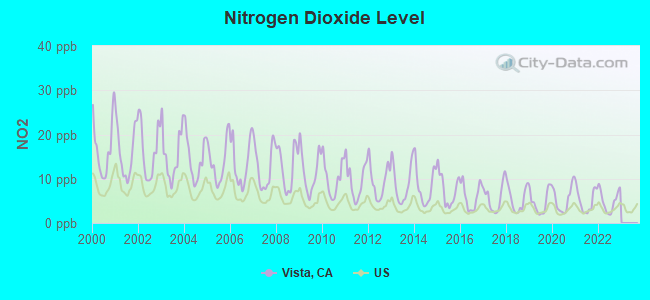
Nitrogen Dioxide (NO2) [ppb] level in 2022 was 4.99. This is about average. Closest monitor was 1.2 miles away from the city center.
| City: | 4.99 |
| U.S.: | 5.11 |
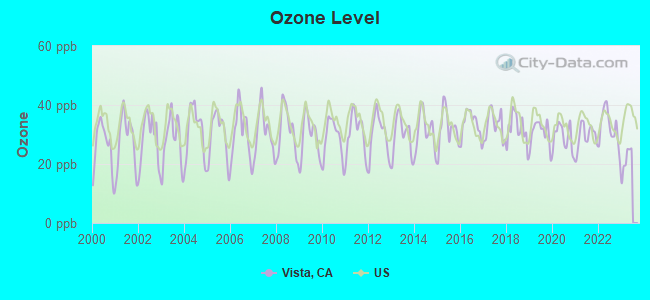
Ozone [ppb] level in 2022 was 32.2. This is about average. Closest monitor was 6.1 miles away from the city center.
| City: | 32.2 |
| U.S.: | 33.3 |
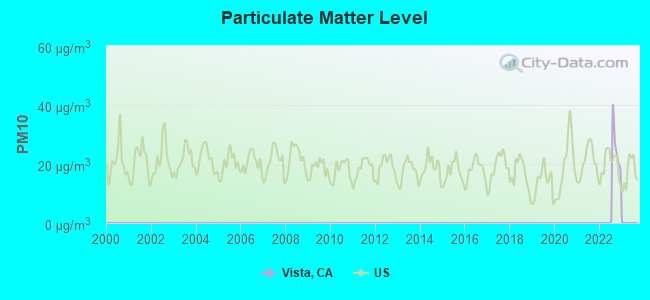
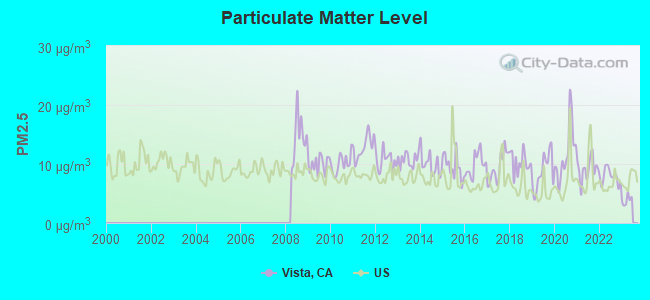
Particulate Matter (PM2.5) [µg/m3] level in 2022 was 7.88. This is about average. Closest monitor was 9.1 miles away from the city center.
| City: | 7.88 |
| U.S.: | 8.11 |
Earthquake activity:
Vista-area historical earthquake activity is significantly above California state average. It is 6331% greater than the overall U.S. average.On 6/28/1992 at 11:57:34, a magnitude 7.6 (6.2 MB, 7.6 MS, 7.3 MW, Depth: 0.7 mi, Class: Major, Intensity: VIII - XII) earthquake occurred 79.7 miles away from Vista center, causing 3 deaths (1 shaking deaths, 2 other deaths) and 400 injuries, causing $100,000,000 total damage and $40,000,000 insured losses
On 7/21/1952 at 11:52:14, a magnitude 7.7 (7.7 UK) earthquake occurred 160.5 miles away from Vista center, causing $50,000,000 total damage
On 10/16/1999 at 09:46:44, a magnitude 7.4 (6.3 MB, 7.4 MS, 7.2 MW, 7.3 ML) earthquake occurred 102.5 miles away from the city center
On 5/19/1940 at 04:36:40, a magnitude 7.2 (7.2 UK) earthquake occurred 89.4 miles away from the city center, causing $33,000,000 total damage
On 12/31/1934 at 18:45:56, a magnitude 7.1 (7.1 UK) earthquake occurred 92.8 miles away from Vista center
On 4/21/1918 at 22:32:30, a magnitude 6.8 (6.8 UK, Class: Strong, Intensity: VII - IX) earthquake occurred 44.3 miles away from Vista center
Magnitude types: body-wave magnitude (MB), local magnitude (ML), surface-wave magnitude (MS), moment magnitude (MW)
Natural disasters:
The number of natural disasters in San Diego County (39) is a lot greater than the US average (15).Major Disasters (Presidential) Declared: 21
Emergencies Declared: 2
Causes of natural disasters: Fires: 21, Floods: 17, Storms: 9, Winter Storms: 6, Landslides: 5, Mudslides: 4, Freeze: 1, Heavy Rain: 1, Hurricane: 1, Tornado: 1, Other: 1 (Note: some incidents may be assigned to more than one category).
Main business address for: GLACIER WATER SERVICES INC (RETAIL-NONSTORE RETAILERS), PAN PACIFIC RETAIL PROPERTIES INC (REAL ESTATE INVESTMENT TRUSTS), BW ACQUISITION INC/ NV (RETAIL-NONSTORE RETAILERS), DJ ORTHOPEDICS INC (ORTHOPEDIC, PROSTHETIC & SURGICAL APPLIANCES & SUPPLIES).
Hospitals in Vista:
- AMBER HOME (305 CARLSON COURT)
- HOME HOSPICE (2210 EAST VISTA WAY, NO 2)
- HOSPICE OF THE NORTH COAST (2095 W VISTA WAY #101)
- MARSHALL HOUSE (758 SOUTH MELROSE)
Nursing Homes in Vista:
- GARDEN TERRACE HEALTHCARE CENTER (247 E BOBIER DR)
- LIFE CARE CENTER OF VISTA (304 N. MELROSE DR)
- RANCHO VISTA (760 E BOBIER)
- RANCHO VISTA HEALTH CENTER (760 E BOBIER DRIVE)
- VISTA GOLDEN AGE LEISURE GARDENS (304 NORTH MELROSE DR, P.O.BOX 1445)
- VISTA HEALTHCARE CENTER (247 E. BOBIER DRIVE)
- VISTA KNOLL SPECIALIZED CARE FACILITY (2000 WESTWOOD ROAD)
Dialysis Facilities in Vista:
Home Health Centers in Vista:
Amtrak stations near Vista:
- 8 miles: OCEANSIDE (235 S. TREMONT ST.) . Services: ticket office, fully wheelchair accessible, enclosed waiting area, public restrooms, public payphones, snack bar, free short-term parking, free long-term parking, call for car rental service, taxi stand, intercity bus service, public transit connection.
- 15 miles: SOLANA BEACH (105 S. CEDROS AVE.) . Services: ticket office, fully wheelchair accessible, enclosed waiting area, public restrooms, public payphones, full-service food facilities, free short-term parking, free long-term parking, call for car rental service, taxi stand, public transit connection.
College/University in Vista:
Colleges/universities with over 2000 students nearest to Vista:
- MiraCosta College (about 4 miles; Oceanside, CA; Full-time enrollment: 11,189)
- Palomar College (about 5 miles; San Marcos, CA; FT enrollment: 15,037)
- California State University-San Marcos (about 7 miles; San Marcos, CA; FT enrollment: 8,070)
- National University (about 20 miles; La Jolla, CA; FT enrollment: 24,215)
- San Diego Miramar College (about 21 miles; San Diego, CA; FT enrollment: 5,128)
- University of California-San Diego (about 22 miles; La Jolla, CA; FT enrollment: 29,297)
- Alliant International University (about 23 miles; San Diego, CA; FT enrollment: 3,155)
Biggest public high schools in Vista:
- RANCHO BUENA VISTA HIGH (Students: 2,231, Location: 1601 LONGHORN DR., Grades: 9-12)
- VISTA HIGH (Students: 2,102, Location: 1 PANTHER DR., Grades: 9-12)
- GUAJOME PARK ACADEMY CHARTER (Students: 1,189, Location: 2000 N. SANTA FE AVE., Grades: KG-12, Charter school)
- ALTA VISTA HIGH (CONTINUATION) (Students: 56, Location: 1575 BONAIR DR., Grades: 9-12)
- MAJOR GENERAL RAYMOND MURRAY HIGH (Students: 52, Location: 215 N. MELROSE DR., Grades: 10-12)
- NORTH COUNTY TRADE TECH HIGH (Students: 21, Location: 1126 N. MELROSE DR., STE. 301, Grades: 9-12, Charter school)
- NATIONAL UNIVERSITY ACADEMY (Students: 17, Location: 2030 UNIVERSITY DR., Grades: KG-12, Charter school)
- NATIONAL UNIVERSITY ACADEMY, ARMONA (Location: 2030 UNIVERSITY DR., Grades: KG-12, Charter school)
- GUAJOME LEARNING CENTER (Location: 2000 N. SANTA FE AVE., Grades: KG-12, Charter school)
- VISTA VISIONS ACADEMY (Location: 305 E. BOBIER, Grades: KG-12)
Private high schools in Vista:
- TRI-CITY CHRISTIAN SCHOOLS (Students: 622, Location: 302 N EMERALD DR, Grades: KG-12)
- CALVARY CHRISTIAN SCHOOL (Students: 234, Location: 885 E VISTA WAY, Grades: KG-12)
- NEW HAVEN YFS (Students: 71, Location: 216 W LOS ANGELES DR, Grades: 4-12, Boys only)
- HALSTROM HIGH SCHOOL (Students: 54, Location: 380 S MELROSE DR STE 416, Grades: 9-12)
- WEST COAST BAPTIST SCHOOL (Students: 50, Location: 1525 BUENA VISTA DR, Grades: PK-12)
Biggest public elementary/middle schools in Vista:
- RANCHO MINERVA MIDDLE (Students: 821, Location: 2245 FOOTHILL DR., Grades: 6-8)
- VISTA ACADEMY OF VISUAL AND PERFORMING ARTS (Students: 780, Location: 600 N. SANTA FE AVE., Grades: KG-5)
- BREEZE HILL ELEMENTARY (Students: 467, Location: 1111 MELROSE WAY, Grades: KG-5)
- CASITA CENTER FOR SCIENCE/MATH/TECHNOLOGY (Students: 459, Location: 260 CEDAR DR., Grades: KG-5)
- BOBIER ELEMENTARY (Students: 427, Location: 220 W. BOBIER DR., Grades: KG-5)
- GRAPEVINE ELEMENTARY (Students: 427, Location: 630 GRAPEVINE RD., Grades: KG-5)
- JOLI ANN LEICHTAG ELEMENTARY (Students: 410, Location: 653 POINSETTIA AVE., Grades: KG-5)
- FOOTHILL OAK ELEMENTARY (Students: 387, Location: 1370 OAK DR., Grades: KG-5)
- BEAUMONT ELEMENTARY (Students: 380, Location: 550 BEAUMONT DR., Grades: KG-5)
- VISTA MAGNET MIDDLE SCHOOL OF TECHNOLOGY, SCIENCE, (Students: 372, Location: 151 CIVIC CENTER DR., Grades: 6-8)
Private elementary/middle schools in Vista:
Points of interest:
Notable locations in Vista: Rancho Guajome (A), Sunrise Terrace Campground (B), Shadow Ridge Golf Course (C), Moonlight Ampitheater (D), Ocean Hills Country Club (E), Green Oaks Ranch (F), Vista City Hall (G), Vista Chamber of Commerce (H), North County Regional Center San Diego County Library (I), Vista Fire Department Station 2 (J), Vista Fire Department Station 4 (K), Vista Fire Department Station 1 Headquarters (L). Display/hide their locations on the map
Shopping Centers: Broadway Vista Shopping Center (1), Shadowridge Plaza Shopping Center (2), Vista Gateway Regional Shopping Center (3), Tri-City Square Shopping Center (4), Melrose Center Shopping Center (5). Display/hide their locations on the map
Main business address in Vista include: GLACIER WATER SERVICES INC (A), PAN PACIFIC RETAIL PROPERTIES INC (B), BW ACQUISITION INC/ NV (C), DJ ORTHOPEDICS INC (D). Display/hide their locations on the map
Churches in Vista include: North San Diego Buddhist Church (A), Samoan Seventh Day Adventist Church (B), Assembly of God Church (C), Faith and Love Ministries (D), First Baptist Church of Vista (E), First Church of Religious Science (F), First Samoan Methodist Church (G), Hope Christian Community Church (H), North Vista Baptist Church (I). Display/hide their locations on the map
Creek: Buena Creek (A). Display/hide its location on the map
Parks in Vista include: Breeze Hill Park (1), Bub Williamson Park (2), Cedar Lane City Park (3), Thibodo Park (4), Brengle Terrace City Park (5), Buena Vista Park (6), Civic Center Park (7), Raintree Park (8), Wildwood Park (9). Display/hide their locations on the map
Tourist attractions: Antique Gas & Steam Engine Museum (2040 North Santa Fe Avenue) (1), Checkpoint66 (1407 Monte Vista Drive) (2). Display/hide their approximate locations on the map
Hotels: Best Value Inn & Suites (330 Mar Vista Drive) (1), Bosna Inn (1738 East Vista Way) (2). Display/hide their approximate locations on the map
Birthplace of: Al Katrazz - Professional wrestler, Leon Hall - College football player, Mike Marquardt - Football player, Xenia (singer) - Singer, Sean K. Reynolds - Non-fiction writer, DeMarco Sampson - American football player, Desiree Davila - Marathoner.
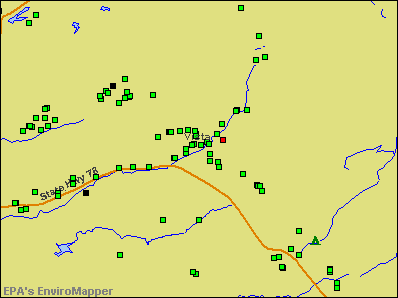
Drinking water stations with addresses in Vista and their reported violations in the past:
JUMBO LAUNDRY (Address: 1385 PARK CITY DR , Serves IL, Population served: 250, Purch groundwater):Past monitoring violations:ROCKFORD FAMILY FRUIT MARKET (Address: 1385 PARK CITY DR , Serves IL, Population served: 200, Purch groundwater):
- One routine major monitoring violation
Past monitoring violations:JEWEL FOOD STORE #3260 (Address: 1385 PARK CITY DR , Serves IL, Population served: 160, Purch groundwater):
- One regular monitoring violation
Past monitoring violations:JEWEL FOOD STORE #3306 (Address: 1385 PARK CITY DR , Serves IL, Population served: 100, Purch groundwater):
- One routine major monitoring violation
Past monitoring violations:SAFEWAY NO 1646 (Address: 1385 PARK CENTER DRIVE , Serves MT, Population served: 100, Purch groundwater):
- One routine major monitoring violation
Past monitoring violations:PEKIN FOOD DEPOT (Address: 1385 PARK CITY DR , Serves IL, Population served: 100, Purch groundwater):
- One routine major monitoring violation
Past monitoring violations:PC FOODS (Address: 1385 PARK CITY DR , Serves IL, Population served: 100, Purch groundwater):
- One regular monitoring violation
Past monitoring violations:SAFEWAY NO 2106 (Address: 1385 PARK CENTER DRIVE , Serves MT, Population served: 40, Purch surface water):
- One routine major monitoring violation
Past monitoring violations:
- One routine major monitoring violation
Drinking water stations with addresses in Vista that have no violations reported:
- RUSHVILLE COUNTY MARKET (Address: 1385 PARK CITY DR , Serves IL, Population served: 800, Primary Water Source Type: Purch groundwater)
- ORION IGA (Address: 1385 PARK CITY DR , Serves IL, Population served: 300, Primary Water Source Type: Purch groundwater)
- JEWEL NEW LENOX (Address: 1385 PARK CITY DR , Serves IL, Population served: 150, Primary Water Source Type: Purch groundwater)
- JEWEL FOOD STORE VENDING #2 (Address: 1385 PARK CITY DR , Serves IL, Population served: 143, Primary Water Source Type: Purch groundwater)
- MONTGOMERY MARKET PLACE (Address: 1385 PARK CITY DR , Serves IL, Population served: 140, Primary Water Source Type: Purch groundwater)
- HAGA SUPERMARKET (Address: 1385 PARK CITY DR , Serves IL, Population served: 100, Primary Water Source Type: Purch groundwater)
- JEWEL FOOD STORE #3343 (Address: 1385 PARK CITY DR , Serves IL, Population served: 100, Primary Water Source Type: Purch groundwater)
- JEWEL FOOD STORE #3331 (Address: 1385 PARK CITY DR , Serves IL, Population served: 100, Primary Water Source Type: Purch groundwater)
- JEWEL FOOD STORE #3313 (Address: 1385 PARK CITY DR , Serves IL, Population served: 100, Primary Water Source Type: Purch groundwater)
- JEWEL OSCO NBO (Address: 1385 PARK CITY DR , Serves IL, Population served: 100, Primary Water Source Type: Purch surface water)
| This city: | 3.1 people |
| California: | 2.9 people |
| This city: | 72.0% |
| Whole state: | 68.7% |
| This city: | 8.1% |
| Whole state: | 7.2% |
Likely homosexual households (counted as self-reported same-sex unmarried-partner households)
- Lesbian couples: 0.5% of all households
- Gay men: 0.4% of all households
People in group quarters in Vista in 2010:
- 727 people in local jails and other municipal confinement facilities
- 588 people in nursing facilities/skilled-nursing facilities
- 269 people in residential treatment centers for adults
- 209 people in group homes intended for adults
- 112 people in other noninstitutional facilities
- 57 people in emergency and transitional shelters (with sleeping facilities) for people experiencing homelessness
- 36 people in group homes for juveniles (non-correctional)
- 22 people in residential treatment centers for juveniles (non-correctional)
- 14 people in workers' group living quarters and job corps centers
- 11 people in correctional facilities intended for juveniles
People in group quarters in Vista in 2000:
- 844 people in local jails and other confinement facilities (including police lockups)
- 557 people in other noninstitutional group quarters
- 378 people in nursing homes
- 214 people in homes or halfway houses for drug/alcohol abuse
- 154 people in homes for the mentally retarded
- 48 people in other group homes
- 34 people in other types of correctional institutions
- 23 people in other nonhousehold living situations
- 6 people in mental (psychiatric) hospitals or wards
- 6 people in homes for the mentally ill
- 2 people in religious group quarters
Banks with most branches in Vista (2011 data):
- Wells Fargo Bank, National Association: Palomar Vista Branch, Vista Branch, Vista Hacienda Branch, El Tigre-East Vista Branch. Info updated 2011/04/05: Bank assets: $1,161,490.0 mil, Deposits: $905,653.0 mil, headquarters in Sioux Falls, SD, positive income, 6395 total offices, Holding Company: Wells Fargo & Company
- JPMorgan Chase Bank, National Association: Vista/Melrose Branch, 985 E Vista Way Branch, Vista Stater Brothers Banking Center. Info updated 2011/11/10: Bank assets: $1,811,678.0 mil, Deposits: $1,190,738.0 mil, headquarters in Columbus, OH, positive income, International Specialization, 5577 total offices, Holding Company: Jpmorgan Chase & Co.
- Bank of America, National Association: Vista Branch, North County Square Branch, East Vista Way Branch. Info updated 2009/11/18: Bank assets: $1,451,969.3 mil, Deposits: $1,077,176.8 mil, headquarters in Charlotte, NC, positive income, 5782 total offices, Holding Company: Bank Of America Corporation
- U.S. Bank National Association: Vista Branch, Vista Breeze Hill Branch, Vista Albertsons Branch. Info updated 2012/01/30: Bank assets: $330,470.8 mil, Deposits: $236,091.5 mil, headquarters in Cincinnati, OH, positive income, 3121 total offices, Holding Company: U.S. Bancorp
- Citibank, National Association: Vista Branch at 1611 South Melrose Drive, Suite M-N, branch established on 1996/04/01; E. Vista Way Branch at 898 East Vista Way, branch established on 1934/10/01. Info updated 2012/01/10: Bank assets: $1,288,658.0 mil, Deposits: $882,541.0 mil, headquarters in Sioux Falls, SD, positive income, International Specialization, 1048 total offices, Holding Company: Citigroup Inc.
- Comerica Bank: Vista-Melrose Banking Center at 625 South Merose Drive, branch established on 2010/07/01. Info updated 2011/07/29: Bank assets: $60,970.5 mil, Deposits: $48,300.9 mil, headquarters in Dallas, TX, positive income, Commercial Lending Specialization, 497 total offices, Holding Company: Comerica Incorporated
- California Community Bank: Vista Branch at 905 S. Santa Fe Avenue, branch established on 2004/12/21. Info updated 2007/05/30: Bank assets: $243.8 mil, Deposits: $217.1 mil, headquarters in Escondido, CA, positive income, Commercial Lending Specialization, 5 total offices
- Compass Bank: Vista Branch at 961 S. Santa Fe Avenue, branch established on 1996/06/24. Info updated 2011/02/24: Bank assets: $63,107.0 mil, Deposits: $46,232.4 mil, headquarters in Birmingham, AL, negative income in the last year, Commercial Lending Specialization, 720 total offices, Holding Company: Banco Bilbao Vizcaya Argentaria, S.A.
- California Bank & Trust: Vista Branch at 140 Civic Center Drive, branch established on 1990/07/23. Info updated 2009/07/20: Bank assets: $10,894.1 mil, Deposits: $9,193.9 mil, headquarters in San Diego, CA, positive income, Commercial Lending Specialization, 109 total offices, Holding Company: Zions Bancorporation
- 3 other banks with 3 local branches
For population 15 years and over in Vista:
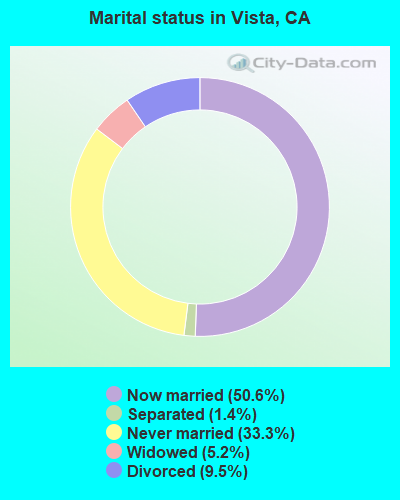
- Never married: 33.3%
- Now married: 50.6%
- Separated: 1.4%
- Widowed: 5.2%
- Divorced: 9.5%
For population 25 years and over in Vista:
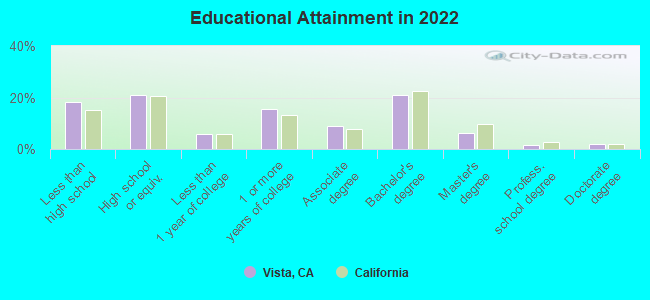
- High school or higher: 81.7%
- Bachelor's degree or higher: 30.4%
- Graduate or professional degree: 9.5%
- Unemployed: 7.2%
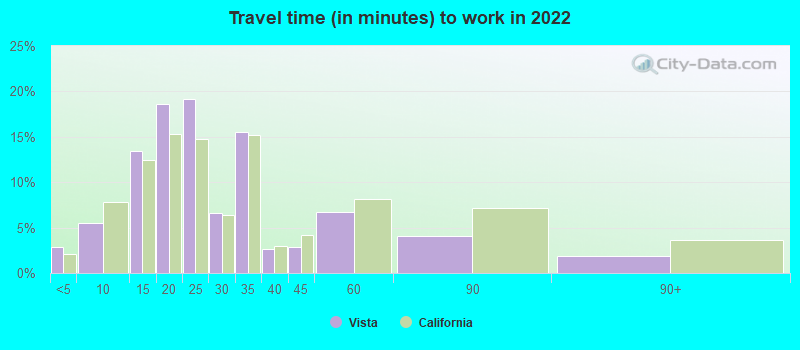
- Mean travel time to work (commute): 21.5 minutes
| Here: | 16.2 |
| California average: | 15.5 |
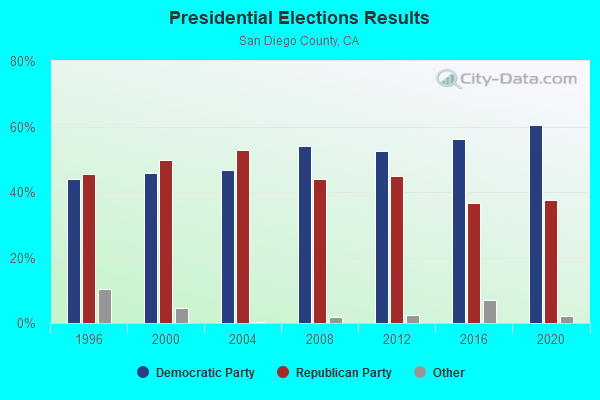
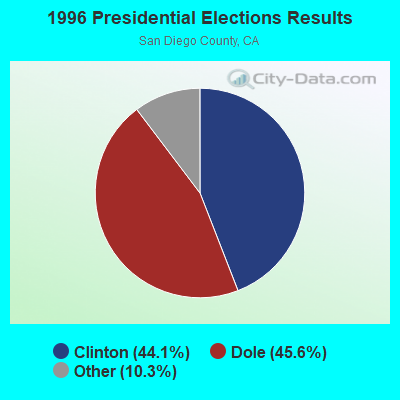
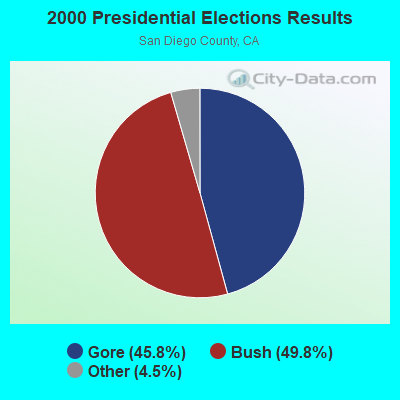
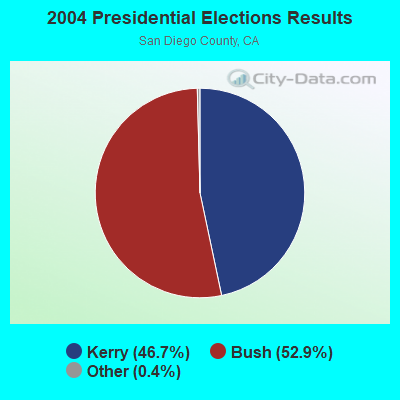
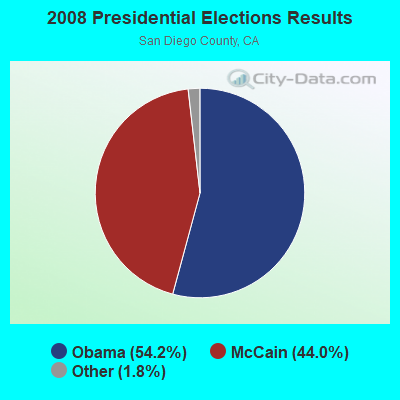
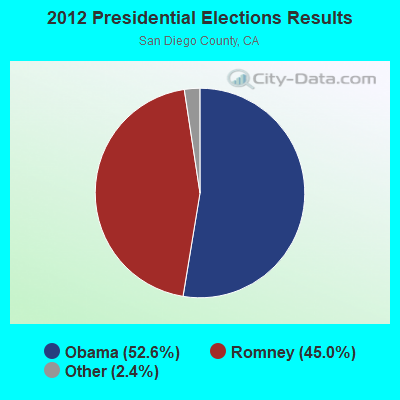
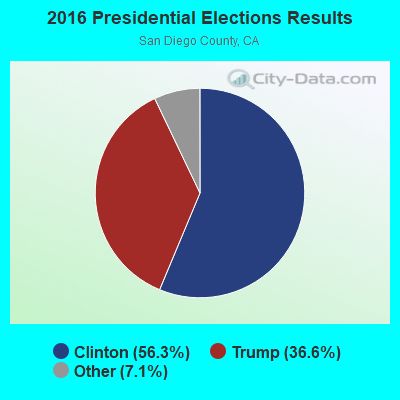
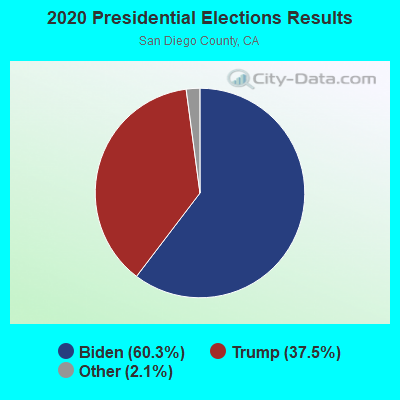
Graphs represent county-level data. Detailed 2008 Election Results
Neighborhoods in Vista:
(Vista, California Neighborhood Map)Religion statistics for Vista, CA (based on San Diego County data)
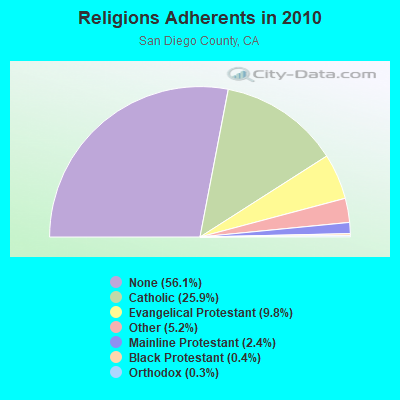
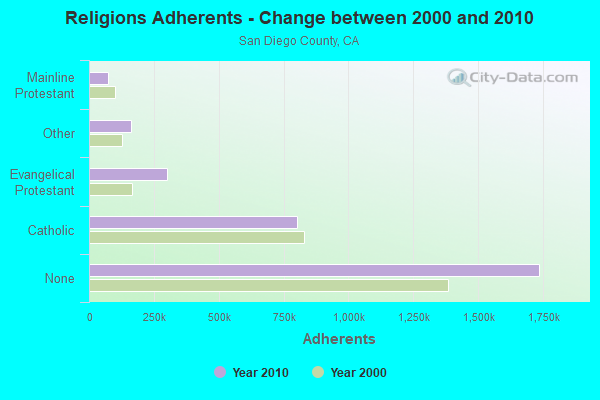
| Religion | Adherents | Congregations |
|---|---|---|
| Catholic | 801,850 | 115 |
| Evangelical Protestant | 302,320 | 974 |
| Other | 161,530 | 349 |
| Mainline Protestant | 74,992 | 211 |
| Black Protestant | 10,857 | 52 |
| Orthodox | 7,828 | 19 |
| None | 1,735,936 | - |
Food Environment Statistics:
| San Diego County: | 1.94 / 10,000 pop. |
| State: | 2.14 / 10,000 pop. |
| San Diego County: | 0.06 / 10,000 pop. |
| State: | 0.04 / 10,000 pop. |
| Here: | 0.77 / 10,000 pop. |
| California: | 0.62 / 10,000 pop. |
| Here: | 1.65 / 10,000 pop. |
| California: | 1.49 / 10,000 pop. |
| San Diego County: | 7.56 / 10,000 pop. |
| State: | 7.42 / 10,000 pop. |
| San Diego County: | 6.5% |
| State: | 7.3% |
| This county: | 22.2% |
| California: | 21.3% |
| San Diego County: | 16.0% |
| State: | 17.9% |
Health and Nutrition:
| This city: | 47.5% |
| State: | 49.4% |
| Vista: | 46.4% |
| California: | 48.0% |
| Vista: | 28.2 |
| State: | 28.1 |
| Vista: | 20.7% |
| California: | 20.2% |
| Here: | 10.1% |
| State: | 11.2% |
| Here: | 6.8 |
| State: | 6.8 |
| Here: | 31.0% |
| California: | 31.5% |
| Vista: | 56.0% |
| California: | 56.4% |
| Vista: | 80.8% |
| California: | 80.9% |
More about Health and Nutrition of Vista, CA Residents
| Local government employment and payroll (March 2022) | |||||
| Function | Full-time employees | Monthly full-time payroll | Average yearly full-time wage | Part-time employees | Monthly part-time payroll |
|---|---|---|---|---|---|
| Firefighters | 81 | $973,730 | $144,256 | 0 | $0 |
| Other and Unallocable | 43 | $247,850 | $69,167 | 0 | $0 |
| Sewerage | 34 | $266,188 | $93,949 | 0 | $0 |
| Streets and Highways | 30 | $228,719 | $91,488 | 0 | $0 |
| Other Government Administration | 29 | $217,044 | $89,811 | 0 | $0 |
| Parks and Recreation | 23 | $122,783 | $64,061 | 44 | $30,832 |
| Financial Administration | 20 | $140,801 | $84,481 | 0 | $0 |
| Judicial and Legal | 6 | $75,292 | $150,584 | 0 | $0 |
| Fire - Other | 5 | $35,970 | $86,328 | 1 | $7,227 |
| Welfare | 5 | $22,016 | $52,838 | 5 | $4,272 |
| Housing and Community Development (Local) | 2 | $15,646 | $93,876 | 0 | $0 |
| Totals for Government | 278 | $2,346,040 | $101,268 | 50 | $42,331 |
Vista government finances - Expenditure in 2017 (per resident):
- Construction - Sewerage: $20,251,000 ($207.14)
Housing and Community Development: $749,000 ($7.66)
- Current Operations - Police Protection: $23,765,000 ($243.08)
Local Fire Protection: $15,056,000 ($154.00)
Sewerage: $14,234,000 ($145.59)
Central Staff Services: $12,897,000 ($131.92)
Parks and Recreation: $8,771,000 ($89.71)
Regular Highways: $6,265,000 ($64.08)
Health - Other: $4,216,000 ($43.12)
Protective Inspection and Regulation - Other: $2,629,000 ($26.89)
Housing and Community Development: $2,405,000 ($24.60)
Financial Administration: $1,557,000 ($15.93)
General - Other: $107,000 ($1.09)
- General - Interest on Debt: $9,712,000 ($99.34)
- Intergovernmental to Local - Other - Police Protection: $40,830,000 ($417.63)
Other - Sewerage: $12,586,000 ($128.74)
- Total Salaries and Wages: $678,000 ($6.93)
Vista government finances - Revenue in 2017 (per resident):
- Charges - Sewerage: $29,220,000 ($298.88)
Other: $11,858,000 ($121.29)
Parks and Recreation: $4,285,000 ($43.83)
Housing and Community Development: $2,671,000 ($27.32)
Regular Highways: $1,291,000 ($13.20)
- Federal Intergovernmental - Other: $1,349,000 ($13.80)
Housing and Community Development: $911,000 ($9.32)
- Local Intergovernmental - Other: $212,000 ($2.17)
Sewerage: $76,000 ($0.78)
- Miscellaneous - General Revenue - Other: $3,789,000 ($38.76)
Rents: $1,666,000 ($17.04)
Fines and Forfeits: $1,650,000 ($16.88)
Interest Earnings: $1,134,000 ($11.60)
Donations From Private Sources: $457,000 ($4.67)
Sale of Property: $305,000 ($3.12)
Special Assessments: $6,000 ($0.06)
- State Intergovernmental - Other: $4,313,000 ($44.12)
Highways: $1,970,000 ($20.15)
General Local Government Support: $83,000 ($0.85)
- Tax - Property: $33,153,000 ($339.11)
General Sales and Gross Receipts: $28,133,000 ($287.76)
Public Utilities Sales: $3,511,000 ($35.91)
Other License: $2,915,000 ($29.82)
Occupation and Business License - Other: $1,910,000 ($19.54)
Other Selective Sales: $1,410,000 ($14.42)
Documentary and Stock Transfer: $576,000 ($5.89)
Vista government finances - Debt in 2017 (per resident):
- Long Term Debt - Beginning Outstanding - Unspecified Public Purpose: $219,649,000 ($2246.68)
Outstanding Unspecified Public Purpose: $217,334,000 ($2223.00)
Retired Unspecified Public Purpose: $7,589,000 ($77.62)
Beginning Outstanding - Public Debt for Private Purpose: $5,485,000 ($56.10)
Outstanding Nonguaranteed - Industrial Revenue: $5,485,000 ($56.10)
Issue, Unspecified Public Purpose: $5,274,000 ($53.95)
Vista government finances - Cash and Securities in 2017 (per resident):
- Bond Funds - Cash and Securities: $15,027,000 ($153.70)
- Other Funds - Cash and Securities: $241,094,000 ($2466.03)
- Sinking Funds - Cash and Securities: $15,358,000 ($157.09)
5.18% of this county's 2021 resident taxpayers lived in other counties in 2020 ($90,734 average adjusted gross income)
| Here: | 5.18% |
| California average: | 5.19% |
0.14% of residents moved from foreign countries ($1,493 average AGI)
San Diego County: 0.14% California average: 0.03%
Top counties from which taxpayers relocated into this county between 2020 and 2021:
| from Los Angeles County, CA | |
| from Riverside County, CA | |
| from Orange County, CA |
5.71% of this county's 2020 resident taxpayers moved to other counties in 2021 ($83,556 average adjusted gross income)
| Here: | 5.71% |
| California average: | 6.14% |
0.09% of residents moved to foreign countries ($1,067 average AGI)
San Diego County: 0.09% California average: 0.02%
Top counties to which taxpayers relocated from this county between 2020 and 2021:
| to Riverside County, CA | |
| to Los Angeles County, CA | |
| to Orange County, CA |
| Businesses in Vista, CA | ||||
| Name | Count | Name | Count | |
|---|---|---|---|---|
| 24 Hour Fitness | 1 | Kroger | 1 | |
| 7-Eleven | 8 | LA Fitness | 1 | |
| 99 Cents Only Stores | 1 | La Quinta | 1 | |
| AT&T | 1 | Little Caesars Pizza | 3 | |
| Albertsons | 2 | Lowe's | 1 | |
| AutoZone | 2 | Marriott | 1 | |
| BMW | 1 | MasterBrand Cabinets | 7 | |
| Bally Total Fitness | 1 | McDonald's | 2 | |
| Blockbuster | 1 | New Balance | 2 | |
| Budget Car Rental | 1 | Nike | 2 | |
| Burger King | 2 | Office Depot | 1 | |
| Burlington Coat Factory | 1 | Old Navy | 1 | |
| CVS | 4 | Panda Express | 2 | |
| Carl\s Jr. | 2 | Panera Bread | 1 | |
| Chipotle | 1 | Papa John's Pizza | 1 | |
| Chuck E. Cheese's | 1 | Payless | 3 | |
| Circle K | 1 | Penske | 1 | |
| Cold Stone Creamery | 1 | PetSmart | 1 | |
| Costco | 1 | Pizza Hut | 1 | |
| Cricket Wireless | 5 | RadioShack | 1 | |
| DHL | 1 | Rite Aid | 1 | |
| Dairy Queen | 1 | SONIC Drive-In | 1 | |
| Decora Cabinetry | 1 | Safeway | 1 | |
| Dennys | 1 | Sprint Nextel | 1 | |
| Discount Tire | 1 | Staples | 1 | |
| Domino's Pizza | 2 | Starbucks | 9 | |
| El Pollo Loco | 1 | Subway | 10 | |
| Famous Footwear | 1 | T-Mobile | 7 | |
| FedEx | 13 | Taco Bell | 2 | |
| Firestone Complete Auto Care | 1 | Target | 2 | |
| GNC | 2 | Toys"R"Us | 1 | |
| GameStop | 3 | True Value | 1 | |
| Goodwill | 1 | U-Haul | 3 | |
| H&R Block | 3 | UPS | 9 | |
| Home Depot | 1 | Vans | 1 | |
| IHOP | 1 | Vons | 1 | |
| Jack In The Box | 5 | Walgreens | 3 | |
| Jamba Juice | 1 | Walmart | 1 | |
| Jones New York | 2 | Wendy's | 1 | |
| KFC | 1 | World Gym | 1 | |
Strongest AM radio stations in Vista:
- KCEO (1000 AM; 2 kW; VISTA, CA; Owner: NORTH COUNTY BROADCASTING CORPORATIO)
- KPRZ (1210 AM; 20 kW; SAN MARCOS, CA; Owner: RADIO 1210, INC.)
- KFMB (760 AM; 50 kW; SAN DIEGO, CA; Owner: MIDWEST TELEVISION, INC.)
- KCBQ (1170 AM; 50 kW; SAN DIEGO, CA; Owner: RADIO 1210, INC.)
- KPLS (830 AM; 50 kW; ORANGE, CA; Owner: CRN LICENSES, LLC)
- KFI (640 AM; 50 kW; LOS ANGELES, CA; Owner: CAPSTAR TX LIMITED PARTNERSHIP)
- KLAC (570 AM; 50 kW; LOS ANGELES, CA; Owner: AMFM RADIO LICENSES, L.L.C.)
- KKSM (1320 AM; 0 kW; OCEANSIDE, CA; Owner: PALOMAR COMMUNITY COLLEGE DISTRICT)
- KSDO (1130 AM; 10 kW; SAN DIEGO, CA; Owner: HI-FAVOR BROADCASTING, LLC)
- KTNQ (1020 AM; 50 kW; LOS ANGELES, CA; Owner: KTNQ-AM LICENSE CORP.)
- KFSD (1450 AM; 1 kW; ESCONDIDO, CA; Owner: NORTH COUNTY BROADCASTING CORP.)
- KXTA (1150 AM; 50 kW; LOS ANGELES, CA; Owner: CITICASTERS LICENSES, L.P.)
- KDIS (1110 AM; 50 kW; PASADENA, CA; Owner: ABC,INC.)
Strongest FM radio stations in Vista:
- KPRI (102.1 FM; ENCINITAS, CA; Owner: COMPASS RADIO OF SAN DIEGO, INC.)
- KFSD-FM (92.1 FM; ESCONDIDO, CA; Owner: NORTH COUNTY BROADCASTING CORP.)
- KRTM (88.9 FM; TEMECULA, CA; Owner: PENFOLD COMMUNICATIONS, INC.)
- KWVE (107.9 FM; SAN CLEMENTE, CA; Owner: CALVARY CHAPEL OF COSTA MESA)
- KLQV (102.9 FM; SAN DIEGO, CA; Owner: HBC LICENSE CORPORATION)
- KPBS-FM (89.5 FM; SAN DIEGO, CA; Owner: THE BD. OF TRUSTEES, CALIFORNIA STATE UNIVERSITY)
- KLVJ (100.1 FM; JULIAN, CA; Owner: EDUCATIONAL MEDIA FOUNDATION)
- KLRD (90.1 FM; YUCAIPA, CA; Owner: EDUCATIONAL MEDIA FOUNDATION)
- KHTS-FM (93.3 FM; EL CAJON, CA; Owner: CITICASTERS LICENSES, L.P.)
- KGBB (103.3 FM; TEMECULA, CA; Owner: CLEAR CHANNEL BROADCASTING LICENSES, INC.)
- KMYT (94.5 FM; TEMECULA, CA; Owner: CLEAR CHANNEL BROADCASTING LICENSES, INC.)
- K210CL (89.9 FM; LEMON GROVE, CA; Owner: SANTA MONICA COMMUNITY COLLEGE DISTRICT)
- KGB-FM (101.5 FM; SAN DIEGO, CA; Owner: CITICASTERS LICENSES, L.P.)
- KSON-FM (97.3 FM; SAN DIEGO, CA; Owner: JEFFERSON-PILOT COMMUNICATIONS COMPANY OF CALIFORNIA)
- KUOR-FM (89.1 FM; REDLANDS, CA; Owner: UNIVERSITY OF REDLANDS)
- KATY-FM (101.3 FM; IDYLLWILD, CA; Owner: ALL PRO BROADCASTING, INC.)
- K252BF (98.3 FM; TEMECULA, CA; Owner: ENTRAVISION HOLDINGS, LLC)
- K201AR (88.1 FM; BANNING, CA; Owner: KSGN, INC.)
- K232CX (94.3 FM; DESERT HOT SPRINGS, CA; Owner: MCC RADIO, LLC)
- KLNV (106.5 FM; SAN DIEGO, CA; Owner: HBC LICENSE CORPORATION)
TV broadcast stations around Vista:
- KHAX-LP (Channel 49; VISTA, CA; Owner: ENTRAVISION HOLDINGS, LLC)
- K26FA (Channel 26; VISTA, CA; Owner: RICK D'AMICO)
- National Bridge Inventory (NBI) Statistics
- 21Number of bridges
- 282ft / 86.4mTotal length
- $11,760,000Total costs
- 1,558,472Total average daily traffic
- 68,864Total average daily truck traffic
- New bridges - historical statistics
- 71960-1969
- 31970-1979
- 111990-1999
FCC Registered Commercial Land Mobile Towers: 3 (See the full list of FCC Registered Commercial Land Mobile Towers in Vista, CA)
FCC Registered Private Land Mobile Towers: 6 (See the full list of FCC Registered Private Land Mobile Towers)
FCC Registered Broadcast Land Mobile Towers: 57 (See the full list of FCC Registered Broadcast Land Mobile Towers)
FCC Registered Microwave Towers: 30 (See the full list of FCC Registered Microwave Towers in this town)
FCC Registered Paging Towers: 18 (See the full list of FCC Registered Paging Towers)
FCC Registered Maritime Coast & Aviation Ground Towers: 2 (See the full list of FCC Registered Maritime Coast & Aviation Ground Towers)
FCC Registered Amateur Radio Licenses: 697 (See the full list of FCC Registered Amateur Radio Licenses in Vista)
FAA Registered Aircraft Manufacturers and Dealers: 6 (See the full list of FAA Registered Manufacturers and Dealers in Vista)
FAA Registered Aircraft: 58 (See the full list of FAA Registered Aircraft)
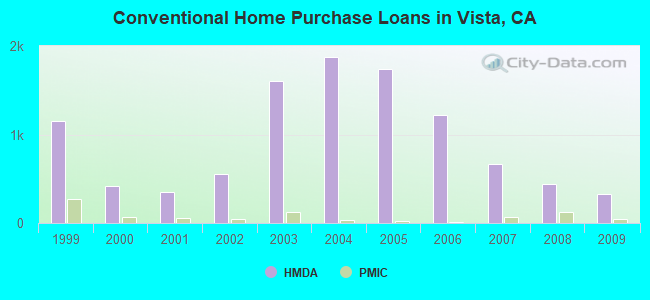
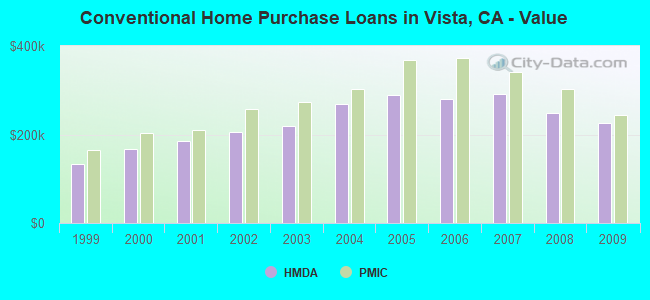
| Home Mortgage Disclosure Act Aggregated Statistics For Year 2009 (Based on 11 full and 12 partial tracts) | ||||||||||||||
| A) FHA, FSA/RHS & VA Home Purchase Loans | B) Conventional Home Purchase Loans | C) Refinancings | D) Home Improvement Loans | E) Loans on Dwellings For 5+ Families | F) Non-occupant Loans on < 5 Family Dwellings (A B C & D) | G) Loans On Manufactured Home Dwelling (A B C & D) | ||||||||
|---|---|---|---|---|---|---|---|---|---|---|---|---|---|---|
| Number | Average Value | Number | Average Value | Number | Average Value | Number | Average Value | Number | Average Value | Number | Average Value | Number | Average Value | |
| LOANS ORIGINATED | 400 | $265,485 | 330 | $225,338 | 876 | $250,211 | 19 | $178,548 | 4 | $1,572,600 | 148 | $184,765 | 18 | $154,812 |
| APPLICATIONS APPROVED, NOT ACCEPTED | 37 | $262,878 | 47 | $224,080 | 114 | $272,069 | 2 | $164,245 | 3 | $1,008,330 | 17 | $233,725 | 5 | $89,754 |
| APPLICATIONS DENIED | 88 | $255,109 | 82 | $218,787 | 322 | $273,984 | 23 | $75,143 | 1 | $1,578,790 | 52 | $179,556 | 14 | $115,966 |
| APPLICATIONS WITHDRAWN | 69 | $258,841 | 60 | $212,046 | 176 | $264,252 | 10 | $166,398 | 0 | $0 | 38 | $170,630 | 5 | $197,142 |
| FILES CLOSED FOR INCOMPLETENESS | 18 | $225,603 | 15 | $231,183 | 48 | $262,168 | 2 | $352,345 | 1 | $1,562,280 | 8 | $183,999 | 2 | $132,200 |
Detailed mortgage data for all 23 tracts in Vista, CA
| Private Mortgage Insurance Companies Aggregated Statistics For Year 2009 (Based on 11 full and 12 partial tracts) | ||||
| A) Conventional Home Purchase Loans | B) Refinancings | |||
|---|---|---|---|---|
| Number | Average Value | Number | Average Value | |
| LOANS ORIGINATED | 41 | $244,530 | 9 | $316,366 |
| APPLICATIONS APPROVED, NOT ACCEPTED | 18 | $274,868 | 6 | $378,202 |
| APPLICATIONS DENIED | 7 | $255,614 | 3 | $283,030 |
| APPLICATIONS WITHDRAWN | 2 | $267,650 | 0 | $0 |
| FILES CLOSED FOR INCOMPLETENESS | 1 | $420,520 | 0 | $0 |
2005 - 2018 National Fire Incident Reporting System (NFIRS) incidents
- Fire incident types reported to NFIRS in Vista, CA
- 1,21139.6%Structure Fires
- 1,20239.3%Outside Fires
- 51216.7%Mobile Property/Vehicle Fires
- 1354.4%Other
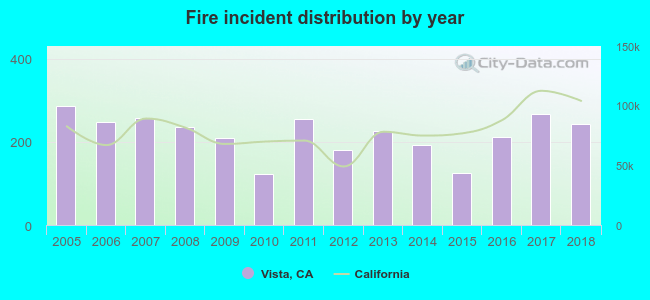 Based on the data from the years 2005 - 2018 the average number of fire incidents per year is 219. The highest number of fires - 287 took place in 2005, and the least - 123 in 2010. The data has a decreasing trend.
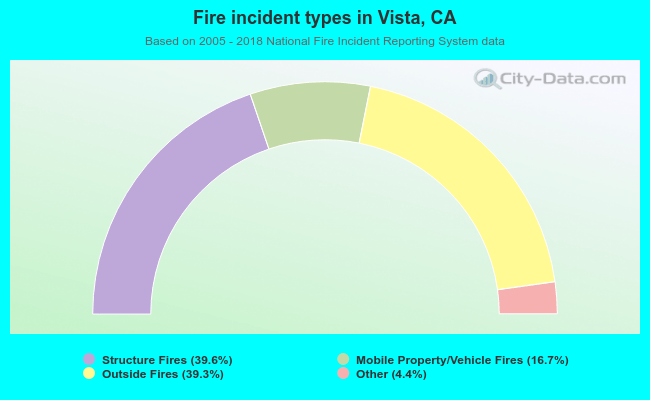 When looking into fire subcategories, the most reports belonged to: Structure Fires (39.6%), and Outside Fires (39.3%).
Fire-safe hotels and motels in Vista, California:
- La Quinta Motor Inn #643, 630 Sycamore Ave, Vista, California 92083 , Phone: (760) 727-8180
- Americas Best Value Inn & Suites, 330 Mar Vista Dr, Vista, California 92083 , Phone: (760) 726-2900, Fax: (760) 726-2900
- Towneplace Suites by Marriott San Diego Carlsbad/Vista, 2201 S Melrose Dr, Vista, California 92081 , Phone: (760) 216-6010, Fax: (760) 216-6090
- Hyatt Place Vista/Carlsbad, 2645 Melrose Dr, Vista, California 92081 , Phone: (760) 814-8879
| Most common first names in Vista, CA among deceased individuals | ||
| Name | Count | Lived (average) |
|---|---|---|
| John | 431 | 76.4 years |
| William | 389 | 77.5 years |
| Mary | 349 | 80.1 years |
| Robert | 324 | 73.0 years |
| James | 290 | 74.7 years |
| Charles | 259 | 77.1 years |
| George | 241 | 78.3 years |
| Margaret | 192 | 81.4 years |
| Dorothy | 183 | 79.5 years |
| Helen | 177 | 81.4 years |
| Most common last names in Vista, CA among deceased individuals | ||
| Last name | Count | Lived (average) |
|---|---|---|
| Smith | 157 | 79.0 years |
| Johnson | 126 | 77.7 years |
| Anderson | 90 | 78.1 years |
| Miller | 79 | 75.5 years |
| Jones | 74 | 77.7 years |
| Brown | 71 | 78.1 years |
| Davis | 63 | 75.5 years |
| Williams | 62 | 80.2 years |
| Thompson | 57 | 79.4 years |
| Wilson | 53 | 76.9 years |
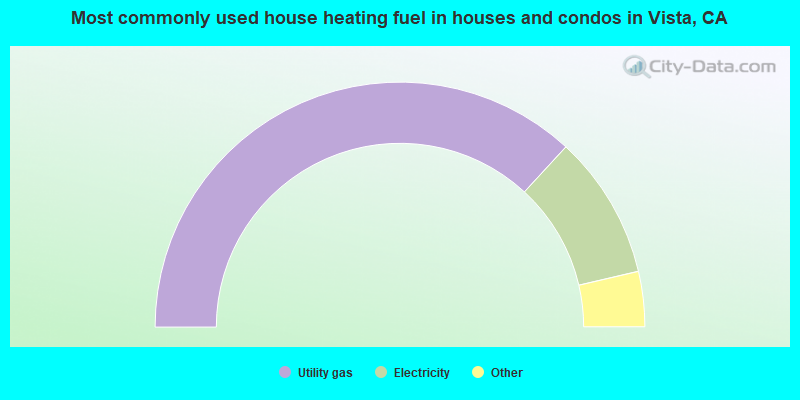
- 73.7%Utility gas
- 19.0%Electricity
- 3.8%Bottled, tank, or LP gas
- 1.4%Solar energy
- 1.1%No fuel used
- 0.8%Wood
- 0.1%Other fuel
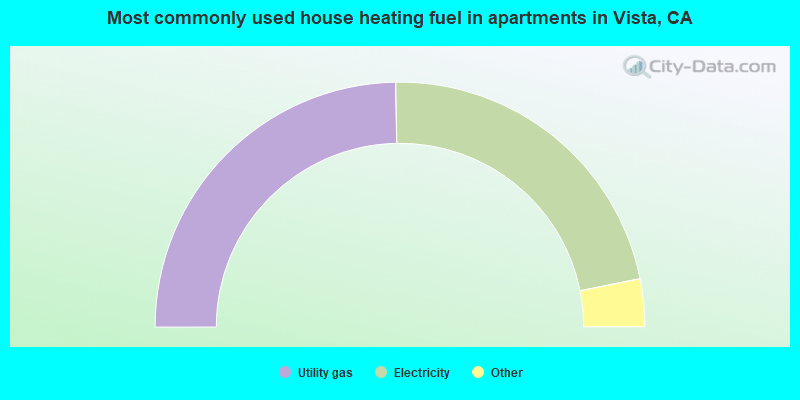
- 49.5%Utility gas
- 44.3%Electricity
- 2.9%No fuel used
- 2.8%Bottled, tank, or LP gas
- 0.3%Solar energy
- 0.3%Wood
Vista compared to California state average:
- Unemployed percentage below state average.
- Black race population percentage below state average.
Vista on our top lists:
- #13 on the list of "Top 100 cities with biggest houses (pop. 50,000+)"
- #20 on the list of "Top 101 cities with largest percentage of males in occupations: building and grounds cleaning and maintenance occupations (population 50,000+)"
- #22 on the list of "Top 101 cities with largest percentage of males in occupations: farming, fishing, and forestry occupations (population 50,000+)"
- #30 on the list of "Top 101 cities with largest percentage of males in industries: agriculture, forestry, fishing and hunting (population 50,000+)"
- #35 on the list of "Top 101 cities with the smallest differences between morning and afternoon humidity (population 50,000+)"
- #35 on the list of "Top 101 cities with the smallest humidity differences during a year (population 50,000+)"
- #37 on the list of "Top 101 cities with largest percentage of females in occupations: farming, fishing, and forestry occupations (population 50,000+)"
- #41 on the list of "Top 101 cities with largest percentage of females in occupations: installation, maintenance, and repair occupations (population 50,000+)"
- #41 on the list of "Top 101 cities with largest percentage of females in industries: retail trade (population 50,000+)"
- #47 on the list of "Top 101 cities with largest percentage of males in industries: other services, except public administration (population 50,000+)"
- #55 on the list of "Top 100 cities with highest ratio of median house value to median household income (pop. 50,000+)"
- #58 on the list of "Top 101 cities with largest percentage of females in occupations: production occupations (population 50,000+)"
- #59 on the list of "Top 101 cities with the lowest number of thefts per 100,000 residents (population 50,000+)"
- #68 on the list of "Top 101 cities with the least people having Master's or Doctorate degrees (population 50,000+)"
- #68 on the list of "Top 101 cities with the smallest percentage of high school students in private schools (3,000+ students)"
- #69 on the list of "Top 101 cities with largest percentage of males in occupations: personal care and service occupations (population 50,000+)"
- #71 on the list of "Top 101 cities with largest percentage of females in industries: agriculture, forestry, fishing and hunting (population 50,000+)"
- #78 on the list of "Top 101 cities with the lowest average wind speeds (population 50,000+)"
- #83 on the list of "Top 101 cities with the lowest average snowfall in a year (population 50,000+)"
- #86 on the list of "Top 101 larger cities with the largest decrease or smallest increase in household income from 2000 (population 50,000+)"
- #4 on the list of "Top 101 counties with the most Catholic adherents"
- #4 on the list of "Top 101 counties with the highest lead air pollution readings in 2012 (µg/m3)"
- #7 on the list of "Top 101 counties with the most Evangelical Protestant congregations"
- #7 on the list of "Top 101 counties with the most Catholic congregations"
- #7 on the list of "Top 101 counties with the highest surface withdrawal of fresh water for public supply (pop. 50,000+)"

|
|
Total of 1878 patent applications in 2008-2024.