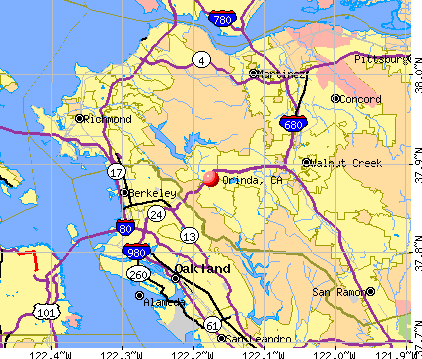
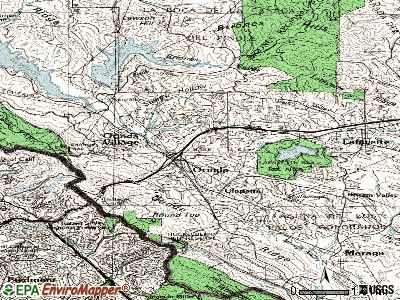
Orinda, California
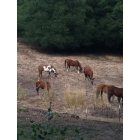
Orinda: Horses from the Orinda Horseman! From my back porch!
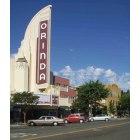
Orinda: Orinda Theater
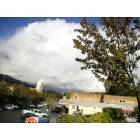
Orinda: Orinda South east side.
- add
your


Submit your own pictures of this city and show them to the world
- OSM Map
- General Map
- Google Map
- MSN Map
Population change since 2000: +10.0%
 |
| Males: 9,578 | |
| Females: 9,777 |
| Median resident age: | 49.9 years |
| California median age: | 37.9 years |
Zip codes: 94563.
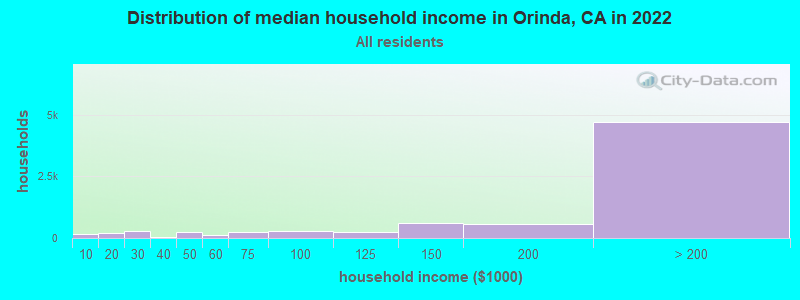
| Orinda: | over $200,000 |
| CA: | $91,551 |
Estimated per capita income in 2022: $143,441 (it was $65,428 in 2000)
Orinda city income, earnings, and wages data
Estimated median house or condo value in 2022: over $1,000,000 (it was $630,500 in 2000)
| Orinda: | over $1,000,000 |
| CA: | $715,900 |
Mean prices in 2022: all housing units: over $1,000,000; detached houses: over $1,000,000; townhouses or other attached units: over $1,000,000; in 5-or-more-unit structures: over $1,000,000
Median gross rent in 2022: $2,363.
(2.0% for White Non-Hispanic residents, 59.3% for Black residents, 4.8% for Hispanic or Latino residents, 29.6% for other race residents, 0.6% for two or more races residents)
Detailed information about poverty and poor residents in Orinda, CA


Compare current foreclosures near Orinda, CA:
| Photo | Address | Area | Beds / Baths | Price | Details |
|---|---|---|---|---|---|

|
#1
Los Cerros
Orinda, CA 94563
|
2,959 sq. feet
|
2 baths 4 beds |
show details | |

|
#2
El Verano
Orinda, CA 94563
|
1,616 sq. feet
|
2 baths 3 beds |
show details | |

|
#3
Vista Del Orinda
Orinda, CA 94563
|
1,981 sq. feet
|
2 baths 4 beds |
show details | |

|
#4
La Espiral
Orinda, CA 94563
|
4,187 sq. feet
|
4 baths 4 beds |
show details | |

|
#5
Tahos Rd
Orinda, CA 94563
|
2,680 sq. feet
|
3 baths 3 beds |
show details | |

|
#6
El Camino Moraga
Orinda, CA 94563
|
2,224 sq. feet
|
2 baths 3 beds |
show details | |

|
#7
La Espiral
Orinda, CA 94563
|
3,321 sq. feet
|
4 baths 5 beds |
show details | |

|
#8
El Camino Moraga
Orinda, CA 94563
|
2,224 sq. feet
|
2 baths 3 beds |
show details | |

|
#9
El Toyonal
Orinda, CA 94563
|
- sq. feet
|
- baths - beds |
show details | |

|
#10
El Caminito
Orinda, CA 94563
|
- sq. feet
|
- baths - beds |
show details |
| Photo | Address | Area | Beds / Baths | Price | Details |
|---|---|---|---|---|---|

|
#11
Bolsita Way
Orinda, CA 94563
|
- sq. feet
|
- baths - beds |
show details | |

|
#12
Via Floreado
Orinda, CA 94563
|
- sq. feet
|
- baths - beds |
show details | |

|
#13
Macarthur Blvd
Oakland, CA 94605
|
1,313 sq. feet
|
3 baths 3 beds |
$599,000
|
show details |

|
#14
2nd St
Richmond, CA 94801
|
887 sq. feet
|
1 baths 3 beds |
$364,000
|
show details |

|
#15
Citron Knl
Orinda, CA 94563
|
- sq. feet
|
- baths - beds |
show details | |

|
#16
El Portal Dr Apt D
San Pablo, CA 94806
|
1,058 sq. feet
|
2 baths 2 beds |
show details | |

|
#17
Ritchie St
Oakland, CA 94605
|
2,208 sq. feet
|
2 baths 3 beds |
show details | |

|
#18
Kelsey St
Richmond, CA 94801
|
1,080 sq. feet
|
3 baths 4 beds |
show details | |

|
#19
Wickman Pl
San Lorenzo, CA 94580
|
900 sq. feet
|
1 baths 2 beds |
show details | |

|
#20
Mohr Ln Apt C
Concord, CA 94518
|
870 sq. feet
|
1 baths 2 beds |
show details |
| Photo | Address | Area | Beds / Baths | Price | Details |
|---|---|---|---|---|---|

|
#21
66th Ave
Oakland, CA 94621
|
1,224 sq. feet
|
1 baths 2 beds |
show details | |

|
#22
F St
Oakland, CA 94603
|
842 sq. feet
|
1 baths 2 beds |
show details | |

|
#23
Denkinger Rd
Concord, CA 94521
|
896 sq. feet
|
1 baths 2 beds |
show details | |

|
#24
101st Ave
Oakland, CA 94603
|
1,134 sq. feet
|
1 baths 3 beds |
show details | |

|
#25
Price Ln
Pleasant Hill, CA 94523
|
2,246 sq. feet
|
2 baths 3 beds |
show details | |

|
#26
Virginia St
Berkeley, CA 94702
|
1,690 sq. feet
|
2 baths 3 beds |
show details | |

|
#27
106th Ave
Oakland, CA 94605
|
1,127 sq. feet
|
1 baths 3 beds |
show details | |

|
#28
Los Angeles St
Emeryville, CA 94608
|
803 sq. feet
|
1 baths 2 beds |
show details | |

|
#29
Hoover Ct
Concord, CA 94521
|
1,700 sq. feet
|
2 baths 5 beds |
show details | |

|
#30
Duperu Dr
Crockett, CA 94525
|
2,476 sq. feet
|
3 baths 4 beds |
show details |
| Photo | Address | Area | Beds / Baths | Price | Details |
|---|---|---|---|---|---|

|
#31
67th Ave
Oakland, CA 94621
|
1,034 sq. feet
|
1 baths 2 beds |
show details | |

|
#32
Marcella St
San Leandro, CA 94578
|
1,426 sq. feet
|
1 baths 3 beds |
show details | |

|
#33
1322 94th Ave
Oakland, CA 94603
|
1,280 sq. feet
|
1 baths 2 beds |
show details | |

|
#34
Montecillo Dr
Walnut Creek, CA 94595
|
3,148 sq. feet
|
3 baths 5 beds |
show details | |

|
#35
Begonia Dr
San Leandro, CA 94578
|
2,741 sq. feet
|
3 baths 5 beds |
show details | |

|
#36
Levee Rd
Pittsburg, CA 94565
|
1,312 sq. feet
|
2 baths 3 beds |
show details | |

|
#37
Greenwich St Apt 3
San Francisco, CA 94109
|
998 sq. feet
|
1 baths 1 beds |
show details | |

|
#38
Beverly Pl
Berkeley, CA 94707
|
1,308 sq. feet
|
1 baths 2 beds |
show details | |

|
#39
Madera Ct
Danville, CA 94526
|
2,344 sq. feet
|
3 baths 4 beds |
show details | |

|
#40
72nd Ave
Oakland, CA 94621
|
1,170 sq. feet
|
2 baths 3 beds |
show details |
| Photo | Address | Area | Beds / Baths | Price | Details |
|---|---|---|---|---|---|

|
#41
Santa Maria Ave
Castro Valley, CA 94546
|
1,176 sq. feet
|
1 baths 3 beds |
show details | |

|
#42
Leslie Ave
Martinez, CA 94553
|
1,006 sq. feet
|
1 baths 2 beds |
show details | |

|
#43
El Dorado Ave
Berkeley, CA 94707
|
2,370 sq. feet
|
2 baths 4 beds |
show details | |

|
#44
Leslie Ave
Martinez, CA 94553
|
1,006 sq. feet
|
1 baths 2 beds |
show details | |

|
#45
Acapulco Rd
San Leandro, CA 94577
|
1,196 sq. feet
|
2 baths 3 beds |
show details | |

|
#46
Whyte Park Ave
Walnut Creek, CA 94595
|
2,389 sq. feet
|
2 baths 3 beds |
show details | |

|
#47
Vaqueros Ave
Rodeo, CA 94572
|
935 sq. feet
|
2 baths 3 beds |
show details | |

|
#48
Kelvin Rd
El Sobrante, CA 94803
|
1,718 sq. feet
|
1 baths 3 beds |
show details | |

|
#49
36th St
Richmond, CA 94805
|
1,116 sq. feet
|
1 baths 2 beds |
show details | |

|
Check over 1 million property listings on Foreclosure.com!
|
browse all offers | |||


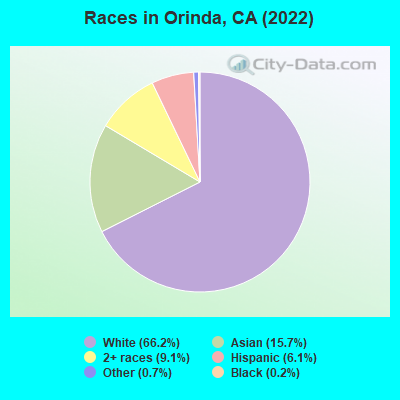
- 12,82566.2%White alone
- 3,03415.7%Asian alone
- 1,7679.1%Two or more races
- 1,1896.1%Hispanic
- 1440.7%Other race alone
- 370.2%Black alone
According to our research of California and other state lists, there were 3 registered sex offenders living in Orinda, California as of April 27, 2024.
The ratio of all residents to sex offenders in Orinda is 6,467 to 1.
The ratio of registered sex offenders to all residents in this city is much lower than the state average.
Type |
2009 |
2010 |
2011 |
2012 |
2013 |
2014 |
2015 |
2016 |
2017 |
2018 |
2019 |
2020 |
2022 |
|---|---|---|---|---|---|---|---|---|---|---|---|---|---|
| Murders (per 100,000) | 0 (0.0) | 0 (0.0) | 0 (0.0) | 1 (5.5) | 0 (0.0) | 0 (0.0) | 0 (0.0) | 0 (0.0) | 0 (0.0) | 0 (0.0) | 5 (24.9) | 0 (0.0) | 0 (0.0) |
| Rapes (per 100,000) | 1 (5.4) | 1 (5.7) | 0 (0.0) | 0 (0.0) | 0 (0.0) | 0 (0.0) | 0 (0.0) | 0 (0.0) | 1 (5.1) | 1 (5.0) | 2 (10.0) | 0 (0.0) | 1 (5.1) |
| Robberies (per 100,000) | 7 (37.8) | 3 (17.0) | 2 (11.2) | 1 (5.5) | 0 (0.0) | 2 (10.6) | 3 (15.5) | 4 (20.4) | 6 (30.4) | 7 (35.0) | 7 (34.9) | 5 (24.8) | 7 (36.0) |
| Assaults (per 100,000) | 5 (27.0) | 1 (5.7) | 2 (11.2) | 5 (27.6) | 10 (54.0) | 2 (10.6) | 2 (10.4) | 6 (30.6) | 3 (15.2) | 1 (5.0) | 3 (14.9) | 1 (5.0) | 3 (15.4) |
| Burglaries (per 100,000) | 82 (442.4) | 39 (221.1) | 83 (465.0) | 77 (425.5) | 103 (556.2) | 62 (328.0) | 50 (258.9) | 35 (178.7) | 53 (268.2) | 30 (149.9) | 52 (259.1) | 44 (218.1) | 28 (144.0) |
| Thefts (per 100,000) | 151 (814.6) | 121 (685.8) | 130 (728.3) | 132 (729.4) | 103 (556.2) | 115 (608.3) | 164 (849.3) | 110 (561.7) | 94 (475.7) | 69 (344.7) | 125 (622.8) | 76 (376.7) | 83 (426.9) |
| Auto thefts (per 100,000) | 16 (86.3) | 9 (51.0) | 11 (61.6) | 7 (38.7) | 8 (43.2) | 10 (52.9) | 15 (77.7) | 11 (56.2) | 6 (30.4) | 11 (54.9) | 18 (89.7) | 10 (49.6) | 14 (72.0) |
| Arson (per 100,000) | 1 (5.4) | 0 (0.0) | 1 (5.6) | 0 (0.0) | 0 (0.0) | 0 (0.0) | 0 (0.0) | 0 (0.0) | 1 (5.1) | 0 (0.0) | 0 (0.0) | 0 (0.0) | 0 (0.0) |
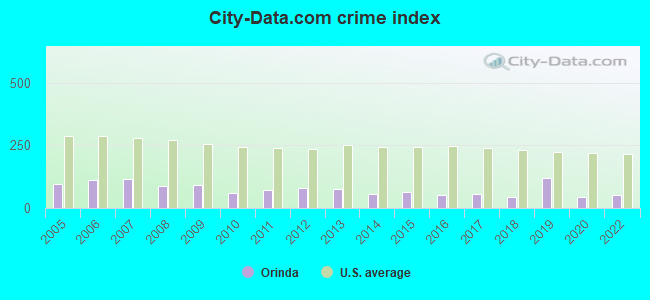
| City-Data.com crime index | 91.5 | 57.8 | 72.2 | 80.3 | 75.4 | 56.8 | 65.0 | 51.7 | 56.4 | 44.2 | 121.5 | 42.7 | 50.9 |
The City-Data.com crime index weighs serious crimes and violent crimes more heavily. Higher means more crime, U.S. average is 246.1. It adjusts for the number of visitors and daily workers commuting into cities.
Crime rate in Orinda detailed stats: murders, rapes, robberies, assaults, burglaries, thefts, arson
Full-time law enforcement employees in 2015, including police officers: 1 (1 officers - 1 male; 0 female).
| Officers per 1,000 residents here: | 0.05 |
| California average: | 1.98 |
 Recent articles from our blog. Our writers, many of them Ph.D. graduates or candidates, create easy-to-read articles on a wide variety of topics.


Latest news from Orinda, CA collected exclusively by city-data.com from local newspapers, TV, and radio stations
Ancestries: English (8.2%), German (7.9%), Irish (7.7%), European (6.6%), Iranian (3.9%), Italian (2.9%).
Current Local Time: PST time zone
Elevation: 500 feet
Land area: 12.6 square miles.
Population density: 1,538 people per square mile (low).
3,559 residents are foreign born (10.8% Asia, 4.6% Europe).
| This city: | 18.4% |
| California: | 26.5% |
Median real estate property taxes paid for housing units with mortgages in 2022: $10,187 (0.5%)
Median real estate property taxes paid for housing units with no mortgage in 2022: $8,770 (0.5%)
Nearest city with pop. 50,000+: Berkeley, CA  (5.5 miles , pop. 102,743).
Nearest city with pop. 200,000+: Oakland, CA (6.7 miles , pop. 399,484).
Nearest city with pop. 1,000,000+: Los Angeles, CA (337.8 miles , pop. 3,694,820).
Nearest cities:
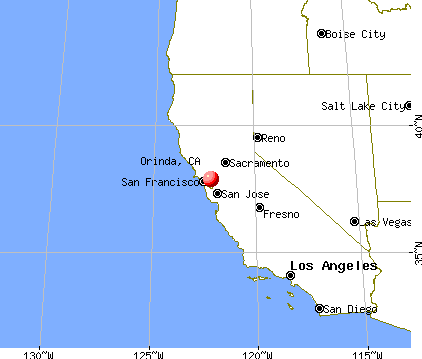
), ), ), ), )Latitude: 37.88 N, Longitude: 122.18 W
Daytime population change due to commuting: -2,398 (-12.4%)
Workers who live and work in this city: 3,654 (41.0%)
Area code: 925

Orinda tourist attractions:
Orinda, California accommodation & food services, waste management - Economy and Business Data
| Here: | 4.5% |
| California: | 5.1% |
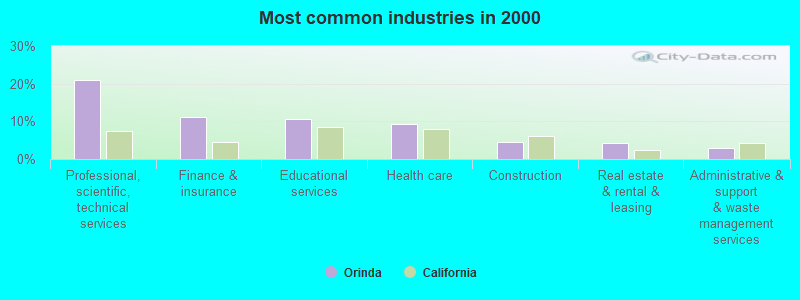
- Professional, scientific, technical services (20.9%)
- Finance & insurance (11.1%)
- Educational services (10.7%)
- Health care (9.3%)
- Construction (4.6%)
- Real estate & rental & leasing (4.1%)
- Administrative & support & waste management services (2.8%)
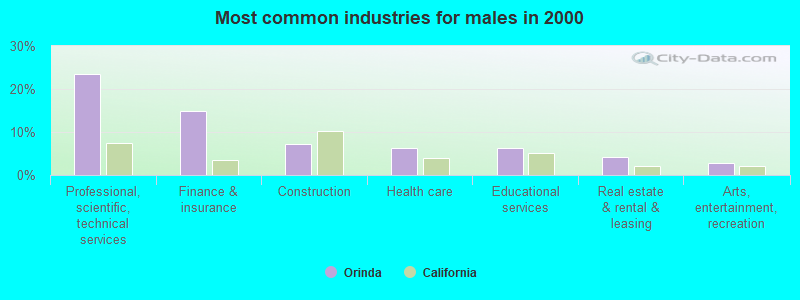
- Professional, scientific, technical services (23.5%)
- Finance & insurance (14.8%)
- Construction (7.1%)
- Health care (6.3%)
- Educational services (6.2%)
- Real estate & rental & leasing (4.2%)
- Arts, entertainment, recreation (2.7%)
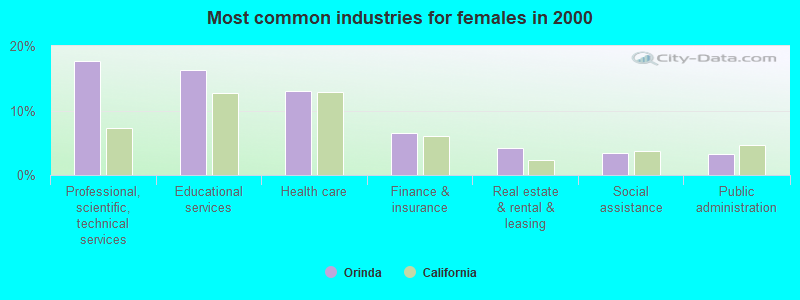
- Professional, scientific, technical services (17.7%)
- Educational services (16.3%)
- Health care (13.0%)
- Finance & insurance (6.5%)
- Real estate & rental & leasing (4.1%)
- Social assistance (3.4%)
- Public administration (3.2%)
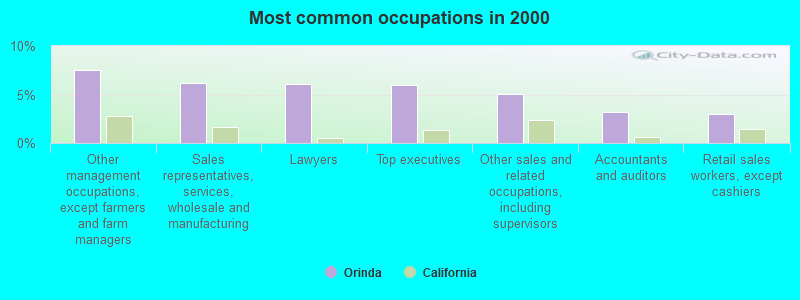
- Other management occupations, except farmers and farm managers (7.5%)
- Sales representatives, services, wholesale and manufacturing (6.2%)
- Lawyers (6.1%)
- Top executives (6.0%)
- Other sales and related occupations, including supervisors (5.1%)
- Accountants and auditors (3.2%)
- Retail sales workers, except cashiers (2.9%)
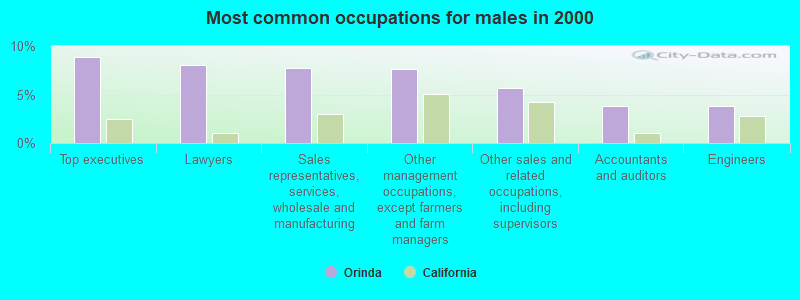
- Top executives (8.9%)
- Lawyers (8.0%)
- Sales representatives, services, wholesale and manufacturing (7.8%)
- Other management occupations, except farmers and farm managers (7.7%)
- Other sales and related occupations, including supervisors (5.7%)
- Accountants and auditors (3.8%)
- Engineers (3.8%)
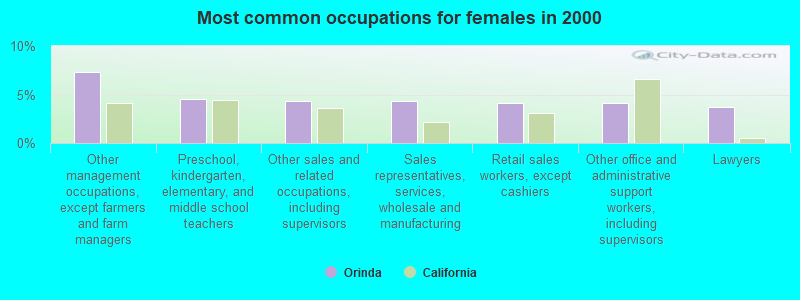
- Other management occupations, except farmers and farm managers (7.3%)
- Preschool, kindergarten, elementary, and middle school teachers (4.5%)
- Other sales and related occupations, including supervisors (4.3%)
- Sales representatives, services, wholesale and manufacturing (4.3%)
- Retail sales workers, except cashiers (4.2%)
- Other office and administrative support workers, including supervisors (4.1%)
- Lawyers (3.7%)
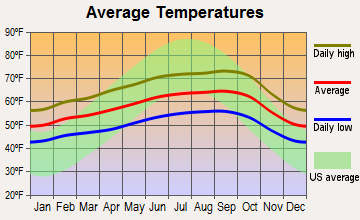
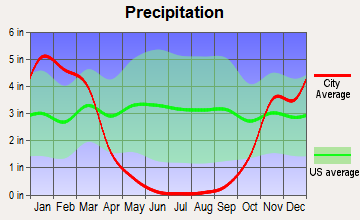
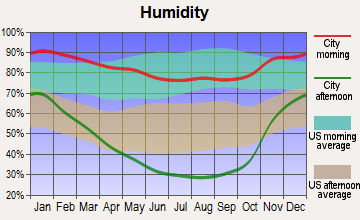
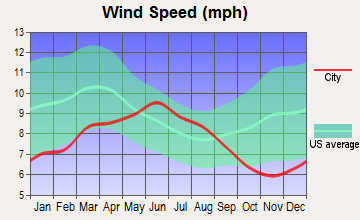
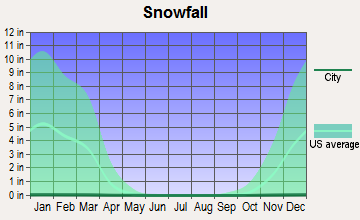
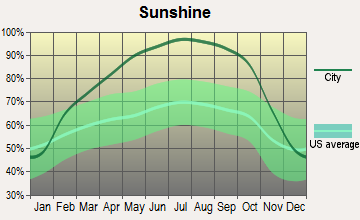
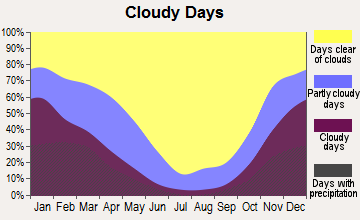
Average climate in Orinda, California
Based on data reported by over 4,000 weather stations
|
|


(lower is better)
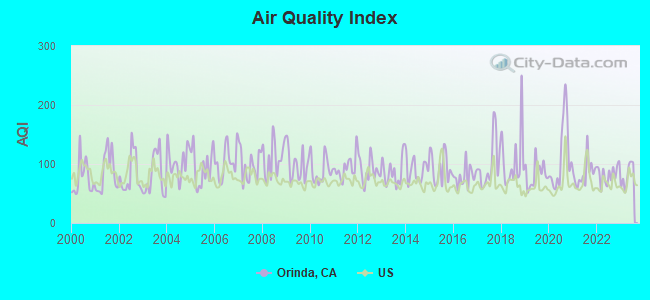
Air Quality Index (AQI) level in 2023 was 81.2. This is about average.
| City: | 81.2 |
| U.S.: | 72.6 |
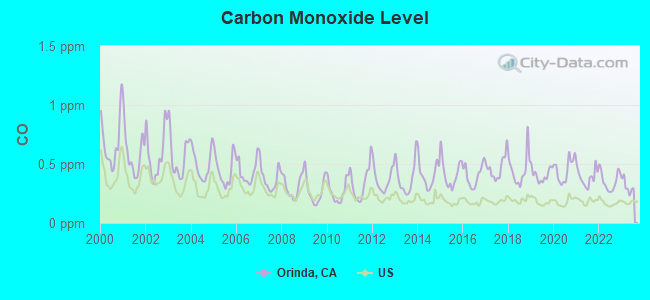
Carbon Monoxide (CO) [ppm] level in 2023 was 0.311. This is worse than average. Closest monitor was 6.9 miles away from the city center.
| City: | 0.311 |
| U.S.: | 0.251 |
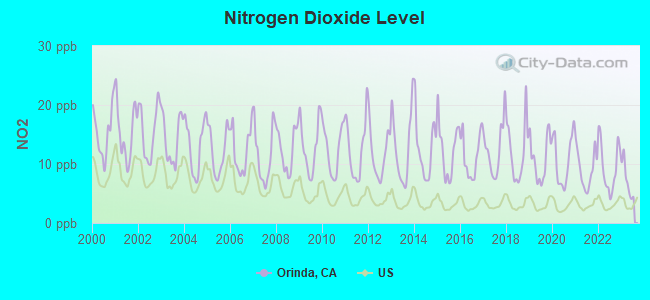
Nitrogen Dioxide (NO2) [ppb] level in 2023 was 7.28. This is significantly worse than average. Closest monitor was 5.0 miles away from the city center.
| City: | 7.28 |
| U.S.: | 5.11 |
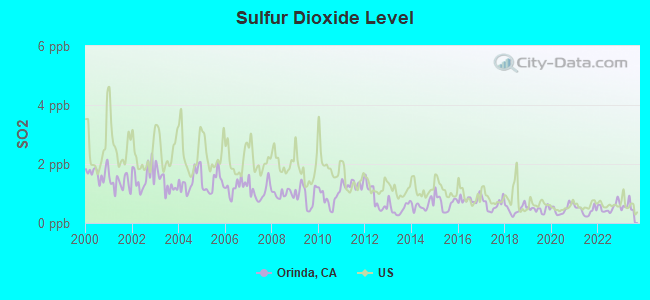
Sulfur Dioxide (SO2) [ppb] level in 2023 was 0.565. This is significantly better than average. Closest monitor was 5.0 miles away from the city center.
| City: | 0.565 |
| U.S.: | 1.515 |
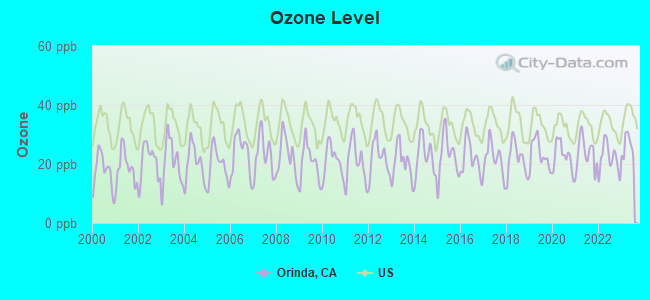
Ozone [ppb] level in 2023 was 26.1. This is better than average. Closest monitor was 6.1 miles away from the city center.
| City: | 26.1 |
| U.S.: | 33.3 |
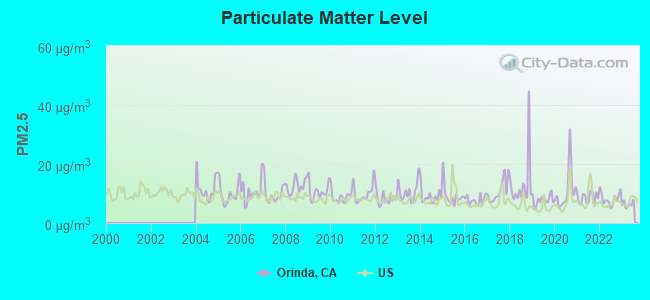
Particulate Matter (PM2.5) [µg/m3] level in 2023 was 6.39. This is better than average. Closest monitor was 7.1 miles away from the city center.
| City: | 6.39 |
| U.S.: | 8.11 |
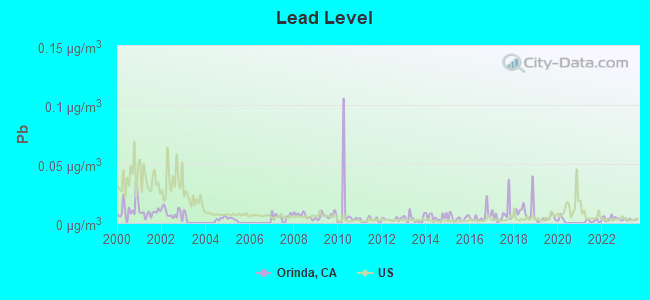
Lead (Pb) [µg/m3] level in 2023 was 0.00290. This is significantly better than average. Closest monitor was 5.0 miles away from the city center.
| City: | 0.00290 |
| U.S.: | 0.00931 |
Earthquake activity:
Orinda-area historical earthquake activity is significantly above California state average. It is 7603% greater than the overall U.S. average.On 4/18/1906 at 13:12:21, a magnitude 7.9 (7.9 UK, Class: Major, Intensity: VIII - XII) earthquake occurred 45.7 miles away from the city center, causing $524,000,000 total damage
On 10/18/1989 at 00:04:15, a magnitude 7.1 (6.5 MB, 7.1 MS, 6.9 MW, 7.0 ML) earthquake occurred 57.9 miles away from Orinda center, causing 62 deaths (62 shaking deaths) and 3757 injuries, causing $1,305,032,704 total damage
On 11/4/1927 at 13:51:53, a magnitude 7.5 (7.5 UK) earthquake occurred 214.9 miles away from Orinda center
On 7/21/1952 at 11:52:14, a magnitude 7.7 (7.7 UK) earthquake occurred 266.3 miles away from Orinda center, causing $50,000,000 total damage
On 1/31/1922 at 13:17:28, a magnitude 7.6 (7.6 UK) earthquake occurred 265.8 miles away from Orinda center
On 4/25/1992 at 18:06:04, a magnitude 7.2 (6.3 MB, 7.1 MS, 7.2 MW, 7.1 MW, Depth: 9.4 mi) earthquake occurred 198.6 miles away from the city center, causing $75,000,000 total damage
Magnitude types: body-wave magnitude (MB), local magnitude (ML), surface-wave magnitude (MS), moment magnitude (MW)
Natural disasters:
The number of natural disasters in Contra Costa County (18) is near the US average (15).Major Disasters (Presidential) Declared: 11
Emergencies Declared: 3
Causes of natural disasters: Floods: 13, Storms: 7, Winter Storms: 7, Mudslides: 5, Landslides: 4, Drought: 1, Earthquake: 1, Hurricane: 1, Tornado: 1, Wind: 1, Other: 1 (Note: some incidents may be assigned to more than one category).
Main business address for: INTRAWARE INC (SERVICES-BUSINESS SERVICES, NEC).
Hospitals and medical centers in Orinda:
- HORIZON HOME HEALTH CARE (51 MORAGA WAY, SUITE 4)
- ORINDA REHABILITATION AND CONVALESCENT HOSPITAL (11 ALTARINDA ROAD)
Other hospitals and medical centers near Orinda:
- WOODLAND NURSING INN (Nursing Home, about 3 miles away; LAFAYETTE, CA)
- RHEEM VALLEY CONVALESCENT HOSP (Nursing Home, about 3 miles away; MORAGA, CA)
- LAFAYETTE CARE CENTER (Nursing Home, about 4 miles away; LAFAYETTE, CA)
- ALTA BATES SUMMIT MEDICAL CENTER - ALTA BATES CAMP Acute Care Hospitals (about 5 miles away; BERKELEY, CA)
- BERKELEY DIALYSIS CENTER (Dialysis Facility, about 5 miles away; BERKELEY, CA)
- ASHBY CARE CENTER (Nursing Home, about 6 miles away; BERKELEY, CA)
- BERKELEY PINES CARE CENTER, INC (Nursing Home, about 6 miles away; BERKELEY, CA)
Heliports located in Orinda:
Amtrak stations near Orinda:
- 7 miles: BERKELEY (3RD ST. & UNIVERSITY AVE.) . Services: partially wheelchair accessible, public payphones, free short-term parking, free long-term parking, call for taxi service, public transit connection.
- 7 miles: EMERYVILLE (5885 LANDREGAN ST.) . Services: ticket office, fully wheelchair accessible, enclosed waiting area, public restrooms, public payphones, snack bar, free short-term parking, free long-term parking, call for taxi service, public transit connection.
- 9 miles: OAKLAND (245 2ND ST.) . Services: ticket office, fully wheelchair accessible, enclosed waiting area, public restrooms, public payphones, vending machines, paid short-term parking, paid long-term parking, call for car rental service, taxi stand, public transit connection.
Colleges/universities with over 2000 students nearest to Orinda:
- University of California-Berkeley (about 5 miles; Berkeley, CA; Full-time enrollment: 37,127)
- Saint Mary's College of California (about 5 miles; Moraga, CA; FT enrollment: 4,200)
- Berkeley City College (about 6 miles; Berkeley, CA; FT enrollment: 3,146)
- Merritt College (about 7 miles; Oakland, CA; FT enrollment: 2,842)
- Laney College (about 8 miles; Oakland, CA; FT enrollment: 5,668)
- Diablo Valley College (about 9 miles; Pleasant Hill, CA; FT enrollment: 13,015)
- College of Alameda (about 9 miles; Alameda, CA; FT enrollment: 3,071)
Public high school in Orinda:
- MIRAMONTE HIGH (Students: 938, Location: 750 MORAGA WAY, Grades: 9-12)
Private high schools in Orinda:
Public elementary/middle schools in Orinda:
- ORINDA INTERMEDIATE (Students: 820, Location: 80 IVY DR., Grades: 6-8)
- GLORIETTA ELEMENTARY (Students: 285, Location: 15 MARTHA RD., Grades: KG-5)
- SLEEPY HOLLOW ELEMENTARY (Students: 249, Location: 20 WASHINGTON LN., Grades: KG-5)
- WAGNER RANCH ELEMENTARY (Students: 244, Location: 350 CAMINO PABLO, Grades: KG-5)
- DEL REY ELEMENTARY (Location: 25 EL CAMINO MORAGA, Grades: KG-5)
Points of interest:
Notable locations in Orinda: Orinda Country Club (A), Moraga Substation (B), Happy Valley Pumping Plant (C), Orinda Water Treatment Plant (D), Orinda Branch Contra Costa County Library (E), Moraga - Orinda Fire District Station 43 (F), Moraga - Orinda Fire District Station 44 (G), Moraga - Orinda Fire District Station 45 Headquarters (H). Display/hide their locations on the map
Main business address in Orinda: INTRAWARE INC (A). Display/hide its location on the map
Reservoir: Lake Cascade (A). Display/hide its location on the map
Creek: Lauterwasser Creek (A). Display/hide its location on the map
Parks in Orinda include: Orinda Oaks Park (1), Paul Park (2). Display/hide their locations on the map
Birthplace of: Ken Dorsey - 2005 NFL player (San Francisco 49ers, born: Apr 22, 1981), Luke Sassano - Soccer player, Nicole Branagh - Beach volleyball player, Dana Sparks - Actor.
| This city: | 2.7 people |
| California: | 2.9 people |
| This city: | 79.4% |
| Whole state: | 68.7% |
| This city: | 3.0% |
| Whole state: | 7.2% |
Likely homosexual households (counted as self-reported same-sex unmarried-partner households)
- Lesbian couples: 0.4% of all households
- Gay men: 0.5% of all households
6 people in other noninstitutional facilities in 2010
54 people in nursing homes in 2000
13 people in religious group quarters in 2000
Banks with branches in Orinda (2011 data):
- Wells Fargo Bank, National Association: Orinda Branch at 80 Moraga Way, branch established on 1947/02/10. Info updated 2011/04/05: Bank assets: $1,161,490.0 mil, Deposits: $905,653.0 mil, headquarters in Sioux Falls, SD, positive income, 6395 total offices, Holding Company: Wells Fargo & Company
- Bank of the West: Orinda Branch at 21 Moraga Way, branch established on 1958/03/31. Info updated 2009/11/16: Bank assets: $62,408.3 mil, Deposits: $43,995.2 mil, headquarters in San Francisco, CA, positive income, 647 total offices, Holding Company: Bnp Paribas
- Bank of America, National Association: Orinda Branch at 31 Orinda Way, branch established on 1964/06/02. Info updated 2009/11/18: Bank assets: $1,451,969.3 mil, Deposits: $1,077,176.8 mil, headquarters in Charlotte, NC, positive income, 5782 total offices, Holding Company: Bank Of America Corporation
- First Republic Bank: Orinda Branch at 224 Brookwood Road, branch established on 1982/09/24. Info updated 2010/08/03: Bank assets: $27,791.8 mil, Deposits: $22,459.3 mil, headquarters in San Francisco, CA, positive income, Mortgage Lending Specialization, 60 total offices
- Citibank, National Association: 37 Orinda Way Branch at 37 Orinda Way, branch established on 1935/08/01. Info updated 2012/01/10: Bank assets: $1,288,658.0 mil, Deposits: $882,541.0 mil, headquarters in Sioux Falls, SD, positive income, International Specialization, 1048 total offices, Holding Company: Citigroup Inc.
- Mechanics Bank: Orinda Branch at 77 Moraga Way, branch established on 2003/07/09. Info updated 2011/03/24: Bank assets: $2,991.7 mil, Deposits: $2,573.6 mil, headquarters in Richmond, CA, positive income, Commercial Lending Specialization, 31 total offices
- Union Bank, National Association: Orinda Branch at 140 Brookwood Road, Suite 101, branch established on 2007/12/10. Info updated 2011/09/01: Bank assets: $88,967.5 mil, Deposits: $65,286.4 mil, headquarters in San Francisco, CA, positive income, Commercial Lending Specialization, 403 total offices, Holding Company: Mitsubishi Ufj Financial Group, Inc.
For population 15 years and over in Orinda:
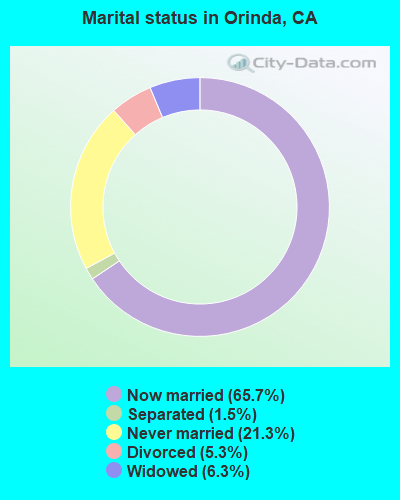
- Never married: 21.3%
- Now married: 65.7%
- Separated: 1.5%
- Widowed: 6.3%
- Divorced: 5.3%
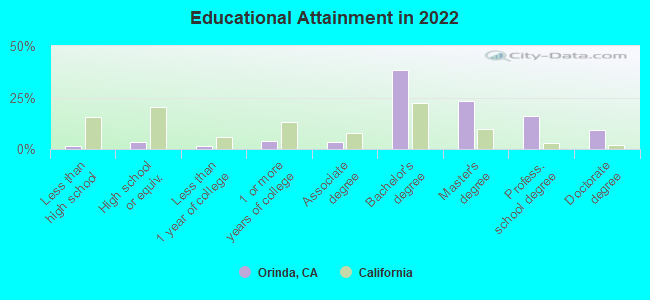
For population 25 years and over in Orinda:
- High school or higher: 98.5%
- Bachelor's degree or higher: 86.3%
- Graduate or professional degree: 47.1%
- Unemployed: 1.6%
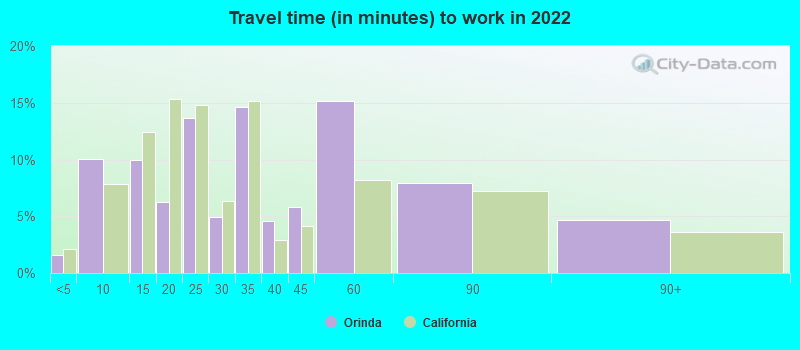
- Mean travel time to work (commute): 22.2 minutes
| Here: | 8.8 |
| California average: | 15.5 |


Graphs represent county-level data. Detailed 2008 Election Results
Neighborhoods in Orinda:
(Orinda, California Neighborhood Map)- Alice neighborhood
- Castlegate neighborhood
- Central Orinda (Central) neighborhood
- Charles Hill (Staint Stephens) neighborhood
- Claremont neighborhood
- Del Rey neighborhood
- Diablo View neighborhood
- Downtown Orinda (Downtown) neighborhood
- El Toyonal neighborhood
- Glorietta neighborhood
- Ivy Drive (The Ivy Drive Loop) neighborhood
- Knickerbocker (Spring Oak) neighborhood
- Lost Valley (Southwest Orinda) neighborhood
- Miner Road neighborhood
- Monte Vista Ridge (Monte Vista) neighborhood
- Monterey Terrace (Monterey) neighborhood
- North Orinda (North) neighborhood
- Northeast Orinda (Northeast) neighborhood
- Northwest Orinda (Northwest) neighborhood
- Northwood (Tara) neighborhood
- Orinda Country Club (Country Club) neighborhood
- Orinda Downs neighborhood
- Orinda View neighborhood
- Orinda Village neighborhood
- Orinda Woods (Orindawoods) neighborhood
- Overhill neighborhood
- Sandhill neighborhood
- Sleepy Hollow neighborhood
- South Orinda (South) neighborhood
- Southwood neighborhood
- Sundown Terrace neighborhood
- Tiger Tail neighborhood
Religion statistics for Orinda, CA (based on Contra Costa County data)


| Religion | Adherents | Congregations |
|---|---|---|
| Catholic | 228,400 | 34 |
| Evangelical Protestant | 81,120 | 352 |
| Other | 48,553 | 123 |
| Mainline Protestant | 32,693 | 101 |
| Black Protestant | 10,395 | 34 |
| Orthodox | 2,435 | 8 |
| None | 645,429 | - |
Food Environment Statistics:
| Contra Costa County: | 1.78 / 10,000 pop. |
| California: | 2.14 / 10,000 pop. |
| Here: | 0.05 / 10,000 pop. |
| State: | 0.04 / 10,000 pop. |
| This county: | 0.51 / 10,000 pop. |
| State: | 0.62 / 10,000 pop. |
| Contra Costa County: | 1.75 / 10,000 pop. |
| California: | 1.49 / 10,000 pop. |
| This county: | 6.73 / 10,000 pop. |
| State: | 7.42 / 10,000 pop. |
| This county: | 7.1% |
| California: | 7.3% |
| Contra Costa County: | 22.2% |
| California: | 21.3% |
| Here: | 16.8% |
| California: | 17.9% |
Health and Nutrition:
| This city: | 59.0% |
| California: | 49.4% |
| This city: | 58.4% |
| California: | 48.0% |
| This city: | 27.8 |
| California: | 28.1 |
| This city: | 16.9% |
| State: | 20.2% |
| This city: | 8.3% |
| State: | 11.2% |
| Orinda: | 7.0 |
| California: | 6.8 |
| Orinda: | 35.4% |
| California: | 31.5% |
| This city: | 62.9% |
| California: | 56.4% |
| This city: | 79.7% |
| California: | 80.9% |
More about Health and Nutrition of Orinda, CA Residents
| Local government employment and payroll (March 2022) | |||||
| Function | Full-time employees | Monthly full-time payroll | Average yearly full-time wage | Part-time employees | Monthly part-time payroll |
|---|---|---|---|---|---|
| Streets and Highways | 10 | $75,590 | $90,708 | 0 | $0 |
| Parks and Recreation | 8 | $60,855 | $91,283 | 11 | $8,450 |
| Housing and Community Development (Local) | 5 | $44,290 | $106,296 | 1 | $390 |
| Other Government Administration | 4 | $36,576 | $109,728 | 0 | $0 |
| Financial Administration | 4 | $40,183 | $120,549 | 0 | $0 |
| Police - Other | 1 | $5,179 | $62,148 | 0 | $0 |
| Other and Unallocable | 1 | $8,746 | $104,952 | 0 | $0 |
| Totals for Government | 33 | $271,419 | $98,698 | 12 | $8,839 |
Orinda government finances - Expenditure in 2021 (per resident):
- Construction - Regular Highways: $15,339,000 ($792.51)
Parks and Recreation: $1,038,000 ($53.63)
Central Staff Services: $202,000 ($10.44)
Housing and Community Development: $135,000 ($6.97)
General - Other: $118,000 ($6.10)
General Public Buildings: $67,000 ($3.46)
- Current Operations - Police Protection: $4,482,000 ($231.57)
Central Staff Services: $3,802,000 ($196.44)
Parks and Recreation: $2,843,000 ($146.89)
Regular Highways: $2,757,000 ($142.44)
Financial Administration: $1,270,000 ($65.62)
Libraries: $415,000 ($21.44)
Solid Waste Management: $124,000 ($6.41)
- General - Interest on Debt: $3,459,000 ($178.71)
Orinda government finances - Revenue in 2021 (per resident):
- Charges - Other: $2,932,000 ($151.49)
Parks and Recreation: $1,623,000 ($83.85)
Housing and Community Development: $1,000 ($0.05)
- Federal Intergovernmental - Other: $511,000 ($26.40)
- Local Intergovernmental - Other: $44,000 ($2.27)
- Miscellaneous - General Revenue - Other: $794,000 ($41.02)
Interest Earnings: $140,000 ($7.23)
Rents: $78,000 ($4.03)
Fines and Forfeits: $37,000 ($1.91)
Donations From Private Sources: $19,000 ($0.98)
- State Intergovernmental - Other: $842,000 ($43.50)
Highways: $775,000 ($40.04)
General Local Government Support: $42,000 ($2.17)
- Tax - Property: $11,014,000 ($569.05)
Other: $2,816,000 ($145.49)
General Sales and Gross Receipts: $1,715,000 ($88.61)
Public Utilities Sales: $1,161,000 ($59.98)
Documentary and Stock Transfer: $520,000 ($26.87)
Other License: $484,000 ($25.01)
Other Selective Sales: $35,000 ($1.81)
Occupation and Business License - Other: $19,000 ($0.98)
Orinda government finances - Debt in 2021 (per resident):
- Long Term Debt - Beginning Outstanding - Unspecified Public Purpose: $50,871,000 ($2628.31)
Outstanding Unspecified Public Purpose: $47,561,000 ($2457.30)
Retired Unspecified Public Purpose: $3,310,000 ($171.02)
Orinda government finances - Cash and Securities in 2021 (per resident):
- Bond Funds - Cash and Securities: $3,416,000 ($176.49)
- Other Funds - Cash and Securities: $27,284,000 ($1409.66)
- Sinking Funds - Cash and Securities: $2,161,000 ($111.65)
6.37% of this county's 2021 resident taxpayers lived in other counties in 2020 ($134,084 average adjusted gross income)
| Here: | 6.37% |
| California average: | 5.19% |
0.01% of residents moved from foreign countries ($98 average AGI)
Contra Costa County: 0.01% California average: 0.03%
Top counties from which taxpayers relocated into this county between 2020 and 2021:
| from Alameda County, CA | |
| from San Francisco County, CA | |
| from Santa Clara County, CA |
7.09% of this county's 2020 resident taxpayers moved to other counties in 2021 ($123,334 average adjusted gross income)
| Here: | 7.09% |
| California average: | 6.14% |
0.01% of residents moved to foreign countries ($92 average AGI)
Contra Costa County: 0.01% California average: 0.02%
Top counties to which taxpayers relocated from this county between 2020 and 2021:
| to Alameda County, CA | |
| to Solano County, CA | |
| to San Francisco County, CA |
| Businesses in Orinda, CA | ||||
| Name | Count | Name | Count | |
|---|---|---|---|---|
| CVS | 1 | Subway | 1 | |
| FedEx | 5 | True Value | 1 | |
| GNC | 1 | UPS | 2 | |
| Rite Aid | 1 | Vans | 2 | |
| Safeway | 1 | Vons | 1 | |
| Starbucks | 2 | |||
Strongest AM radio stations in Orinda:
- KTRB (860 AM; 50 kW; MODESTO, CA; Owner: PAPPAS RADIO OF CALIFORNIA, A CALIFORNIA LIMITED PARTNERSHIP)
- KIQI (1010 AM; 35 kW; SAN FRANCISCO, CA; Owner: RADIO UNICA OF SAN FRANCISCO LICENSE CORP.)
- KNEW (910 AM; 20 kW; OAKLAND, CA; Owner: AMFM RADIO LICENSES, L.L.C.)
- KTCT (1050 AM; 50 kW; SAN MATEO, CA; Owner: SUSQUEHANNA RADIO CORP.)
- KFAX (1100 AM; 50 kW; SAN FRANCISCO, CA; Owner: GOLDEN GATE BROADCASTING CO, INC.)
- KFRC (610 AM; 5 kW; SAN FRANCISCO, CA; Owner: INFINITY BROADCASTING CORPORATION OF LOS ANGELES)
- KNBR (680 AM; 50 kW; SAN FRANCISCO, CA; Owner: KNBR LICO, INC.)
- KGO (810 AM; 50 kW; SAN FRANCISCO, CA; Owner: KGO-AM RADIO, INC.)
- KMZT (1510 AM; 8 kW; SAN RAFAEL, CA; Owner: MOUNT WILSON FM BROADCASTERS, INC.)
- KCBS (740 AM; 50 kW; SAN FRANCISCO, CA; Owner: INFINITY BROADCASTING OPERATIONS, INC.)
- KABL (960 AM; 5 kW; OAKLAND, CA; Owner: AMFM RADIO LICENSES, L.L.C.)
- KYCY (1550 AM; 50 kW; SAN FRANCISCO, CA; Owner: INFINITY BROADCASTING OPERATIONS, INC.)
- KMKY (1310 AM; 5 kW; OAKLAND, CA; Owner: KGO-AM RADIO, INC.)
Strongest FM radio stations in Orinda:
- KLLC (97.3 FM; SAN FRANCISCO, CA; Owner: INFINITY BROADCASTING OPERATIONS, INC.)
- KFJO (92.1 FM; WALNUT CREEK, CA; Owner: CHASE RADIO PROPERTIES, L.L.C.)
- KDFC-FM1 (102.1 FM; LAFAYETTE, CA; Owner: BONNEVILLE HOLDING COMPANY)
- KOIT-FM2 (96.5 FM; MARTINEZ, ETC., CA; Owner: BONNEVILLE HOLDING CO. C/O KOIT(FM))
- KIOI-FM1 (101.3 FM; WALNUT CREEK, CA; Owner: AMFM RADIO LICENSES, L.L.C.)
- KALX (90.7 FM; BERKELEY, CA; Owner: UNIVERSITY OF CALIFORNIA)
- KKSF-FM1 (103.7 FM; PLEASANTON, ETC., CA; Owner: AMFM RADIO LICENSES, L.L.C.)
- KBLX-FM2 (102.9 FM; PLEASANTON, CA; Owner: ICBC BROADCAST HOLDINGS -CA, INC.)
- KSOL-FM3 (98.9 FM; PLEASANTON, CA; Owner: TMS LICENSE CALIFORNIA, INC)
- KFRC-FM3 (99.7 FM; WALNUT CREEK, CA; Owner: INFINITY KFRC-FM, INC.)
- KZBR-FM1 (95.7 FM; WALNUT CREEK, CA; Owner: BONNEVILLE HOLDING COMPANY)
- KISQ-FM3 (98.1 FM; CONCORD, CA; Owner: AMFM RADIO LICENSES, L.L.C.)
- KMEL-FM1 (106.1 FM; CONCORD, CA; Owner: AMFM RADIO LICENSES, L.L.C.)
- KSFB-FM (100.7 FM; SAN RAFAEL, CA; Owner: GOLDEN GATE BROADCASTING COMPANY, INC.)
- KOIT-FM (96.5 FM; SAN FRANCISCO, CA; Owner: BONNEVILLE HOLDING COMPANY)
- KKSF (103.7 FM; SAN FRANCISCO, CA; Owner: AMFM RADIO LICENSES, L.L.C.)
- KFOG (104.5 FM; SAN FRANCISCO, CA; Owner: KFFG LICO, INC)
- KSOL (98.9 FM; SAN FRANCISCO, CA; Owner: TMS LICENSE CALIFORNIA, INC)
- KDFC-FM (102.1 FM; SAN FRANCISCO, CA; Owner: BONNEVILLE HOLDING COMPANY)
- KYLD (94.9 FM; SAN FRANCISCO, CA; Owner: AMFM RADIO LICENSES, L.L.C.)
TV broadcast stations around Orinda:
- KQED (Channel 9; SAN FRANCISCO, CA; Owner: KQED, INC.)
- KGO-TV (Channel 7; SAN FRANCISCO, CA; Owner: KGO TELEVISION, INC.)
- KPIX-TV (Channel 5; SAN FRANCISCO, CA; Owner: CBS BROADCASTING INC.)
- KTVU (Channel 2; OAKLAND, CA; Owner: KTVU PARTNERSHIP)
- KRON-TV (Channel 4; SAN FRANCISCO, CA; Owner: YOUNG BROADCASTING OF SAN FRANCISCO, INC.)
- KMTP-TV (Channel 32; SAN FRANCISCO, CA; Owner: MINORITY TELEVISION PROJECT)
- KBHK-TV (Channel 44; SAN FRANCISCO, CA; Owner: VIACOM TELEVISION STATIONS GROUP OF SAN FRANCISCO INC.)
- KBWB (Channel 20; SAN FRANCISCO, CA; Owner: KBWB LICENSE, INC.)
- KFSF (Channel 66; VALLEJO, CA; Owner: TELEFUTURA SAN FRANCISCO LLC)
- KCNS (Channel 38; SAN FRANCISCO, CA; Owner: WRAY, INC.)
- KTNC-TV (Channel 42; CONCORD, CA; Owner: KTNC LICENSE, LLC)
- KOVR (Channel 13; STOCKTON, CA; Owner: SCI - SACRAMENTO LICENSEE, LLC)
- KXTV (Channel 10; SACRAMENTO, CA; Owner: KXTV, INC.)
- KCSM-TV (Channel 60; SAN MATEO, CA; Owner: SAN MATEO COUNTY COMMUNITY COLLEGE DISTRICT)
- KSPX (Channel 29; SACRAMENTO, CA; Owner: PAXSON SACRAMENTO LICENSE, INC.)
- KCRA-TV (Channel 3; SACRAMENTO, CA; Owner: KCRA HEARST-ARGYLE TELEVISION, INC.)
- KTXL (Channel 40; SACRAMENTO, CA; Owner: CHANNEL 40, INC.)
- KUVS (Channel 19; MODESTO, CA; Owner: KUVS LICENSE PARTNERSHIP, G.P.)
- KQCA (Channel 58; STOCKTON, CA; Owner: KCRA HEARST-ARGYLE TELEVISION, INC.)
- KVIE (Channel 6; SACRAMENTO, CA; Owner: KVIE, INC.)
- KMAX-TV (Channel 31; SACRAMENTO, CA; Owner: UPN STATIONS GROUP INC.)
- KBIT-CA (Channel 28; SAN FRANCISCO, ETC., CA; Owner: POLAR BROADCASTING, INC.)
- KFTL (Channel 64; STOCKTON, CA; Owner: FAMILY STATIONS, INC.)
- KICU-TV (Channel 36; SAN JOSE, CA; Owner: KTVU PARTNERSHIP)
- KTSF (Channel 26; SAN FRANCISCO, CA; Owner: LINCOLN BROADCASTING COMPANY, A CALIFORNIA LP)
- National Bridge Inventory (NBI) Statistics
- 22Number of bridges
- 144ft / 44.4mTotal length
- $1,794,000Total costs
- 794,801Total average daily traffic
- 21,698Total average daily truck traffic
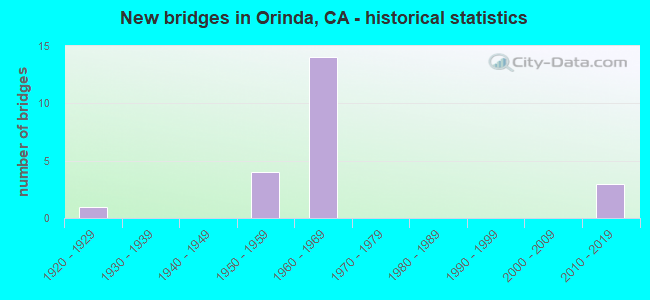
- New bridges - historical statistics
- 11920-1929
- 41950-1959
- 141960-1969
- 32010-2019
FCC Registered Antenna Towers: 67 (See the full list of FCC Registered Antenna Towers)
FCC Registered Private Land Mobile Towers: 1 (See the full list of FCC Registered Private Land Mobile Towers in Orinda, CA)
FCC Registered Broadcast Land Mobile Towers: 20 (See the full list of FCC Registered Broadcast Land Mobile Towers)
FCC Registered Microwave Towers: 45 (See the full list of FCC Registered Microwave Towers in this town)
FCC Registered Paging Towers: 4 (See the full list of FCC Registered Paging Towers)
FCC Registered Amateur Radio Licenses: 240 (See the full list of FCC Registered Amateur Radio Licenses in Orinda)
FAA Registered Aircraft Manufacturers and Dealers: 1 (See the full list of FAA Registered Manufacturers and Dealers in Orinda)
FAA Registered Aircraft: 22 (See the full list of FAA Registered Aircraft)
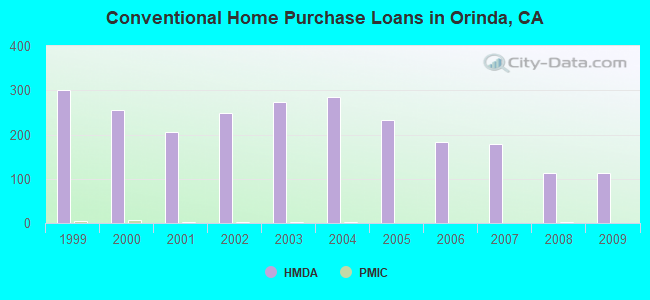
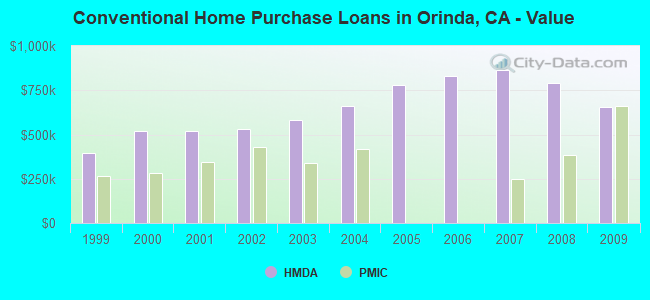
| Home Mortgage Disclosure Act Aggregated Statistics For Year 2009 (Based on 5 partial tracts) | ||||||||||
| A) FHA, FSA/RHS & VA Home Purchase Loans | B) Conventional Home Purchase Loans | C) Refinancings | D) Home Improvement Loans | F) Non-occupant Loans on < 5 Family Dwellings (A B C & D) | ||||||
|---|---|---|---|---|---|---|---|---|---|---|
| Number | Average Value | Number | Average Value | Number | Average Value | Number | Average Value | Number | Average Value | |
| LOANS ORIGINATED | 7 | $583,407 | 114 | $657,492 | 770 | $481,798 | 36 | $360,652 | 17 | $396,623 |
| APPLICATIONS APPROVED, NOT ACCEPTED | 0 | $0 | 18 | $674,546 | 75 | $497,345 | 1 | $583,110 | 1 | $206,750 |
| APPLICATIONS DENIED | 2 | $566,275 | 19 | $679,451 | 143 | $616,535 | 8 | $142,782 | 8 | $297,985 |
| APPLICATIONS WITHDRAWN | 4 | $326,795 | 12 | $687,570 | 74 | $548,877 | 6 | $226,200 | 3 | $679,790 |
| FILES CLOSED FOR INCOMPLETENESS | 0 | $0 | 4 | $965,290 | 32 | $649,969 | 4 | $390,148 | 1 | $309,800 |
Detailed HMDA statistics for the following Tracts: 3522.01 , 3530.01, 3530.02, 3540.01, 3540.02
| Private Mortgage Insurance Companies Aggregated Statistics For Year 2009 (Based on 3 partial tracts) | ||||
| A) Conventional Home Purchase Loans | B) Refinancings | |||
|---|---|---|---|---|
| Number | Average Value | Number | Average Value | |
| LOANS ORIGINATED | 1 | $663,560 | 0 | $0 |
| APPLICATIONS APPROVED, NOT ACCEPTED | 0 | $0 | 0 | $0 |
| APPLICATIONS DENIED | 0 | $0 | 1 | $261,340 |
| APPLICATIONS WITHDRAWN | 0 | $0 | 0 | $0 |
| FILES CLOSED FOR INCOMPLETENESS | 0 | $0 | 0 | $0 |
Detailed PMIC statistics for the following Tracts: 3522.01 , 3530.01, 3530.02, 3540.01, 3540.02
2002 - 2018 National Fire Incident Reporting System (NFIRS) incidents
- Fire incident types reported to NFIRS in Orinda, CA
- 14639.5%Outside Fires
- 11932.2%Structure Fires
- 8523.0%Mobile Property/Vehicle Fires
- 205.4%Other
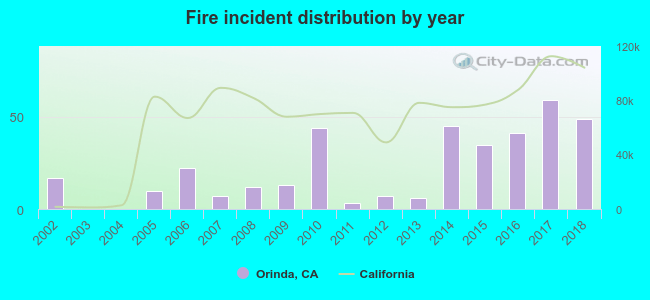 Based on the data from the years 2002 - 2018 the average number of fires per year is 22. The highest number of reported fires - 59 took place in 2017, and the least - 0 in 2003. The data has an increasing trend.
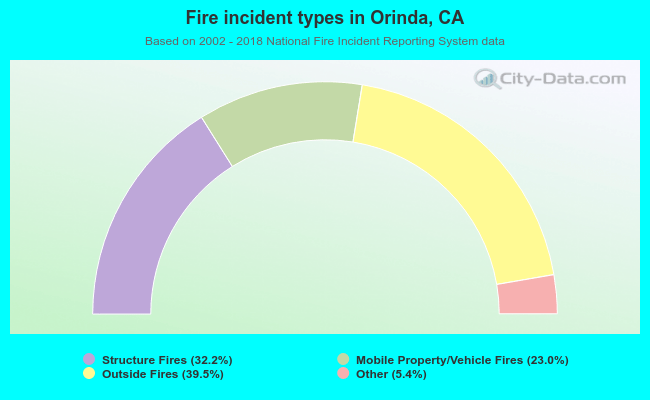 When looking into fire subcategories, the most reports belonged to: Outside Fires (39.5%), and Structure Fires (32.2%).
| Most common first names in Orinda, CA among deceased individuals | ||
| Name | Count | Lived (average) |
|---|---|---|
| John | 111 | 74.2 years |
| William | 106 | 75.3 years |
| Mary | 86 | 82.8 years |
| Robert | 84 | 74.5 years |
| James | 65 | 74.6 years |
| Ruth | 59 | 80.8 years |
| Dorothy | 57 | 81.9 years |
| George | 49 | 79.1 years |
| Helen | 47 | 81.3 years |
| Margaret | 44 | 82.7 years |
| Most common last names in Orinda, CA among deceased individuals | ||
| Last name | Count | Lived (average) |
|---|---|---|
| Smith | 36 | 76.5 years |
| Johnson | 27 | 80.4 years |
| Miller | 22 | 81.9 years |
| Anderson | 22 | 79.0 years |
| Williams | 17 | 78.9 years |
| Nelson | 15 | 77.5 years |
| Davis | 14 | 84.6 years |
| Jones | 13 | 75.1 years |
| Brown | 13 | 77.4 years |
| Young | 13 | 75.1 years |
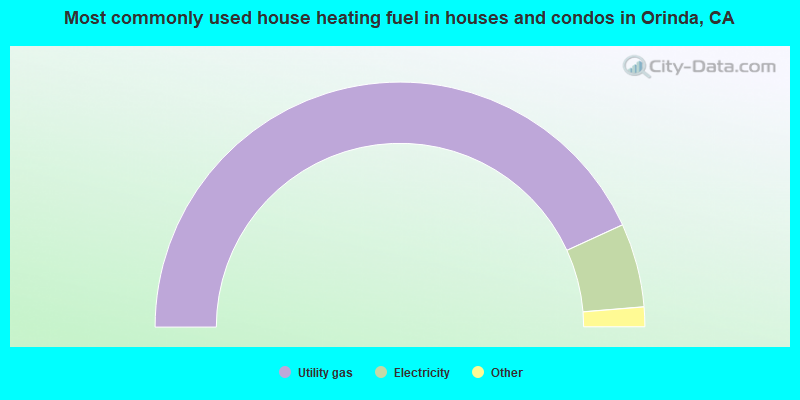
- 86.4%Utility gas
- 11.1%Electricity
- 0.6%No fuel used
- 0.6%Wood
- 0.6%Solar energy
- 0.5%Bottled, tank, or LP gas
- 0.2%Other fuel
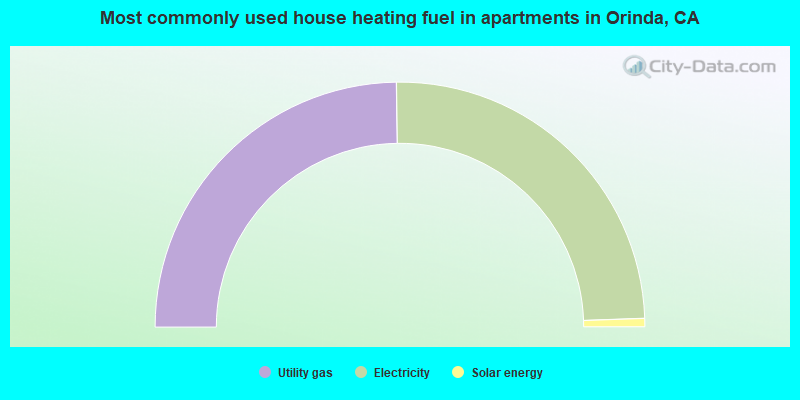
- 49.5%Utility gas
- 49.3%Electricity
- 1.1%Solar energy
Orinda compared to California state average:
- Median household income above state average.
- Median house value significantly above state average.
- Unemployed percentage significantly below state average.
- Black race population percentage significantly below state average.
- Hispanic race population percentage significantly below state average.
- Median age significantly above state average.
- Renting percentage significantly below state average.
- Number of rooms per house significantly above state average.
- Percentage of population with a bachelor's degree or higher significantly above state average.
Orinda on our top lists:
- #28 on the list of "Top 101 cities with largest percentage of males in occupations: management occupations (population 5,000+)"
- #41 on the list of "Top 100 cities with highest median household income (pop. 5,000+)"
- #43 on the list of "Top 100 best educated cities (highest percentage of bachelor degree holding residents) (pop. 5,000+)"
- #44 on the list of "Top 100 cities with highest median house value"
- #46 on the list of "Top 101 cities with the most residents born in Iran (population 500+)"
- #47 on the list of "Top 101 cities with largest percentage of females in occupations: life, physical, and social science occupations (population 5,000+)"
- #85 on the list of "Top 101 cities with largest percentage of females in industries: professional, scientific, and technical services (population 5,000+)"
- #89 on the list of "Top 101 cities with the highest percentage of workers working at home, population 5,000+"
- #31 (94563) on the list of "Top 101 zip codes with the largest percentage of taxpayers using charity contributions deductions in 2012 (pop 5,000+)"
- #40 (94563) on the list of "Top 101 zip codes with the largest percentage of taxpayers reporting net capital gain/loss in 2012 (pop 5,000+)"
- #49 (94563) on the list of "Top 101 zip codes with the largest percentage of taxpayers reporting taxable interest in 2012 (pop 5,000+)"
- #81 (94563) on the list of "Top 101 zip codes with the highest average reported salary/wage in 2012 (pop 5,000+)"
- #90 (94563) on the list of "Top 101 zip codes with the highest 2012 average reported profit/loss from business (pop 5,000+)"
- #10 on the list of "Top 101 counties with the largest increase in the number of infant deaths per 1000 residents 2000-2006 to 2007-2013 (pop. 50,000+)"
- #15 on the list of "Top 101 counties with the lowest Sulfur Oxides Annual air pollution readings in 2012 (µg/m3)"
- #17 on the list of "Top 101 counties with the highest Nitrogen Dioxide air pollution readings in 2012 (ppm)"
- #31 on the list of "Top 101 counties with the highest percentage of residents that drank alcohol in the past 30 days"
- #34 on the list of "Top 101 counties with the highest surface withdrawal of fresh water for public supply (pop. 50,000+)"

|
|
Total of 1652 patent applications in 2008-2024.