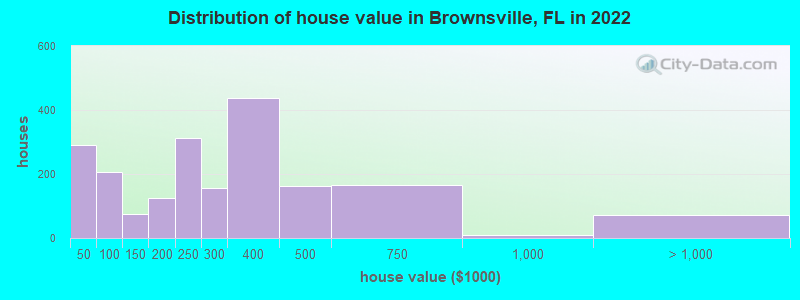
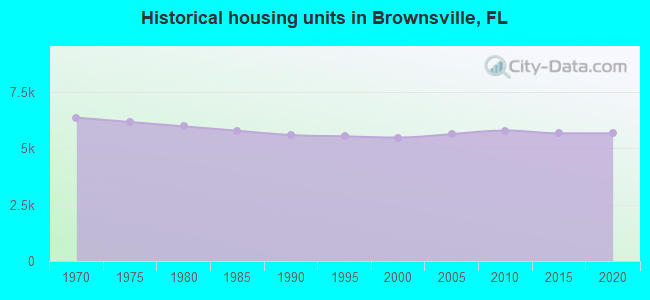
Estimated median house or condo value in 2022: $284,513 (it was $61,400 in 2000)
Brownsville:
$284,513
FL:
$354,100
Mean prices in 2022:all housing units: $606,087; detached houses: $666,163; townhouses or other attached units: $435,342; in 2-unit structures: $480,048; in 3-to-4-unit structures: $325,696; in 5-or-more-unit structures: $554,909; mobile homes: $128,887; occupied boats, rvs, vans, etc.: $162,124
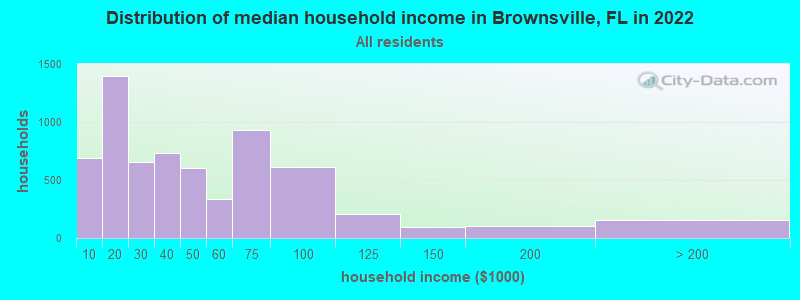
Median gross rent in 2022: $1,062.
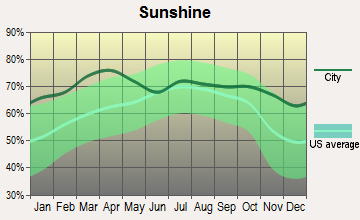
March 2022 cost of living index in Brownsville: 105.1 (more than average, U.S. average is 100)
Percentage of residents living in poverty in 2022: 29.7%
(49.0% for White Non-Hispanic residents, 35.4% for Black residents, 23.8% for Hispanic or Latino residents, 16.9% for other race residents, 17.9% for two or more races residents)
Latest news from Brownsville, FL collected exclusively by city-data.com from local newspapers, TV, and radio stations
Ancestries: Haitian (2.2%), American (1.7%).
Current Local Time: EST time zone
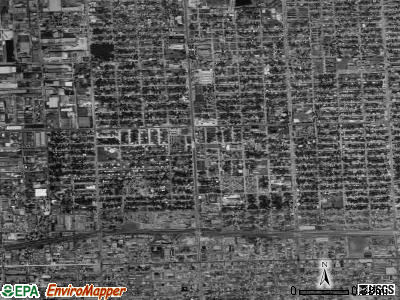
Land area: 2.29 square miles.
Population density: 6,676 people per square mile (high).
6,245 residents are foreign born (34.6% Latin America).
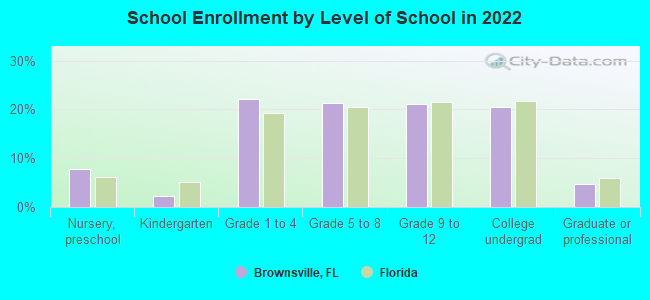
This place:
35.2%
Florida:
21.1%
Median real estate property taxes paid for housing units with mortgages in 2022: $2,134 (0.7%) Median real estate property taxes paid for housing units with no mortgage in 2022: $1,263 (0.5%)
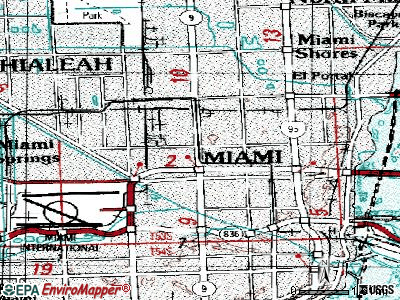
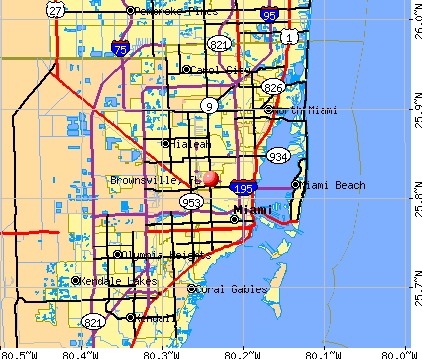
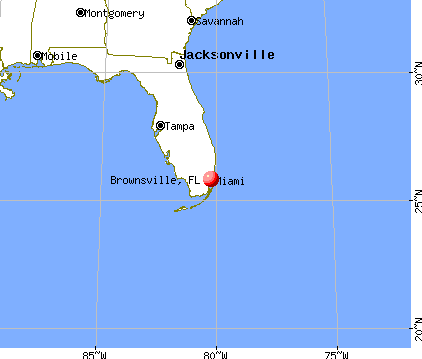
Nearest city with pop. 50,000+: Miami, FL (2.5 miles , pop. 362,470).
Nearest city with pop. 1,000,000+: Houston, TX (965.0 miles , pop. 1,953,631).
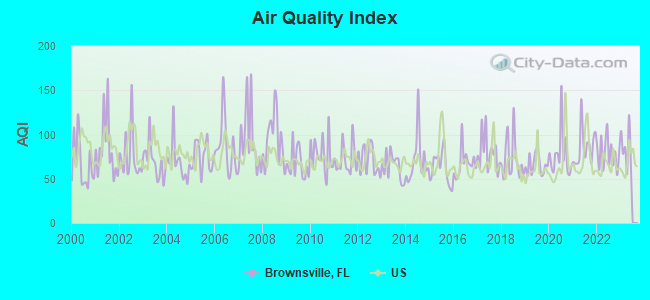
Air Quality Index (AQI) level in 2022 was 78.1. This is about average.
City:
78.1
U.S.:
72.6
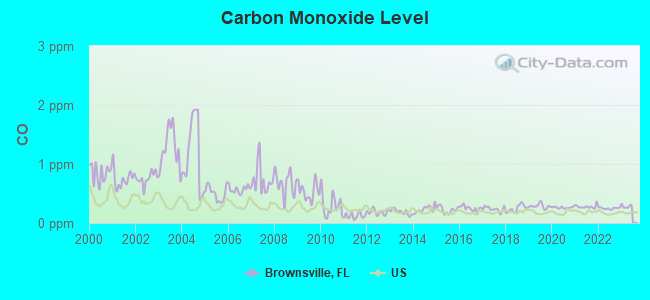
Carbon Monoxide (CO) [ppm] level in 2022 was 0.249. This is about average.Closest monitor was 3.7 miles away from the city center.
City:
0.249
U.S.:
0.251
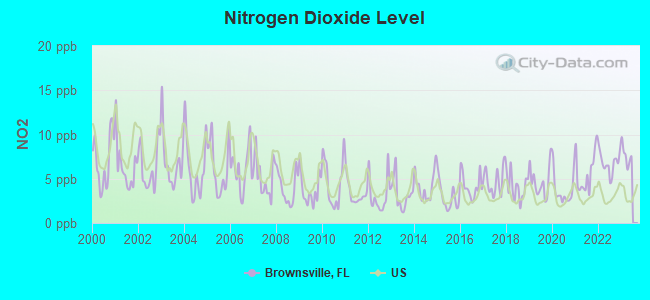
Nitrogen Dioxide (NO2) [ppb] level in 2022 was 6.78. This is worse than average.Closest monitor was 0.8 miles away from the city center.
City:
6.78
U.S.:
5.11
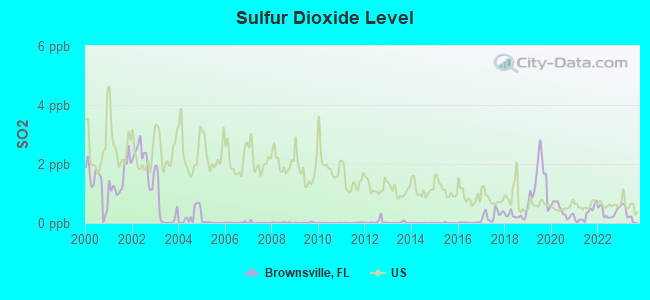
Sulfur Dioxide (SO2) [ppb] level in 2022 was 0.358. This is significantly better than average.Closest monitor was 2.4 miles away from the city center.
City:
0.358
U.S.:
1.515
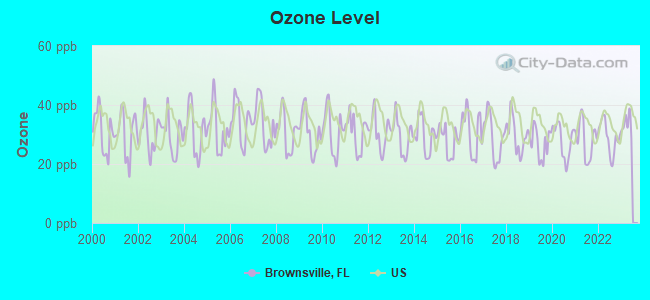
Ozone [ppb] level in 2022 was 29.0. This is about average.Closest monitor was 0.8 miles away from the city center.
City:
29.0
U.S.:
33.3
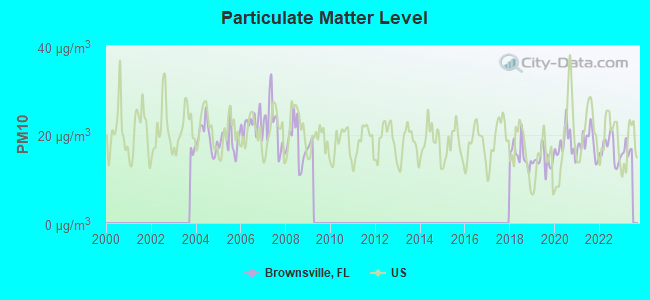
Particulate Matter (PM10) [µg/m3] level in 2022 was 16.7. This is about average.Closest monitor was 0.9 miles away from the city center.
City:
16.7
U.S.:
19.2
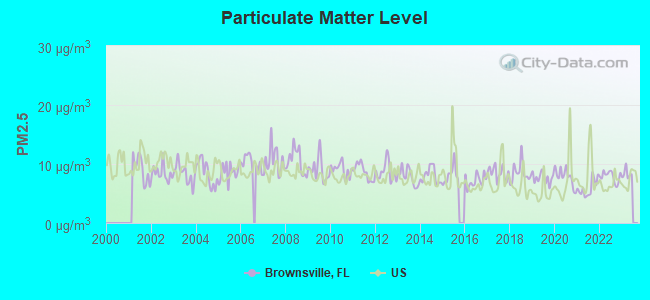
Particulate Matter (PM2.5) [µg/m3] level in 2022 was 7.87. This is about average.Closest monitor was 2.4 miles away from the city center.
City:
7.87
U.S.:
8.11
Tornado activity:
Brownsville-area historical tornado activity is below Florida state average. It is 35% smaller than the overall U.S. average.
On 6/17/1959, a category F3 (max. wind speeds 158-206 mph) tornado 6.0 miles away from the Brownsville place center injured 77 peopleand causedbetween $500,000 and $5,000,000 in damages.
On 4/10/1956, a category F3 tornado 12.4 miles away from the place center injured 20 peopleand causedbetween $500,000 and $5,000,000 in damages.
Earthquake activity:
Brownsville-area historical earthquake activity is significantly below Florida state average. It is 99% smaller than the overall U.S. average.
On 9/10/2006 at 14:56:08, a magnitude 5.9 (5.9 MB, 5.5 MS, 5.8 MW, Class: Moderate, Intensity: VI - VII) earthquake occurred 398.2 miles away from the city center On 2/22/1992 at 04:21:34, a magnitude 3.2 (3.2 MB, Depth: 6.2 mi, Class: Light, Intensity: II - III) earthquake occurred 91.8 miles away from the city center On 6/23/2016 at 17:20:29, a magnitude 3.8 (3.8 ML) earthquake occurred 292.7 miles away from the city center On 7/16/2016 at 20:00:10, a magnitude 3.7 (3.7 MB) earthquake occurred 277.2 miles away from Brownsville center On 9/21/2016 at 16:30:52, a magnitude 3.8 (3.8 ML) earthquake occurred 297.6 miles away from Brownsville center On 9/4/2016 at 18:29:29, a magnitude 3.8 (3.8 ML) earthquake occurred 298.7 miles away from Brownsville center Magnitude types: body-wave magnitude (MB), local magnitude (ML), surface-wave magnitude (MS), moment magnitude (MW)
Natural disasters:
The number of natural disasters in Miami-Dade County (10) is smaller than the US average (15). Major Disasters (Presidential) Declared: 5 Emergencies Declared: 3
Causes of natural disasters: Hurricanes: 7, Tropical Storms: 2, Tornado: 1, Other: 1 (Note: some incidents may be assigned to more than one category).
Hospitals and medical centers near Brownsville:
PROFESSIONAL MEDICAL HOME HEALTH LLC (Home Health Center, about 2 miles away; HIALEAH, FL)
JACKSON MEMORIAL LONG TERM CARE CENTER (Nursing Home, about 2 miles away; MIAMI, FL)
QUALITY CARE HOME SERVICES, INC (Home Health Center, about 2 miles away; DORAL, FL)
B FRIENDS HOME HEALTH INC (Home Health Center, about 2 miles away; MIAMI, FL)
IDEA HOME HEALTH CARE INC (Home Health Center, about 2 miles away; MIAMI, FL)
MEDIADVANTAGE HOME HEALTH CARE SERVICES (Home Health Center, about 2 miles away; MIAMI, FL)
PARADISE HOME HEALTH INC (Home Health Center, about 2 miles away; MIAMI, FL)
Amtrak stations near Brownsville:
3 miles: MIAMI (8303 N.W. 37TH AVE.) . Services: ticket office, fully wheelchair accessible, enclosed waiting area, public restrooms, public payphones, vending machines, free short-term parking, call for car rental service, taxi stand, public transit connection.
4 miles: MIAMI INT'L AIRPORT (MIAMI, TRANSIT BUS LOADING AREA) - Bus Station
14 miles: HOLLYWOOD (3001 HOLLYWOOD BLVD.) . Services: ticket office, partially wheelchair accessible, enclosed waiting area, public restrooms, public payphones, vending machines, free short-term parking, free long-term parking, taxi stand, public transit connection.
Colleges/universities with over 2000 students nearest to Brownsville:
AI Miami International University of Art and Design (about 4 miles; Miami, FL; Full-time enrollment: 3,578)
Miami Dade College (about 5 miles; Miami, FL; FT enrollment: 53,787)
Barry University (about 5 miles; Miami, FL; FT enrollment: 7,181)
Florida National University-Main Campus (about 6 miles; Hialeah, FL; FT enrollment: 4,106)
Johnson & Wales University-North Miami (about 7 miles; North Miami, FL; FT enrollment: 2,051)
St Thomas University (about 7 miles; Miami Gardens, FL; FT enrollment: 2,096)
University of Miami (about 8 miles; Coral Gables, FL; FT enrollment: 13,674)
Notable locations in Brownsville: Doctor Martin Luther King Junior Station (A), Earlington Heights Station (B), Brownsville Station (C), The Learning School 2 Day Care Center (D), Sesame Street Child Care Center (E), Sesame Street Day Care Center (F), Salter's Little Lambs Day Care Center (G), Model City Library (H), Johnson's Toddlers University (I), Joseph Caleb Community Center (J), Jesca 4 Caleb Childhood Program (K), Gilbert's Angels Day Care Center (L), Floral Heights Afterschool Care Center (M), Funway Learning Center (N), Medical Care Transportation (O). Display/hide their locations on the map
Churches in Brownsville include: Bethel Baptist Church (A), Saint Matthews Free Will Baptist Church (B), Memorial Temple Baptist Church (C), House of Prayer (D), Bethel Temple Church (E), Saint Michaels Catholic Church (F). Display/hide their locations on the map
Parks in Brownsville include: Brownsville Park (1), Glenwood Park (2), Olinda Park (3), Lincoln Gardens Park (4), Martin Luther King Park (5). Display/hide their locations on the map
Miami-Dade County has a predicted average indoor radon screening level between 2 and 4 pCi/L (pico curies per liter) - Moderate Potential
Average household size:
This place:
3.0 people
Florida:
2.5 people
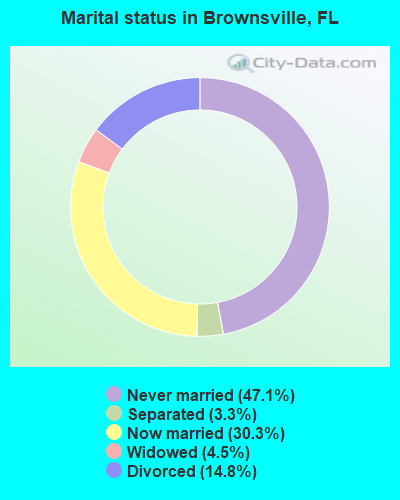
Percentage of family households:
This place:
66.2%
Whole state:
65.2%
Percentage of households with unmarried partners:
This place:
8.3%
Whole state:
7.3%
Likely homosexual households (counted as self-reported same-sex unmarried-partner households)
Lesbian couples: 0.2% of all households
Gay men: 0.3% of all households
People in group quarters in Brownsville in 2010:
55 people in emergency and transitional shelters (with sleeping facilities) for people experiencing homelessness
20 people in other noninstitutional facilities
19 people in residential treatment centers for adults
6 people in group homes for juveniles (non-correctional)
6 people in workers' group living quarters and job corps centers
People in group quarters in Brownsville in 2000:
33 people in wards in general hospitals for patients who have no usual home elsewhere
11 people in mental (psychiatric) hospitals or wards
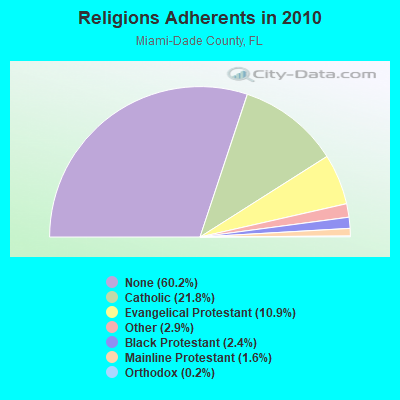
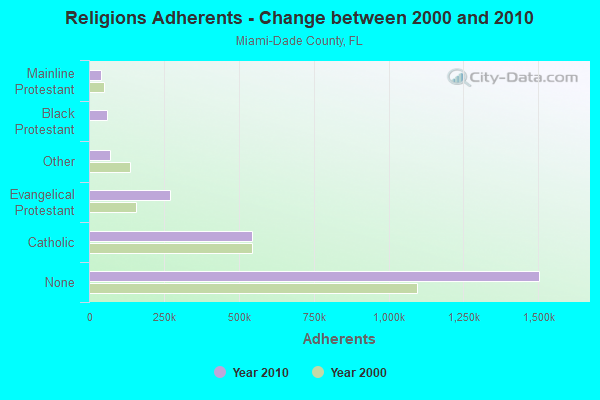
Religion statistics for Brownsville, FL (based on Miami-Dade County data)
Religion
Adherents
Congregations
Catholic
544,449
65
Evangelical Protestant
271,814
922
Other
71,458
200
Black Protestant
60,074
94
Mainline Protestant
40,287
146
Orthodox
4,440
10
None
1,503,913
-
Source: Clifford Grammich, Kirk Hadaway, Richard Houseal, Dale E.Jones, Alexei Krindatch, Richie Stanley and Richard H.Taylor. 2012. 2010 U.S.Religion Census: Religious Congregations & Membership Study. Association of Statisticians of American Religious Bodies. Jones, Dale E., et al. 2002. Congregations and Membership in the United States 2000. Nashville, TN: Glenmary Research Center. Graphs represent county-level data
NORTH BROWNSVILLE, On Allerton Ave .4 Mi N Of Int Of Allerton Ave And Sr 295 (Lat: 30.450472 Lon: -87.250778), Structure height: 36.6 m, Call Sign: WPNJ767, Assigned Frequencies: 10557.5 MHz, Grant Date: 03/06/2001, Expiration Date: 02/01/2011, Cancellation Date: 04/19/2005, Certifier: Carol L Tacker, Registrant: Cingular Wireless LLC, 5565 Glenridge Connector, Suite 1700, Atlanta, GA 30342, Phone: (404) 236-5543, Fax: (404) 236-5575
Home Mortgage Disclosure Act Aggregated Statistics For Year 2009 (Based on 2 full and 3 partial tracts)
A) FHA, FSA/RHS & VA Home Purchase Loans
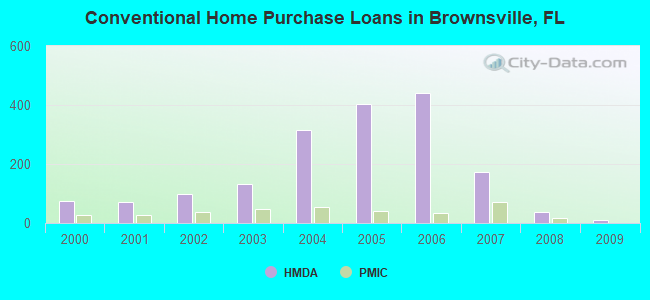
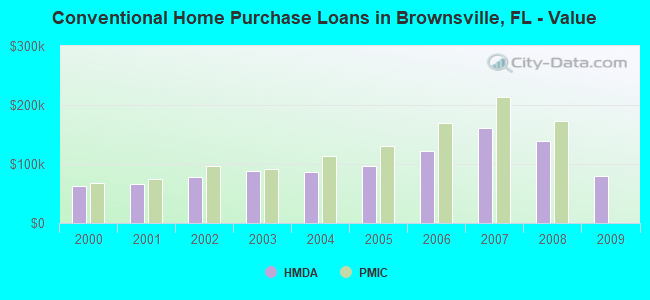
B) Conventional Home Purchase Loans
C) Refinancings
D) Home Improvement Loans
F) Non-occupant Loans on < 5 Family Dwellings (A B C & D)
G) Loans On Manufactured Home Dwelling (A B C & D)
Number
Average Value
Number
Average Value
Number
Average Value
Number
Average Value
Number
Average Value
Number
Average Value
LOANS ORIGINATED
11
$95,781
9
$79,910
8
$139,730
0
$0
2
$103,105
0
$0
APPLICATIONS APPROVED, NOT ACCEPTED
3
$117,510
1
$182,000
6
$127,807
1
$130,000
1
$141,590
0
$0
APPLICATIONS DENIED
14
$103,801
11
$132,176
44
$130,278
10
$46,966
11
$84,686
1
$117,960
APPLICATIONS WITHDRAWN
3
$118,697
1
$120,000
10
$163,552
0
$0
1
$150,000
0
$0
FILES CLOSED FOR INCOMPLETENESS
0
$0
1
$81,210
6
$130,947
0
$0
2
$111,430
0
$0
Aggregated Statistics For Year 2008 (Based on 2 full and 3 partial tracts)
A) FHA, FSA/RHS & VA Home Purchase Loans
B) Conventional Home Purchase Loans
C) Refinancings
D) Home Improvement Loans
E) Loans on Dwellings For 5+ Families
F) Non-occupant Loans on < 5 Family Dwellings (A B C & D)
Number
Average Value
Number
Average Value
Number
Average Value
Number
Average Value
Number
Average Value
Number
Average Value
LOANS ORIGINATED
13
$206,091
38
$138,647
66
$147,977
6
$60,233
1
$1,261,230
21
$153,275
APPLICATIONS APPROVED, NOT ACCEPTED
4
$194,620
9
$164,197
22
$153,569
7
$72,607
0
$0
4
$129,670
APPLICATIONS DENIED
10
$176,405
60
$170,863
140
$153,664
39
$72,341
1
$114,240
52
$140,622
APPLICATIONS WITHDRAWN
5
$198,274
14
$148,759
25
$169,793
2
$109,450
0
$0
9
$182,338
FILES CLOSED FOR INCOMPLETENESS
0
$0
8
$165,935
19
$167,044
0
$0
0
$0
5
$182,850
Aggregated Statistics For Year 2007 (Based on 2 full and 3 partial tracts)
A) FHA, FSA/RHS & VA Home Purchase Loans
B) Conventional Home Purchase Loans
C) Refinancings
D) Home Improvement Loans
E) Loans on Dwellings For 5+ Families
F) Non-occupant Loans on < 5 Family Dwellings (A B C & D)
Number
Average Value
Number
Average Value
Number
Average Value
Number
Average Value
Number
Average Value
Number
Average Value
LOANS ORIGINATED
5
$254,668
173
$160,603
240
$148,276
33
$99,947
3
$1,880,250
65
$155,366
APPLICATIONS APPROVED, NOT ACCEPTED
0
$0
34
$156,986
77
$144,102
9
$55,118
0
$0
19
$133,261
APPLICATIONS DENIED
3
$192,833
174
$158,993
312
$154,703
65
$83,222
1
$7,125,000
102
$166,107
APPLICATIONS WITHDRAWN
1
$143,370
44
$155,843
123
$145,297
8
$145,234
0
$0
23
$164,292
FILES CLOSED FOR INCOMPLETENESS
0
$0
18
$199,458
34
$168,471
3
$99,797
0
$0
6
$220,035
Aggregated Statistics For Year 2006 (Based on 2 full and 3 partial tracts)
A) FHA, FSA/RHS & VA Home Purchase Loans
B) Conventional Home Purchase Loans
C) Refinancings
D) Home Improvement Loans
E) Loans on Dwellings For 5+ Families
F) Non-occupant Loans on < 5 Family Dwellings (A B C & D)
G) Loans On Manufactured Home Dwelling (A B C & D)
Number
Average Value
Number
Average Value
Number
Average Value
Number
Average Value
Number
Average Value
Number
Average Value
Number
Average Value
LOANS ORIGINATED
8
$178,512
439
$121,637
328
$133,449
31
$85,150
1
$437,720
131
$137,812
1
$3,710
APPLICATIONS APPROVED, NOT ACCEPTED
0
$0
91
$126,271
74
$127,431
9
$60,376
0
$0
28
$139,990
0
$0
APPLICATIONS DENIED
1
$162,000
294
$121,172
275
$138,803
61
$72,217
1
$100,000
89
$139,365
3
$11,130
APPLICATIONS WITHDRAWN
0
$0
92
$118,657
182
$134,348
7
$80,844
0
$0
33
$128,968
0
$0
FILES CLOSED FOR INCOMPLETENESS
2
$164,690
21
$122,660
44
$128,681
1
$113,600
0
$0
8
$136,046
1
$110,540
Aggregated Statistics For Year 2005 (Based on 2 full and 3 partial tracts)
A) FHA, FSA/RHS & VA Home Purchase Loans
B) Conventional Home Purchase Loans
C) Refinancings
D) Home Improvement Loans
E) Loans on Dwellings For 5+ Families
F) Non-occupant Loans on < 5 Family Dwellings (A B C & D)
G) Loans On Manufactured Home Dwelling (A B C & D)
Number
Average Value
Number
Average Value
Number
Average Value
Number
Average Value
Number
Average Value
Number
Average Value
Number
Average Value
LOANS ORIGINATED
4
$133,368
405
$96,870
286
$107,893
28
$66,099
1
$700,000
126
$117,423
0
$0
APPLICATIONS APPROVED, NOT ACCEPTED
0
$0
78
$100,594
50
$99,508
7
$40,519
0
$0
21
$118,104
1
$80,130
APPLICATIONS DENIED
3
$134,163
240
$95,434
271
$109,909
45
$49,101
0
$0
84
$113,853
0
$0
APPLICATIONS WITHDRAWN
1
$234,580
130
$100,461
163
$110,230
20
$134,720
0
$0
41
$134,177
0
$0
FILES CLOSED FOR INCOMPLETENESS
2
$92,940
26
$98,987
96
$107,851
1
$52,370
0
$0
10
$114,344
0
$0
Aggregated Statistics For Year 2004 (Based on 2 full and 3 partial tracts)
A) FHA, FSA/RHS & VA Home Purchase Loans
B) Conventional Home Purchase Loans
C) Refinancings
D) Home Improvement Loans
E) Loans on Dwellings For 5+ Families
F) Non-occupant Loans on < 5 Family Dwellings (A B C & D)
G) Loans On Manufactured Home Dwelling (A B C & D)
Number
Average Value
Number
Average Value
Number
Average Value
Number
Average Value
Number
Average Value
Number
Average Value
Number
Average Value
LOANS ORIGINATED
6
$106,952
314
$86,223
240
$91,285
33
$61,138
2
$403,210
122
$95,735
0
$0
APPLICATIONS APPROVED, NOT ACCEPTED
2
$96,690
94
$96,804
70
$79,130
5
$74,558
0
$0
28
$95,674
0
$0
APPLICATIONS DENIED
1
$82,000
177
$86,396
256
$87,523
63
$57,063
1
$52,890
58
$94,688
2
$39,810
APPLICATIONS WITHDRAWN
3
$111,477
76
$85,590
96
$88,638
10
$66,412
0
$0
23
$87,581
0
$0
FILES CLOSED FOR INCOMPLETENESS
2
$96,725
21
$97,174
61
$93,111
2
$55,000
0
$0
9
$86,787
1
$125,000
Aggregated Statistics For Year 2003 (Based on 2 full and 3 partial tracts)
A) FHA, FSA/RHS & VA Home Purchase Loans
B) Conventional Home Purchase Loans
C) Refinancings
D) Home Improvement Loans
E) Loans on Dwellings For 5+ Families
F) Non-occupant Loans on < 5 Family Dwellings (A B C & D)
Number
Average Value
Number
Average Value
Number
Average Value
Number
Average Value
Number
Average Value
Number
Average Value
LOANS ORIGINATED
15
$91,549
131
$88,541
193
$77,277
5
$17,264
2
$610,360
71
$88,937
APPLICATIONS APPROVED, NOT ACCEPTED
0
$0
35
$86,173
61
$73,442
5
$35,494
1
$207,730
23
$76,411
APPLICATIONS DENIED
4
$94,962
78
$80,163
268
$79,898
16
$16,979
1
$68,760
43
$78,214
APPLICATIONS WITHDRAWN
4
$82,500
33
$77,388
118
$81,847
0
$0
2
$259,970
12
$71,409
FILES CLOSED FOR INCOMPLETENESS
2
$97,120
6
$69,310
11
$73,503
0
$0
0
$0
4
$99,078
Aggregated Statistics For Year 2002 (Based on 2 full and 3 partial tracts)
A) FHA, FSA/RHS & VA Home Purchase Loans
B) Conventional Home Purchase Loans
C) Refinancings
D) Home Improvement Loans
E) Loans on Dwellings For 5+ Families
F) Non-occupant Loans on < 5 Family Dwellings (A B C & D)
Number
Average Value
Number
Average Value
Number
Average Value
Number
Average Value
Number
Average Value
Number
Average Value
LOANS ORIGINATED
25
$96,754
97
$77,950
122
$66,252
12
$18,000
4
$367,440
39
$72,627
APPLICATIONS APPROVED, NOT ACCEPTED
2
$75,850
18
$65,112
32
$60,193
12
$9,930
0
$0
9
$76,171
APPLICATIONS DENIED
8
$100,794
51
$67,597
187
$67,314
36
$14,337
1
$95,200
31
$60,035
APPLICATIONS WITHDRAWN
6
$76,487
18
$88,758
93
$81,773
1
$18,440
0
$0
11
$101,091
FILES CLOSED FOR INCOMPLETENESS
3
$84,390
14
$71,903
22
$71,342
1
$12,880
0
$0
5
$57,318
Aggregated Statistics For Year 2001 (Based on 2 full and 3 partial tracts)
A) FHA, FSA/RHS & VA Home Purchase Loans
B) Conventional Home Purchase Loans
C) Refinancings
D) Home Improvement Loans
E) Loans on Dwellings For 5+ Families
F) Non-occupant Loans on < 5 Family Dwellings (A B C & D)
Number
Average Value
Number
Average Value
Number
Average Value
Number
Average Value
Number
Average Value
Number
Average Value
LOANS ORIGINATED
34
$89,069
70
$65,579
123
$64,629
17
$14,029
3
$578,523
36
$58,291
APPLICATIONS APPROVED, NOT ACCEPTED
1
$48,080
18
$68,904
34
$63,078
9
$7,008
1
$96,790
13
$65,782
APPLICATIONS DENIED
5
$96,318
55
$65,736
208
$55,420
50
$13,633
0
$0
29
$57,234
APPLICATIONS WITHDRAWN
3
$93,740
12
$82,242
78
$58,216
9
$29,562
2
$880,235
5
$62,146
FILES CLOSED FOR INCOMPLETENESS
2
$39,780
4
$55,590
19
$75,387
3
$41,107
0
$0
0
$0
Aggregated Statistics For Year 2000 (Based on 2 full and 3 partial tracts)
A) FHA, FSA/RHS & VA Home Purchase Loans
B) Conventional Home Purchase Loans
C) Refinancings
D) Home Improvement Loans
E) Loans on Dwellings For 5+ Families
F) Non-occupant Loans on < 5 Family Dwellings (A B C & D)
#10 on the list of "Top 101 cities with largest percentage of females in occupations: transportation occupations (population 5,000+)"
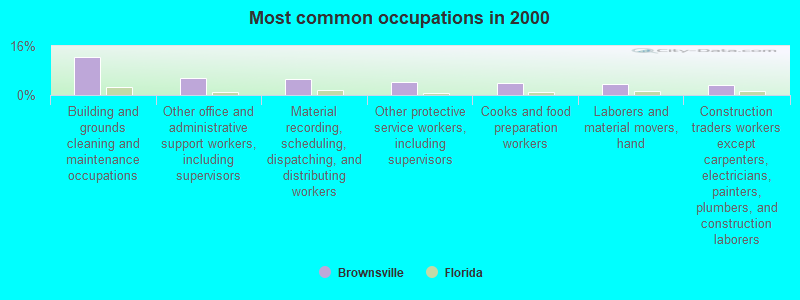
#22 on the list of "Top 101 cities with largest percentage of females in occupations: building and grounds cleaning and maintenance occupations (population 5,000+)"
#32 on the list of "Top 101 cities with the highest percentage of single-parent households, population 5,000+"
#33 on the list of "Top 101 cities with the least cars per house, population 5,000+"
#39 on the list of "Top 101 cities with largest percentage of females in occupations: fire fighting and prevention workers including supervisors (population 5,000+)"
#65 on the list of "Top 101 cities with the largest positive percentage difference between never married females and males (15+ years) (with at least 1,000 females never married)"
#71 on the list of "Top 101 cities with the most residents born in Nicaragua (population 500+)"
#74 on the list of "Top 101 cities with largest percentage of males in occupations: transportation occupations (population 5,000+)"
#74 on the list of "Top 101 cities with the most residents born in Cuba (population 500+)"
#74 on the list of "Top 101 cities with the largest household incomes disparities (population 5,000+)"
#76 on the list of "Top 101 cities with largest percentage of females in industries: other services, except public administration (population 5,000+)"
#99 on the list of "Top 101 cities with largest percentage of females in industries: transportation and warehousing (population 5,000+)"
#16 (33147) on the list of "Top 101 zip codes with the smallest percentage of taxpayers reporting net capital gain/loss in 2012 (pop 5,000+)"
#30 (33142) on the list of "Top 101 zip codes with the lowest 2012 average Adjusted Gross Income (AGI) for individuals (pop 5,000+)"
#36 (33142) on the list of "Top 101 zip codes with the smallest percentage of taxpayers reporting taxable interest in 2012 (pop 5,000+)"
#48 (33142) on the list of "Top 101 zip codes with the largest percentage of United States first ancestries (pop 5,000+)"
#64 (33147) on the list of "Top 101 zip codes with the lowest average reported salary/wage in 2012 (pop 5,000+)"
#73 (33147) on the list of "Top 101 zip codes with the largest percentage of West Indian first ancestries"
#2 on the list of "Top 101 counties with the highest ground withdrawal of fresh water for public supply"
#8 on the list of "Top 101 counties with the most Evangelical Protestant congregations"
#9 on the list of "Top 101 counties with the most Black Protestant adherents"
#11 on the list of "Top 101 counties with the highest total withdrawal of fresh water for public supply (pop. 50,000+)"
#12 on the list of "Top 101 counties with the most Evangelical Protestant adherents (pop. 50,000+)"


 Recent articles from our blog. Our writers, many of them Ph.D. graduates or candidates, create easy-to-read articles on a wide variety of topics.


 (2.5 miles