Bryant, Arkansas Submit your own pictures of this city and show them to the world
OSM Map
General Map
Google Map
MSN Map
OSM Map
General Map
Google Map
MSN Map
OSM Map
General Map
Google Map
MSN Map
OSM Map
General Map
Google Map
MSN Map
Please wait while loading the map...
Population in 2022: 21,501 (96% urban, 4% rural). Population change since 2000: +120.2%Males: 9,708 Females: 11,793
March 2022 cost of living index in Bryant: 84.0 (less than average, U.S. average is 100) Percentage of residents living in poverty in 2022: 7.8%for White Non-Hispanic residents , 4.6% for Black residents , 14.0% for Hispanic or Latino residents , 28.9% for American Indian residents , 2.1% for other race residents , 17.1% for two or more races residents )
Profiles of local businesses
Business Search - 14 Million verified businesses
Data:
Median household income ($)
Median household income (% change since 2000)
Household income diversity
Ratio of average income to average house value (%)
Ratio of average income to average rent
Median household income ($) - White
Median household income ($) - Black or African American
Median household income ($) - Asian
Median household income ($) - Hispanic or Latino
Median household income ($) - American Indian and Alaska Native
Median household income ($) - Multirace
Median household income ($) - Other Race
Median household income for houses/condos with a mortgage ($)
Median household income for apartments without a mortgage ($)
Races - White alone (%)
Races - White alone (% change since 2000)
Races - Black alone (%)
Races - Black alone (% change since 2000)
Races - American Indian alone (%)
Races - American Indian alone (% change since 2000)
Races - Asian alone (%)
Races - Asian alone (% change since 2000)
Races - Hispanic (%)
Races - Hispanic (% change since 2000)
Races - Native Hawaiian and Other Pacific Islander alone (%)
Races - Native Hawaiian and Other Pacific Islander alone (% change since 2000)
Races - Two or more races (%)
Races - Two or more races (% change since 2000)
Races - Other race alone (%)
Races - Other race alone (% change since 2000)
Racial diversity
Unemployment (%)
Unemployment (% change since 2000)
Unemployment (%) - White
Unemployment (%) - Black or African American
Unemployment (%) - Asian
Unemployment (%) - Hispanic or Latino
Unemployment (%) - American Indian and Alaska Native
Unemployment (%) - Multirace
Unemployment (%) - Other Race
Population density (people per square mile)
Population - Males (%)
Population - Females (%)
Population - Males (%) - White
Population - Males (%) - Black or African American
Population - Males (%) - Asian
Population - Males (%) - Hispanic or Latino
Population - Males (%) - American Indian and Alaska Native
Population - Males (%) - Multirace
Population - Males (%) - Other Race
Population - Females (%) - White
Population - Females (%) - Black or African American
Population - Females (%) - Asian
Population - Females (%) - Hispanic or Latino
Population - Females (%) - American Indian and Alaska Native
Population - Females (%) - Multirace
Population - Females (%) - Other Race
Coronavirus confirmed cases (Jun 19, 2024)
Deaths caused by coronavirus (Jun 19, 2024)
Coronavirus confirmed cases (per 100k population) (Jun 19, 2024)
Deaths caused by coronavirus (per 100k population) (Jun 19, 2024)
Daily increase in number of cases (Jun 19, 2024)
Weekly increase in number of cases (Jun 19, 2024)
Cases doubled (in days) (Jun 19, 2024)
Hospitalized patients (Apr 18, 2022)
Negative test results (Apr 18, 2022)
Total test results (Apr 18, 2022)
COVID Vaccine doses distributed (per 100k population) (Sep 19, 2023)
COVID Vaccine doses administered (per 100k population) (Sep 19, 2023)
COVID Vaccine doses distributed (Sep 19, 2023)
COVID Vaccine doses administered (Sep 19, 2023)
Likely homosexual households (%)
Likely homosexual households (% change since 2000)
Likely homosexual households - Lesbian couples (%)
Likely homosexual households - Lesbian couples (% change since 2000)
Likely homosexual households - Gay men (%)
Likely homosexual households - Gay men (% change since 2000)
Cost of living index
Median gross rent ($)
Median contract rent ($)
Median monthly housing costs ($)
Median house or condo value ($)
Median house or condo value ($ change since 2000)
Mean house or condo value by units in structure - 1, detached ($)
Mean house or condo value by units in structure - 1, attached ($)
Mean house or condo value by units in structure - 2 ($)
Mean house or condo value by units in structure by units in structure - 3 or 4 ($)
Mean house or condo value by units in structure - 5 or more ($)
Mean house or condo value by units in structure - Boat, RV, van, etc. ($)
Mean house or condo value by units in structure - Mobile home ($)
Median house or condo value ($) - White
Median house or condo value ($) - Black or African American
Median house or condo value ($) - Asian
Median house or condo value ($) - Hispanic or Latino
Median house or condo value ($) - American Indian and Alaska Native
Median house or condo value ($) - Multirace
Median house or condo value ($) - Other Race
Median resident age
Resident age diversity
Median resident age - Males
Median resident age - Females
Median resident age - White
Median resident age - Black or African American
Median resident age - Asian
Median resident age - Hispanic or Latino
Median resident age - American Indian and Alaska Native
Median resident age - Multirace
Median resident age - Other Race
Median resident age - Males - White
Median resident age - Males - Black or African American
Median resident age - Males - Asian
Median resident age - Males - Hispanic or Latino
Median resident age - Males - American Indian and Alaska Native
Median resident age - Males - Multirace
Median resident age - Males - Other Race
Median resident age - Females - White
Median resident age - Females - Black or African American
Median resident age - Females - Asian
Median resident age - Females - Hispanic or Latino
Median resident age - Females - American Indian and Alaska Native
Median resident age - Females - Multirace
Median resident age - Females - Other Race
Commute - mean travel time to work (minutes)
Travel time to work - Less than 5 minutes (%)
Travel time to work - Less than 5 minutes (% change since 2000)
Travel time to work - 5 to 9 minutes (%)
Travel time to work - 5 to 9 minutes (% change since 2000)
Travel time to work - 10 to 19 minutes (%)
Travel time to work - 10 to 19 minutes (% change since 2000)
Travel time to work - 20 to 29 minutes (%)
Travel time to work - 20 to 29 minutes (% change since 2000)
Travel time to work - 30 to 39 minutes (%)
Travel time to work - 30 to 39 minutes (% change since 2000)
Travel time to work - 40 to 59 minutes (%)
Travel time to work - 40 to 59 minutes (% change since 2000)
Travel time to work - 60 to 89 minutes (%)
Travel time to work - 60 to 89 minutes (% change since 2000)
Travel time to work - 90 or more minutes (%)
Travel time to work - 90 or more minutes (% change since 2000)
Marital status - Never married (%)
Marital status - Now married (%)
Marital status - Separated (%)
Marital status - Widowed (%)
Marital status - Divorced (%)
Median family income ($)
Median family income (% change since 2000)
Median non-family income ($)
Median non-family income (% change since 2000)
Median per capita income ($)
Median per capita income (% change since 2000)
Median family income ($) - White
Median family income ($) - Black or African American
Median family income ($) - Asian
Median family income ($) - Hispanic or Latino
Median family income ($) - American Indian and Alaska Native
Median family income ($) - Multirace
Median family income ($) - Other Race
Median year house/condo built
Median year apartment built
Year house built - Built 2005 or later (%)
Year house built - Built 2000 to 2004 (%)
Year house built - Built 1990 to 1999 (%)
Year house built - Built 1980 to 1989 (%)
Year house built - Built 1970 to 1979 (%)
Year house built - Built 1960 to 1969 (%)
Year house built - Built 1950 to 1959 (%)
Year house built - Built 1940 to 1949 (%)
Year house built - Built 1939 or earlier (%)
Average household size
Household density (households per square mile)
Average household size - White
Average household size - Black or African American
Average household size - Asian
Average household size - Hispanic or Latino
Average household size - American Indian and Alaska Native
Average household size - Multirace
Average household size - Other Race
Occupied housing units (%)
Vacant housing units (%)
Owner occupied housing units (%)
Renter occupied housing units (%)
Vacancy status - For rent (%)
Vacancy status - For sale only (%)
Vacancy status - Rented or sold, not occupied (%)
Vacancy status - For seasonal, recreational, or occasional use (%)
Vacancy status - For migrant workers (%)
Vacancy status - Other vacant (%)
Residents with income below the poverty level (%)
Residents with income below 50% of the poverty level (%)
Children below poverty level (%)
Poor families by family type - Married-couple family (%)
Poor families by family type - Male, no wife present (%)
Poor families by family type - Female, no husband present (%)
Poverty status for native-born residents (%)
Poverty status for foreign-born residents (%)
Poverty among high school graduates not in families (%)
Poverty among people who did not graduate high school not in families (%)
Residents with income below the poverty level (%) - White
Residents with income below the poverty level (%) - Black or African American
Residents with income below the poverty level (%) - Asian
Residents with income below the poverty level (%) - Hispanic or Latino
Residents with income below the poverty level (%) - American Indian and Alaska Native
Residents with income below the poverty level (%) - Multirace
Residents with income below the poverty level (%) - Other Race
Air pollution - Air Quality Index (AQI)
Air pollution - CO
Air pollution - NO2
Air pollution - SO2
Air pollution - Ozone
Air pollution - PM10
Air pollution - PM25
Air pollution - Pb
Crime - Murders per 100,000 population
Crime - Rapes per 100,000 population
Crime - Robberies per 100,000 population
Crime - Assaults per 100,000 population
Crime - Burglaries per 100,000 population
Crime - Thefts per 100,000 population
Crime - Auto thefts per 100,000 population
Crime - Arson per 100,000 population
Crime - City-data.com crime index
Crime - Violent crime index
Crime - Property crime index
Crime - Murders per 100,000 population (5 year average)
Crime - Rapes per 100,000 population (5 year average)
Crime - Robberies per 100,000 population (5 year average)
Crime - Assaults per 100,000 population (5 year average)
Crime - Burglaries per 100,000 population (5 year average)
Crime - Thefts per 100,000 population (5 year average)
Crime - Auto thefts per 100,000 population (5 year average)
Crime - Arson per 100,000 population (5 year average)
Crime - City-data.com crime index (5 year average)
Crime - Violent crime index (5 year average)
Crime - Property crime index (5 year average)
1996 Presidential Elections Results (%) - Democratic Party (Clinton)
1996 Presidential Elections Results (%) - Republican Party (Dole)
1996 Presidential Elections Results (%) - Other
2000 Presidential Elections Results (%) - Democratic Party (Gore)
2000 Presidential Elections Results (%) - Republican Party (Bush)
2000 Presidential Elections Results (%) - Other
2004 Presidential Elections Results (%) - Democratic Party (Kerry)
2004 Presidential Elections Results (%) - Republican Party (Bush)
2004 Presidential Elections Results (%) - Other
2008 Presidential Elections Results (%) - Democratic Party (Obama)
2008 Presidential Elections Results (%) - Republican Party (McCain)
2008 Presidential Elections Results (%) - Other
2012 Presidential Elections Results (%) - Democratic Party (Obama)
2012 Presidential Elections Results (%) - Republican Party (Romney)
2012 Presidential Elections Results (%) - Other
2016 Presidential Elections Results (%) - Democratic Party (Clinton)
2016 Presidential Elections Results (%) - Republican Party (Trump)
2016 Presidential Elections Results (%) - Other
2020 Presidential Elections Results (%) - Democratic Party (Biden)
2020 Presidential Elections Results (%) - Republican Party (Trump)
2020 Presidential Elections Results (%) - Other
Ancestries Reported - Arab (%)
Ancestries Reported - Czech (%)
Ancestries Reported - Danish (%)
Ancestries Reported - Dutch (%)
Ancestries Reported - English (%)
Ancestries Reported - French (%)
Ancestries Reported - French Canadian (%)
Ancestries Reported - German (%)
Ancestries Reported - Greek (%)
Ancestries Reported - Hungarian (%)
Ancestries Reported - Irish (%)
Ancestries Reported - Italian (%)
Ancestries Reported - Lithuanian (%)
Ancestries Reported - Norwegian (%)
Ancestries Reported - Polish (%)
Ancestries Reported - Portuguese (%)
Ancestries Reported - Russian (%)
Ancestries Reported - Scotch-Irish (%)
Ancestries Reported - Scottish (%)
Ancestries Reported - Slovak (%)
Ancestries Reported - Subsaharan African (%)
Ancestries Reported - Swedish (%)
Ancestries Reported - Swiss (%)
Ancestries Reported - Ukrainian (%)
Ancestries Reported - United States (%)
Ancestries Reported - Welsh (%)
Ancestries Reported - West Indian (%)
Ancestries Reported - Other (%)
Educational Attainment - No schooling completed (%)
Educational Attainment - Less than high school (%)
Educational Attainment - High school or equivalent (%)
Educational Attainment - Less than 1 year of college (%)
Educational Attainment - 1 or more years of college (%)
Educational Attainment - Associate degree (%)
Educational Attainment - Bachelor's degree (%)
Educational Attainment - Master's degree (%)
Educational Attainment - Professional school degree (%)
Educational Attainment - Doctorate degree (%)
School Enrollment - Nursery, preschool (%)
School Enrollment - Kindergarten (%)
School Enrollment - Grade 1 to 4 (%)
School Enrollment - Grade 5 to 8 (%)
School Enrollment - Grade 9 to 12 (%)
School Enrollment - College undergrad (%)
School Enrollment - Graduate or professional (%)
School Enrollment - Not enrolled in school (%)
School enrollment - Public schools (%)
School enrollment - Private schools (%)
School enrollment - Not enrolled (%)
Median number of rooms in houses and condos
Median number of rooms in apartments
Housing units lacking complete plumbing facilities (%)
Housing units lacking complete kitchen facilities (%)
Density of houses
Urban houses (%)
Rural houses (%)
Households with people 60 years and over (%)
Households with people 65 years and over (%)
Households with people 75 years and over (%)
Households with one or more nonrelatives (%)
Households with no nonrelatives (%)
Population in households (%)
Family households (%)
Nonfamily households (%)
Population in families (%)
Family households with own children (%)
Median number of bedrooms in owner occupied houses
Mean number of bedrooms in owner occupied houses
Median number of bedrooms in renter occupied houses
Mean number of bedrooms in renter occupied houses
Median number of vehichles in owner occupied houses
Mean number of vehichles in owner occupied houses
Median number of vehichles in renter occupied houses
Mean number of vehichles in renter occupied houses
Mortgage status - with mortgage (%)
Mortgage status - with second mortgage (%)
Mortgage status - with home equity loan (%)
Mortgage status - with both second mortgage and home equity loan (%)
Mortgage status - without a mortgage (%)
Average family size
Average family size - White
Average family size - Black or African American
Average family size - Asian
Average family size - Hispanic or Latino
Average family size - American Indian and Alaska Native
Average family size - Multirace
Average family size - Other Race
Geographical mobility - Same house 1 year ago (%)
Geographical mobility - Moved within same county (%)
Geographical mobility - Moved from different county within same state (%)
Geographical mobility - Moved from different state (%)
Geographical mobility - Moved from abroad (%)
Place of birth - Born in state of residence (%)
Place of birth - Born in other state (%)
Place of birth - Native, outside of US (%)
Place of birth - Foreign born (%)
Housing units in structures - 1, detached (%)
Housing units in structures - 1, attached (%)
Housing units in structures - 2 (%)
Housing units in structures - 3 or 4 (%)
Housing units in structures - 5 to 9 (%)
Housing units in structures - 10 to 19 (%)
Housing units in structures - 20 to 49 (%)
Housing units in structures - 50 or more (%)
Housing units in structures - Mobile home (%)
Housing units in structures - Boat, RV, van, etc. (%)
House/condo owner moved in on average (years ago)
Renter moved in on average (years ago)
Year householder moved into unit - Moved in 1999 to March 2000 (%)
Year householder moved into unit - Moved in 1995 to 1998 (%)
Year householder moved into unit - Moved in 1990 to 1994 (%)
Year householder moved into unit - Moved in 1980 to 1989 (%)
Year householder moved into unit - Moved in 1970 to 1979 (%)
Year householder moved into unit - Moved in 1969 or earlier (%)
Means of transportation to work - Drove car alone (%)
Means of transportation to work - Carpooled (%)
Means of transportation to work - Public transportation (%)
Means of transportation to work - Bus or trolley bus (%)
Means of transportation to work - Streetcar or trolley car (%)
Means of transportation to work - Subway or elevated (%)
Means of transportation to work - Railroad (%)
Means of transportation to work - Ferryboat (%)
Means of transportation to work - Taxicab (%)
Means of transportation to work - Motorcycle (%)
Means of transportation to work - Bicycle (%)
Means of transportation to work - Walked (%)
Means of transportation to work - Other means (%)
Working at home (%)
Industry diversity
Most Common Industries - Agriculture, forestry, fishing and hunting, and mining (%)
Most Common Industries - Agriculture, forestry, fishing and hunting (%)
Most Common Industries - Mining, quarrying, and oil and gas extraction (%)
Most Common Industries - Construction (%)
Most Common Industries - Manufacturing (%)
Most Common Industries - Wholesale trade (%)
Most Common Industries - Retail trade (%)
Most Common Industries - Transportation and warehousing, and utilities (%)
Most Common Industries - Transportation and warehousing (%)
Most Common Industries - Utilities (%)
Most Common Industries - Information (%)
Most Common Industries - Finance and insurance, and real estate and rental and leasing (%)
Most Common Industries - Finance and insurance (%)
Most Common Industries - Real estate and rental and leasing (%)
Most Common Industries - Professional, scientific, and management, and administrative and waste management services (%)
Most Common Industries - Professional, scientific, and technical services (%)
Most Common Industries - Management of companies and enterprises (%)
Most Common Industries - Administrative and support and waste management services (%)
Most Common Industries - Educational services, and health care and social assistance (%)
Most Common Industries - Educational services (%)
Most Common Industries - Health care and social assistance (%)
Most Common Industries - Arts, entertainment, and recreation, and accommodation and food services (%)
Most Common Industries - Arts, entertainment, and recreation (%)
Most Common Industries - Accommodation and food services (%)
Most Common Industries - Other services, except public administration (%)
Most Common Industries - Public administration (%)
Occupation diversity
Most Common Occupations - Management, business, science, and arts occupations (%)
Most Common Occupations - Management, business, and financial occupations (%)
Most Common Occupations - Management occupations (%)
Most Common Occupations - Business and financial operations occupations (%)
Most Common Occupations - Computer, engineering, and science occupations (%)
Most Common Occupations - Computer and mathematical occupations (%)
Most Common Occupations - Architecture and engineering occupations (%)
Most Common Occupations - Life, physical, and social science occupations (%)
Most Common Occupations - Education, legal, community service, arts, and media occupations (%)
Most Common Occupations - Community and social service occupations (%)
Most Common Occupations - Legal occupations (%)
Most Common Occupations - Education, training, and library occupations (%)
Most Common Occupations - Arts, design, entertainment, sports, and media occupations (%)
Most Common Occupations - Healthcare practitioners and technical occupations (%)
Most Common Occupations - Health diagnosing and treating practitioners and other technical occupations (%)
Most Common Occupations - Health technologists and technicians (%)
Most Common Occupations - Service occupations (%)
Most Common Occupations - Healthcare support occupations (%)
Most Common Occupations - Protective service occupations (%)
Most Common Occupations - Fire fighting and prevention, and other protective service workers including supervisors (%)
Most Common Occupations - Law enforcement workers including supervisors (%)
Most Common Occupations - Food preparation and serving related occupations (%)
Most Common Occupations - Building and grounds cleaning and maintenance occupations (%)
Most Common Occupations - Personal care and service occupations (%)
Most Common Occupations - Sales and office occupations (%)
Most Common Occupations - Sales and related occupations (%)
Most Common Occupations - Office and administrative support occupations (%)
Most Common Occupations - Natural resources, construction, and maintenance occupations (%)
Most Common Occupations - Farming, fishing, and forestry occupations (%)
Most Common Occupations - Construction and extraction occupations (%)
Most Common Occupations - Installation, maintenance, and repair occupations (%)
Most Common Occupations - Production, transportation, and material moving occupations (%)
Most Common Occupations - Production occupations (%)
Most Common Occupations - Transportation occupations (%)
Most Common Occupations - Material moving occupations (%)
People in Group quarters - Institutionalized population (%)
People in Group quarters - Correctional institutions (%)
People in Group quarters - Federal prisons and detention centers (%)
People in Group quarters - Halfway houses (%)
People in Group quarters - Local jails and other confinement facilities (including police lockups) (%)
People in Group quarters - Military disciplinary barracks (%)
People in Group quarters - State prisons (%)
People in Group quarters - Other types of correctional institutions (%)
People in Group quarters - Nursing homes (%)
People in Group quarters - Hospitals/wards, hospices, and schools for the handicapped (%)
People in Group quarters - Hospitals/wards and hospices for chronically ill (%)
People in Group quarters - Hospices or homes for chronically ill (%)
People in Group quarters - Military hospitals or wards for chronically ill (%)
People in Group quarters - Other hospitals or wards for chronically ill (%)
People in Group quarters - Hospitals or wards for drug/alcohol abuse (%)
People in Group quarters - Mental (Psychiatric) hospitals or wards (%)
People in Group quarters - Schools, hospitals, or wards for the mentally retarded (%)
People in Group quarters - Schools, hospitals, or wards for the physically handicapped (%)
People in Group quarters - Institutions for the deaf (%)
People in Group quarters - Institutions for the blind (%)
People in Group quarters - Orthopedic wards and institutions for the physically handicapped (%)
People in Group quarters - Wards in general hospitals for patients who have no usual home elsewhere (%)
People in Group quarters - Wards in military hospitals for patients who have no usual home elsewhere (%)
People in Group quarters - Juvenile institutions (%)
People in Group quarters - Long-term care (%)
People in Group quarters - Homes for abused, dependent, and neglected children (%)
People in Group quarters - Residential treatment centers for emotionally disturbed children (%)
People in Group quarters - Training schools for juvenile delinquents (%)
People in Group quarters - Short-term care, detention or diagnostic centers for delinquent children (%)
People in Group quarters - Type of juvenile institution unknown (%)
People in Group quarters - Noninstitutionalized population (%)
People in Group quarters - College dormitories (includes college quarters off campus) (%)
People in Group quarters - Military quarters (%)
People in Group quarters - On base (%)
People in Group quarters - Barracks, unaccompanied personnel housing (UPH), (Enlisted/Officer), ;and similar group living quarters for military personnel (%)
People in Group quarters - Transient quarters for temporary residents (%)
People in Group quarters - Military ships (%)
People in Group quarters - Group homes (%)
People in Group quarters - Homes or halfway houses for drug/alcohol abuse (%)
People in Group quarters - Homes for the mentally ill (%)
People in Group quarters - Homes for the mentally retarded (%)
People in Group quarters - Homes for the physically handicapped (%)
People in Group quarters - Other group homes (%)
People in Group quarters - Religious group quarters (%)
People in Group quarters - Dormitories (%)
People in Group quarters - Agriculture workers' dormitories on farms (%)
People in Group quarters - Job Corps and vocational training facilities (%)
People in Group quarters - Other workers' dormitories (%)
People in Group quarters - Crews of maritime vessels (%)
People in Group quarters - Other nonhousehold living situations (%)
People in Group quarters - Other noninstitutional group quarters (%)
Residents speaking English at home (%)
Residents speaking English at home - Born in the United States (%)
Residents speaking English at home - Native, born elsewhere (%)
Residents speaking English at home - Foreign born (%)
Residents speaking Spanish at home (%)
Residents speaking Spanish at home - Born in the United States (%)
Residents speaking Spanish at home - Native, born elsewhere (%)
Residents speaking Spanish at home - Foreign born (%)
Residents speaking other language at home (%)
Residents speaking other language at home - Born in the United States (%)
Residents speaking other language at home - Native, born elsewhere (%)
Residents speaking other language at home - Foreign born (%)
Class of Workers - Employee of private company (%)
Class of Workers - Self-employed in own incorporated business (%)
Class of Workers - Private not-for-profit wage and salary workers (%)
Class of Workers - Local government workers (%)
Class of Workers - State government workers (%)
Class of Workers - Federal government workers (%)
Class of Workers - Self-employed workers in own not incorporated business and Unpaid family workers (%)
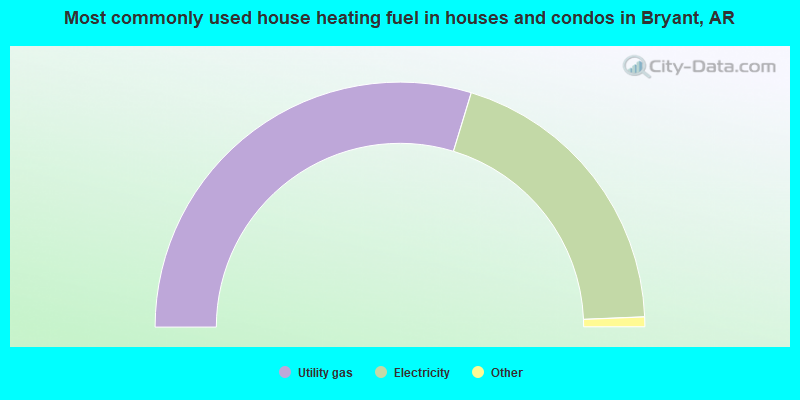
House heating fuel used in houses and condos - Utility gas (%)
House heating fuel used in houses and condos - Bottled, tank, or LP gas (%)
House heating fuel used in houses and condos - Electricity (%)
House heating fuel used in houses and condos - Fuel oil, kerosene, etc. (%)
House heating fuel used in houses and condos - Coal or coke (%)
House heating fuel used in houses and condos - Wood (%)
House heating fuel used in houses and condos - Solar energy (%)
House heating fuel used in houses and condos - Other fuel (%)
House heating fuel used in houses and condos - No fuel used (%)
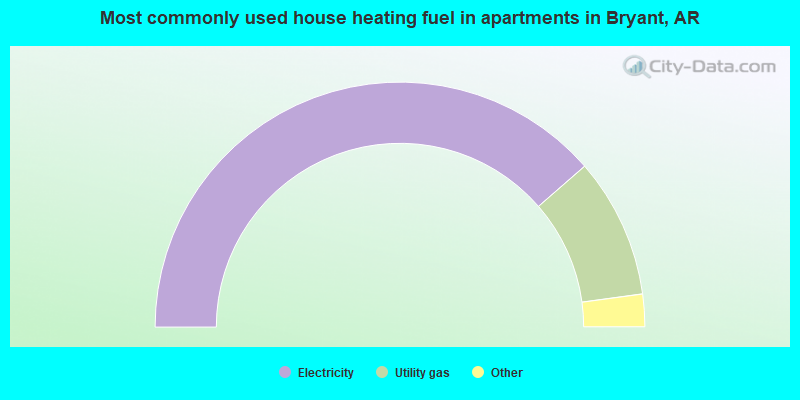
House heating fuel used in apartments - Utility gas (%)
House heating fuel used in apartments - Bottled, tank, or LP gas (%)
House heating fuel used in apartments - Electricity (%)
House heating fuel used in apartments - Fuel oil, kerosene, etc. (%)
House heating fuel used in apartments - Coal or coke (%)
House heating fuel used in apartments - Wood (%)
House heating fuel used in apartments - Solar energy (%)
House heating fuel used in apartments - Other fuel (%)
House heating fuel used in apartments - No fuel used (%)
Armed forces status - In Armed Forces (%)
Armed forces status - Civilian (%)
Armed forces status - Civilian - Veteran (%)
Armed forces status - Civilian - Nonveteran (%)
Fatal accidents locations in years 2005-2021
Fatal accidents locations in 2005
Fatal accidents locations in 2006
Fatal accidents locations in 2007
Fatal accidents locations in 2008
Fatal accidents locations in 2009
Fatal accidents locations in 2010
Fatal accidents locations in 2011
Fatal accidents locations in 2012
Fatal accidents locations in 2013
Fatal accidents locations in 2014
Fatal accidents locations in 2015
Fatal accidents locations in 2016
Fatal accidents locations in 2017
Fatal accidents locations in 2018
Fatal accidents locations in 2019
Fatal accidents locations in 2020
Fatal accidents locations in 2021
Alcohol use - People drinking some alcohol every month (%)
Alcohol use - People not drinking at all (%)
Alcohol use - Average days/month drinking alcohol
Alcohol use - Average drinks/week
Alcohol use - Average days/year people drink much
Audiometry - Average condition of hearing (%)
Audiometry - People that can hear a whisper from across a quiet room (%)
Audiometry - People that can hear normal voice from across a quiet room (%)
Audiometry - Ears ringing, roaring, buzzing (%)
Audiometry - Had a job exposure to loud noise (%)
Audiometry - Had off-work exposure to loud noise (%)
Blood Pressure & Cholesterol - Has high blood pressure (%)
Blood Pressure & Cholesterol - Checking blood pressure at home (%)
Blood Pressure & Cholesterol - Frequently checking blood cholesterol (%)
Blood Pressure & Cholesterol - Has high cholesterol level (%)
Consumer Behavior - Money monthly spent on food at supermarket/grocery store
Consumer Behavior - Money monthly spent on food at other stores
Consumer Behavior - Money monthly spent on eating out
Consumer Behavior - Money monthly spent on carryout/delivered foods
Consumer Behavior - Income spent on food at supermarket/grocery store (%)
Consumer Behavior - Income spent on food at other stores (%)
Consumer Behavior - Income spent on eating out (%)
Consumer Behavior - Income spent on carryout/delivered foods (%)
Current Health Status - General health condition (%)
Current Health Status - Blood donors (%)
Current Health Status - Has blood ever tested for HIV virus (%)
Current Health Status - Left-handed people (%)
Dermatology - People using sunscreen (%)
Diabetes - Diabetics (%)
Diabetes - Had a blood test for high blood sugar (%)
Diabetes - People taking insulin (%)
Diet Behavior & Nutrition - Diet health (%)
Diet Behavior & Nutrition - Milk product consumption (# of products/month)
Diet Behavior & Nutrition - Meals not home prepared (#/week)
Diet Behavior & Nutrition - Meals from fast food or pizza place (#/week)
Diet Behavior & Nutrition - Ready-to-eat foods (#/month)
Diet Behavior & Nutrition - Frozen meals/pizza (#/month)
Drug Use - People that ever used marijuana or hashish (%)
Drug Use - Ever used hard drugs (%)
Drug Use - Ever used any form of cocaine (%)
Drug Use - Ever used heroin (%)
Drug Use - Ever used methamphetamine (%)
Health Insurance - People covered by health insurance (%)
Kidney Conditions-Urology - Avg. # of times urinating at night
Medical Conditions - People with asthma (%)
Medical Conditions - People with anemia (%)
Medical Conditions - People with psoriasis (%)
Medical Conditions - People with overweight (%)
Medical Conditions - Elderly people having difficulties in thinking or remembering (%)
Medical Conditions - People who ever received blood transfusion (%)
Medical Conditions - People having trouble seeing even with glass/contacts (%)
Medical Conditions - People with arthritis (%)
Medical Conditions - People with gout (%)
Medical Conditions - People with congestive heart failure (%)
Medical Conditions - People with coronary heart disease (%)
Medical Conditions - People with angina pectoris (%)
Medical Conditions - People who ever had heart attack (%)
Medical Conditions - People who ever had stroke (%)
Medical Conditions - People with emphysema (%)
Medical Conditions - People with thyroid problem (%)
Medical Conditions - People with chronic bronchitis (%)
Medical Conditions - People with any liver condition (%)
Medical Conditions - People who ever had cancer or malignancy (%)
Mental Health - People who have little interest in doing things (%)
Mental Health - People feeling down, depressed, or hopeless (%)
Mental Health - People who have trouble sleeping or sleeping too much (%)
Mental Health - People feeling tired or having little energy (%)
Mental Health - People with poor appetite or overeating (%)
Mental Health - People feeling bad about themself (%)
Mental Health - People who have trouble concentrating on things (%)
Mental Health - People moving or speaking slowly or too fast (%)
Mental Health - People having thoughts they would be better off dead (%)
Oral Health - Average years since last visit a dentist
Oral Health - People embarrassed because of mouth (%)
Oral Health - People with gum disease (%)
Oral Health - General health of teeth and gums (%)
Oral Health - Average days a week using dental floss/device
Oral Health - Average days a week using mouthwash for dental problem
Oral Health - Average number of teeth
Pesticide Use - Households using pesticides to control insects (%)
Pesticide Use - Households using pesticides to kill weeds (%)
Physical Activity - People doing vigorous-intensity work activities (%)
Physical Activity - People doing moderate-intensity work activities (%)
Physical Activity - People walking or bicycling (%)
Physical Activity - People doing vigorous-intensity recreational activities (%)
Physical Activity - People doing moderate-intensity recreational activities (%)
Physical Activity - Average hours a day doing sedentary activities
Physical Activity - Average hours a day watching TV or videos
Physical Activity - Average hours a day using computer
Physical Functioning - People having limitations keeping them from working (%)
Physical Functioning - People limited in amount of work they can do (%)
Physical Functioning - People that need special equipment to walk (%)
Physical Functioning - People experiencing confusion/memory problems (%)
Physical Functioning - People requiring special healthcare equipment (%)
Prescription Medications - Average number of prescription medicines taking
Preventive Aspirin Use - Adults 40+ taking low-dose aspirin (%)
Reproductive Health - Vaginal deliveries (%)
Reproductive Health - Cesarean deliveries (%)
Reproductive Health - Deliveries resulted in a live birth (%)
Reproductive Health - Pregnancies resulted in a delivery (%)
Reproductive Health - Women breastfeeding newborns (%)
Reproductive Health - Women that had a hysterectomy (%)
Reproductive Health - Women that had both ovaries removed (%)
Reproductive Health - Women that have ever taken birth control pills (%)
Reproductive Health - Women taking birth control pills (%)
Reproductive Health - Women that have ever used Depo-Provera or injectables (%)
Reproductive Health - Women that have ever used female hormones (%)
Sexual Behavior - People 18+ that ever had sex (vaginal, anal, or oral) (%)
Sexual Behavior - Males 18+ that ever had vaginal sex with a woman (%)
Sexual Behavior - Males 18+ that ever performed oral sex on a woman (%)
Sexual Behavior - Males 18+ that ever had anal sex with a woman (%)
Sexual Behavior - Males 18+ that ever had any sex with a man (%)
Sexual Behavior - Females 18+ that ever had vaginal sex with a man (%)
Sexual Behavior - Females 18+ that ever performed oral sex on a man (%)
Sexual Behavior - Females 18+ that ever had anal sex with a man (%)
Sexual Behavior - Females 18+ that ever had any kind of sex with a woman (%)
Sexual Behavior - Average age people first had sex
Sexual Behavior - Average number of female sex partners in lifetime (males 18+)
Sexual Behavior - Average number of female vaginal sex partners in lifetime (males 18+)
Sexual Behavior - Average age people first performed oral sex on a woman (18+)
Sexual Behavior - Average number of woman performed oral sex on in lifetime (18+)
Sexual Behavior - Average number of male sex partners in lifetime (males 18+)
Sexual Behavior - Average number of male anal sex partners in lifetime (males 18+)
Sexual Behavior - Average age people first performed oral sex on a man (18+)
Sexual Behavior - Average number of male oral sex partners in lifetime (18+)
Sexual Behavior - People using protection when performing oral sex (%)
Sexual Behavior - Average number of times people have vaginal or anal sex a year
Sexual Behavior - People having sex without condom (%)
Sexual Behavior - Average number of male sex partners in lifetime (females 18+)
Sexual Behavior - Average number of male vaginal sex partners in lifetime (females 18+)
Sexual Behavior - Average number of female sex partners in lifetime (females 18+)
Sexual Behavior - Circumcised males 18+ (%)
Sleep Disorders - Average hours sleeping at night
Sleep Disorders - People that has trouble sleeping (%)
Smoking-Cigarette Use - People smoking cigarettes (%)
Taste & Smell - People 40+ having problems with smell (%)
Taste & Smell - People 40+ having problems with taste (%)
Taste & Smell - People 40+ that ever had wisdom teeth removed (%)
Taste & Smell - People 40+ that ever had tonsils teeth removed (%)
Taste & Smell - People 40+ that ever had a loss of consciousness because of a head injury (%)
Taste & Smell - People 40+ that ever had a broken nose or other serious injury to face or skull (%)
Taste & Smell - People 40+ that ever had two or more sinus infections (%)
Weight - Average height (inches)
Weight - Average weight (pounds)
Weight - Average BMI
Weight - People that are obese (%)
Weight - People that ever were obese (%)
Weight - People trying to lose weight (%)
15,408 72.3% White alone 3,288 15.4% Black alone 1,026 4.8% Hispanic 857 4.0% Two or more races 388 1.8% Asian alone 123 0.6% Other race alone 82 0.4% Native Hawaiian and Other 50 0.2% American Indian alone
According to our research of Arkansas and other state lists, there were 7 registered sex offenders living in Bryant, Arkansas as of June 19, 2024 . The ratio of all residents to sex offenders in Bryant is 2,808 to 1.The ratio of registered sex offenders to all residents in this city is much lower than the state average.
Officers per 1,000 residents here:
2.15Arkansas average:
2.25
Latest news from Bryant, AR collected exclusively by city-data.com from local newspapers, TV, and radio stations
Ancestries: American (16.8%), Irish (8.6%), German (8.4%), English (7.9%), African (2.9%), European (2.3%).
Current Local Time:
Land area: 9.07 square miles.
Population density: 2,370 people per square mile (low).
554 residents are foreign born (1.4% Asia , 0.9% Latin America ).
This city:
2.6%Arkansas:
5.0%
Median real estate property taxes paid for housing units with mortgages in 2022: $1,623 (0.6%)Median real estate property taxes paid for housing units with no mortgage in 2022: $1,132 (0.7%)
Nearest city with pop. 50,000+: Little Rock, AR
Nearest city with pop. 200,000+: Memphis, TN
Nearest city with pop. 1,000,000+: Dallas, TX
Nearest cities:
Latitude: 34.61 N, Longitude: 92.49 W
Daytime population change due to commuting: +4 (+0.0%)Workers who live and work in this city: 3,207 (30.5%)
Area code commonly used in this area: 501
Single-family new house construction building permits:
2022: 88 buildings , average cost: $241,9002021: 119 buildings , average cost: $246,8002020: 113 buildings , average cost: $215,2002019: 132 buildings , average cost: $187,2002018: 140 buildings , average cost: $181,2002017: 127 buildings , average cost: $184,7002016: 146 buildings , average cost: $165,3002015: 81 buildings , average cost: $159,4002014: 78 buildings , average cost: $182,5002013: 114 buildings , average cost: $180,9002012: 162 buildings , average cost: $182,8002011: 144 buildings , average cost: $172,6002010: 167 buildings , average cost: $148,7002009: 163 buildings , average cost: $141,6002008: 124 buildings , average cost: $161,2002007: 132 buildings , average cost: $194,5002006: 114 buildings , average cost: $177,0002005: 107 buildings , average cost: $149,4002004: 139 buildings , average cost: $145,6002003: 149 buildings , average cost: $141,7002002: 217 buildings , average cost: $121,6002001: 162 buildings , average cost: $131,4002000: 124 buildings , average cost: $134,3001999: 134 buildings , average cost: $120,8001998: 154 buildings , average cost: $122,9001997: 150 buildings , average cost: $113,000Unemployment in December 2023:
Most common occupations in Bryant, AR (%)
Both Males Females
Other sales and related occupations, including supervisors (5.9%)
Other office and administrative support workers, including supervisors (5.3%)
Preschool, kindergarten, elementary, and middle school teachers (4.6%)
Sales representatives, services, wholesale and manufacturing (4.2%)
Other management occupations, except farmers and farm managers (4.1%)
Secretaries and administrative assistants (3.8%)
Retail sales workers, except cashiers (3.6%)
Sales representatives, services, wholesale and manufacturing (6.0%)
Other sales and related occupations, including supervisors (5.7%)
Electrical equipment mechanics and other installation, maintenance, and repair workers, including supervisors (5.1%)
Other management occupations, except farmers and farm managers (5.1%)
Driver/sales workers and truck drivers (4.5%)
Computer specialists (4.3%)
Retail sales workers, except cashiers (3.6%)
Preschool, kindergarten, elementary, and middle school teachers (8.1%)
Other office and administrative support workers, including supervisors (8.1%)
Secretaries and administrative assistants (7.7%)
Other sales and related occupations, including supervisors (6.0%)
Registered nurses (5.7%)
Information and record clerks, except customer service representatives (4.7%)
Retail sales workers, except cashiers (3.6%)
Tornado activity:
Bryant-area historical tornado activity is slightly above Arkansas state average. It is 141% greater than the overall U.S. average.
On 3/1/1997, a category F4 (max. wind speeds 207-260 mph) tornado 6.7 miles away from the Bryant city center killed 10 people and injured 40 people .
On 3/1/1997, a category F4 tornado 8.1 miles away from the city center killed 5 people and injured 180 people .
Earthquake activity:
Bryant-area historical earthquake activity is significantly above Arkansas state average. It is 478% greater than the overall U.S. average. On 11/6/2011 at 03:53:10, a magnitude 5.7 (5.7 MW, Depth: 3.2 mi, Class: Moderate, Intensity: VI - VII) earthquake occurred 250.1 miles away from the city center On 1/21/1982 at 00:33:54, a magnitude 4.7 (4.5 MB, 4.7 LG, 4.5 LG, Class: Light, Intensity: IV - V) earthquake occurred 41.7 miles away from Bryant center On 5/4/2001 at 06:42:12, a magnitude 4.7 (4.2 MB, 4.7 LG, 4.5 LG) earthquake occurred 44.3 miles away from Bryant center On 2/28/2011 at 05:00:50, a magnitude 4.7 (4.7 MW, Depth: 2.0 mi) earthquake occurred 46.0 miles away from Bryant center On 9/3/2016 at 12:02:44, a magnitude 5.8 (5.8 MW, Depth: 3.5 mi) earthquake occurred 279.4 miles away from Bryant center On 3/25/1976 at 00:41:20, a magnitude 5.0 (4.9 MB, 5.0 LG) earthquake occurred 141.4 miles away from Bryant center Magnitude types: regional Lg-wave magnitude (LG), body-wave magnitude (MB), moment magnitude (MW) Natural disasters: The number of natural disasters in Saline County (17) is near the US average (15).Major Disasters (Presidential) Declared: 12Emergencies Declared: 3Storms: 11, Floods: 9, Tornadoes: 8, Winter Storms: 4, Hurricanes: 2, Winds: 2, Other: 1 (Note: some incidents may be assigned to more than one category). Hospitals and medical centers in Bryant: SOUTHERN TRACE REHABILITATION AND CARE CENTER (22515 I 30)
Other hospitals and medical centers near Bryant: RIVENDELL BEHAVIORAL HEALTH SERVICES OF ARKANSAS (Hospital, about 3 miles away; BENTON, AR)
RIDGEWOOD HEALTH AND REHAB (Nursing Home, about 4 miles away; BENTON, AR)
STONEYBROOK HEALTH AND REHABILITATION CENTER (Nursing Home, about 4 miles away; BENTON, AR)
FMCNA - BENTON (Dialysis Facility, about 6 miles away; BENTON, AR)
SALINE COUNTY HEALTH UNIT (Home Health Center, about 6 miles away; BENTON, AR)
HH SVCS OF SALINE MEMORIAL (Home Health Center, about 7 miles away; BENTON, AR)
HH AND HOSPICE SRVC OF SALINE (Hospital, about 7 miles away; BENTON, AR)
Amtrak station near Bryant: 16 miles: LITTLE ROCK (MARKHAM & VICTORY STS.) Services: ticket office, fully wheelchair accessible, enclosed waiting area, public restrooms, vending machines, free short-term parking, free long-term parking, call for taxi service.
Colleges/universities with over 2000 students nearest to Bryant:
University of Arkansas at Little Rock (about 12 miles; Little Rock, AR ; Full-time enrollment: 9,227)
Pulaski Technical College (about 16 miles; North Little Rock, AR ; FT enrollment: 8,396)
University of Central Arkansas (about 33 miles; Conway, AR ; FT enrollment: 9,972)
National Park Community College (about 37 miles; Hot Springs, AR ; FT enrollment: 2,237)
University of Arkansas at Pine Bluff (about 38 miles; Pine Bluff, AR ; FT enrollment: 2,558)
Arkansas State University-Beebe (about 47 miles; Beebe, AR ; FT enrollment: 3,387)
Henderson State University (about 47 miles; Arkadelphia, AR ; FT enrollment: 3,528)
Public high school in Bryant:
Public elementary/middle schools in Bryant:
Private elementary/middle school in Bryant: FAMILY CHURCH ACADEMY Students: 171, Location: 21815 I-30 S, Grades: PK-7)
See full list of schools located in Bryant
Notable locations in Bryant: (A) , Bryant Fire Department Station 1 (B) , Bryant Fire Department Station 2 (C) , Bryant Fire and Rescue Station 3 (D) , Bryant Branch Saline County Public Library (E) , Bryant City Hall (F) . Display/hide their locations on the map
Churches in Bryant include: (A) , Abundant Life Center Assembly of God Church (B) , Bryant Church of Christ (C) , First Baptist Church (D) , First Southern Baptist Church (E) , First United Methodist Church (F) , Grace Missionary Baptist Church (G) , Indian Springs Baptist Church (H) . Display/hide their locations on the map
Cemetery: (1) . Display/hide its location on the map
Reservoirs: (A) , Caldwell Lake (B) . Display/hide their locations on the map
Parks in Bryant include: (1) , Wilbur Mills Park (2) , Bryant Stadium (3) . Display/hide their locations on the map
Tourist attractions:
Hotels:
Court:
Birthplace of: Travis Wood - Baseball player, Jack McAdams - Baseball player.
Saline County has a predicted average indoor radon screening level less than 2 pCi/L (pico curies per liter) - Low Potential Drinking water stations with addresses in Bryant and their reported violations in the past:
BRYANT WATERWORKS (Population served: 14,635, Purch surface water):
Past health violations:
MCL, Monthly (TCR) - In JUL-2010, Contaminant: Coliform. Follow-up actions: St Public Notif requested (SEP-03-2010), St Compliance achieved (3 times from OCT-18-2010 to AUG-29-2011)
MCL, Average - Between JAN-2008 and MAR-2008, Contaminant: TTHM. Follow-up actions: St Public Notif requested (MAY-05-2008), St Compliance achieved (MAR-12-2009)
MCL, Monthly (TCR) - In JUN-2007, Contaminant: Coliform. Follow-up actions: St Public Notif requested (AUG-10-2007)
Past monitoring violations:
2 minor monitoring violations
Average household size: This city:
2.5 peopleArkansas:
2.5 people
Percentage of family households: This city:
68.9%Whole state:
67.6%
Percentage of households with unmarried partners: This city:
4.2%Whole state:
5.7%
Likely homosexual households (counted as self-reported same-sex unmarried-partner households)
Lesbian couples: 0.2% of all households Gay men: 0.2% of all households
People in group quarters in Bryant in 2010:
99 people in nursing facilities/skilled-nursing facilities
93 people in correctional facilities intended for juveniles
10 people in residential treatment centers for adults
people in nursing homes in 2000people in homes for the mentally retarded in 2000Banks with most branches in Bryant (2011 data):
First Security Bank: Bryant Branch, Bryant Branch, The Union Bank Of Bryant Branch. Info updated 2009/06/12: Bank assets: $4,011.4 mil, Deposits: $3,167.1 mil, headquarters in Searcy, AR, positive income , Commercial Lending Specialization, 73 total offices , Holding Company: First Security Bancorp
Heartland Bank: at 4937 Highway 5 North, branch established on 1933/01/01. Info updated 2011/11/28: Bank assets: $186.0 mil, Deposits: $145.3 mil, local headquarters , positive income , Commercial Lending Specialization, 4 total offices , Holding Company: Rock Bancshares, Inc.
Summit Bank: Bryant Branch at 6110 Highway 5 North, branch established on 2008/08/11. Info updated 2011/02/25: Bank assets: $1,129.7 mil, Deposits: $946.3 mil, headquarters in Arkadelphia, AR, positive income , Commercial Lending Specialization, 25 total offices , Holding Company: Summit Bancorp, Inc.
Arvest Bank: Bryant Branch at 3217 North Reynolds Road, branch established on 2001/10/08. Info updated 2010/11/29: Bank assets: $12,520.8 mil, Deposits: $10,446.2 mil, headquarters in Fayetteville, AR, positive income , Commercial Lending Specialization, 241 total offices , Holding Company: Arvest Bank Group, Inc.
The Malvern National Bank: Bryant Branch at 4430 Highway 5 North, branch established on 1999/08/23. Info updated 2006/11/03: Bank assets: $470.8 mil, Deposits: $383.0 mil, headquarters in Malvern, AR, positive income , Commercial Lending Specialization, 12 total offices , Holding Company: Mnb Bancshares, Inc.
Bank of the Ozarks: Bryant Highway 5 Branch at 5910 Highway 5 North, branch established on 2003/04/28. Info updated 2011/05/03: Bank assets: $3,828.0 mil, Deposits: $2,955.2 mil, headquarters in Little Rock, AR, positive income , Commercial Lending Specialization, 115 total offices , Holding Company: Bank Of The Ozarks Inc
Iberiabank: Bryant Branch at 5111 Highway 5 North, branch established on 2003/07/07. Info updated 2011/06/08: Bank assets: $11,676.7 mil, Deposits: $9,387.9 mil, headquarters in Lafayette, LA, positive income , Commercial Lending Specialization, 187 total offices , Holding Company: Iberiabank Corporation
Merchants and Farmers Bank: Merchants And Farmers Bryant Loan Pr at 4500 Highway 5 North, Suite 6, branch established on 2011/09/06. Info updated 2006/11/03: Bank assets: $95.6 mil, Deposits: $86.3 mil, headquarters in Dumas, AR, positive income , Agricultural Specialization, 3 total offices , Holding Company: M & F Financial Corporation
Centennial Bank: Bryant Branch at 2224 N. Reynolds Rd., branch established on 2007/09/30. Info updated 2012/02/29: Bank assets: $3,588.2 mil, Deposits: $2,891.9 mil, headquarters in Conway, AR, positive income , Commercial Lending Specialization, 109 total offices , Holding Company: Home Bancshares, Inc.
3 other banks with 3 local branches
For population 15 years and over in Bryant:
Never married: 26.9%Now married: 52.5%Separated: 1.4%Widowed: 7.0%Divorced: 12.2% For population 25 years and over in Bryant:
High school or higher: 92.8%Bachelor's degree or higher: 36.2%Graduate or professional degree: 10.3%Unemployed: 2.3%Mean travel time to work (commute): 22.4 minutes
Education Gini index (Inequality in education) Here:
10.8Arkansas average:
11.4
Religion statistics for Bryant, AR (based on Saline County data)
Religion Adherents Congregations Evangelical Protestant 33,609 121 Mainline Protestant 6,680 17 Catholic 2,113 1 Black Protestant 1,081 6 Other 3 1 None 63,632 -
Source: Clifford Grammich, Kirk Hadaway, Richard Houseal, Dale E.Jones, Alexei Krindatch, Richie Stanley and Richard H.Taylor. 2012. 2010 U.S.Religion Census: Religious Congregations & Membership Study. Association of Statisticians of American Religious Bodies. Jones, Dale E., et al. 2002. Congregations and Membership in the United States 2000. Nashville, TN: Glenmary Research Center. Graphs represent county-level data
Food Environment Statistics: Number of grocery stores : 14This county :
1.46 / 10,000 pop.State :
2.02 / 10,000 pop.
Number of supercenters and club stores : 2Saline County :
0.21 / 10,000 pop.Arkansas :
0.25 / 10,000 pop.
Number of convenience stores (no gas) : 2Here :
0.21 / 10,000 pop.State :
0.59 / 10,000 pop.
Number of convenience stores (with gas) : 38Saline County :
3.96 / 10,000 pop.State :
4.94 / 10,000 pop.
Number of full-service restaurants : 47Saline County :
4.89 / 10,000 pop.Arkansas :
6.66 / 10,000 pop.
Adult diabetes rate : This county :
9.0%State :
9.8%
Low-income preschool obesity rate : This county :
13.7%State :
13.6%
Health and Nutrition: Healthy diet rate : Bryant:
49.6%Arkansas:
48.2%
Average overall health of teeth and gums : People feeling badly about themselves : Bryant:
21.9%Arkansas:
21.6%
People not drinking alcohol at all : Average hours sleeping at night : Overweight people : This city:
34.4%Arkansas:
34.0%
General health condition : Average condition of hearing : More about Health and Nutrition of Bryant, AR Residents
Local government employment and payroll (March 2022)
Function
Full-time employees
Monthly full-time payroll
Average yearly full-time wage
Part-time employees
Monthly part-time payroll
Firefighters
49 $265,838 $65,103 0 $0 Police Protection - Officers
49 $294,434 $72,106 0 $0 Parks and Recreation
17 $74,068 $52,283 36 $9,971 Streets and Highways
16 $70,171 $52,628 0 $0 Sewerage
14 $81,052 $69,473 0 $0 Water Supply
14 $65,368 $56,030 0 $0 Police - Other
13 $39,293 $36,270 0 $0 Financial Administration
11 $55,723 $60,789 0 $0 Judicial and Legal
8 $36,855 $55,283 0 $0 Other Government Administration
8 $47,789 $71,684 24 $13,594 Other and Unallocable
7 $49,627 $85,075 0 $0 Fire - Other
1 $4,105 $49,260 0 $0
Totals for Government
207 $1,084,320 $62,859 60 $23,565
Bryant government finances - Expenditure in 2021 (per resident):
Construction - Regular Highways: $1,951,000 ($90.74)
Sewerage: $1,355,000 ($63.02)Water Utilities: $1,019,000 ($47.39)Current Operations - Police Protection: $5,266,000 ($244.92)
Local Fire Protection: $4,048,000 ($188.27)Water Utilities: $3,001,000 ($139.57)Sewerage: $2,801,000 ($130.27)Parks and Recreation: $2,208,000 ($102.69)Regular Highways: $1,994,000 ($92.74)Financial Administration: $1,151,000 ($53.53)Health - Other: $516,000 ($24.00)Housing and Community Development: $426,000 ($19.81)Judicial and Legal Services: $410,000 ($19.07)Other Capital Outlay - Sewerage: $413,000 ($19.21)
Water Utilities: $349,000 ($16.23)Total Salaries and Wages: $13,929,000 ($647.83)
Water Utilities - Interest on Debt: $2,070,000 ($96.27)
Bryant government finances - Revenue in 2021 (per resident):
Charges - Sewerage: $4,099,000 ($190.64)
Parks and Recreation: $698,000 ($32.46)Miscellaneous - Fines and Forfeits: $606,000 ($28.18)
General Revenue - Other: $83,000 ($3.86)Interest Earnings: $59,000 ($2.74)Revenue - Water Utilities: $3,516,000 ($163.53)
State Intergovernmental - Health and Hospitals: $737,000 ($34.28)
Other: $100,000 ($4.65)Highways: $77,000 ($3.58)Water Utilities: $8,000 ($0.37)Tax - General Sales and Gross Receipts: $15,815,000 ($735.55)
Property: $2,412,000 ($112.18)Other License: $152,000 ($7.07)Alcoholic Beverage Sales: $34,000 ($1.58)
Bryant government finances - Debt in 2021 (per resident):
Long Term Debt - Beginning Outstanding - Unspecified Public Purpose: $51,757,000 ($2407.19)
Outstanding Unspecified Public Purpose: $50,873,000 ($2366.08)Retired Unspecified Public Purpose: $3,075,000 ($143.02)Issue, Unspecified Public Purpose: $2,191,000 ($101.90)Short Term Debt Outstanding - Beginning: $446,000 ($20.74)
End of Fiscal Year: $290,000 ($13.49)
Bryant government finances - Cash and Securities in 2021 (per resident):
Other Funds - Cash and Securities: $30,942,000 ($1439.10)
Businesses in Bryant, AR
Name Count Name Count
AT&T 2 Old Navy 1 Arby's 1 Papa John's Pizza 1 Ashley Furniture 1 Payless 1 AutoZone 1 Penske 1 Baskin-Robbins 2 Pizza Hut 1 Burger King 1 Quiznos 1 Chick-Fil-A 1 RadioShack 1 Comfort Inn 1 Ruby Tuesday 1 Cracker Barrel 1 Rue21 1 Cricket Wireless 1 SONIC Drive-In 1 Curves 1 Shoe Carnival 1 Domino's Pizza 1 Starbucks 1 FedEx 2 Subway 3 GameStop 1 Super 8 1 H&R Block 1 T-Mobile 2 Hilton 1 Taco Bell 1 Holiday Inn 1 Target 1 IHOP 1 U-Haul 1 KFC 1 UPS 5 Kohl's 1 Vans 1 La Quinta 1 Waffle House 1 Lane Bryant 1 Walgreens 1 Little Caesars Pizza 1 Walmart 1 Lowe's 1 Wendy's 1 McDonald's 1
Strongest AM radio stations in Bryant:
KGHT (880 AM; 50 kW; SHERIDAN, AR; Owner: METROPOLITAN RADIO GROUP, INC.)
KAAY (1090 AM; 50 kW; LITTLE ROCK, AR; Owner: CITADEL BROADCASTING COMPANY)
KMTL (760 AM; daytime; 10 kW; SHERWOOD, AR; Owner: GEORGE V. DOMERESE)
KITA (1440 AM; 5 kW; LITTLE ROCK, AR; Owner: KITA, INCORPORATED)
KARN (920 AM; 5 kW; LITTLE ROCK, AR; Owner: CITADEL BROADCASTING COMPANY)
KLRG (1150 AM; 5 kW; NORTH LITTLE ROCK, AR; Owner: ARKANSAS RADIO CORPORATION)
KBHS (590 AM; 5 kW; HOT SPRINGS, AR; Owner: J & A, INC.)
KEWI (690 AM; 0 kW; BENTON, AR; Owner: LANDERS BROADCASTING COMPANY, INC.)
KDXE (1380 AM; 5 kW; NORTH LITTLE ROCK, AR; Owner: RADIO DISNEY AM 1380, LLC)
KLIH (1250 AM; 2 kW; LITTLE ROCK, AR; Owner: CITADEL BROADCASTING COMPANY)
KJBN (1050 AM; 1 kW; LITTLE ROCK, AR; Owner: JOSHUA MINISTRIES & COMM.DEVELOP COR)
WCRV (640 AM; 50 kW; COLLIERVILLE, TN; Owner: BOTT BROADCASTING COMPANY/TENNESSEE)
KXOW (1420 AM; 5 kW; HOT SPRINGS, AR)
Strongest FM radio stations in Bryant:
KHKN (106.7 FM; BENTON, AR; Owner: CLEAR CHANNEL BROADCASTING LICENSES, INC.)
KSSN (95.7 FM; LITTLE ROCK, AR; Owner: CLEAR CHANNEL BROADCASTING LICENSES, INC.)
KKPT (94.1 FM; LITTLE ROCK, AR; Owner: SIGNAL MEDIA OF ARKANSAS, INC.)
KABZ (103.7 FM; LITTLE ROCK, AR; Owner: SIGNAL MEDIA OF ARKANSAS, INC)
KKZR (93.3 FM; BRYANT, AR; Owner: ABG ARKANSAS, LLC)
KURB (98.5 FM; LITTLE ROCK, AR; Owner: CITADEL BROADCASTING COMPANY)
KMSX (94.9 FM; MAUMELLE, AR; Owner: CLEAR CHANNEL BROADCASTING LICENSES, INC.)
KMJX (105.1 FM; CONWAY, AR; Owner: CLEAR CHANNEL BROADCASTING LICENSES, INC.)
KDJE (100.3 FM; JACKSONVILLE, AR; Owner: CLEAR CHANNEL BROADCASTING LICENSES, INC.)
KUAR (89.1 FM; LITTLE ROCK, AR; Owner: BD. OF TRUSTEES OF UNIV. OF ARKANSAS)
KABF (88.3 FM; LITTLE ROCK, AR; Owner: ARKANSAS BROADCASTING FOUNDATION INC)
KLAL (107.7 FM; WRIGHTSVILLE, AR; Owner: CITADEL BROADCASTING COMPANY)
KIPR (92.3 FM; PINE BLUFF, AR; Owner: CITADEL BROADCASTING COMPANY)
KVLO (102.9 FM; SHERIDAN, AR; Owner: CITADEL BROADCASTING COMPANY)
KOKY (102.1 FM; SHERWOOD, AR; Owner: CITADEL BROADCASTING COMPANY)
KSBC (90.1 FM; HOT SPRINGS, AR; Owner: CENTRAL ARKANSAS CHRISTIAN BROADCASTING, INC.)
KLRE-FM (90.5 FM; LITTLE ROCK, AR; Owner: LITTLE ROCK SCHOOL DISTRICT)
KHTE-FM (96.5 FM; ENGLAND, AR; Owner: ABG ARKANSAS, LLC)
KLAZ (105.9 FM; HOT SPRINGS, AR; Owner: NOALMARK BROADCASTING CORPORATION)
KWLR (96.9 FM; MAUMELLE, AR; Owner: FLINN BROADCASTING CORPORATION)
TV broadcast stations around Bryant:
KATV (Channel 7; LITTLE ROCK, AR; Owner: KATV, LLC)
KTHV (Channel 11; LITTLE ROCK, AR; Owner: ARKANSAS TELEVISION COMPANY)
KETS (Channel 2; LITTLE ROCK, AR; Owner: ARKANSAS EDUCATIONAL TELEVISION COMMISSION)
KLRT-TV (Channel 16; LITTLE ROCK, AR; Owner: CLEAR CHANNEL BROADCASTING LICENSES, INC.)
KASN (Channel 38; PINE BLUFF, AR; Owner: CLEAR CHANNEL BROADCASTING LICENSES, INC.)
KARK-TV (Channel 4; LITTLE ROCK, AR; Owner: KARK-TV, INC.)
KWBF (Channel 42; LITTLE ROCK, AR; Owner: RIVER CITY BROADCASTING, INC.)
KKYK-LP (Channel 22; LITTLE ROCK, AR; Owner: ARKANSAS 49, INC.)
KHTE-LP (Channel 44; LITTLE ROCK, AR; Owner: EQUITY BROADCASTING CORPORATION)
KLRA-LP (Channel 58; LITTLE ROCK, AR; Owner: ARKANSAS MEDIA, L.L.C.)
K27FF (Channel 27; EL DORADO, AR; Owner: MS COMMUNICATIONS, LLC)
KHUG-LP (Channel 14; LITTLE ROCK, AR; Owner: LITTLE ROCK TV-14, L.L.C.)
K34FH (Channel 34; LITTLE ROCK, AR; Owner: NATIONAL MINORITY T.V., INC.)
KVTN (Channel 25; PINE BLUFF, AR; Owner: AGAPE CHURCH, INC.)
KJLR-LP (Channel 28; LITTLE ROCK, ETC., AR; Owner: COWSERT FAMILY, L.L.C.)
K55GE (Channel 55; LITTLE ROCK, AR; Owner: THREE ANGELS BROADCASTING NETWORK INC.)
KZJG-LP (Channel 13; LITTLE ROCK, ETC., AR; Owner: COWSERT FAMILY, L.L.C.)
KWBF-LP (Channel 5; SHERIDAN, AR; Owner: ARKANSAS MEDIA, L.L.C.)
National Bridge Inventory (NBI) Statistics 40 Number of bridges259ft / 78.8m Total length $2,278,000 Total costs772,658 Total average daily traffic37,672 Total average daily truck traffic
New bridges - historical statistics
1 1950-1959 1 1960-1969 3 1970-1979 2 1980-1989 2 1990-1999 8 2000-2009 9 2010-2019
See full National Bridge Inventory statistics for Bryant, AR
FCC Registered Antenna Towers: 47 (
See the full list of FCC Registered Antenna Towers in Bryant )
FCC Registered Broadcast Land Mobile Towers: 6
Lat: 34.585111 Lon: -92.509472, Call Sign: WNXH499, Assigned Frequencies: 461.150 MHz, 462.237 MHz, 462.387 MHz, Grant Date: 08/16/2001, Expiration Date: 07/24/2011, Cancellation Date: 09/24/2011, Certifier: Timothy A Fox, Registrant: Pei Communications, 6007 S 31st Street, Ft Smith, AR 72908, Phone: (479) 646-6141, Fax: (479) 646-6142Lat: 34.622500 Lon: -92.498472, Call Sign: WQBG645, Assigned Frequencies: 469.012 MHz, 469.212 MHz, 469.037 MHz, 469.237 MHz, 469.062 MHz, 469.262 MHz, 469.087 MHz, 469.287 MHz, Grant Date: 09/30/2004, Expiration Date: 09/30/2014, Cancellation Date: 12/06/2014, Certifier: Robert Mosesso, Registrant: R.F. Technologies Inc., 542 S Prairie Street, Bethalto, IL 62010, Phone: (800) 598-2370, Fax: (618) 377-1320, Email:
Saline County Regional Airport, 1100 Hill (Lat: 34.587333 Lon: -92.484222), Type: Bant, Structure height: 6.5 m, Overall height: 6.7 m, Call Sign: WQRF754, Assigned Frequencies: 453.062 MHz, Grant Date: 05/03/2013, Expiration Date: 05/03/2023, Cancellation Date: 07/15/2023, Certifier: Chad Lowry, Registrant: All Weather Inc, 1165 National Dr., Sacremanto, CA 95834, Phone: (916) 928-6748, Email:
Lat: 34.585111 Lon: -92.509472, Call Sign: WQSE953, Assigned Frequencies: 462.237 MHz, 462.387 MHz, Grant Date: 09/11/2013, Expiration Date: 09/11/2023, Cancellation Date: 11/11/2023, Certifier: Jason Rogers, Registrant: Washington Radio Reports, 1588 Fairfield Road Ste 7, Gettysburg, PA 17325, Phone: (717) 334-0668, Fax: (717) 334-6440, Email:
Lat: 34.622389 Lon: -92.489083, Call Sign: WQTR245, Assigned Frequencies: 451.187 MHz, 451.287 MHz, 451.487 MHz, 452.862 MHz, 457.712 MHz, Grant Date: 03/02/2024, Expiration Date: 03/26/2034, Certifier: Shawn Jackson, Registrant: Mj Communications, North Little Rock, AR 72231, Phone: (501) 945-9307, Fax: (501) 945-0333, Email:
1901 Encore Way (Lat: 34.612222 Lon: -92.520833), Type: Mast, Structure height: 18.3 m, Overall height: 22 m, Call Sign: WRKJ946, Assigned Frequencies: 155.340 MHz, Grant Date: 01/13/2021, Expiration Date: 01/13/2031, Certifier: Diane Hughes, Registrant: Arkansas Valley Communications, 220 Smokey Lane, North Little Rock, AR 72117, Phone: (501) 904-8790, Email:
FCC Registered Microwave Towers: 2
STATION, 0.5 Mi S Of (Lat: 34.583694 Lon: -92.499861), Overall height: 20.7 m, Call Sign: WNTL617, Assigned Frequencies: 952.781 MHz, 928.781 MHz, Grant Date: 12/14/2011, Expiration Date: 01/01/2022, Cancellation Date: 01/13/2021, Registrant: Mona Lee & Associates, LLC, 3730 Kirby Dr, Suite 1200 Pmb 165, Houston, TX 77098, Phone: (832) 850-7646, Email:
AR0013BRYANT, 1010 N. Reynolds Rd (Lat: 34.604306 Lon: -92.490389), Type: Tower, Structure height: 49.4 m, Call Sign: WQLW377, Assigned Frequencies: 21830.0 MHz, Grant Date: 05/10/2010, Expiration Date: 05/10/2020, Cancellation Date: 02/16/2012, Certifier: Dan Mieszala, Registrant: Open Range Communications Inc., 6430 S. Fiddlers Green Circle, Suite 500, Greenwood Village, CO 80111, Phone: (303) 376-2112, Fax: (303) 376-2109, Email:
FCC Registered Maritime Coast & Aviation Ground Towers: 2
1100 Hill Farm Road (Lat: 34.588056 Lon: -92.482222), Type: Pole, Structure height: 3 m, Call Sign: WRMV373, Assigned Frequencies: 119.600 MHz, 118.250 MHz, Grant Date: 06/09/2021, Expiration Date: 06/20/2021, Cancellation Date: 08/21/2021, Certifier: James Crum, Registrant: Air Boss, 18925 W Narramore Rd, Buckeye, AZ 85326, Phone: (229) 834-2599, Email:
1100 Hill Farm Rd (Lat: 34.588056 Lon: -92.482222), Type: Pole, Structure height: 3 m, Call Sign: WRTJ440, Assigned Frequencies: 119.550 MHz, 118.450 MHz, Grant Date: 06/23/2022, Expiration Date: 06/25/2022, Cancellation Date: 08/27/2022, Certifier: Aj Ambort, Registrant: Saline County Reg Airport Air Boss, 7601 N 181st Ave, Waddell, AZ 85355, Phone: (229) 834-2599, Email:
FCC Registered Amateur Radio Licenses: 87 (
See the full list of FCC Registered Amateur Radio Licenses in Bryant )
FAA Registered Aircraft: 20 (
See the full list of FAA Registered Aircraft in Bryant )
Home Mortgage Disclosure Act Aggregated Statistics For Year 2009(Based on 3 partial tracts) A) FHA, FSA/RHS & VA B) Conventional C) Refinancings D) Home Improvement Loans E) Loans on Dwellings For 5+ Families F) Non-occupant Loans on G) Loans On Manufactured Number Average Value Number Average Value Number Average Value Number Average Value Number Average Value Number Average Value Number Average Value
LOANS ORIGINATED 95 $154,686 45 $166,587 138 $153,966 13 $52,629 1 $7,843,600 16 $133,115 4 $36,718 APPLICATIONS APPROVED, NOT ACCEPTED 2 $185,730 2 $121,960 6 $147,795 2 $11,325 0 $0 0 $0 1 $78,520 APPLICATIONS DENIED 13 $156,815 5 $101,470 43 $150,677 8 $50,274 0 $0 2 $55,720 3 $50,917 APPLICATIONS WITHDRAWN 6 $169,502 5 $137,706 35 $170,533 2 $128,900 0 $0 0 $0 0 $0 FILES CLOSED FOR INCOMPLETENESS 3 $134,387 1 $312,450 7 $240,293 0 $0 0 $0 0 $0 0 $0
Aggregated Statistics For Year 2008(Based on 3 partial tracts) A) FHA, FSA/RHS & VA B) Conventional C) Refinancings D) Home Improvement Loans F) Non-occupant Loans on G) Loans On Manufactured Number Average Value Number Average Value Number Average Value Number Average Value Number Average Value Number Average Value
LOANS ORIGINATED 66 $144,209 75 $162,273 90 $134,470 21 $37,497 28 $103,557 3 $56,050 APPLICATIONS APPROVED, NOT ACCEPTED 3 $158,720 6 $93,880 7 $129,856 2 $10,180 1 $49,450 3 $54,460 APPLICATIONS DENIED 10 $141,613 14 $89,887 28 $150,298 9 $22,952 4 $75,200 6 $22,677 APPLICATIONS WITHDRAWN 6 $139,283 7 $265,166 18 $166,275 1 $27,200 2 $81,595 0 $0 FILES CLOSED FOR INCOMPLETENESS 2 $135,125 2 $165,780 3 $154,210 0 $0 0 $0 0 $0
Aggregated Statistics For Year 2007(Based on 3 partial tracts) A) FHA, FSA/RHS & VA B) Conventional C) Refinancings D) Home Improvement Loans F) Non-occupant Loans on G) Loans On Manufactured Number Average Value Number Average Value Number Average Value Number Average Value Number Average Value Number Average Value
LOANS ORIGINATED 28 $142,639 130 $139,432 83 $124,713 26 $36,497 27 $101,416 7 $51,340 APPLICATIONS APPROVED, NOT ACCEPTED 1 $105,410 14 $128,926 10 $116,633 4 $49,880 2 $80,630 4 $50,620 APPLICATIONS DENIED 2 $114,640 20 $126,693 31 $137,025 13 $32,856 6 $112,310 6 $30,997 APPLICATIONS WITHDRAWN 1 $137,900 7 $155,450 15 $146,476 2 $53,580 1 $128,690 1 $87,280 FILES CLOSED FOR INCOMPLETENESS 0 $0 4 $172,715 7 $130,014 1 $24,540 1 $79,730 0 $0
Aggregated Statistics For Year 2006(Based on 3 partial tracts) A) FHA, FSA/RHS & VA B) Conventional C) Refinancings D) Home Improvement Loans F) Non-occupant Loans on G) Loans On Manufactured Number Average Value Number Average Value Number Average Value Number Average Value Number Average Value Number Average Value
LOANS ORIGINATED 31 $129,427 127 $121,817 81 $119,989 27 $37,477 18 $83,528 11 $53,295 APPLICATIONS APPROVED, NOT ACCEPTED 0 $0 12 $131,885 21 $116,469 3 $20,787 3 $96,970 4 $54,198 APPLICATIONS DENIED 5 $84,506 31 $106,165 49 $130,213 19 $21,582 8 $100,182 15 $54,781 APPLICATIONS WITHDRAWN 2 $98,520 11 $117,155 30 $148,024 2 $77,975 2 $81,180 1 $24,330 FILES CLOSED FOR INCOMPLETENESS 0 $0 5 $93,372 7 $119,683 0 $0 1 $100,740 0 $0
Aggregated Statistics For Year 2005(Based on 3 partial tracts) A) FHA, FSA/RHS & VA B) Conventional C) Refinancings D) Home Improvement Loans F) Non-occupant Loans on G) Loans On Manufactured Number Average Value Number Average Value Number Average Value Number Average Value Number Average Value Number Average Value
LOANS ORIGINATED 28 $114,155 136 $109,215 95 $104,057 27 $32,234 16 $73,113 9 $40,686 APPLICATIONS APPROVED, NOT ACCEPTED 3 $82,783 21 $103,445 14 $108,028 3 $28,247 2 $99,675 7 $49,614 APPLICATIONS DENIED 3 $61,050 32 $79,884 42 $109,638 13 $30,863 4 $151,120 18 $50,066 APPLICATIONS WITHDRAWN 2 $121,380 13 $139,278 38 $135,832 5 $182,444 2 $104,065 0 $0 FILES CLOSED FOR INCOMPLETENESS 0 $0 4 $113,965 5 $129,338 0 $0 1 $49,080 0 $0
Aggregated Statistics For Year 2004(Based on 3 partial tracts) A) FHA, FSA/RHS & VA B) Conventional C) Refinancings D) Home Improvement Loans E) Loans on Dwellings For 5+ Families F) Non-occupant Loans on G) Loans On Manufactured Number Average Value Number Average Value Number Average Value Number Average Value Number Average Value Number Average Value Number Average Value
LOANS ORIGINATED 38 $111,331 96 $119,574 104 $108,689 23 $27,336 1 $9,413,220 16 $104,128 10 $35,054 APPLICATIONS APPROVED, NOT ACCEPTED 1 $116,140 11 $89,435 17 $111,981 2 $51,465 0 $0 1 $97,460 5 $40,028 APPLICATIONS DENIED 6 $97,992 26 $78,312 38 $103,730 13 $24,538 0 $0 4 $90,698 18 $41,734 APPLICATIONS WITHDRAWN 2 $110,080 10 $138,183 37 $112,817 1 $37,490 0 $0 1 $139,540 2 $27,175 FILES CLOSED FOR INCOMPLETENESS 1 $121,290 1 $155,950 6 $115,352 1 $12,950 0 $0 1 $20,030 0 $0
Aggregated Statistics For Year 2003(Based on 3 partial tracts) A) FHA, FSA/RHS & VA B) Conventional C) Refinancings D) Home Improvement Loans F) Non-occupant Loans on Number Average Value Number Average Value Number Average Value Number Average Value Number Average Value
LOANS ORIGINATED 39 $106,827 89 $112,610 198 $105,833 16 $15,116 18 $76,367 APPLICATIONS APPROVED, NOT ACCEPTED 2 $69,355 11 $108,076 20 $93,054 1 $28,460 2 $69,770 APPLICATIONS DENIED 3 $105,727 14 $91,161 49 $96,540 7 $20,009 2 $84,845 APPLICATIONS WITHDRAWN 2 $96,695 7 $104,516 29 $105,988 1 $23,070 2 $83,635 FILES CLOSED FOR INCOMPLETENESS 2 $80,170 1 $145,260 8 $101,239 0 $0 0 $0
Aggregated Statistics For Year 2002(Based on 2 partial tracts) A) FHA, FSA/RHS & VA B) Conventional C) Refinancings D) Home Improvement Loans F) Non-occupant Loans on Number Average Value Number Average Value Number Average Value Number Average Value Number Average Value
LOANS ORIGINATED 25 $109,470 53 $96,629 85 $96,625 12 $13,223 14 $76,149 APPLICATIONS APPROVED, NOT ACCEPTED 0 $0 6 $60,958 10 $93,612 1 $19,000 0 $0 APPLICATIONS DENIED 1 $89,630 21 $49,017 30 $75,361 6 $14,065 7 $61,539 APPLICATIONS WITHDRAWN 1 $174,870 4 $112,528 14 $93,321 1 $9,980 0 $0 FILES CLOSED FOR INCOMPLETENESS 0 $0 2 $108,290 4 $101,765 0 $0 0 $0
Aggregated Statistics For Year 2001(Based on 2 partial tracts) A) FHA, FSA/RHS & VA B) Conventional C) Refinancings D) Home Improvement Loans F) Non-occupant Loans on Number Average Value Number Average Value Number Average Value Number Average Value Number Average Value
LOANS ORIGINATED 27 $94,689 43 $96,228 62 $87,533 12 $16,452 7 $76,074 APPLICATIONS APPROVED, NOT ACCEPTED 0 $0 8 $59,455 5 $73,508 0 $0 0 $0 APPLICATIONS DENIED 2 $110,135 24 $49,267 27 $71,193 5 $11,512 1 $30,260 APPLICATIONS WITHDRAWN 3 $91,247 5 $103,224 13 $75,006 1 $42,690 1 $80,920 FILES CLOSED FOR INCOMPLETENESS 0 $0 1 $176,160 2 $58,620 0 $0 0 $0
Aggregated Statistics For Year 2000(Based on 2 partial tracts) A) FHA, FSA/RHS & VA B) Conventional C) Refinancings D) Home Improvement Loans F) Non-occupant Loans on Number Average Value Number Average Value Number Average Value Number Average Value Number Average Value
LOANS ORIGINATED 20 $93,444 45 $73,708 17 $80,226 16 $18,253 6 $54,310 APPLICATIONS APPROVED, NOT ACCEPTED 2 $48,295 12 $45,505 2 $101,055 2 $13,215 0 $0 APPLICATIONS DENIED 3 $91,853 39 $47,841 22 $65,077 10 $16,982 3 $37,903 APPLICATIONS WITHDRAWN 3 $62,343 5 $84,696 11 $67,212 1 $25,550 1 $39,010 FILES CLOSED FOR INCOMPLETENESS 1 $71,830 1 $66,070 3 $83,623 0 $0 0 $0
Aggregated Statistics For Year 1999(Based on 3 partial tracts) A) FHA, FSA/RHS & VA B) Conventional C) Refinancings D) Home Improvement Loans F) Non-occupant Loans on Number Average Value Number Average Value Number Average Value Number Average Value Number Average Value
LOANS ORIGINATED 31 $85,851 72 $80,087 54 $76,788 22 $12,489 7 $54,563 APPLICATIONS APPROVED, NOT ACCEPTED 0 $0 24 $42,877 9 $59,587 2 $13,060 1 $61,810 APPLICATIONS DENIED 4 $72,930 66 $46,648 30 $60,841 11 $13,599 4 $49,062 APPLICATIONS WITHDRAWN 2 $73,000 6 $62,370 14 $69,204 2 $56,635 1 $16,320 FILES CLOSED FOR INCOMPLETENESS 0 $0 1 $103,040 5 $73,214 0 $0 0 $0
Detailed HMDA statistics for the following Tracts:
0101.03
, 0104.04 , 0105.10
Private Mortgage Insurance Companies Aggregated Statistics For Year 2009(Based on 3 partial tracts) A) Conventional B) Refinancings Number Average Value Number Average Value
LOANS ORIGINATED 8 $197,154 10 $202,945 APPLICATIONS APPROVED, NOT ACCEPTED 2 $134,890 1 $290,210 APPLICATIONS DENIED 0 $0 2 $302,055 APPLICATIONS WITHDRAWN 0 $0 0 $0 FILES CLOSED FOR INCOMPLETENESS 0 $0 0 $0
Aggregated Statistics For Year 2008(Based on 3 partial tracts) A) Conventional B) Refinancings C) Non-occupant Loans on Number Average Value Number Average Value Number Average Value
LOANS ORIGINATED 32 $177,028 13 $178,117 1 $172,990 APPLICATIONS APPROVED, NOT ACCEPTED 5 $199,362 6 $189,450 0 $0 APPLICATIONS DENIED 1 $129,770 0 $0 0 $0 APPLICATIONS WITHDRAWN 0 $0 1 $98,160 0 $0 FILES CLOSED FOR INCOMPLETENESS 1 $189,030 0 $0 0 $0
Aggregated Statistics For Year 2007(Based on 3 partial tracts) A) Conventional B) Refinancings C) Non-occupant Loans on Number Average Value Number Average Value Number Average Value
LOANS ORIGINATED 49 $157,456 17 $172,092 4 $105,995 APPLICATIONS APPROVED, NOT ACCEPTED 8 $167,505 4 $180,400 1 $65,380 APPLICATIONS DENIED 1 $190,700 0 $0 0 $0 APPLICATIONS WITHDRAWN 3 $221,663 3 $147,237 1 $65,380 FILES CLOSED FOR INCOMPLETENESS 0 $0 0 $0 0 $0
Aggregated Statistics For Year 2006(Based on 3 partial tracts) A) Conventional B) Refinancings C) Non-occupant Loans on Number Average Value Number Average Value Number Average Value
LOANS ORIGINATED 31 $132,396 13 $156,332 2 $111,585 APPLICATIONS APPROVED, NOT ACCEPTED 2 $164,065 2 $209,585 0 $0 APPLICATIONS DENIED 0 $0 0 $0 0 $0 APPLICATIONS WITHDRAWN 1 $192,930 2 $141,405 0 $0 FILES CLOSED FOR INCOMPLETENESS 0 $0 0 $0 0 $0
Aggregated Statistics For Year 2005(Based on 3 partial tracts) A) Conventional B) Refinancings C) Non-occupant Loans on Number Average Value Number Average Value Number Average Value
LOANS ORIGINATED 23 $143,287 15 $137,511 2 $90,140 APPLICATIONS APPROVED, NOT ACCEPTED 4 $133,508 5 $109,726 0 $0 APPLICATIONS DENIED 0 $0 0 $0 0 $0 APPLICATIONS WITHDRAWN 1 $117,380 3 $164,963 1 $201,990 FILES CLOSED FOR INCOMPLETENESS 0 $0 0 $0 0 $0
Aggregated Statistics For Year 2004(Based on 3 partial tracts) A) Conventional B) Refinancings C) Non-occupant Loans on Number Average Value Number Average Value Number Average Value
LOANS ORIGINATED 28 $129,780 17 $113,009 3 $118,107 APPLICATIONS APPROVED, NOT ACCEPTED 4 $166,425 3 $119,427 0 $0 APPLICATIONS DENIED 0 $0 0 $0 0 $0 APPLICATIONS WITHDRAWN 2 $153,280 4 $139,888 0 $0 FILES CLOSED FOR INCOMPLETENESS 4 $119,340 0 $0 0 $0
Aggregated Statistics For Year 2003(Based on 3 partial tracts) A) Conventional B) Refinancings C) Non-occupant Loans on Number Average Value Number Average Value Number Average Value
LOANS ORIGINATED 42 $134,831 49 $119,059 4 $84,588 APPLICATIONS APPROVED, NOT ACCEPTED 1 $142,330 4 $129,135 0 $0 APPLICATIONS DENIED 0 $0 0 $0 0 $0 APPLICATIONS WITHDRAWN 4 $150,932 4 $109,128 1 $84,100 FILES CLOSED FOR INCOMPLETENESS 0 $0 0 $0 0 $0
Aggregated Statistics For Year 2002(Based on 2 partial tracts) A) Conventional B) Refinancings C) Non-occupant Loans on Number Average Value Number Average Value Number Average Value
LOANS ORIGINATED 18 $115,463 12 $117,198 3 $58,497 APPLICATIONS APPROVED, NOT ACCEPTED 0 $0 1 $133,770 0 $0 APPLICATIONS DENIED 0 $0 0 $0 0 $0 APPLICATIONS WITHDRAWN 1 $46,090 1 $89,860 0 $0 FILES CLOSED FOR INCOMPLETENESS 0 $0 0 $0 0 $0
Aggregated Statistics For Year 2001(Based on 2 partial tracts) A) Conventional B) Refinancings C) Non-occupant Loans on Number Average Value Number Average Value Number Average Value
LOANS ORIGINATED 14 $128,339 10 $111,942 1 $101,820 APPLICATIONS APPROVED, NOT ACCEPTED 2 $73,625 2 $125,765 0 $0 APPLICATIONS DENIED 0 $0 0 $0 0 $0 APPLICATIONS WITHDRAWN 0 $0 0 $0 0 $0 FILES CLOSED FOR INCOMPLETENESS 0 $0 0 $0 0 $0
Aggregated Statistics For Year 2000(Based on 2 partial tracts) A) Conventional B) Refinancings Number Average Value Number Average Value
LOANS ORIGINATED 11 $113,220 2 $117,635 APPLICATIONS APPROVED, NOT ACCEPTED 1 $64,990 1 $88,790 APPLICATIONS DENIED 0 $0 0 $0 APPLICATIONS WITHDRAWN 0 $0 0 $0 FILES CLOSED FOR INCOMPLETENESS 0 $0 0 $0
Aggregated Statistics For Year 1999(Based on 3 partial tracts) A) Conventional B) Refinancings Number Average Value Number Average Value
LOANS ORIGINATED 17 $121,162 6 $95,982 APPLICATIONS APPROVED, NOT ACCEPTED 0 $0 1 $121,510 APPLICATIONS DENIED 1 $71,020 0 $0 APPLICATIONS WITHDRAWN 1 $67,150 0 $0 FILES CLOSED FOR INCOMPLETENESS 0 $0 0 $0
Detailed PMIC statistics for the following Tracts:
0101.03
, 0104.04 , 0105.10 Fire-safe hotels and motels in Bryant, Arkansas:
Country Inn & Suites, 2915 Main St, Bryant, Arkansas 72022 Phone: (501) 847-0900
Vista Inn & Suites, 210 Ofc Park Dr, Bryant, Arkansas 72022 Phone: (501) 847-7120, Fax: (501) 847-7140
Comfort Inn & Suites, 209 W Commerce St, Bryant, Arkansas 72022 Phone: (501) 653-4000, Fax: (501) 653-0973
Hometown Hotel, 2921 Main St, Bryant, Arkansas 72022 Phone: (501) 653-0123, Fax: (501) 653-0124
Hampton Inn, 307 Ofc Park Dr, Bryant, Arkansas 72022 Phone: (501) 847-3200
Americas Best Value Inn, 407 W Commerce St, Bryant, Arkansas 72022 Phone: (501) 653-7800, Fax: (501) 847-8496
La Quinta Inn & Suites, 408 W Commerce St, Bryant, Arkansas 72022 Phone: (501) 847-9494, Fax: (501) 847-9496
Holiday Inn Express, 7224 Alcoa Rd, Bryant, Arkansas 72022 Phone: (800) 439-4745
All 8 fire-safe hotels and motels in Bryant, Arkansas
Most common first names in Bryant, AR among deceased individuals Name Count Lived (average)
James 31 76.3 years John 25 78.9 years Mary 23 75.0 years William 22 72.3 years Robert 17 68.4 years Charles 13 76.9 years George 12 73.2 years Ruth 12 78.9 years Joe 11 64.9 years Paul 11 71.6 years
Most common last names in Bryant, AR among deceased individuals Last name Count Lived (average)
Smith 18 81.6 years Brown 17 81.1 years Davis 13 76.8 years Johnson 12 83.4 years Jones 11 76.4 years Moore 11 78.5 years Green 11 72.3 years Harris 10 80.1 years Elrod 9 79.0 years Anderson 8 79.4 years
Bryant compared to Arkansas state average:
Unemployed percentage significantly below state average. Black race population percentage above state average. Length of stay since moving in above state average. House age below state average. Percentage of population with a bachelor's degree or higher above state average.
#67 on the list of "Top 101 cities with largest percentage of males in occupations: health technologists and technicians (population 5,000+)"
#16 on the list of "Top 101 counties with the largest number of people moving in compared to moving out (pop. 50,000+)"
#77 on the list of "Top 101 counties with highest percentage of residents voting for 3rd party candidates in the 2012 Presidential Election (pop. 50,000+)"
#99 on the list of "Top 101 counties with highest percentage of residents voting for Romney (Republican) in the 2012 Presidential Election (pop. 50,000+)"
Top Patent Applicants
Wayne Crolley (7)
C. Wayne Crolley (3)
Kristen Chipolla Sanchez (3)
Jake Fiser (2)
Terry Griffin (2)
Sameer Kulkarni (1)
David B. Crowley (1)
Richard B. Stobaugh (1)
Timothy E. Dugan (1)
Connie Marie Ardwin (1)
Total of 22 patent applications in 2008-2024.
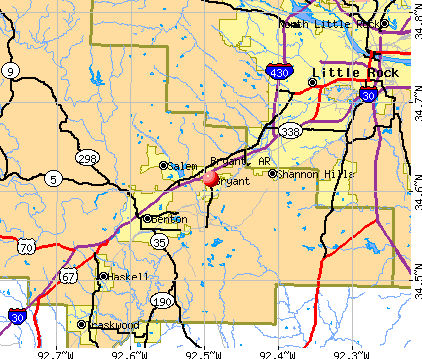


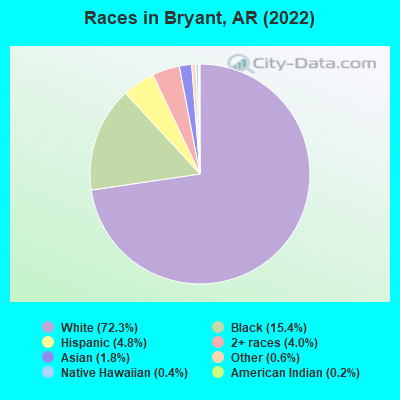
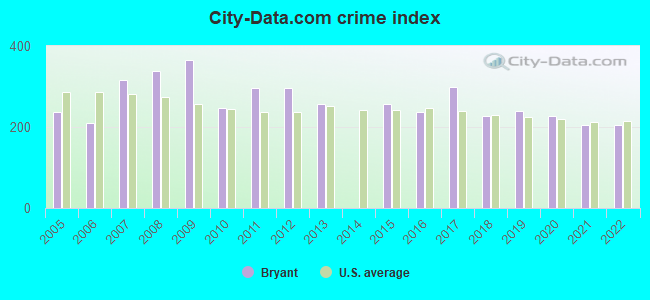
 Recent articles from our blog. Our writers, many of them Ph.D. graduates or candidates, create easy-to-read articles on a wide variety of topics.

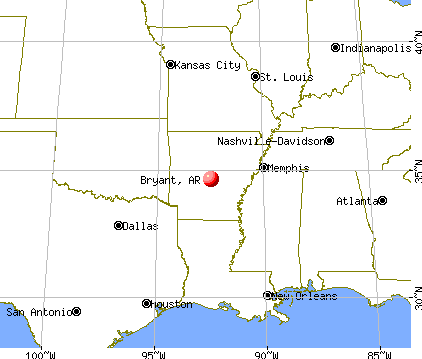
 (12.4 miles
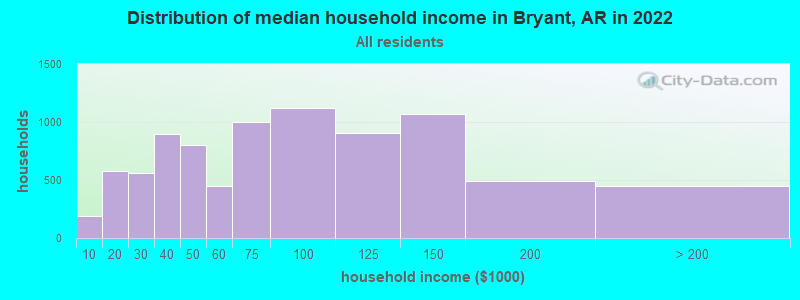
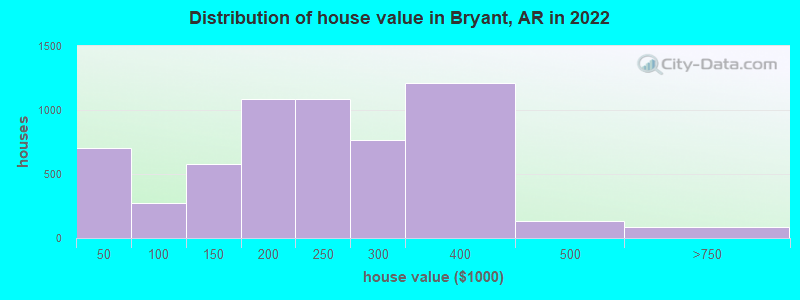
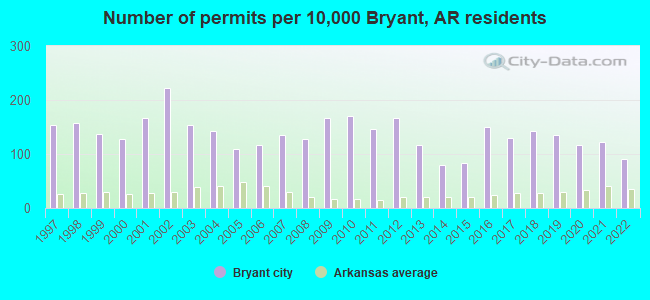
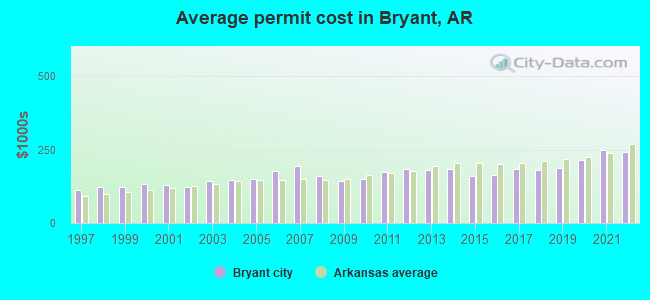
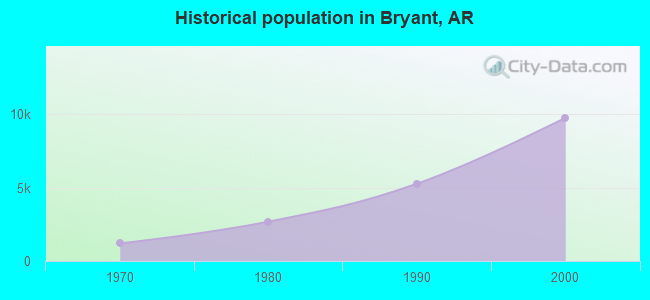
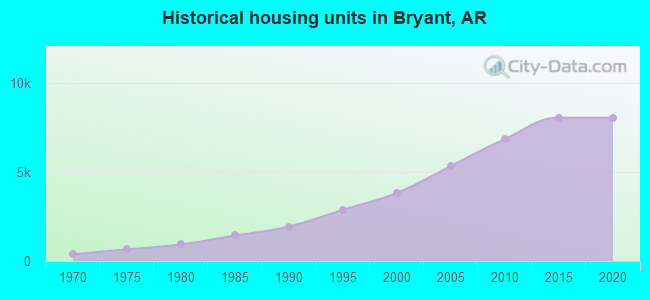
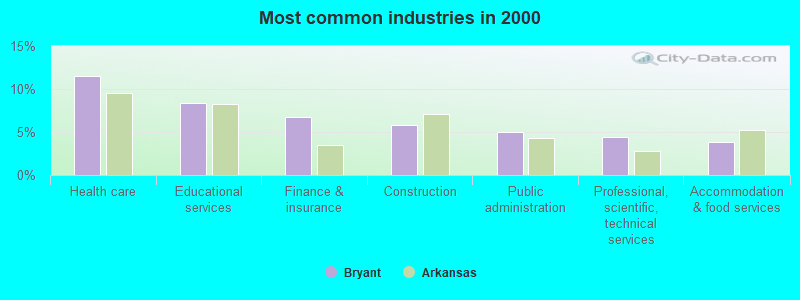
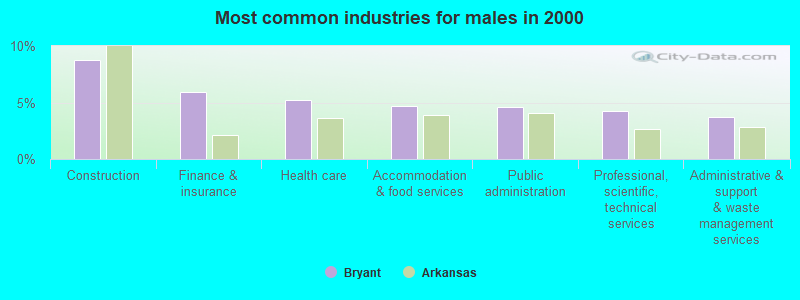
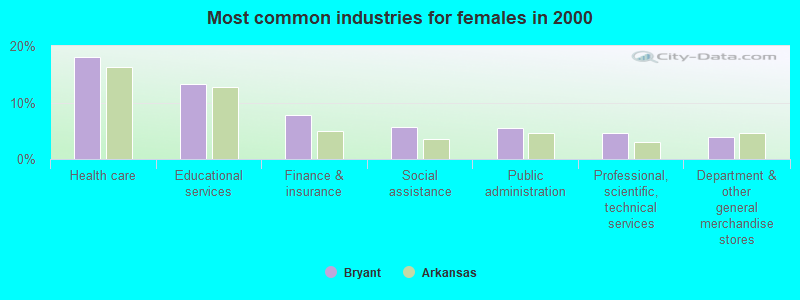
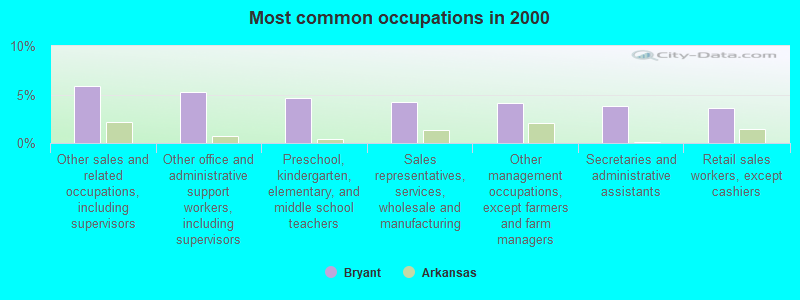
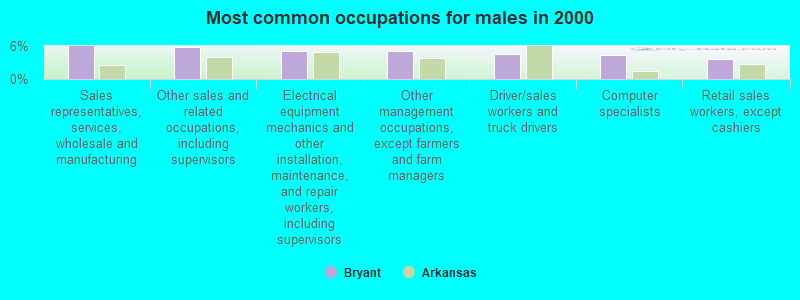
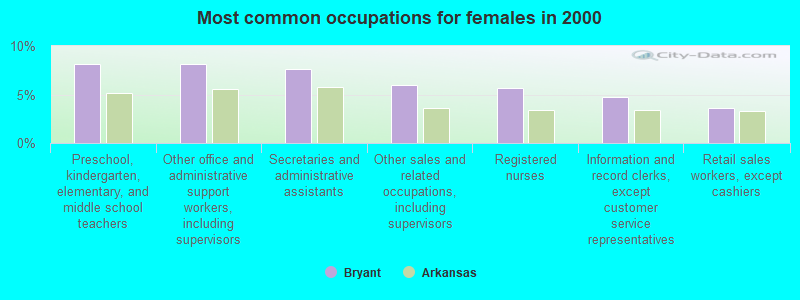
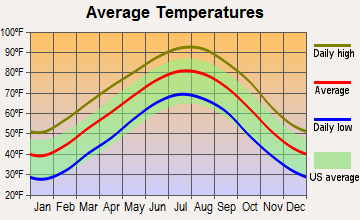
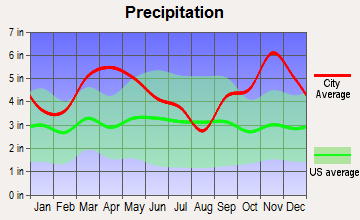
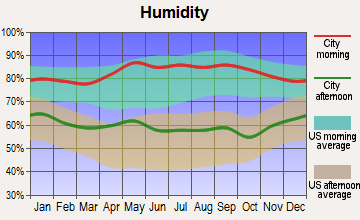
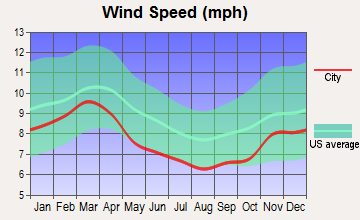
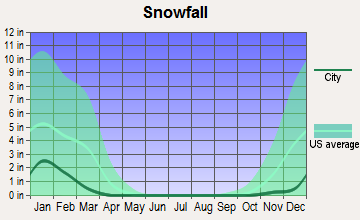
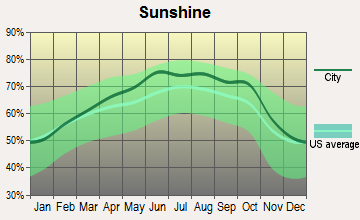
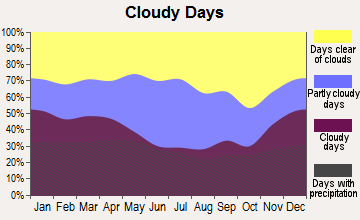
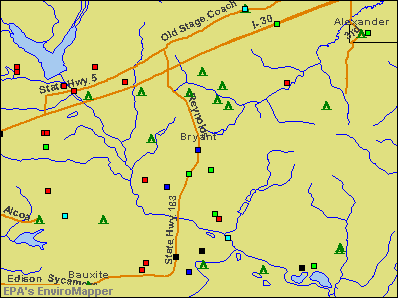

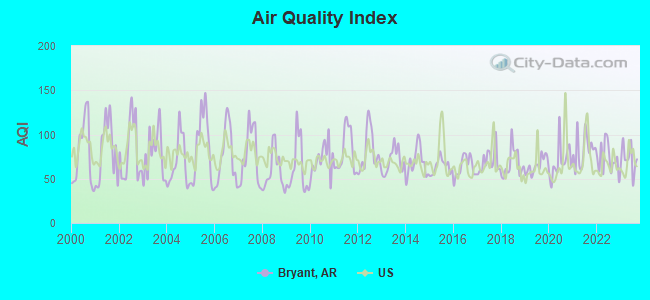
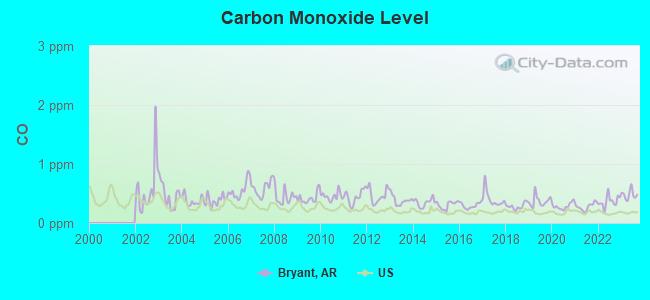
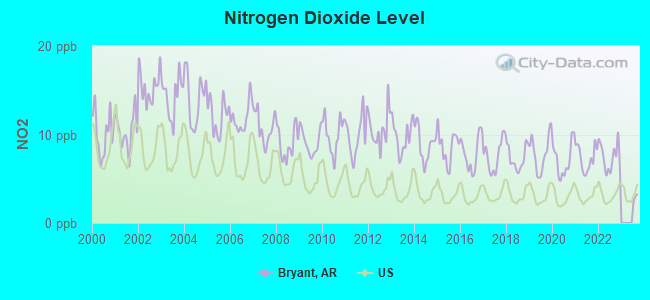
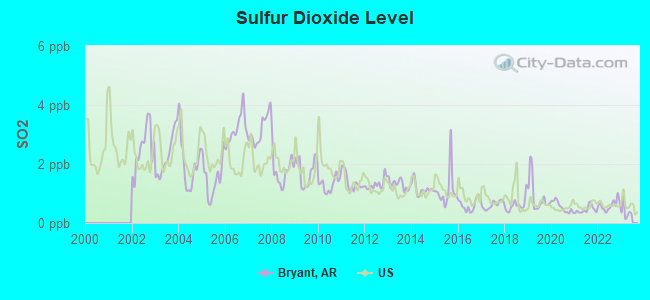
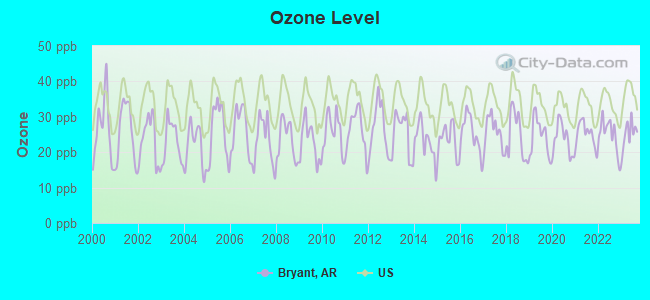
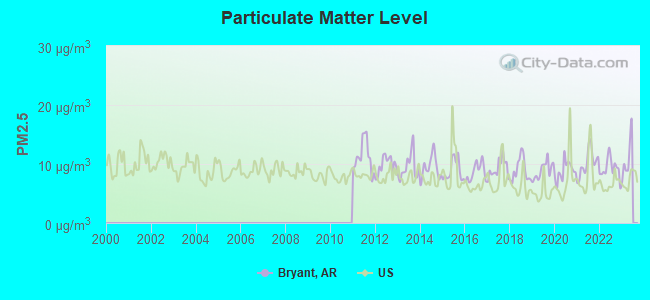
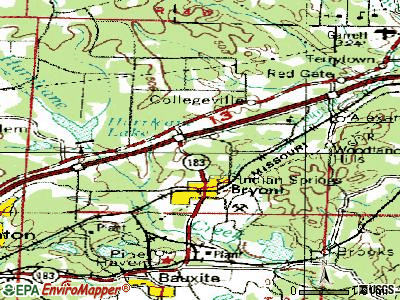
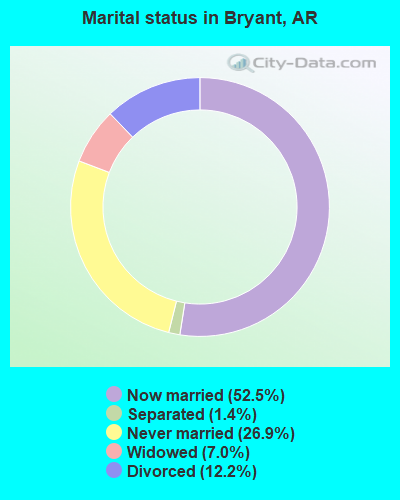
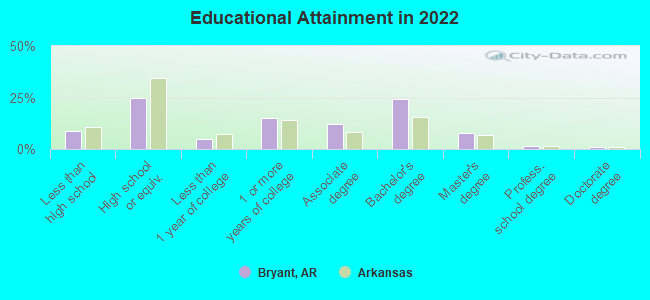
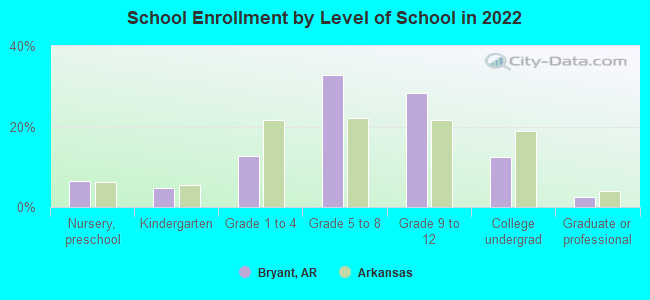
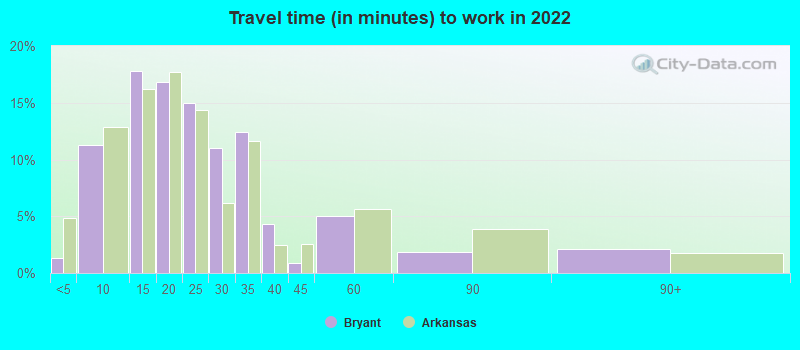
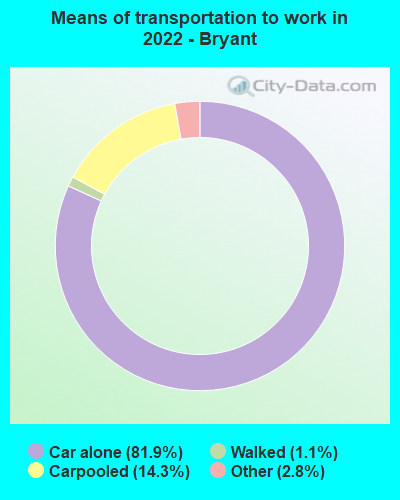
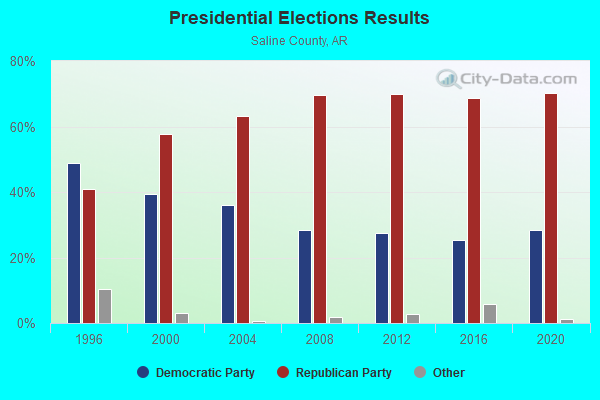
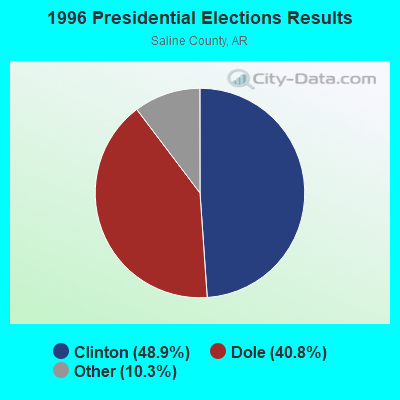
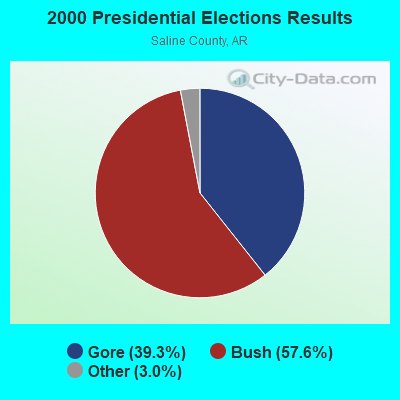
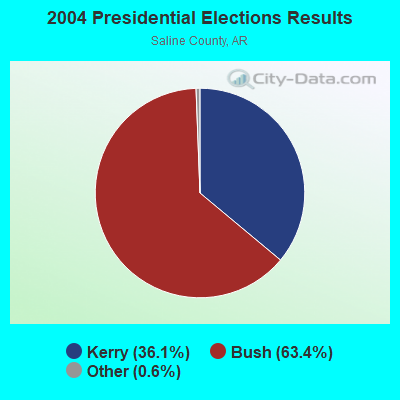


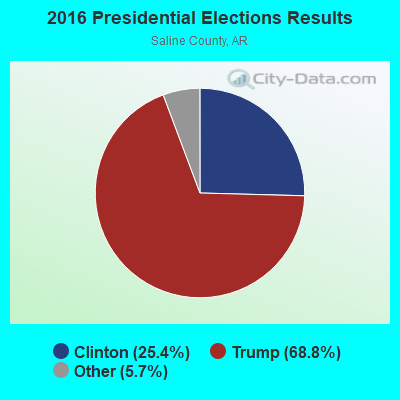
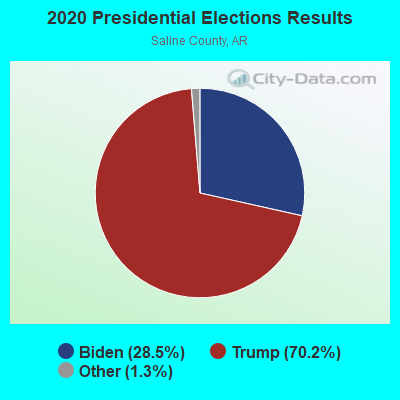
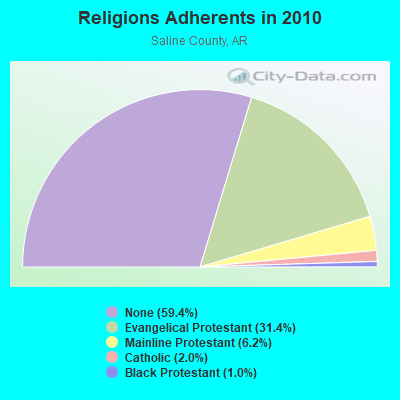
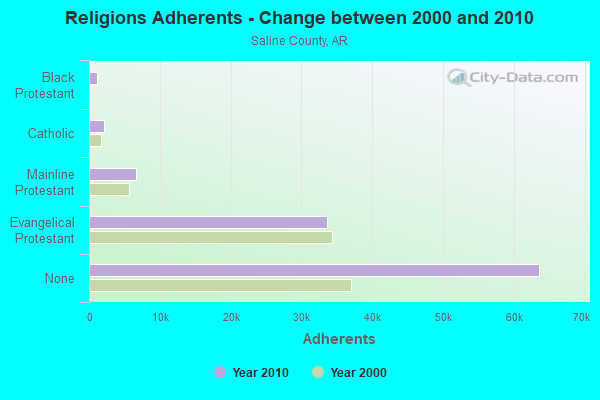
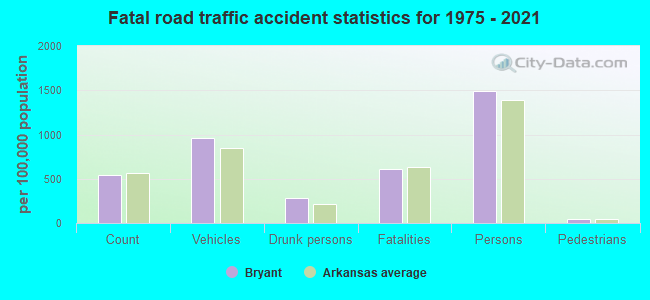
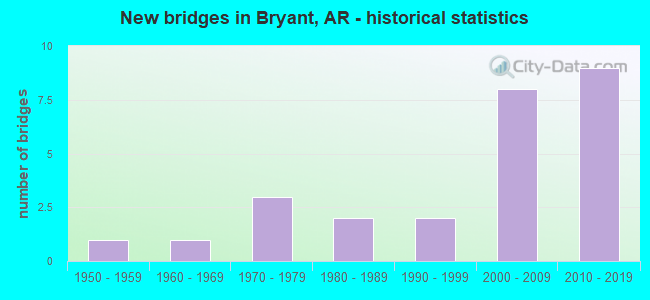
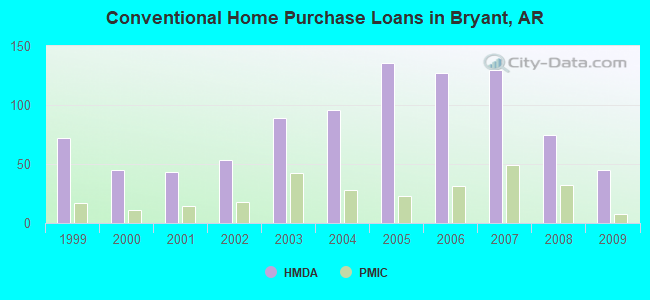
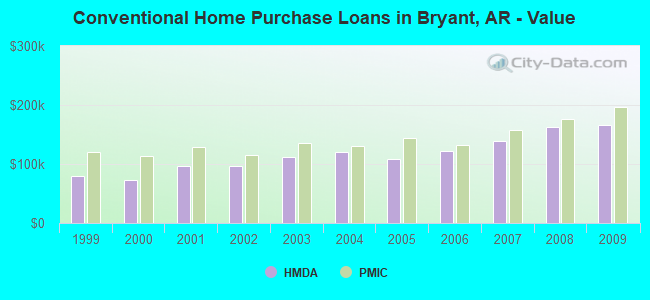
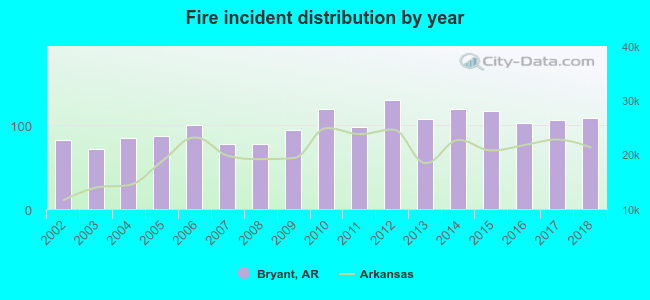 Based on the data from the years 2002 - 2018 the average number of fires per year is 99. The highest number of reported fires - 130 took place in 2012, and the least - 72 in 2003. The data has an increasing trend.
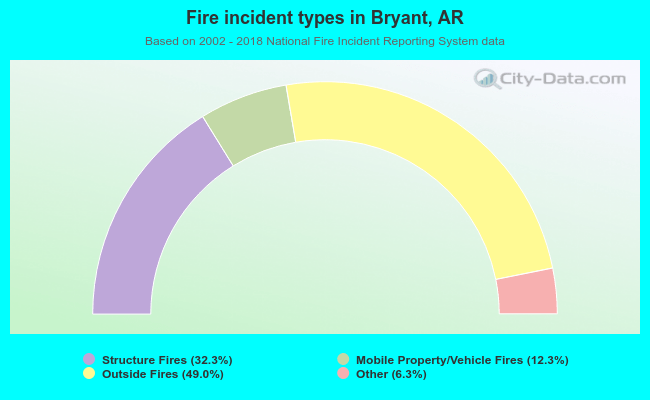 When looking into fire subcategories, the most reports belonged to: Outside Fires (49.0%), and Structure Fires (32.3%).