Fleetwood, Pennsylvania Submit your own pictures of this borough and show them to the world
OSM Map
General Map
Google Map
MSN Map
OSM Map
General Map
Google Map
MSN Map
OSM Map
General Map
Google Map
MSN Map
OSM Map
General Map
Google Map
MSN Map
Please wait while loading the map...
Population in 2022: 4,039 (100% urban, 0% rural). Population change since 2000: +0.5%Males: 2,117 Females: 1,922
March 2022 cost of living index in Fleetwood: 95.3 (near average, U.S. average is 100) Percentage of residents living in poverty in 2022: 5.6%for White Non-Hispanic residents , 1.9% for Hispanic or Latino residents , 100.0% for other race residents )
Profiles of local businesses
Business Search - 14 Million verified businesses
Data:
Median household income ($)
Median household income (% change since 2000)
Household income diversity
Ratio of average income to average house value (%)
Ratio of average income to average rent
Median household income ($) - White
Median household income ($) - Black or African American
Median household income ($) - Asian
Median household income ($) - Hispanic or Latino
Median household income ($) - American Indian and Alaska Native
Median household income ($) - Multirace
Median household income ($) - Other Race
Median household income for houses/condos with a mortgage ($)
Median household income for apartments without a mortgage ($)
Races - White alone (%)
Races - White alone (% change since 2000)
Races - Black alone (%)
Races - Black alone (% change since 2000)
Races - American Indian alone (%)
Races - American Indian alone (% change since 2000)
Races - Asian alone (%)
Races - Asian alone (% change since 2000)
Races - Hispanic (%)
Races - Hispanic (% change since 2000)
Races - Native Hawaiian and Other Pacific Islander alone (%)
Races - Native Hawaiian and Other Pacific Islander alone (% change since 2000)
Races - Two or more races (%)
Races - Two or more races (% change since 2000)
Races - Other race alone (%)
Races - Other race alone (% change since 2000)
Racial diversity
Unemployment (%)
Unemployment (% change since 2000)
Unemployment (%) - White
Unemployment (%) - Black or African American
Unemployment (%) - Asian
Unemployment (%) - Hispanic or Latino
Unemployment (%) - American Indian and Alaska Native
Unemployment (%) - Multirace
Unemployment (%) - Other Race
Population density (people per square mile)
Population - Males (%)
Population - Females (%)
Population - Males (%) - White
Population - Males (%) - Black or African American
Population - Males (%) - Asian
Population - Males (%) - Hispanic or Latino
Population - Males (%) - American Indian and Alaska Native
Population - Males (%) - Multirace
Population - Males (%) - Other Race
Population - Females (%) - White
Population - Females (%) - Black or African American
Population - Females (%) - Asian
Population - Females (%) - Hispanic or Latino
Population - Females (%) - American Indian and Alaska Native
Population - Females (%) - Multirace
Population - Females (%) - Other Race
Coronavirus confirmed cases (Jun 19, 2024)
Deaths caused by coronavirus (Jun 19, 2024)
Coronavirus confirmed cases (per 100k population) (Jun 19, 2024)
Deaths caused by coronavirus (per 100k population) (Jun 19, 2024)
Daily increase in number of cases (Jun 19, 2024)
Weekly increase in number of cases (Jun 19, 2024)
Cases doubled (in days) (Jun 19, 2024)
Hospitalized patients (Apr 18, 2022)
Negative test results (Apr 18, 2022)
Total test results (Apr 18, 2022)
COVID Vaccine doses distributed (per 100k population) (Sep 19, 2023)
COVID Vaccine doses administered (per 100k population) (Sep 19, 2023)
COVID Vaccine doses distributed (Sep 19, 2023)
COVID Vaccine doses administered (Sep 19, 2023)
Likely homosexual households (%)
Likely homosexual households (% change since 2000)
Likely homosexual households - Lesbian couples (%)
Likely homosexual households - Lesbian couples (% change since 2000)
Likely homosexual households - Gay men (%)
Likely homosexual households - Gay men (% change since 2000)
Cost of living index
Median gross rent ($)
Median contract rent ($)
Median monthly housing costs ($)
Median house or condo value ($)
Median house or condo value ($ change since 2000)
Mean house or condo value by units in structure - 1, detached ($)
Mean house or condo value by units in structure - 1, attached ($)
Mean house or condo value by units in structure - 2 ($)
Mean house or condo value by units in structure by units in structure - 3 or 4 ($)
Mean house or condo value by units in structure - 5 or more ($)
Mean house or condo value by units in structure - Boat, RV, van, etc. ($)
Mean house or condo value by units in structure - Mobile home ($)
Median house or condo value ($) - White
Median house or condo value ($) - Black or African American
Median house or condo value ($) - Asian
Median house or condo value ($) - Hispanic or Latino
Median house or condo value ($) - American Indian and Alaska Native
Median house or condo value ($) - Multirace
Median house or condo value ($) - Other Race
Median resident age
Resident age diversity
Median resident age - Males
Median resident age - Females
Median resident age - White
Median resident age - Black or African American
Median resident age - Asian
Median resident age - Hispanic or Latino
Median resident age - American Indian and Alaska Native
Median resident age - Multirace
Median resident age - Other Race
Median resident age - Males - White
Median resident age - Males - Black or African American
Median resident age - Males - Asian
Median resident age - Males - Hispanic or Latino
Median resident age - Males - American Indian and Alaska Native
Median resident age - Males - Multirace
Median resident age - Males - Other Race
Median resident age - Females - White
Median resident age - Females - Black or African American
Median resident age - Females - Asian
Median resident age - Females - Hispanic or Latino
Median resident age - Females - American Indian and Alaska Native
Median resident age - Females - Multirace
Median resident age - Females - Other Race
Commute - mean travel time to work (minutes)
Travel time to work - Less than 5 minutes (%)
Travel time to work - Less than 5 minutes (% change since 2000)
Travel time to work - 5 to 9 minutes (%)
Travel time to work - 5 to 9 minutes (% change since 2000)
Travel time to work - 10 to 19 minutes (%)
Travel time to work - 10 to 19 minutes (% change since 2000)
Travel time to work - 20 to 29 minutes (%)
Travel time to work - 20 to 29 minutes (% change since 2000)
Travel time to work - 30 to 39 minutes (%)
Travel time to work - 30 to 39 minutes (% change since 2000)
Travel time to work - 40 to 59 minutes (%)
Travel time to work - 40 to 59 minutes (% change since 2000)
Travel time to work - 60 to 89 minutes (%)
Travel time to work - 60 to 89 minutes (% change since 2000)
Travel time to work - 90 or more minutes (%)
Travel time to work - 90 or more minutes (% change since 2000)
Marital status - Never married (%)
Marital status - Now married (%)
Marital status - Separated (%)
Marital status - Widowed (%)
Marital status - Divorced (%)
Median family income ($)
Median family income (% change since 2000)
Median non-family income ($)
Median non-family income (% change since 2000)
Median per capita income ($)
Median per capita income (% change since 2000)
Median family income ($) - White
Median family income ($) - Black or African American
Median family income ($) - Asian
Median family income ($) - Hispanic or Latino
Median family income ($) - American Indian and Alaska Native
Median family income ($) - Multirace
Median family income ($) - Other Race
Median year house/condo built
Median year apartment built
Year house built - Built 2005 or later (%)
Year house built - Built 2000 to 2004 (%)
Year house built - Built 1990 to 1999 (%)
Year house built - Built 1980 to 1989 (%)
Year house built - Built 1970 to 1979 (%)
Year house built - Built 1960 to 1969 (%)
Year house built - Built 1950 to 1959 (%)
Year house built - Built 1940 to 1949 (%)
Year house built - Built 1939 or earlier (%)
Average household size
Household density (households per square mile)
Average household size - White
Average household size - Black or African American
Average household size - Asian
Average household size - Hispanic or Latino
Average household size - American Indian and Alaska Native
Average household size - Multirace
Average household size - Other Race
Occupied housing units (%)
Vacant housing units (%)
Owner occupied housing units (%)
Renter occupied housing units (%)
Vacancy status - For rent (%)
Vacancy status - For sale only (%)
Vacancy status - Rented or sold, not occupied (%)
Vacancy status - For seasonal, recreational, or occasional use (%)
Vacancy status - For migrant workers (%)
Vacancy status - Other vacant (%)
Residents with income below the poverty level (%)
Residents with income below 50% of the poverty level (%)
Children below poverty level (%)
Poor families by family type - Married-couple family (%)
Poor families by family type - Male, no wife present (%)
Poor families by family type - Female, no husband present (%)
Poverty status for native-born residents (%)
Poverty status for foreign-born residents (%)
Poverty among high school graduates not in families (%)
Poverty among people who did not graduate high school not in families (%)
Residents with income below the poverty level (%) - White
Residents with income below the poverty level (%) - Black or African American
Residents with income below the poverty level (%) - Asian
Residents with income below the poverty level (%) - Hispanic or Latino
Residents with income below the poverty level (%) - American Indian and Alaska Native
Residents with income below the poverty level (%) - Multirace
Residents with income below the poverty level (%) - Other Race
Air pollution - Air Quality Index (AQI)
Air pollution - CO
Air pollution - NO2
Air pollution - SO2
Air pollution - Ozone
Air pollution - PM10
Air pollution - PM25
Air pollution - Pb
Crime - Murders per 100,000 population
Crime - Rapes per 100,000 population
Crime - Robberies per 100,000 population
Crime - Assaults per 100,000 population
Crime - Burglaries per 100,000 population
Crime - Thefts per 100,000 population
Crime - Auto thefts per 100,000 population
Crime - Arson per 100,000 population
Crime - City-data.com crime index
Crime - Violent crime index
Crime - Property crime index
Crime - Murders per 100,000 population (5 year average)
Crime - Rapes per 100,000 population (5 year average)
Crime - Robberies per 100,000 population (5 year average)
Crime - Assaults per 100,000 population (5 year average)
Crime - Burglaries per 100,000 population (5 year average)
Crime - Thefts per 100,000 population (5 year average)
Crime - Auto thefts per 100,000 population (5 year average)
Crime - Arson per 100,000 population (5 year average)
Crime - City-data.com crime index (5 year average)
Crime - Violent crime index (5 year average)
Crime - Property crime index (5 year average)
1996 Presidential Elections Results (%) - Democratic Party (Clinton)
1996 Presidential Elections Results (%) - Republican Party (Dole)
1996 Presidential Elections Results (%) - Other
2000 Presidential Elections Results (%) - Democratic Party (Gore)
2000 Presidential Elections Results (%) - Republican Party (Bush)
2000 Presidential Elections Results (%) - Other
2004 Presidential Elections Results (%) - Democratic Party (Kerry)
2004 Presidential Elections Results (%) - Republican Party (Bush)
2004 Presidential Elections Results (%) - Other
2008 Presidential Elections Results (%) - Democratic Party (Obama)
2008 Presidential Elections Results (%) - Republican Party (McCain)
2008 Presidential Elections Results (%) - Other
2012 Presidential Elections Results (%) - Democratic Party (Obama)
2012 Presidential Elections Results (%) - Republican Party (Romney)
2012 Presidential Elections Results (%) - Other
2016 Presidential Elections Results (%) - Democratic Party (Clinton)
2016 Presidential Elections Results (%) - Republican Party (Trump)
2016 Presidential Elections Results (%) - Other
2020 Presidential Elections Results (%) - Democratic Party (Biden)
2020 Presidential Elections Results (%) - Republican Party (Trump)
2020 Presidential Elections Results (%) - Other
Ancestries Reported - Arab (%)
Ancestries Reported - Czech (%)
Ancestries Reported - Danish (%)
Ancestries Reported - Dutch (%)
Ancestries Reported - English (%)
Ancestries Reported - French (%)
Ancestries Reported - French Canadian (%)
Ancestries Reported - German (%)
Ancestries Reported - Greek (%)
Ancestries Reported - Hungarian (%)
Ancestries Reported - Irish (%)
Ancestries Reported - Italian (%)
Ancestries Reported - Lithuanian (%)
Ancestries Reported - Norwegian (%)
Ancestries Reported - Polish (%)
Ancestries Reported - Portuguese (%)
Ancestries Reported - Russian (%)
Ancestries Reported - Scotch-Irish (%)
Ancestries Reported - Scottish (%)
Ancestries Reported - Slovak (%)
Ancestries Reported - Subsaharan African (%)
Ancestries Reported - Swedish (%)
Ancestries Reported - Swiss (%)
Ancestries Reported - Ukrainian (%)
Ancestries Reported - United States (%)
Ancestries Reported - Welsh (%)
Ancestries Reported - West Indian (%)
Ancestries Reported - Other (%)
Educational Attainment - No schooling completed (%)
Educational Attainment - Less than high school (%)
Educational Attainment - High school or equivalent (%)
Educational Attainment - Less than 1 year of college (%)
Educational Attainment - 1 or more years of college (%)
Educational Attainment - Associate degree (%)
Educational Attainment - Bachelor's degree (%)
Educational Attainment - Master's degree (%)
Educational Attainment - Professional school degree (%)
Educational Attainment - Doctorate degree (%)
School Enrollment - Nursery, preschool (%)
School Enrollment - Kindergarten (%)
School Enrollment - Grade 1 to 4 (%)
School Enrollment - Grade 5 to 8 (%)
School Enrollment - Grade 9 to 12 (%)
School Enrollment - College undergrad (%)
School Enrollment - Graduate or professional (%)
School Enrollment - Not enrolled in school (%)
School enrollment - Public schools (%)
School enrollment - Private schools (%)
School enrollment - Not enrolled (%)
Median number of rooms in houses and condos
Median number of rooms in apartments
Housing units lacking complete plumbing facilities (%)
Housing units lacking complete kitchen facilities (%)
Density of houses
Urban houses (%)
Rural houses (%)
Households with people 60 years and over (%)
Households with people 65 years and over (%)
Households with people 75 years and over (%)
Households with one or more nonrelatives (%)
Households with no nonrelatives (%)
Population in households (%)
Family households (%)
Nonfamily households (%)
Population in families (%)
Family households with own children (%)
Median number of bedrooms in owner occupied houses
Mean number of bedrooms in owner occupied houses
Median number of bedrooms in renter occupied houses
Mean number of bedrooms in renter occupied houses
Median number of vehichles in owner occupied houses
Mean number of vehichles in owner occupied houses
Median number of vehichles in renter occupied houses
Mean number of vehichles in renter occupied houses
Mortgage status - with mortgage (%)
Mortgage status - with second mortgage (%)
Mortgage status - with home equity loan (%)
Mortgage status - with both second mortgage and home equity loan (%)
Mortgage status - without a mortgage (%)
Average family size
Average family size - White
Average family size - Black or African American
Average family size - Asian
Average family size - Hispanic or Latino
Average family size - American Indian and Alaska Native
Average family size - Multirace
Average family size - Other Race
Geographical mobility - Same house 1 year ago (%)
Geographical mobility - Moved within same county (%)
Geographical mobility - Moved from different county within same state (%)
Geographical mobility - Moved from different state (%)
Geographical mobility - Moved from abroad (%)
Place of birth - Born in state of residence (%)
Place of birth - Born in other state (%)
Place of birth - Native, outside of US (%)
Place of birth - Foreign born (%)
Housing units in structures - 1, detached (%)
Housing units in structures - 1, attached (%)
Housing units in structures - 2 (%)
Housing units in structures - 3 or 4 (%)
Housing units in structures - 5 to 9 (%)
Housing units in structures - 10 to 19 (%)
Housing units in structures - 20 to 49 (%)
Housing units in structures - 50 or more (%)
Housing units in structures - Mobile home (%)
Housing units in structures - Boat, RV, van, etc. (%)
House/condo owner moved in on average (years ago)
Renter moved in on average (years ago)
Year householder moved into unit - Moved in 1999 to March 2000 (%)
Year householder moved into unit - Moved in 1995 to 1998 (%)
Year householder moved into unit - Moved in 1990 to 1994 (%)
Year householder moved into unit - Moved in 1980 to 1989 (%)
Year householder moved into unit - Moved in 1970 to 1979 (%)
Year householder moved into unit - Moved in 1969 or earlier (%)
Means of transportation to work - Drove car alone (%)
Means of transportation to work - Carpooled (%)
Means of transportation to work - Public transportation (%)
Means of transportation to work - Bus or trolley bus (%)
Means of transportation to work - Streetcar or trolley car (%)
Means of transportation to work - Subway or elevated (%)
Means of transportation to work - Railroad (%)
Means of transportation to work - Ferryboat (%)
Means of transportation to work - Taxicab (%)
Means of transportation to work - Motorcycle (%)
Means of transportation to work - Bicycle (%)
Means of transportation to work - Walked (%)
Means of transportation to work - Other means (%)
Working at home (%)
Industry diversity
Most Common Industries - Agriculture, forestry, fishing and hunting, and mining (%)
Most Common Industries - Agriculture, forestry, fishing and hunting (%)
Most Common Industries - Mining, quarrying, and oil and gas extraction (%)
Most Common Industries - Construction (%)
Most Common Industries - Manufacturing (%)
Most Common Industries - Wholesale trade (%)
Most Common Industries - Retail trade (%)
Most Common Industries - Transportation and warehousing, and utilities (%)
Most Common Industries - Transportation and warehousing (%)
Most Common Industries - Utilities (%)
Most Common Industries - Information (%)
Most Common Industries - Finance and insurance, and real estate and rental and leasing (%)
Most Common Industries - Finance and insurance (%)
Most Common Industries - Real estate and rental and leasing (%)
Most Common Industries - Professional, scientific, and management, and administrative and waste management services (%)
Most Common Industries - Professional, scientific, and technical services (%)
Most Common Industries - Management of companies and enterprises (%)
Most Common Industries - Administrative and support and waste management services (%)
Most Common Industries - Educational services, and health care and social assistance (%)
Most Common Industries - Educational services (%)
Most Common Industries - Health care and social assistance (%)
Most Common Industries - Arts, entertainment, and recreation, and accommodation and food services (%)
Most Common Industries - Arts, entertainment, and recreation (%)
Most Common Industries - Accommodation and food services (%)
Most Common Industries - Other services, except public administration (%)
Most Common Industries - Public administration (%)
Occupation diversity
Most Common Occupations - Management, business, science, and arts occupations (%)
Most Common Occupations - Management, business, and financial occupations (%)
Most Common Occupations - Management occupations (%)
Most Common Occupations - Business and financial operations occupations (%)
Most Common Occupations - Computer, engineering, and science occupations (%)
Most Common Occupations - Computer and mathematical occupations (%)
Most Common Occupations - Architecture and engineering occupations (%)
Most Common Occupations - Life, physical, and social science occupations (%)
Most Common Occupations - Education, legal, community service, arts, and media occupations (%)
Most Common Occupations - Community and social service occupations (%)
Most Common Occupations - Legal occupations (%)
Most Common Occupations - Education, training, and library occupations (%)
Most Common Occupations - Arts, design, entertainment, sports, and media occupations (%)
Most Common Occupations - Healthcare practitioners and technical occupations (%)
Most Common Occupations - Health diagnosing and treating practitioners and other technical occupations (%)
Most Common Occupations - Health technologists and technicians (%)
Most Common Occupations - Service occupations (%)
Most Common Occupations - Healthcare support occupations (%)
Most Common Occupations - Protective service occupations (%)
Most Common Occupations - Fire fighting and prevention, and other protective service workers including supervisors (%)
Most Common Occupations - Law enforcement workers including supervisors (%)
Most Common Occupations - Food preparation and serving related occupations (%)
Most Common Occupations - Building and grounds cleaning and maintenance occupations (%)
Most Common Occupations - Personal care and service occupations (%)
Most Common Occupations - Sales and office occupations (%)
Most Common Occupations - Sales and related occupations (%)
Most Common Occupations - Office and administrative support occupations (%)
Most Common Occupations - Natural resources, construction, and maintenance occupations (%)
Most Common Occupations - Farming, fishing, and forestry occupations (%)
Most Common Occupations - Construction and extraction occupations (%)
Most Common Occupations - Installation, maintenance, and repair occupations (%)
Most Common Occupations - Production, transportation, and material moving occupations (%)
Most Common Occupations - Production occupations (%)
Most Common Occupations - Transportation occupations (%)
Most Common Occupations - Material moving occupations (%)
People in Group quarters - Institutionalized population (%)
People in Group quarters - Correctional institutions (%)
People in Group quarters - Federal prisons and detention centers (%)
People in Group quarters - Halfway houses (%)
People in Group quarters - Local jails and other confinement facilities (including police lockups) (%)
People in Group quarters - Military disciplinary barracks (%)
People in Group quarters - State prisons (%)
People in Group quarters - Other types of correctional institutions (%)
People in Group quarters - Nursing homes (%)
People in Group quarters - Hospitals/wards, hospices, and schools for the handicapped (%)
People in Group quarters - Hospitals/wards and hospices for chronically ill (%)
People in Group quarters - Hospices or homes for chronically ill (%)
People in Group quarters - Military hospitals or wards for chronically ill (%)
People in Group quarters - Other hospitals or wards for chronically ill (%)
People in Group quarters - Hospitals or wards for drug/alcohol abuse (%)
People in Group quarters - Mental (Psychiatric) hospitals or wards (%)
People in Group quarters - Schools, hospitals, or wards for the mentally retarded (%)
People in Group quarters - Schools, hospitals, or wards for the physically handicapped (%)
People in Group quarters - Institutions for the deaf (%)
People in Group quarters - Institutions for the blind (%)
People in Group quarters - Orthopedic wards and institutions for the physically handicapped (%)
People in Group quarters - Wards in general hospitals for patients who have no usual home elsewhere (%)
People in Group quarters - Wards in military hospitals for patients who have no usual home elsewhere (%)
People in Group quarters - Juvenile institutions (%)
People in Group quarters - Long-term care (%)
People in Group quarters - Homes for abused, dependent, and neglected children (%)
People in Group quarters - Residential treatment centers for emotionally disturbed children (%)
People in Group quarters - Training schools for juvenile delinquents (%)
People in Group quarters - Short-term care, detention or diagnostic centers for delinquent children (%)
People in Group quarters - Type of juvenile institution unknown (%)
People in Group quarters - Noninstitutionalized population (%)
People in Group quarters - College dormitories (includes college quarters off campus) (%)
People in Group quarters - Military quarters (%)
People in Group quarters - On base (%)
People in Group quarters - Barracks, unaccompanied personnel housing (UPH), (Enlisted/Officer), ;and similar group living quarters for military personnel (%)
People in Group quarters - Transient quarters for temporary residents (%)
People in Group quarters - Military ships (%)
People in Group quarters - Group homes (%)
People in Group quarters - Homes or halfway houses for drug/alcohol abuse (%)
People in Group quarters - Homes for the mentally ill (%)
People in Group quarters - Homes for the mentally retarded (%)
People in Group quarters - Homes for the physically handicapped (%)
People in Group quarters - Other group homes (%)
People in Group quarters - Religious group quarters (%)
People in Group quarters - Dormitories (%)
People in Group quarters - Agriculture workers' dormitories on farms (%)
People in Group quarters - Job Corps and vocational training facilities (%)
People in Group quarters - Other workers' dormitories (%)
People in Group quarters - Crews of maritime vessels (%)
People in Group quarters - Other nonhousehold living situations (%)
People in Group quarters - Other noninstitutional group quarters (%)
Residents speaking English at home (%)
Residents speaking English at home - Born in the United States (%)
Residents speaking English at home - Native, born elsewhere (%)
Residents speaking English at home - Foreign born (%)
Residents speaking Spanish at home (%)
Residents speaking Spanish at home - Born in the United States (%)
Residents speaking Spanish at home - Native, born elsewhere (%)
Residents speaking Spanish at home - Foreign born (%)
Residents speaking other language at home (%)
Residents speaking other language at home - Born in the United States (%)
Residents speaking other language at home - Native, born elsewhere (%)
Residents speaking other language at home - Foreign born (%)
Class of Workers - Employee of private company (%)
Class of Workers - Self-employed in own incorporated business (%)
Class of Workers - Private not-for-profit wage and salary workers (%)
Class of Workers - Local government workers (%)
Class of Workers - State government workers (%)
Class of Workers - Federal government workers (%)
Class of Workers - Self-employed workers in own not incorporated business and Unpaid family workers (%)
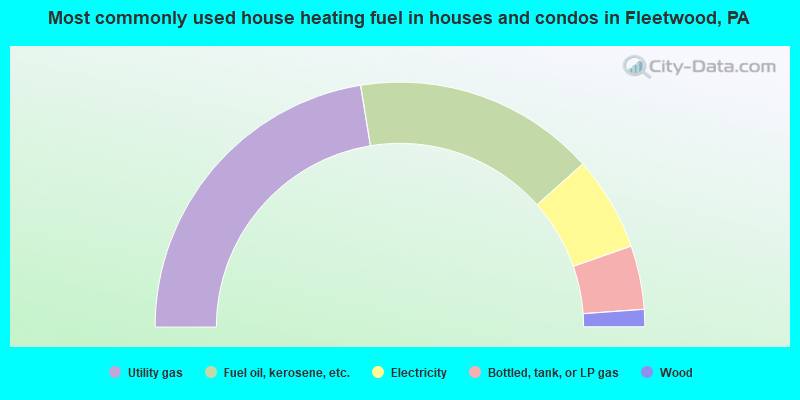
House heating fuel used in houses and condos - Utility gas (%)
House heating fuel used in houses and condos - Bottled, tank, or LP gas (%)
House heating fuel used in houses and condos - Electricity (%)
House heating fuel used in houses and condos - Fuel oil, kerosene, etc. (%)
House heating fuel used in houses and condos - Coal or coke (%)
House heating fuel used in houses and condos - Wood (%)
House heating fuel used in houses and condos - Solar energy (%)
House heating fuel used in houses and condos - Other fuel (%)
House heating fuel used in houses and condos - No fuel used (%)
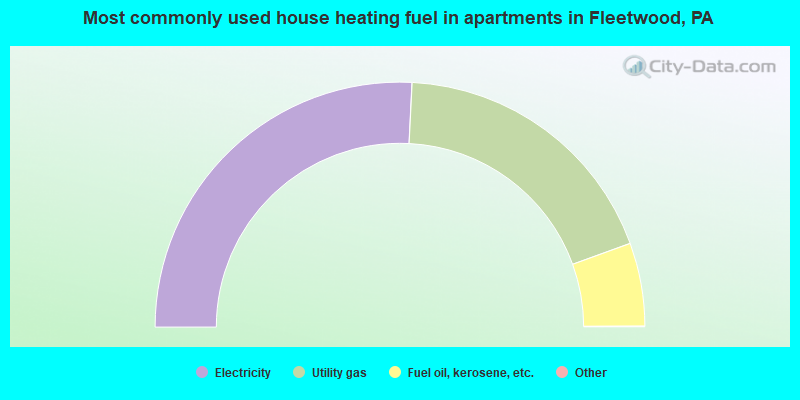
House heating fuel used in apartments - Utility gas (%)
House heating fuel used in apartments - Bottled, tank, or LP gas (%)
House heating fuel used in apartments - Electricity (%)
House heating fuel used in apartments - Fuel oil, kerosene, etc. (%)
House heating fuel used in apartments - Coal or coke (%)
House heating fuel used in apartments - Wood (%)
House heating fuel used in apartments - Solar energy (%)
House heating fuel used in apartments - Other fuel (%)
House heating fuel used in apartments - No fuel used (%)
Armed forces status - In Armed Forces (%)
Armed forces status - Civilian (%)
Armed forces status - Civilian - Veteran (%)
Armed forces status - Civilian - Nonveteran (%)
Fatal accidents locations in years 2005-2021
Fatal accidents locations in 2005
Fatal accidents locations in 2006
Fatal accidents locations in 2007
Fatal accidents locations in 2008
Fatal accidents locations in 2009
Fatal accidents locations in 2010
Fatal accidents locations in 2011
Fatal accidents locations in 2012
Fatal accidents locations in 2013
Fatal accidents locations in 2014
Fatal accidents locations in 2015
Fatal accidents locations in 2016
Fatal accidents locations in 2017
Fatal accidents locations in 2018
Fatal accidents locations in 2019
Fatal accidents locations in 2020
Fatal accidents locations in 2021
Alcohol use - People drinking some alcohol every month (%)
Alcohol use - People not drinking at all (%)
Alcohol use - Average days/month drinking alcohol
Alcohol use - Average drinks/week
Alcohol use - Average days/year people drink much
Audiometry - Average condition of hearing (%)
Audiometry - People that can hear a whisper from across a quiet room (%)
Audiometry - People that can hear normal voice from across a quiet room (%)
Audiometry - Ears ringing, roaring, buzzing (%)
Audiometry - Had a job exposure to loud noise (%)
Audiometry - Had off-work exposure to loud noise (%)
Blood Pressure & Cholesterol - Has high blood pressure (%)
Blood Pressure & Cholesterol - Checking blood pressure at home (%)
Blood Pressure & Cholesterol - Frequently checking blood cholesterol (%)
Blood Pressure & Cholesterol - Has high cholesterol level (%)
Consumer Behavior - Money monthly spent on food at supermarket/grocery store
Consumer Behavior - Money monthly spent on food at other stores
Consumer Behavior - Money monthly spent on eating out
Consumer Behavior - Money monthly spent on carryout/delivered foods
Consumer Behavior - Income spent on food at supermarket/grocery store (%)
Consumer Behavior - Income spent on food at other stores (%)
Consumer Behavior - Income spent on eating out (%)
Consumer Behavior - Income spent on carryout/delivered foods (%)
Current Health Status - General health condition (%)
Current Health Status - Blood donors (%)
Current Health Status - Has blood ever tested for HIV virus (%)
Current Health Status - Left-handed people (%)
Dermatology - People using sunscreen (%)
Diabetes - Diabetics (%)
Diabetes - Had a blood test for high blood sugar (%)
Diabetes - People taking insulin (%)
Diet Behavior & Nutrition - Diet health (%)
Diet Behavior & Nutrition - Milk product consumption (# of products/month)
Diet Behavior & Nutrition - Meals not home prepared (#/week)
Diet Behavior & Nutrition - Meals from fast food or pizza place (#/week)
Diet Behavior & Nutrition - Ready-to-eat foods (#/month)
Diet Behavior & Nutrition - Frozen meals/pizza (#/month)
Drug Use - People that ever used marijuana or hashish (%)
Drug Use - Ever used hard drugs (%)
Drug Use - Ever used any form of cocaine (%)
Drug Use - Ever used heroin (%)
Drug Use - Ever used methamphetamine (%)
Health Insurance - People covered by health insurance (%)
Kidney Conditions-Urology - Avg. # of times urinating at night
Medical Conditions - People with asthma (%)
Medical Conditions - People with anemia (%)
Medical Conditions - People with psoriasis (%)
Medical Conditions - People with overweight (%)
Medical Conditions - Elderly people having difficulties in thinking or remembering (%)
Medical Conditions - People who ever received blood transfusion (%)
Medical Conditions - People having trouble seeing even with glass/contacts (%)
Medical Conditions - People with arthritis (%)
Medical Conditions - People with gout (%)
Medical Conditions - People with congestive heart failure (%)
Medical Conditions - People with coronary heart disease (%)
Medical Conditions - People with angina pectoris (%)
Medical Conditions - People who ever had heart attack (%)
Medical Conditions - People who ever had stroke (%)
Medical Conditions - People with emphysema (%)
Medical Conditions - People with thyroid problem (%)
Medical Conditions - People with chronic bronchitis (%)
Medical Conditions - People with any liver condition (%)
Medical Conditions - People who ever had cancer or malignancy (%)
Mental Health - People who have little interest in doing things (%)
Mental Health - People feeling down, depressed, or hopeless (%)
Mental Health - People who have trouble sleeping or sleeping too much (%)
Mental Health - People feeling tired or having little energy (%)
Mental Health - People with poor appetite or overeating (%)
Mental Health - People feeling bad about themself (%)
Mental Health - People who have trouble concentrating on things (%)
Mental Health - People moving or speaking slowly or too fast (%)
Mental Health - People having thoughts they would be better off dead (%)
Oral Health - Average years since last visit a dentist
Oral Health - People embarrassed because of mouth (%)
Oral Health - People with gum disease (%)
Oral Health - General health of teeth and gums (%)
Oral Health - Average days a week using dental floss/device
Oral Health - Average days a week using mouthwash for dental problem
Oral Health - Average number of teeth
Pesticide Use - Households using pesticides to control insects (%)
Pesticide Use - Households using pesticides to kill weeds (%)
Physical Activity - People doing vigorous-intensity work activities (%)
Physical Activity - People doing moderate-intensity work activities (%)
Physical Activity - People walking or bicycling (%)
Physical Activity - People doing vigorous-intensity recreational activities (%)
Physical Activity - People doing moderate-intensity recreational activities (%)
Physical Activity - Average hours a day doing sedentary activities
Physical Activity - Average hours a day watching TV or videos
Physical Activity - Average hours a day using computer
Physical Functioning - People having limitations keeping them from working (%)
Physical Functioning - People limited in amount of work they can do (%)
Physical Functioning - People that need special equipment to walk (%)
Physical Functioning - People experiencing confusion/memory problems (%)
Physical Functioning - People requiring special healthcare equipment (%)
Prescription Medications - Average number of prescription medicines taking
Preventive Aspirin Use - Adults 40+ taking low-dose aspirin (%)
Reproductive Health - Vaginal deliveries (%)
Reproductive Health - Cesarean deliveries (%)
Reproductive Health - Deliveries resulted in a live birth (%)
Reproductive Health - Pregnancies resulted in a delivery (%)
Reproductive Health - Women breastfeeding newborns (%)
Reproductive Health - Women that had a hysterectomy (%)
Reproductive Health - Women that had both ovaries removed (%)
Reproductive Health - Women that have ever taken birth control pills (%)
Reproductive Health - Women taking birth control pills (%)
Reproductive Health - Women that have ever used Depo-Provera or injectables (%)
Reproductive Health - Women that have ever used female hormones (%)
Sexual Behavior - People 18+ that ever had sex (vaginal, anal, or oral) (%)
Sexual Behavior - Males 18+ that ever had vaginal sex with a woman (%)
Sexual Behavior - Males 18+ that ever performed oral sex on a woman (%)
Sexual Behavior - Males 18+ that ever had anal sex with a woman (%)
Sexual Behavior - Males 18+ that ever had any sex with a man (%)
Sexual Behavior - Females 18+ that ever had vaginal sex with a man (%)
Sexual Behavior - Females 18+ that ever performed oral sex on a man (%)
Sexual Behavior - Females 18+ that ever had anal sex with a man (%)
Sexual Behavior - Females 18+ that ever had any kind of sex with a woman (%)
Sexual Behavior - Average age people first had sex
Sexual Behavior - Average number of female sex partners in lifetime (males 18+)
Sexual Behavior - Average number of female vaginal sex partners in lifetime (males 18+)
Sexual Behavior - Average age people first performed oral sex on a woman (18+)
Sexual Behavior - Average number of woman performed oral sex on in lifetime (18+)
Sexual Behavior - Average number of male sex partners in lifetime (males 18+)
Sexual Behavior - Average number of male anal sex partners in lifetime (males 18+)
Sexual Behavior - Average age people first performed oral sex on a man (18+)
Sexual Behavior - Average number of male oral sex partners in lifetime (18+)
Sexual Behavior - People using protection when performing oral sex (%)
Sexual Behavior - Average number of times people have vaginal or anal sex a year
Sexual Behavior - People having sex without condom (%)
Sexual Behavior - Average number of male sex partners in lifetime (females 18+)
Sexual Behavior - Average number of male vaginal sex partners in lifetime (females 18+)
Sexual Behavior - Average number of female sex partners in lifetime (females 18+)
Sexual Behavior - Circumcised males 18+ (%)
Sleep Disorders - Average hours sleeping at night
Sleep Disorders - People that has trouble sleeping (%)
Smoking-Cigarette Use - People smoking cigarettes (%)
Taste & Smell - People 40+ having problems with smell (%)
Taste & Smell - People 40+ having problems with taste (%)
Taste & Smell - People 40+ that ever had wisdom teeth removed (%)
Taste & Smell - People 40+ that ever had tonsils teeth removed (%)
Taste & Smell - People 40+ that ever had a loss of consciousness because of a head injury (%)
Taste & Smell - People 40+ that ever had a broken nose or other serious injury to face or skull (%)
Taste & Smell - People 40+ that ever had two or more sinus infections (%)
Weight - Average height (inches)
Weight - Average weight (pounds)
Weight - Average BMI
Weight - People that are obese (%)
Weight - People that ever were obese (%)
Weight - People trying to lose weight (%)
Officers per 1,000 residents here:
2.20Pennsylvania average:
2.55
Latest news from Fleetwood, PA collected exclusively by city-data.com from local newspapers, TV, and radio stations
Ancestries: German (48.3%), Pennsylvania German (9.0%), Polish (5.0%), American (4.6%), Irish (4.5%), Italian (4.2%).
Current Local Time:
Incorporated on 10/04/1873
Land area: 1.04 square miles.
Population density: 3,880 people per square mile (average).
160 residents are foreign born (3.2% Latin America , 0.4% Europe ).
This borough:
3.9%Pennsylvania:
7.3%
Median real estate property taxes paid for housing units with mortgages in 2022: $3,595 (1.6%)Median real estate property taxes paid for housing units with no mortgage in 2022: $3,693 (1.6%)
Nearest city with pop. 50,000+: Reading, PA
Nearest city with pop. 200,000+: Philadelphia, PA
Nearest cities:
Latitude: 40.45 N, Longitude: 75.82 W
Unemployment in December 2023: Here:
3.0%Pennsylvania:
2.9%
Population change in the 1990s: +512 (+14.6%).
Most common industries in Fleetwood, PA (%)
Both Males Females
Electrical equipment, appliances, components (8.4%)
Educational services (8.0%)
Health care (5.8%)
Finance & insurance (5.0%)
Accommodation & food services (3.5%)
Metal & metal products (3.5%)
Religious, grantmaking, civic, professional, similar organizations (3.2%)
Electrical equipment, appliances, components (12.5%)
Metal & metal products (6.2%)
Construction (4.9%)
Educational services (4.7%)
Nonmetallic mineral products (3.9%)
Transportation equipment (3.1%)
Chemicals (3.1%)
Educational services (11.5%)
Health care (9.5%)
Finance & insurance (8.2%)
Social assistance (5.7%)
Food & beverage stores (4.5%)
Religious, grantmaking, civic, professional, similar organizations (4.2%)
Accommodation & food services (4.2%)
Most common occupations in Fleetwood, PA (%)
Both Males Females
Other production occupations, including supervisors (7.8%)
Metal workers and plastic workers (4.5%)
Material recording, scheduling, dispatching, and distributing workers (4.4%)
Other office and administrative support workers, including supervisors (3.5%)
Secretaries and administrative assistants (3.4%)
Laborers and material movers, hand (3.3%)
Building and grounds cleaning and maintenance occupations (3.1%)
Other production occupations, including supervisors (9.1%)
Metal workers and plastic workers (8.5%)
Electrical equipment mechanics and other installation, maintenance, and repair workers, including supervisors (5.8%)
Vehicle and mobile equipment mechanics, installers, and repairers (5.1%)
Material recording, scheduling, dispatching, and distributing workers (4.9%)
Laborers and material movers, hand (4.8%)
Building and grounds cleaning and maintenance occupations (4.4%)
Other office and administrative support workers, including supervisors (7.1%)
Secretaries and administrative assistants (7.0%)
Other production occupations, including supervisors (6.4%)
Bookkeeping, accounting, and auditing clerks (5.6%)
Preschool, kindergarten, elementary, and middle school teachers (4.6%)
Material recording, scheduling, dispatching, and distributing workers (4.0%)
Financial clerks, except bookkeeping, accounting and auditing clerks (3.8%)
Tornado activity:
Fleetwood-area historical tornado activity is slightly above Pennsylvania state average. It is 11% greater than the overall U.S. average.
On 5/31/1998, a category F3 (max. wind speeds 158-206 mph) tornado 4.6 miles away from the Fleetwood borough center injured 7 people and caused $1 million in damages.
On 11/4/1950, a category F3 tornado 7.0 miles away from the borough center injured one person and caused between $50,000 and $500,000 in damages.
Earthquake activity:
Fleetwood-area historical earthquake activity is significantly above Pennsylvania state average. It is 65% smaller than the overall U.S. average. On 8/23/2011 at 17:51:04, a magnitude 5.8 (5.8 MW, Depth: 3.7 mi, Class: Moderate, Intensity: VI - VII) earthquake occurred 209.5 miles away from the city center On 1/16/1994 at 01:49:16, a magnitude 4.6 (4.6 MB, 4.6 LG, Depth: 3.1 mi, Class: Light, Intensity: IV - V) earthquake occurred 14.4 miles away from the city center On 1/16/1994 at 00:42:43, a magnitude 4.2 (4.2 MB, 4.0 LG, Depth: 3.1 mi) earthquake occurred 13.3 miles away from Fleetwood center On 10/7/1983 at 10:18:46, a magnitude 5.3 (5.1 MB, 5.3 LG, 5.1 ML) earthquake occurred 253.5 miles away from the city center On 9/25/1998 at 19:52:52, a magnitude 5.2 (4.8 MB, 4.3 MS, 5.2 LG, 4.5 MW, Depth: 3.1 mi) earthquake occurred 249.5 miles away from Fleetwood center On 4/20/2002 at 10:50:47, a magnitude 5.3 (5.3 ML, Depth: 3.0 mi) earthquake occurred 300.8 miles away from Fleetwood center Magnitude types: regional Lg-wave magnitude (LG), body-wave magnitude (MB), local magnitude (ML), surface-wave magnitude (MS), moment magnitude (MW) Natural disasters: The number of natural disasters in Berks County (19) is greater than the US average (15).Major Disasters (Presidential) Declared: 15Emergencies Declared: 4Floods: 5, Storms: 5, Tropical Storms: 4, Hurricanes: 3, Winter Storms: 3, Snowstorms: 2, Blizzard: 1, Heavy Rain: 1, Mudslide: 1, Snowfall: 1, Tornado: 1, Water Shortage: 1, Other: 1 (Note: some incidents may be assigned to more than one category). Hospitals and medical centers near Fleetwood: KUTZTOWN MANOR (Nursing Home, about 5 miles away; KUTZTOWN, PA)
FRESENIUS MEDICAL CARE KUTZTOWN (Dialysis Facility, about 5 miles away; KUTZTOWN, PA)
MANORCARE HEALTH SERVICES-LAURELDALE (Nursing Home, about 7 miles away; LAURELDALE, PA)
LEADER NSG/REHAB LAURELDALE (Nursing Home, about 7 miles away; READING, PA)
READING DIALYSIS CENTER (Dialysis Facility, about 10 miles away; READING, PA)
DIAKON HOSPICE SAINT JOHN (Hospital, about 10 miles away; WYOMISSING, PA)
ST JOSEPH TRANSITIONAL LOC CTR (Nursing Home, about 10 miles away; READING, PA)
Operable nuclear power plants near Fleetwood:
18 miles: Limerick 1 and 2 in Pottstown, PA.
Colleges/universities with over 2000 students nearest to Fleetwood:
Kutztown University of Pennsylvania (about 5 miles; Kutztown, PA ; Full-time enrollment: 9,099)
Albright College (about 9 miles; Reading, PA ; FT enrollment: 2,319)
Reading Area Community College (about 11 miles; Reading, PA ; FT enrollment: 2,941)
Pennsylvania State University-Penn State Berks (about 11 miles; Reading, PA ; FT enrollment: 2,605)
Alvernia University (about 12 miles; Reading, PA ; FT enrollment: 2,461)
Lehigh Carbon Community College (about 19 miles; Schnecksville, PA ; FT enrollment: 4,391)
Muhlenberg College (about 20 miles; Allentown, PA ; FT enrollment: 2,792)
Public high school in Fleetwood: FLEETWOOD SHS Students: 887, Location: 803 N RICHMOND ST, Grades: 7-12)Public elementary/middle schools in Fleetwood: FLEETWOOD MS Students: 833, Location: 407 N RICHMOND ST, Grades: 5-8)RICHMOND EL SCH Students: 225, Location: 14432 KUTZTOWN ROAD, Grades: KG-4)WILLOW CREEK EL SCH Location: 605 CRISSCROSS RD, Grades: KG-4)
Private elementary/middle schools in Fleetwood: FLEETWOOD CHRISTIAN DAY SCHOOL Students: 53, Location: 1083 RICHMOND RD, Grades: KG-8)
OAK HAVEN SCHOOL Students: 32, Location: 59 SHORT LN, Grades: 1-8)
WILLOW CREEK MENNONITE SCHOOL Students: 18, Location: 1050 RICHMOND RD, Grades: 1-8)
WHITE OAK RIDGE SCHOOL Students: 15, Location: 1311 RICHMOND RD, Grades: 1-7)
See full list of schools located in Fleetwood Library in Fleetwood: FLEETWOOD AREA PUBLIC LIBRARY Operating income: $127,445; Location: 110 W ARCH ST; 20,094 books ; 1,768 audio materials ; 2,766 video materials ; 41 state licensed databases ; 7 other licensed databases ; 26 print serial subscriptions )
Birthplace of: Manan Trivedi - Soilder, Bobby Rothermel - Major League Baseball player, Clyde Dengler - Politician.
Berks County has a predicted average indoor radon screening level greater than 4 pCi/L (pico curies per liter) - Highest Potential Drinking water stations with addresses in Fleetwood and their reported violations in the past:
PRICETOWN ROAD SUNOCO (Population served: 900, Groundwater):
Past health violations:
MCL, Monthly (TCR) - In FEB-2014, Contaminant: Coliform. Follow-up actions: St Public Notif requested (MAR-31-2014), St Public Notif received (MAR-31-2014), St Compliance achieved (MAR-31-2014), St Formal NOV issued (MAR-31-2014)
MCL, Monthly (TCR) - Between JAN-2014 and MAR-2014, Contaminant: Coliform. Follow-up actions: St Public Notif requested (FEB-27-2014), St Public Notif received (FEB-27-2014), St Compliance achieved (FEB-27-2014), St Formal NOV issued (FEB-27-2014)
MCL, Monthly (TCR) - Between OCT-2013 and DEC-2013, Contaminant: Coliform. Follow-up actions: St Public Notif requested (NOV-21-2013), St Public Notif received (NOV-21-2013), St Compliance achieved (NOV-21-2013), St Formal NOV issued (NOV-21-2013)
Past monitoring violations:
Monitoring, Source Water (GWR) - Between JAN-22-2014 and FEB-22-2014, Contaminant: E. COLI. Follow-up actions: St Public Notif received (FEB-27-2014), St Compliance achieved (FEB-27-2014), St Violation/Reminder Notice (FEB-27-2014), St Public Notif requested (FEB-27-2014)
One routine major monitoring violation
Population served: 500, Groundwater):
Past health violations:
MCL, Monthly (TCR) - In JAN-2008, Contaminant: Coliform. Follow-up actions: St Public Notif requested (MAR-04-2008), St Public Notif received (MAR-04-2008), St Compliance achieved (MAR-04-2008), St Formal NOV issued (MAR-04-2008)
Past monitoring violations:
2 routine major monitoring violations
One regular monitoring violation
Population served: 500, Groundwater):
Past health violations:
MCL, Monthly (TCR) - In NOV-2005, Contaminant: Coliform. Follow-up actions: St Public Notif requested (MAR-21-2006), St Public Notif received (MAR-21-2006), St Compliance achieved (MAR-21-2006), St Formal NOV issued (MAR-21-2006)
Past monitoring violations:
2 regular monitoring violations
Population served: 240, Groundwater):
Past health violations:
MCL, Monthly (TCR) - Between JUL-2006 and SEP-2006, Contaminant: Coliform. Follow-up actions: St Public Notif requested (OCT-04-2006), St Public Notif received (OCT-04-2006), St Compliance achieved (OCT-04-2006), St Formal NOV issued (OCT-04-2006)
Population served: 215, Groundwater):
Past health violations:
MCL, Monthly (TCR) - Between JUL-2012 and SEP-2012, Contaminant: Coliform. Follow-up actions: St Public Notif requested (AUG-22-2012), St Formal NOV issued (AUG-22-2012), St Compliance achieved (AUG-23-2012), St Public Notif received (AUG-23-2012)
MCL, Monthly (TCR) - Between JUL-2011 and SEP-2011, Contaminant: Coliform. Follow-up actions: St Public Notif requested (AUG-24-2011), St Public Notif received (AUG-24-2011), St Compliance achieved (AUG-24-2011), St Formal NOV issued (AUG-24-2011)
Past monitoring violations:
One routine major monitoring violation
One minor monitoring violation
Population served: 200, Groundwater):
Past health violations:
MCL, Monthly (TCR) - Between APR-2010 and JUN-2010, Contaminant: Coliform. Follow-up actions: St Public Notif requested (JUN-04-2010), St Public Notif received (JUN-04-2010), St Compliance achieved (JUN-04-2010), St Formal NOV issued (JUN-04-2010)
Past monitoring violations:
Monitoring, Source Water (GWR) - Between MAY-19-2013 and JUN-19-2013, Contaminant: E. COLI. Follow-up actions: St Tech Assistance Visit (JUL-10-2013), St Compliance achieved (OCT-01-2013)
Population served: 150, Groundwater):
Past health violations:
MCL, Average - Between OCT-2011 and DEC-2011, Contaminant: Nitrate. Follow-up actions: St Public Notif requested (JAN-27-2012), St Formal NOV issued (JAN-27-2012), St Public Notif received (JAN-27-2012), St Compliance achieved (APR-16-2012)
MCL, Average - Between JUL-2011 and SEP-2011, Contaminant: Nitrate. Follow-up actions: St Formal NOV issued (NOV-21-2011), St Public Notif received (NOV-21-2011), St Public Notif requested (NOV-21-2011), St Compliance achieved (APR-16-2012)
MCL, Average - Between APR-2011 and JUN-2011, Contaminant: Nitrate. Follow-up actions: St Public Notif requested (AUG-08-2011), St Formal NOV issued (AUG-08-2011), St Public Notif received (AUG-16-2011), St Compliance achieved (APR-16-2012)
MCL, Average - Between JAN-2011 and MAR-2011, Contaminant: Nitrate. Follow-up actions: St Public Notif requested (APR-29-2011), St Formal NOV issued (APR-29-2011), St Public Notif received (APR-29-2011), St Compliance achieved (APR-16-2012)
MCL, Average - Between JUL-2010 and SEP-2010, Contaminant: Nitrate. Follow-up actions: St Public Notif requested (OCT-28-2010), St Formal NOV issued (OCT-28-2010), St Public Notif received (NOV-09-2010), St Compliance achieved (APR-16-2012)
MCL, Average - Between APR-2010 and JUN-2010, Contaminant: Nitrate. Follow-up actions: St Public Notif received (JUL-29-2010), St Formal NOV issued (JUL-29-2010), St Compliance achieved (JUL-29-2010), St Public Notif requested (JUL-29-2010)
2 other older health violations
Past monitoring violations:
4 routine major monitoring violations
2 regular monitoring violations
Population served: 150, Groundwater):
Past health violations:
MCL, Monthly (TCR) - Between OCT-2011 and DEC-2011, Contaminant: Coliform. Follow-up actions: St Public Notif requested (NOV-22-2011), St Formal NOV issued (NOV-22-2011), St Compliance achieved (FEB-06-2012), St Public Notif received (FEB-06-2012)
MCL, Monthly (TCR) - Between OCT-2009 and DEC-2009, Contaminant: Coliform. Follow-up actions: St Public Notif requested (JAN-07-2010), St Public Notif received (JAN-07-2010), St Compliance achieved (JAN-07-2010), St Formal NOV issued (JAN-07-2010)
Drinking water stations with addresses in Fleetwood that have no violations reported:
HESS EXPRESS (Population served: 518, Primary Water Source Type: Groundwater)
FLEETWOOD BIBLE CHURCH (Population served: 500, Primary Water Source Type: Groundwater)
NEW JERUSALEM UCC (Population served: 175, Primary Water Source Type: Groundwater)
SHEETZ MKT (Population served: 150, Primary Water Source Type: Groundwater)
TOUCHING THE FUTURE DAYCARE (Population served: 147, Primary Water Source Type: Groundwater)
RICH MAIDEN GOLF COURSE (Population served: 120, Primary Water Source Type: Groundwater)
WEAVERS HARDWARE CO (Population served: 50, Primary Water Source Type: Groundwater)
GASSERS GOLF SNACK BAR (Population served: 50, Primary Water Source Type: Groundwater)
REDNERS QUICK SHOPPE (Population served: 30, Primary Water Source Type: Groundwater)
WILLYS ICE CREAM PARLOR (Population served: 25, Primary Water Source Type: Groundwater)
Average household size: This borough:
2.4 peoplePennsylvania:
2.5 people
Percentage of family households: This borough:
68.2%Whole state:
65.0%
Percentage of households with unmarried partners: This borough:
8.4%Whole state:
6.6%
Likely homosexual households (counted as self-reported same-sex unmarried-partner households)
Lesbian couples: 0.3% of all households Gay men: 0.1% of all households
26 people in group homes intended for adults in 2010people in other noninstitutional group quarters in 2000
Banks with branches in Fleetwood (2011 data):
Susquehanna Bank: Fleetwood Branch at 46 W Main St, branch established on 1905/01/01. Info updated 2012/02/28: Bank assets: $14,849.0 mil, Deposits: $10,294.4 mil, headquarters in Lititz, PA, positive income , Commercial Lending Specialization, 308 total offices , Holding Company: Susquehanna Bancshares, Inc.
Fleetwood Bank: at Main And Franklin Streets, branch established on 1934/01/01. Info updated 2006/04/14: Bank assets: $229.8 mil, Deposits: $195.7 mil, local headquarters , positive income , 6 total offices , Holding Company: Fleetwood Bank Corporation
VIST Bank: Breezy Corners Office Branch at 3401-3 Pricetown Road, branch established on 1998/09/01. Info updated 2010/11/22: Bank assets: $1,414.6 mil, Deposits: $1,193.3 mil, headquarters in Wyomissing, PA, negative income in the last year , Commercial Lending Specialization, 26 total offices , Holding Company: Vist Financial Corp.
For population 15 years and over in Fleetwood:
Never married: 35.1%Now married: 41.7%Separated: 0.9%Widowed: 8.8%Divorced: 13.6% For population 25 years and over in Fleetwood:
High school or higher: 96.4%Bachelor's degree or higher: 20.2%Graduate or professional degree: 8.5%Unemployed: 2.5%Mean travel time to work (commute): 19.7 minutes
Education Gini index (Inequality in education) Here:
8.2Pennsylvania average:
11.4
Religion statistics for Fleetwood, PA (based on Berks County data)
Religion Adherents Congregations Mainline Protestant 80,575 177 Catholic 75,672 22 Evangelical Protestant 33,376 168 Other 3,996 23 Orthodox 2,275 5 Black Protestant 1,062 7 None 214,486 -
Source: Clifford Grammich, Kirk Hadaway, Richard Houseal, Dale E.Jones, Alexei Krindatch, Richie Stanley and Richard H.Taylor. 2012. 2010 U.S.Religion Census: Religious Congregations & Membership Study. Association of Statisticians of American Religious Bodies. Jones, Dale E., et al. 2002. Congregations and Membership in the United States 2000. Nashville, TN: Glenmary Research Center. Graphs represent county-level data
Food Environment Statistics: Number of grocery stores : 75This county :
1.87 / 10,000 pop.Pennsylvania :
2.04 / 10,000 pop.
Number of supercenters and club stores : 4Berks County :
0.10 / 10,000 pop.State :
0.09 / 10,000 pop.
Number of convenience stores (no gas) : 15This county :
0.37 / 10,000 pop.Pennsylvania :
0.88 / 10,000 pop.
Number of convenience stores (with gas) : 115Berks County :
2.86 / 10,000 pop.Pennsylvania :
2.52 / 10,000 pop.
Number of full-service restaurants : 252Berks County :
6.28 / 10,000 pop.Pennsylvania :
7.12 / 10,000 pop.
Adult diabetes rate : Berks County :
7.4%Pennsylvania :
9.1%
Adult obesity rate : Berks County :
28.0%State :
27.2%
Low-income preschool obesity rate : Berks County :
13.0%Pennsylvania :
11.5%
Health and Nutrition: Healthy diet rate : This city:
45.9%State:
50.2%
Average overall health of teeth and gums : This city:
39.1%Pennsylvania:
47.1%
People feeling badly about themselves : Here:
21.3%Pennsylvania:
20.8%
People not drinking alcohol at all : Fleetwood:
12.0%Pennsylvania:
10.9%
Average hours sleeping at night : This city:
6.8Pennsylvania:
6.8
Overweight people : Fleetwood:
34.6%Pennsylvania:
34.3%
General health condition : Fleetwood:
51.2%Pennsylvania:
56.2%
Average condition of hearing : Fleetwood:
75.5%Pennsylvania:
78.3%
More about Health and Nutrition of Fleetwood, PA Residents
Local government employment and payroll (March 2022)
Function
Full-time employees
Monthly full-time payroll
Average yearly full-time wage
Part-time employees
Monthly part-time payroll
Police Protection - Officers
8 $54,377 $81,566 4 $5,846 Water Supply
3 $22,869 $91,476 0 $0 Sewerage
2 $16,140 $96,840 0 $0 Financial Administration
2 $3,743 $22,458 0 $0 Streets and Highways
1 $7,196 $86,352 4 $2,385 Police - Other
1 $3,543 $42,516 2 $935 Other Government Administration
1 $3,521 $42,252 2 $602 Other and Unallocable
0 $0 2 $735
Totals for Government
18 $111,387 $74,258 14 $10,502
Fleetwood government finances - Expenditure in 2017 (per resident):
Current Operations - Police Protection: $927,000 ($229.51)
Water Utilities: $717,000 ($177.52)Sewerage: $698,000 ($172.82)Parks and Recreation: $423,000 ($104.73)Regular Highways: $403,000 ($99.78)Central Staff Services: $288,000 ($71.30)Housing and Community Development: $235,000 ($58.18)General - Other: $182,000 ($45.06)Local Fire Protection: $137,000 ($33.92)Libraries: $18,000 ($4.46)General - Interest on Debt: $75,000 ($18.57)
Fleetwood government finances - Revenue in 2017 (per resident):
Charges - Sewerage: $929,000 ($230.01)
Other: $519,000 ($128.50)Parks and Recreation: $75,000 ($18.57)Federal Intergovernmental - Other: $25,000 ($6.19)
Miscellaneous - Interest Earnings: $202,000 ($50.01)
Donations From Private Sources: $44,000 ($10.89)Fines and Forfeits: $33,000 ($8.17)General Revenue - Other: $1,000 ($0.25)Revenue - Water Utilities: $1,248,000 ($308.99)
State Intergovernmental - Other: $644,000 ($159.45)
Tax - Property: $939,000 ($232.48)
Individual Income: $537,000 ($132.95)Occupation and Business License - Other: $74,000 ($18.32)Documentary and Stock Transfer: $55,000 ($13.62)Public Utility License: $28,000 ($6.93)
Fleetwood government finances - Debt in 2017 (per resident):
Long Term Debt - Beginning Outstanding - Unspecified Public Purpose: $1,875,000 ($464.22)
Outstanding Unspecified Public Purpose: $1,771,000 ($438.47)Retired Unspecified Public Purpose: $104,000 ($25.75)
Fleetwood government finances - Cash and Securities in 2017 (per resident):
Other Funds - Cash and Securities: $4,494,000 ($1112.65)
4.47% of this county's 2021 resident taxpayers lived in other counties in 2020 ($58,739 average adjusted gross income )
Here:
4.47%Pennsylvania average:
5.27%
0.02% of residents moved from foreign countries ($86 average AGI )Berks County:
0.02%Pennsylvania average:
0.01%
Top counties from which taxpayers relocated into this county between 2020 and 2021:
4.50% of this county's 2020 resident taxpayers moved to other counties in 2021 ($60,184 average adjusted gross income )
Here:
4.50%Pennsylvania average:
5.44%
0.02% of residents moved to foreign countries ($95 average AGI )Berks County:
0.02%Pennsylvania average:
0.01%
Top counties to which taxpayers relocated from this county between 2020 and 2021:
Businesses in Fleetwood, PA
Name Count Name Count
Ace Hardware 1 MasterBrand Cabinets 1 Curves 1 Penske 1 Dunkin Donuts 1 YMCA 1 Kroger 1
Strongest AM radio stations in Fleetwood:
WEEU (830 AM; 20 kW; READING, PA; Owner: WEEU BROADCASTING COMPANY)
WWJZ (640 AM; 50 kW; MOUNT HOLLY, NJ; Owner: ABC, INC.)
WZZD (990 AM; 50 kW; PHILADELPHIA, PA; Owner: PENNSYLVANIA MEDIA ASSOCIATES, INC.)
KYW (1060 AM; 50 kW; PHILADELPHIA, PA; Owner: INFINITY BROADCASTING OPERATIONS, INC.)
WVCH (740 AM; 50 kW; CHESTER, PA; Owner: WVCH COMMUNICATIONS, INC.)
WPEN (950 AM; 50 kW; PHILADELPHIA, PA; Owner: GREATER PHILADELPHIA RADIO, INC.)
WNWR (1540 AM; 50 kW; PHILADELPHIA, PA)
WPHT (1210 AM; 50 kW; PHILADELPHIA, PA; Owner: INFINITY BROADCASTING OPERATIONS, INC.)
WWDB (860 AM; daytime; 10 kW; PHILADELPHIA, PA)
WAEB (790 AM; 4 kW; ALLENTOWN, PA; Owner: CAPSTAR TX LIMITED PARTNERSHIP)
WMCA (570 AM; 50 kW; NEW YORK, NY; Owner: SALEM MEDIA OF NEW YORK, LLC)
WTKZ (1320 AM; 5 kW; ALLENTOWN, PA; Owner: MEGA COMMUNICATIONS OF ALLENTOWN LICENSEE, L.L.C.)
WCBM (680 AM; 50 kW; BALTIMORE, MD; Owner: WCBM MARYLAND, INC.)
Strongest FM radio stations in Fleetwood:
WRFY-FM (102.5 FM; READING, PA; Owner: CLEAR CHANNEL BROADCASTING LICENSES, INC.)
WBYN (107.5 FM; BOYERTOWN, PA; Owner: WDAC RADIO COMPANY)
WIOV-FM1 (105.1 FM; READING, PA; Owner: REGENT BROADCASTING OF LANCASTER, INC.)
WLEV (100.7 FM; ALLENTOWN, PA; Owner: CITADEL BROADCASTING COMPANY)
W290AC (105.9 FM; PALMERTON, PA; Owner: FAMILY STATIONS, INC.)
WDIY (88.1 FM; ALLENTOWN, PA; Owner: LEHIGH VALLEY COMMUNITY BR/CST ASSOC)
WRTL (90.7 FM; EPHRATA, PA; Owner: TEMPLE UNIV OF COMMONWEALTH SYSTEM)
WJCS (89.3 FM; ALLENTOWN, PA; Owner: BEACON BROADCASTING CORPORATION)
WIOV-FM (105.1 FM; EPHRATA, PA; Owner: REGENT BROADCASTING OF LANCASTER, INC.)
W278AI (103.5 FM; CENTER VALLEY, PA; Owner: BUX-MONT EDUCATIONAL RADIO ASSOCIATION)
WBMP (88.1 FM; WARWICK, PA; Owner: FOUR RIVERS COMMUNITY BROADCASTING CORP.)
W224AU (92.7 FM; ALLENTOWN, PA; Owner: MERCER COUNTY COMMUNITY COLLEGE)
W246AA (97.1 FM; ALLENTOWN, ETC., PA; Owner: TEMPLE UNIV. OF THE COMMONWEALTH,ETC)
WBSX (97.9 FM; HAZLETON, PA; Owner: CITADEL BROADCASTING COMPANY)
WPLY (100.3 FM; MEDIA, PA; Owner: RADIO ONE LICENSES, LLC)
WAEB-FM (104.1 FM; ALLENTOWN, PA; Owner: CAPSTAR TX LIMITED PARTNERSHIP)
WMWX (95.7 FM; PHILADELPHIA, PA; Owner: GREATER PHILADELPHIA RADIO, INC.)
WMGK (102.9 FM; PHILADELPHIA, PA; Owner: GREATER PHILADELPHIA RADIO, INC.)
WWPJ (89.5 FM; PEN ARGYL, PA; Owner: MERCER COUNTY COMMUNITY COLLEGE)
WOGL (98.1 FM; PHILADELPHIA, PA; Owner: INFINITY BROADCASTING OPERATIONS, INC.)
TV broadcast stations around Fleetwood:
WTVE (Channel 51; READING, PA; Owner: READING BROADCASTING, INC.)
WFMZ-TV (Channel 69; ALLENTOWN, PA; Owner: MARANATHA BROADCASTING COMPANY, INC.)
KYW-TV (Channel 3; PHILADELPHIA, PA; Owner: CBS BROADCASTING INC.)
WPHL-TV (Channel 17; PHILADELPHIA, PA; Owner: TRIBUNE TELEVISION COMPANY)
WPPX (Channel 61; WILMINGTON, DE; Owner: PAXSON PHILADELPHIA LICENSE, INC.)
WLVT-TV (Channel 39; ALLENTOWN, PA; Owner: LEHIGH VALLEY PUBLIC TELECOMMUNICATIONS CORP.)
WPVI-TV (Channel 6; PHILADELPHIA, PA; Owner: ABC, INC.)
WLYH-TV (Channel 15; LANCASTER, PA; Owner: TELEVISION STATION GROUP LICENSE SUBSIDIARY, LLC)
WPSG (Channel 57; PHILADELPHIA, PA; Owner: VIACOM STATIONS GROUP OF PHILADELPHIA INC.)
WCAU (Channel 10; PHILADELPHIA, PA; Owner: NBC SUBSIDIARY (WCAU-TV), L.P.)
WBPH-TV (Channel 60; BETHLEHEM, PA; Owner: SONSHINE FAMILY TELEVISION CORPORATION)
W07DC (Channel 7; ALLENTOWN/BETHLEHEM, PA; Owner: NEW YORK TIMES MANAGEMENT SERVICES)
WGTW (Channel 48; BURLINGTON, NJ; Owner: BRUNSON COMMUNICATIONS, INC.)
WYBE (Channel 35; PHILADELPHIA, PA; Owner: INDEPENDENCE PUBLIC MEDIA OF PHILADELPHIA, INC.)
WHYY-TV (Channel 12; WILMINGTON, DE; Owner: WHYY, INC.)
WTXF-TV (Channel 29; PHILADELPHIA, PA; Owner: FOX TV STATIONS OF PHILADELPHIA)
W46BL (Channel 46; ALLENTOWN-BETHLEHEM, PA; Owner: MARANATHA BROADCASTING COMPANY, INC.)
W24CS (Channel 24; READING, PA; Owner: WITF, INC.)
Fleetwood fatal accident statistics for 1975 - 2021
Fleetwood fatal accident list:
Jan 22, 2017 06:19 AM, Sr-1010 Fleetwood Lyons Rd, Lat: 40.476647, Lon: -75.783703, Vehicles: 1, Persons: 1, Fatalities: 1, Drunk persons involved: 1Lat: 40.447742, Lon: -75.815867, Vehicles: 1, Persons: 1, Fatalities: 1, Drunk persons involved: 1Vehicles: 1, Persons: 1, Fatalities: 1Vehicles: 1, Persons: 1, Fatalities: 1, Drunk persons involved: 1Vehicles: 1, Persons: 1, Fatalities: 1Vehicles: 1, Persons: 1, Fatalities: 1, Drunk persons involved: 1
National Bridge Inventory (NBI) Statistics 8 Number of bridges26ft / 8.3m Total length $590,000 Total costs74,603 Total average daily traffic21,684 Total average daily truck traffic91,032 Total future (year 2019) average daily traffic
FCC Registered Antenna Towers: 28 (
See the full list of FCC Registered Antenna Towers in Fleetwood )
FCC Registered Broadcast Land Mobile Towers: 7
3600 E Reservoir 1 (Lat: 40.430083 Lon: -75.813806), Type: Building, Structure height: 2 m, Overall height: 15 m, Call Sign: WNYB716, Assigned Frequencies: 154.456 MHz, Grant Date: 12/08/2011, Expiration Date: 12/23/2021, Cancellation Date: 02/26/2022, Certifier: Gary Esling, Registrant: American Radio & Microwave Corporat, 207 Old Mill Rd, Royersford, PA 19468-2716, Fax: (610) 948-0271 2100 Ft N Reservoir 1 (Lat: 40.445944 Lon: -75.303778), Structure height: 6 m, Call Sign: WNXX714, Licensee ID: L00123008, Assigned Frequencies: 173.262 MHz, Grant Date: 12/08/2011, Expiration Date: 12/16/2021, Cancellation Date: 02/19/2022, Registrant: Fleetwood, Borough Of, 110 W. Arch St, Suite 104, Fleetwood, PA 19522, Phone: (610) 944-8220, Fax: (610) 944-9054, Email:
900 Ft Sw Reservoir 1 (Lat: 40.442028 Lon: -75.804917), Structure height: 6 m, Call Sign: WNZA793, Licensee ID: L00123008, Assigned Frequencies: 173.262 MHz, Grant Date: 02/16/2012, Expiration Date: 04/08/2022, Cancellation Date: 06/11/2022, Registrant: Fleetwood, Borough Of, 110 N Arch St Ste 104, Fleetwood, PA 19522, Phone: (610) 944-8220, Fax: (610) 944-9054, Email:
Lat: 40.452500 Lon: -75.818333, Call Sign: WQHG667, Assigned Frequencies: 451.312 MHz, Grant Date: 07/24/2007, Expiration Date: 07/24/2017, Cancellation Date: 09/23/2017, Certifier: Jamie Guzman, Registrant: Triangle Communications, Inc., 940 West Main Street, New Holland, PA 17557-9391, Phone: (717) 656-2211, Fax: (717) 656-3458, Email:
Lat: 40.476917 Lon: -75.886111, Call Sign: WQMH755, Assigned Frequencies: 451.237 MHz, 451.412 MHz, 451.562 MHz, 452.062 MHz, 452.312 MHz, Grant Date: 06/24/2020, Expiration Date: 08/10/2030, Certifier: Bill Sheeler, Registrant: Triangle Communications, Inc., 940 West Main Street, New Holland, PA 17557-9391, Phone: (717) 656-2211, Fax: (717) 656-3458, Email:
Lat: 40.466500 Lon: -75.821972, Call Sign: WQSS838, Assigned Frequencies: 457.762 MHz, 462.487 MHz, 467.187 MHz, 467.487 MHz, Grant Date: 11/08/2013, Expiration Date: 11/08/2023, Cancellation Date: 01/13/2024, Certifier: Pete Avram, Registrant: Triangle Communications, Inc., 3201 Montrose Ave, Reading, PA 19605, Phone: (610) 929-4211, Fax: (610) 929-5216, Email:
Lat: 40.414917 Lon: -75.857889, Call Sign: WRXY904, Assigned Frequencies: 451.687 MHz, 452.862 MHz, 456.687 MHz, 456.712 MHz, 457.862 MHz, Grant Date: 07/12/2023, Expiration Date: 07/12/2033, Certifier: Troy Lengel, Registrant: Radio Maintenance, Inc., 1840 Kutztown Rd., Reading, PA 19604, Phone: (610) 898-1211, Fax: (610) 898-1223, Email:
FCC Registered Microwave Towers: 10 (
See the full list of FCC Registered Microwave Towers in this town )
FCC Registered Amateur Radio Licenses: 63 (
See the full list of FCC Registered Amateur Radio Licenses in Fleetwood )
FAA Registered Aircraft: 11 (
See the full list of FAA Registered Aircraft in Fleetwood )
Home Mortgage Disclosure Act Aggregated Statistics For Year 2009(Based on 1 full tract) A) FHA, FSA/RHS & VA B) Conventional C) Refinancings D) Home Improvement Loans F) Non-occupant Loans on Number Average Value Number Average Value Number Average Value Number Average Value Number Average Value
LOANS ORIGINATED 38 $139,421 16 $136,875 83 $128,012 17 $61,059 2 $94,000 APPLICATIONS APPROVED, NOT ACCEPTED 0 $0 0 $0 9 $141,000 1 $9,000 1 $113,000 APPLICATIONS DENIED 4 $150,500 1 $160,000 40 $137,700 1 $10,000 4 $116,250 APPLICATIONS WITHDRAWN 2 $152,500 2 $98,000 18 $140,833 2 $121,500 1 $114,000 FILES CLOSED FOR INCOMPLETENESS 2 $105,500 0 $0 3 $158,000 0 $0 0 $0
Aggregated Statistics For Year 2008(Based on 1 full tract) A) FHA, FSA/RHS & VA B) Conventional C) Refinancings D) Home Improvement Loans E) Loans on Dwellings For 5+ Families F) Non-occupant Loans on Number Average Value Number Average Value Number Average Value Number Average Value Number Average Value Number Average Value
LOANS ORIGINATED 18 $144,722 26 $113,885 68 $106,941 23 $42,565 1 $540,000 12 $128,417 APPLICATIONS APPROVED, NOT ACCEPTED 0 $0 3 $45,000 5 $114,400 2 $86,500 0 $0 1 $127,000 APPLICATIONS DENIED 1 $169,000 5 $120,000 43 $118,372 9 $71,556 0 $0 0 $0 APPLICATIONS WITHDRAWN 2 $150,500 2 $114,000 13 $135,231 0 $0 0 $0 0 $0 FILES CLOSED FOR INCOMPLETENESS 0 $0 1 $150,000 3 $181,667 0 $0 0 $0 0 $0
Aggregated Statistics For Year 2007(Based on 1 full tract) A) FHA, FSA/RHS & VA B) Conventional C) Refinancings D) Home Improvement Loans E) Loans on Dwellings For 5+ Families F) Non-occupant Loans on G) Loans On Manufactured Number Average Value Number Average Value Number Average Value Number Average Value Number Average Value Number Average Value Number Average Value
LOANS ORIGINATED 9 $150,444 58 $121,810 76 $104,408 38 $38,789 0 $0 3 $83,667 0 $0 APPLICATIONS APPROVED, NOT ACCEPTED 0 $0 8 $116,375 9 $116,444 3 $51,333 0 $0 1 $89,000 3 $51,667 APPLICATIONS DENIED 1 $135,000 14 $105,571 56 $109,625 12 $61,500 0 $0 4 $93,500 3 $73,667 APPLICATIONS WITHDRAWN 0 $0 3 $114,667 21 $130,238 4 $66,000 1 $165,000 2 $91,000 0 $0 FILES CLOSED FOR INCOMPLETENESS 0 $0 2 $114,500 4 $133,500 0 $0 0 $0 1 $109,000 0 $0
Aggregated Statistics For Year 2006(Based on 1 full tract) A) FHA, FSA/RHS & VA B) Conventional C) Refinancings D) Home Improvement Loans E) Loans on Dwellings For 5+ Families F) Non-occupant Loans on G) Loans On Manufactured Number Average Value Number Average Value Number Average Value Number Average Value Number Average Value Number Average Value Number Average Value
LOANS ORIGINATED 10 $119,500 87 $103,885 103 $99,709 28 $34,250 0 $0 13 $102,000 1 $119,000 APPLICATIONS APPROVED, NOT ACCEPTED 0 $0 5 $131,200 21 $80,000 1 $90,000 0 $0 0 $0 0 $0 APPLICATIONS DENIED 2 $86,500 12 $99,167 65 $117,538 9 $99,222 1 $193,000 4 $121,250 0 $0 APPLICATIONS WITHDRAWN 0 $0 6 $104,167 51 $119,824 6 $74,667 0 $0 4 $100,750 0 $0 FILES CLOSED FOR INCOMPLETENESS 1 $152,000 2 $84,000 10 $113,000 1 $25,000 0 $0 0 $0 0 $0
Aggregated Statistics For Year 2005(Based on 1 full tract) A) FHA, FSA/RHS & VA B) Conventional C) Refinancings D) Home Improvement Loans F) Non-occupant Loans on G) Loans On Manufactured Number Average Value Number Average Value Number Average Value Number Average Value Number Average Value Number Average Value
LOANS ORIGINATED 6 $111,333 67 $100,955 99 $95,040 25 $55,040 12 $89,917 0 $0 APPLICATIONS APPROVED, NOT ACCEPTED 0 $0 3 $79,000 16 $69,000 4 $31,000 0 $0 0 $0 APPLICATIONS DENIED 0 $0 17 $83,824 76 $103,789 21 $35,952 5 $65,000 2 $53,000 APPLICATIONS WITHDRAWN 0 $0 4 $155,500 46 $120,304 7 $59,714 2 $92,500 0 $0 FILES CLOSED FOR INCOMPLETENESS 0 $0 5 $88,400 10 $108,100 2 $20,000 0 $0 0 $0
Aggregated Statistics For Year 2004(Based on 1 full tract) A) FHA, FSA/RHS & VA B) Conventional C) Refinancings D) Home Improvement Loans E) Loans on Dwellings For 5+ Families F) Non-occupant Loans on G) Loans On Manufactured Number Average Value Number Average Value Number Average Value Number Average Value Number Average Value Number Average Value Number Average Value
LOANS ORIGINATED 11 $97,909 72 $114,528 107 $86,075 25 $34,400 0 $0 6 $83,333 2 $79,500 APPLICATIONS APPROVED, NOT ACCEPTED 0 $0 5 $89,800 23 $88,391 3 $23,667 0 $0 1 $100,000 1 $60,000 APPLICATIONS DENIED 1 $90,000 9 $109,222 73 $99,726 10 $21,100 0 $0 4 $201,750 1 $20,000 APPLICATIONS WITHDRAWN 0 $0 6 $95,833 70 $99,957 5 $37,400 1 $10,000 1 $104,000 1 $65,000 FILES CLOSED FOR INCOMPLETENESS 0 $0 1 $80,000 5 $111,600 1 $15,000 0 $0 0 $0 0 $0
Aggregated Statistics For Year 2003(Based on 1 full tract) A) FHA, FSA/RHS & VA B) Conventional C) Refinancings D) Home Improvement Loans F) Non-occupant Loans on Number Average Value Number Average Value Number Average Value Number Average Value Number Average Value
LOANS ORIGINATED 8 $90,875 47 $100,447 186 $90,167 20 $32,650 9 $96,222 APPLICATIONS APPROVED, NOT ACCEPTED 0 $0 3 $89,333 27 $76,519 9 $24,889 0 $0 APPLICATIONS DENIED 0 $0 4 $65,750 57 $79,702 9 $26,444 3 $87,000 APPLICATIONS WITHDRAWN 2 $92,500 1 $30,000 60 $87,500 3 $33,000 2 $101,000 FILES CLOSED FOR INCOMPLETENESS 0 $0 2 $130,000 6 $96,833 0 $0 0 $0
Aggregated Statistics For Year 2002(Based on 1 full tract) A) FHA, FSA/RHS & VA B) Conventional C) Refinancings D) Home Improvement Loans F) Non-occupant Loans on Number Average Value Number Average Value Number Average Value Number Average Value Number Average Value
LOANS ORIGINATED 12 $77,750 52 $86,962 110 $89,418 13 $27,538 5 $63,400 APPLICATIONS APPROVED, NOT ACCEPTED 0 $0 2 $97,000 15 $76,800 0 $0 3 $69,667 APPLICATIONS DENIED 0 $0 8 $95,875 49 $90,061 6 $38,500 2 $47,000 APPLICATIONS WITHDRAWN 0 $0 2 $128,500 28 $92,286 1 $6,000 1 $147,000 FILES CLOSED FOR INCOMPLETENESS 0 $0 0 $0 12 $92,500 0 $0 0 $0
Aggregated Statistics For Year 2001(Based on 1 full tract) A) FHA, FSA/RHS & VA B) Conventional C) Refinancings D) Home Improvement Loans F) Non-occupant Loans on Number Average Value Number Average Value Number Average Value Number Average Value Number Average Value
LOANS ORIGINATED 9 $78,222 47 $86,936 85 $86,000 29 $26,828 2 $44,000 APPLICATIONS APPROVED, NOT ACCEPTED 0 $0 4 $104,500 19 $66,211 6 $30,667 3 $46,333 APPLICATIONS DENIED 0 $0 8 $68,500 34 $77,824 11 $13,000 0 $0 APPLICATIONS WITHDRAWN 0 $0 1 $46,000 20 $82,000 7 $14,000 1 $30,000 FILES CLOSED FOR INCOMPLETENESS 0 $0 1 $81,000 6 $98,500 0 $0 0 $0
Aggregated Statistics For Year 2000(Based on 1 full tract) A) FHA, FSA/RHS & VA B) Conventional C) Refinancings D) Home Improvement Loans F) Non-occupant Loans on Number Average Value Number Average Value Number Average Value Number Average Value Number Average Value
LOANS ORIGINATED 11 $88,727 47 $91,213 29 $66,276 27 $25,296 3 $51,000 APPLICATIONS APPROVED, NOT ACCEPTED 0 $0 4 $80,750 10 $46,300 5 $25,000 0 $0 APPLICATIONS DENIED 0 $0 12 $68,000 41 $56,073 13 $19,385 3 $115,000 APPLICATIONS WITHDRAWN 0 $0 0 $0 19 $63,316 5 $21,200 2 $30,000 FILES CLOSED FOR INCOMPLETENESS 1 $55,000 1 $15,000 4 $62,500 0 $0 0 $0
Aggregated Statistics For Year 1999(Based on 1 full tract) A) FHA, FSA/RHS & VA B) Conventional C) Refinancings D) Home Improvement Loans F) Non-occupant Loans on Number Average Value Number Average Value Number Average Value Number Average Value Number Average Value
LOANS ORIGINATED 9 $80,850 44 $89,670 67 $72,514 18 $16,419 11 $69,963 APPLICATIONS APPROVED, NOT ACCEPTED 0 $0 4 $69,985 12 $66,246 0 $0 0 $0 APPLICATIONS DENIED 0 $0 19 $49,078 45 $64,355 12 $30,725 3 $26,337 APPLICATIONS WITHDRAWN 0 $0 1 $72,180 18 $66,002 3 $20,810 0 $0 FILES CLOSED FOR INCOMPLETENESS 1 $87,790 1 $123,880 4 $75,350 0 $0 0 $0
Detailed HMDA statistics for the following Tracts:
0136.00
Private Mortgage Insurance Companies Aggregated Statistics For Year 2009(Based on 1 full tract) A) Conventional B) Refinancings Number Average Value Number Average Value
LOANS ORIGINATED 4 $172,500 0 $0 APPLICATIONS APPROVED, NOT ACCEPTED 0 $0 2 $146,500 APPLICATIONS DENIED 2 $206,500 0 $0 APPLICATIONS WITHDRAWN 0 $0 0 $0 FILES CLOSED FOR INCOMPLETENESS 0 $0 0 $0
Aggregated Statistics For Year 2008(Based on 1 full tract) A) Conventional B) Refinancings C) Non-occupant Loans on Number Average Value Number Average Value Number Average Value
LOANS ORIGINATED 3 $128,667 9 $164,889 1 $104,000 APPLICATIONS APPROVED, NOT ACCEPTED 3 $171,333 4 $185,750 0 $0 APPLICATIONS DENIED 0 $0 1 $133,000 0 $0 APPLICATIONS WITHDRAWN 0 $0 1 $145,000 1 $145,000 FILES CLOSED FOR INCOMPLETENESS 0 $0 0 $0 0 $0
Aggregated Statistics For Year 2007(Based on 1 full tract) A) Conventional B) Refinancings Number Average Value Number Average Value
LOANS ORIGINATED 19 $137,316 5 $134,400 APPLICATIONS APPROVED, NOT ACCEPTED 3 $134,667 1 $272,000 APPLICATIONS DENIED 0 $0 0 $0 APPLICATIONS WITHDRAWN 0 $0 1 $128,000 FILES CLOSED FOR INCOMPLETENESS 0 $0 0 $0
Aggregated Statistics For Year 2006(Based on 1 full tract) A) Conventional B) Refinancings C) Non-occupant Loans on Number Average Value Number Average Value Number Average Value
LOANS ORIGINATED 16 $127,438 5 $123,800 2 $112,500 APPLICATIONS APPROVED, NOT ACCEPTED 0 $0 0 $0 0 $0 APPLICATIONS DENIED 0 $0 0 $0 0 $0 APPLICATIONS WITHDRAWN 1 $269,000 0 $0 0 $0 FILES CLOSED FOR INCOMPLETENESS 0 $0 0 $0 0 $0
Aggregated Statistics For Year 2005(Based on 1 full tract) A) Conventional B) Refinancings C) Non-occupant Loans on Number Average Value Number Average Value Number Average Value
LOANS ORIGINATED 17 $125,882 6 $109,000 2 $104,500 APPLICATIONS APPROVED, NOT ACCEPTED 3 $135,333 1 $113,000 1 $99,000 APPLICATIONS DENIED 3 $131,667 0 $0 1 $151,000 APPLICATIONS WITHDRAWN 2 $107,500 0 $0 0 $0 FILES CLOSED FOR INCOMPLETENESS 0 $0 0 $0 0 $0
Aggregated Statistics For Year 2004(Based on 1 full tract) A) Conventional B) Refinancings C) Non-occupant Loans on Number Average Value Number Average Value Number Average Value
LOANS ORIGINATED 24 $117,750 9 $99,889 3 $88,667 APPLICATIONS APPROVED, NOT ACCEPTED 5 $104,200 4 $90,500 1 $92,000 APPLICATIONS DENIED 0 $0 0 $0 0 $0 APPLICATIONS WITHDRAWN 0 $0 2 $101,500 0 $0 FILES CLOSED FOR INCOMPLETENESS 0 $0 0 $0 0 $0
Aggregated Statistics For Year 2003(Based on 1 full tract) A) Conventional B) Refinancings C) Non-occupant Loans on Number Average Value Number Average Value Number Average Value
LOANS ORIGINATED 19 $99,263 22 $96,500 3 $78,333 APPLICATIONS APPROVED, NOT ACCEPTED 4 $97,250 8 $102,125 0 $0 APPLICATIONS DENIED 0 $0 3 $100,000 0 $0 APPLICATIONS WITHDRAWN 0 $0 0 $0 0 $0 FILES CLOSED FOR INCOMPLETENESS 0 $0 1 $76,000 0 $0
Aggregated Statistics For Year 2002(Based on 1 full tract) A) Conventional B) Refinancings Number Average Value Number Average Value
LOANS ORIGINATED 16 $91,500 23 $100,913 APPLICATIONS APPROVED, NOT ACCEPTED 2 $97,000 4 $76,750 APPLICATIONS DENIED 0 $0 1 $113,000 APPLICATIONS WITHDRAWN 0 $0 1 $90,000 FILES CLOSED FOR INCOMPLETENESS 0 $0 0 $0
Aggregated Statistics For Year 2001(Based on 1 full tract) A) Conventional B) Refinancings C) Non-occupant Loans on Number Average Value Number Average Value Number Average Value
LOANS ORIGINATED 15 $89,200 13 $90,231 2 $53,000 APPLICATIONS APPROVED, NOT ACCEPTED 1 $46,000 2 $138,500 0 $0 APPLICATIONS DENIED 0 $0 1 $85,000 1 $85,000 APPLICATIONS WITHDRAWN 0 $0 0 $0 0 $0 FILES CLOSED FOR INCOMPLETENESS 1 $44,000 0 $0 1 $44,000
Aggregated Statistics For Year 2000(Based on 1 full tract) A) Conventional B) Refinancings Number Average Value Number Average Value
LOANS ORIGINATED 19 $96,211 5 $88,600 APPLICATIONS APPROVED, NOT ACCEPTED 2 $154,500 1 $95,000 APPLICATIONS DENIED 0 $0 0 $0 APPLICATIONS WITHDRAWN 0 $0 0 $0 FILES CLOSED FOR INCOMPLETENESS 0 $0 0 $0
Aggregated Statistics For Year 1999(Based on 1 full tract) A) Conventional B) Refinancings Number Average Value Number Average Value
LOANS ORIGINATED 22 $99,712 12 $99,572 APPLICATIONS APPROVED, NOT ACCEPTED 2 $82,420 2 $96,075 APPLICATIONS DENIED 1 $92,660 0 $0 APPLICATIONS WITHDRAWN 0 $0 1 $79,980 FILES CLOSED FOR INCOMPLETENESS 1 $57,550 0 $0
Detailed PMIC statistics for the following Tracts:
0136.00
Most common first names in Fleetwood, PA among deceased individuals Name Count Lived (average)
John 105 74.4 years William 65 75.1 years Mary 63 81.8 years Charles 59 78.8 years Robert 54 72.2 years Helen 52 81.0 years Paul 50 74.4 years George 49 76.1 years Earl 40 74.8 years Anna 38 78.4 years
Most common last names in Fleetwood, PA among deceased individuals Last name Count Lived (average)
Miller 69 75.3 years Moyer 36 74.3 years Noll 33 76.4 years Schlegel 33 82.3 years Kline 32 76.9 years Snyder 28 71.9 years Heffner 27 74.6 years Keller 24 78.6 years Schaeffer 22 82.1 years Boyer 22 78.5 years
Fleetwood compared to Pennsylvania state average:
Unemployed percentage significantly below state average. Black race population percentage significantly below state average. Foreign-born population percentage below state average. Length of stay since moving in below state average. Number of college students below state average.
Top Patent Applicants
Thomas J. Krutsick (6)
Andrew Swartz (6)
Michael Zweizig (6)
Blaine Robert Noll (5)
Mark Trafford (4)
Blaine R. Noll (4)
Andrew J. Swartz (3)
Michael J. Sanchez (3)
David J. Bonanni (3)
Ronald Joseph Pangrazi (3)
Total of 92 patent applications in 2008-2024.
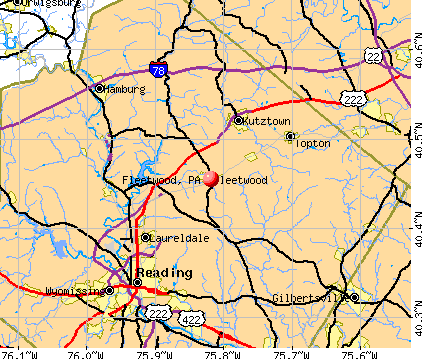


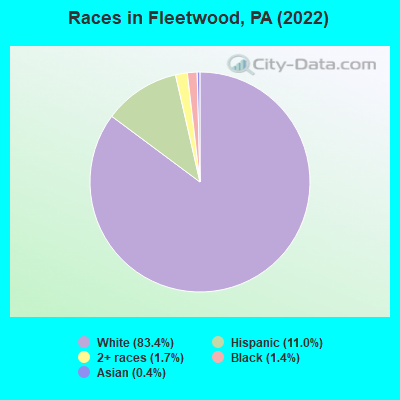
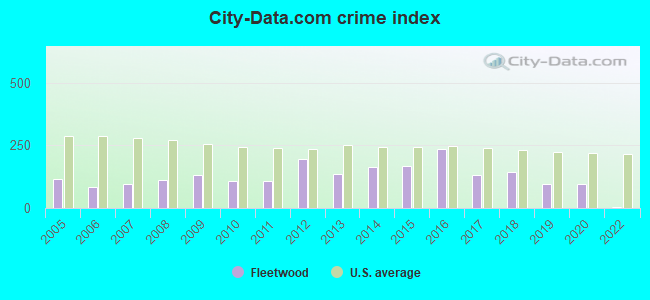
 Recent articles from our blog. Our writers, many of them Ph.D. graduates or candidates, create easy-to-read articles on a wide variety of topics.

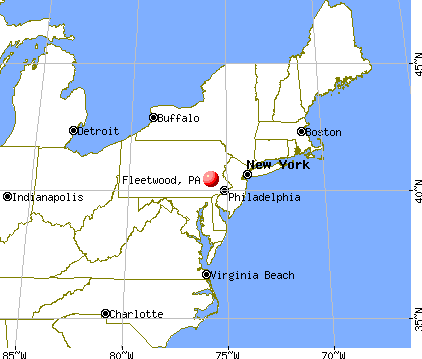
 (9.7 miles
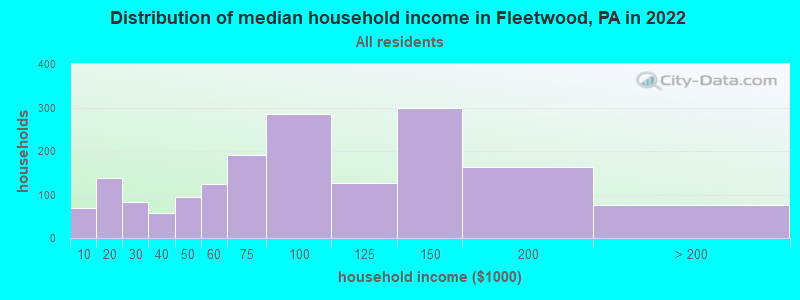
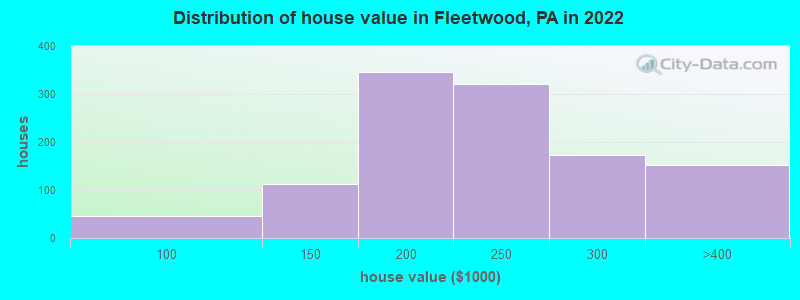

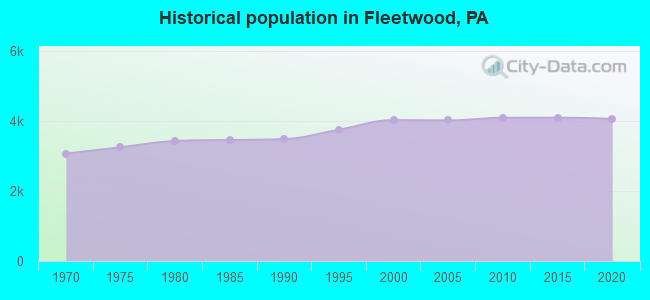
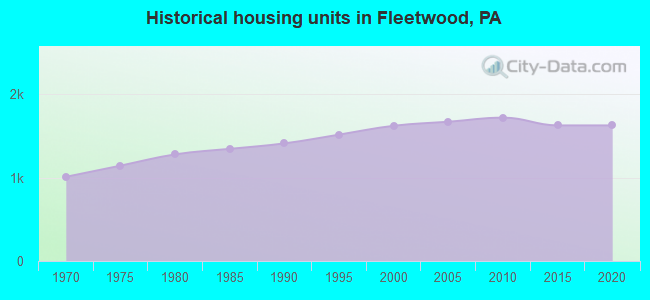
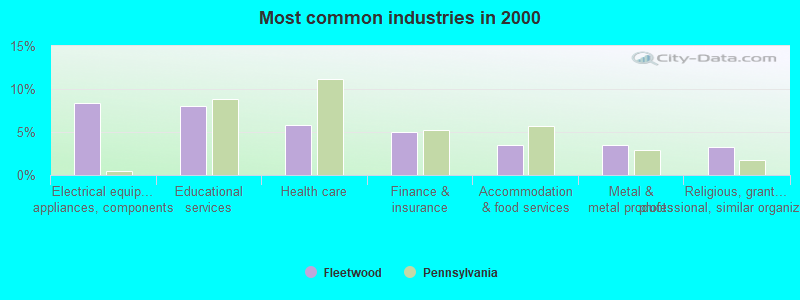
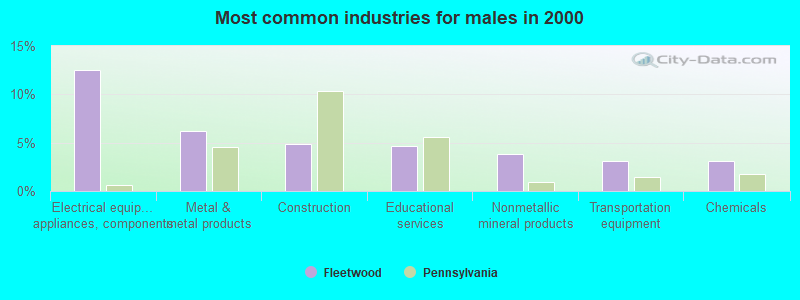
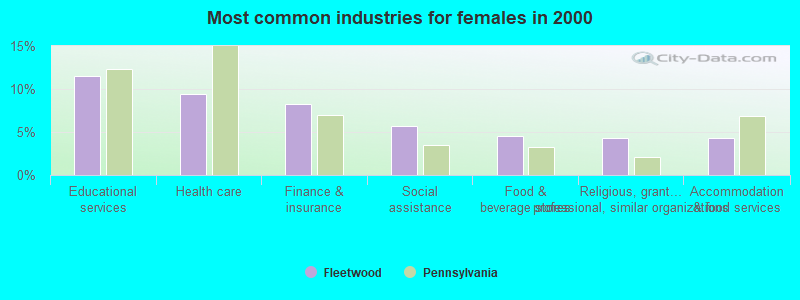
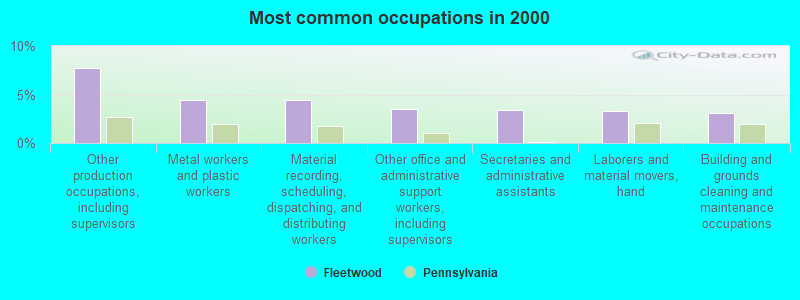
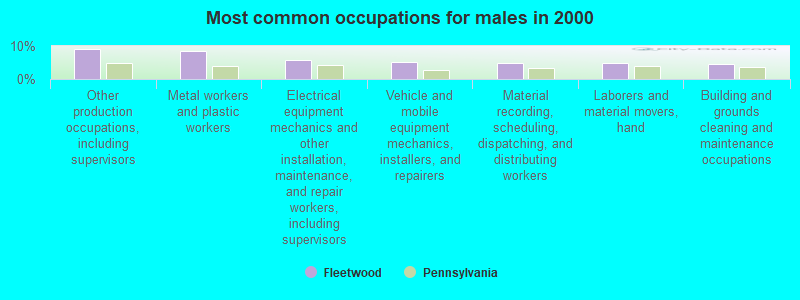
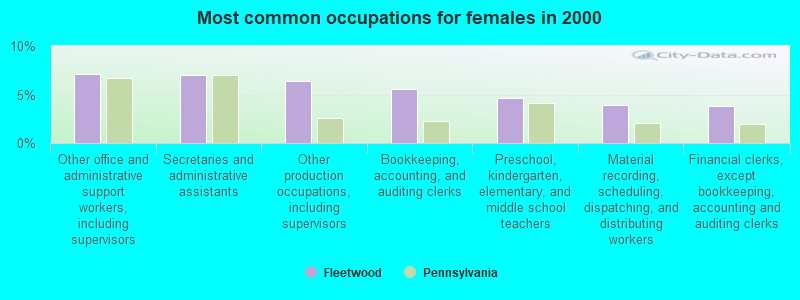


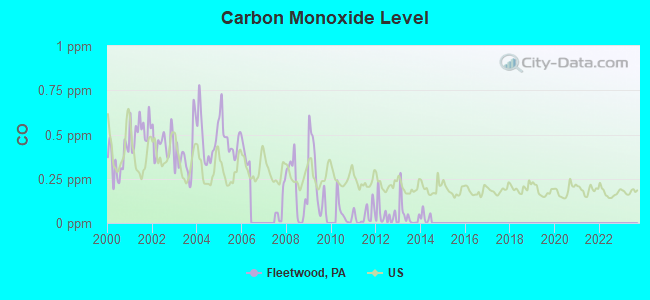
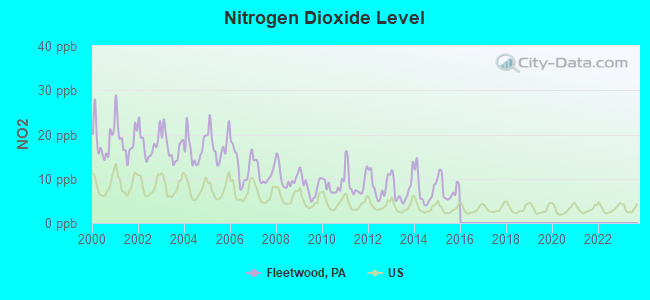
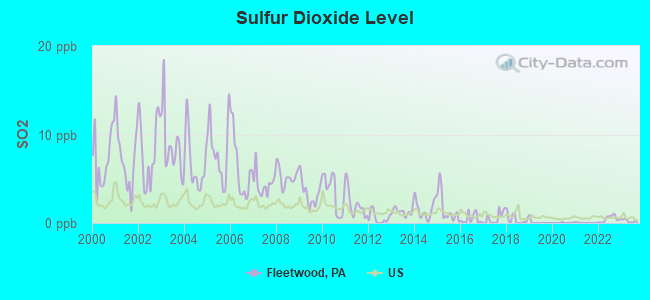
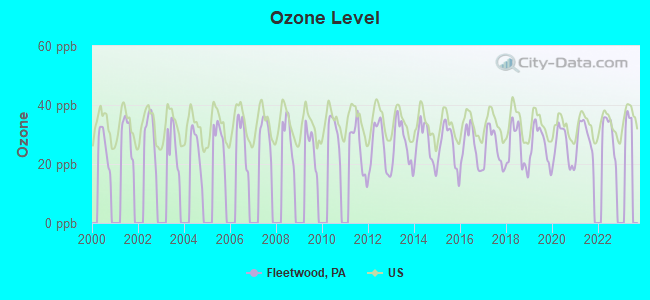
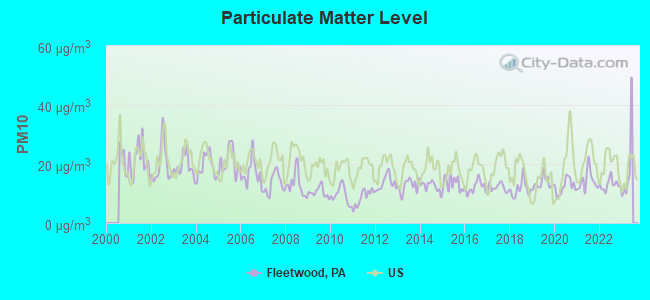
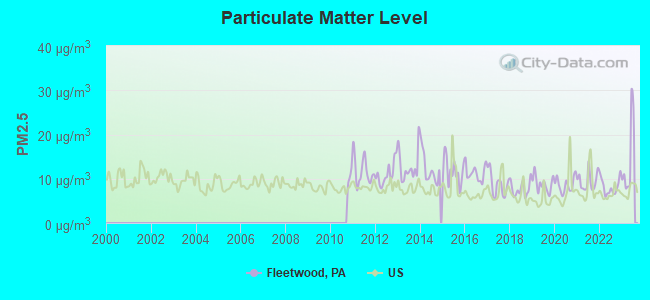
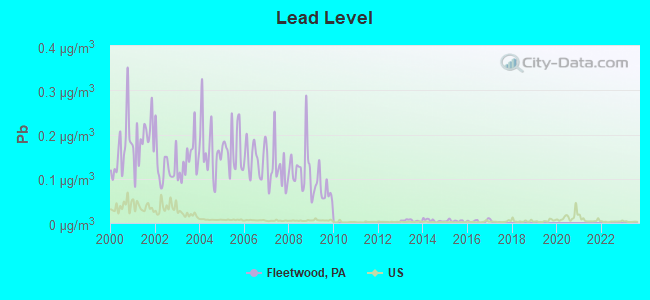
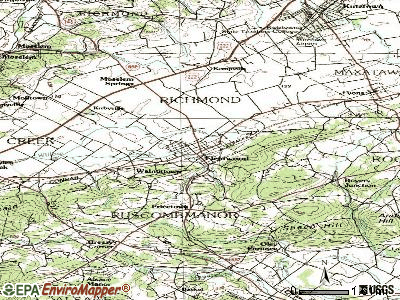
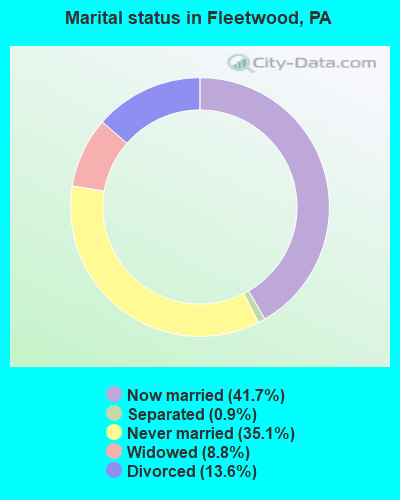
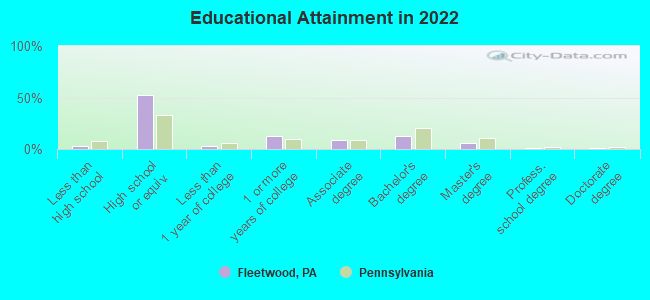
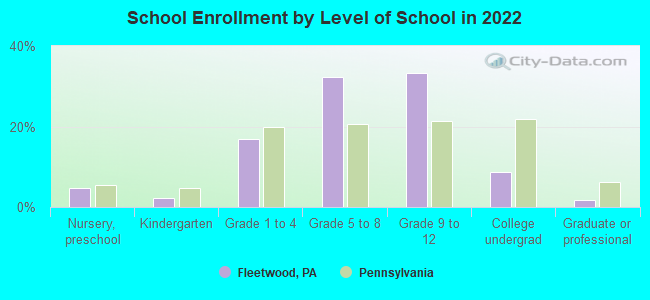
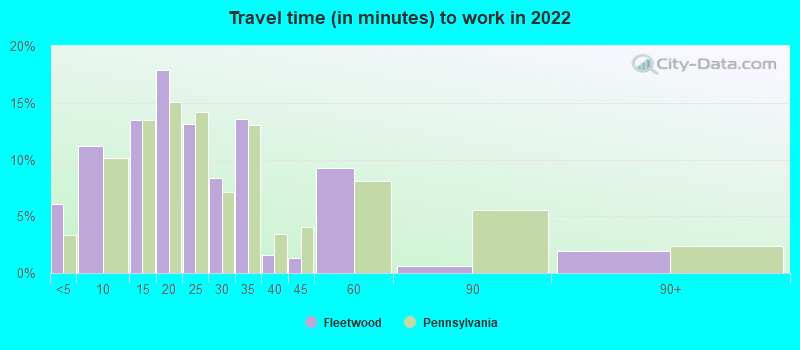
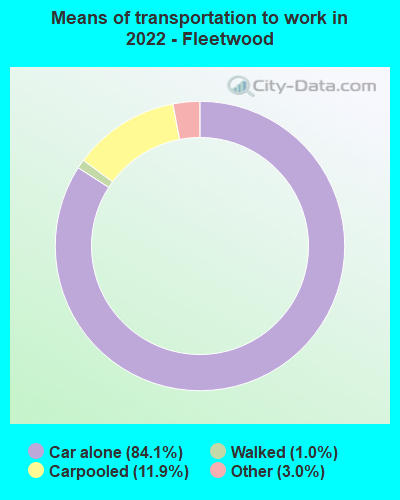
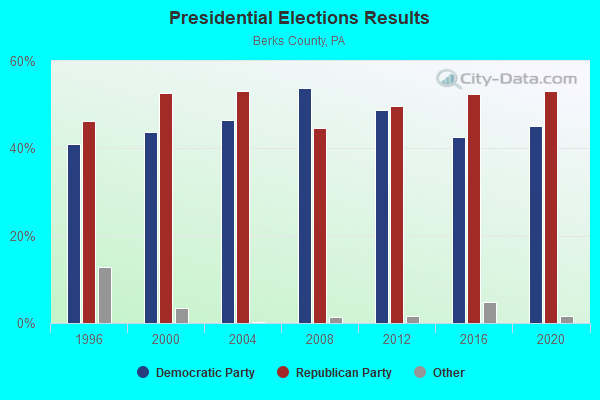
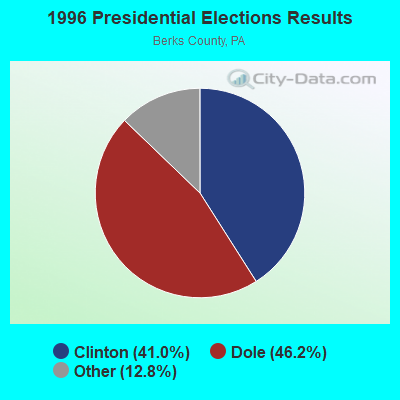
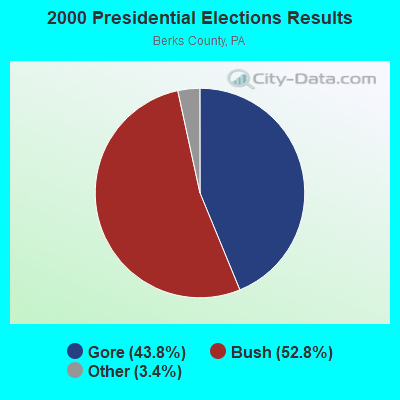
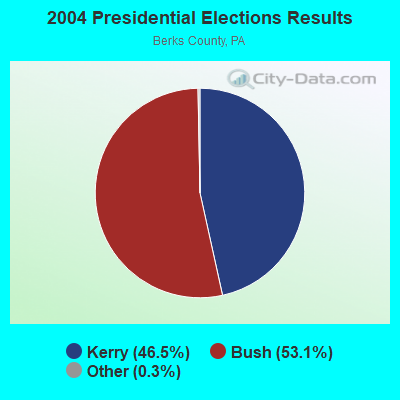
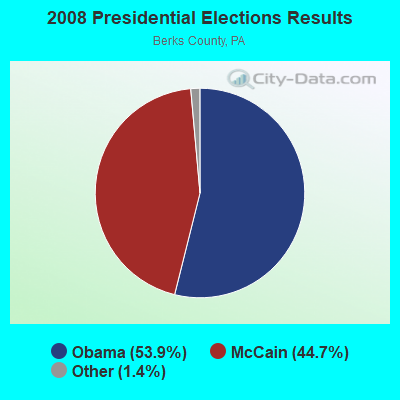
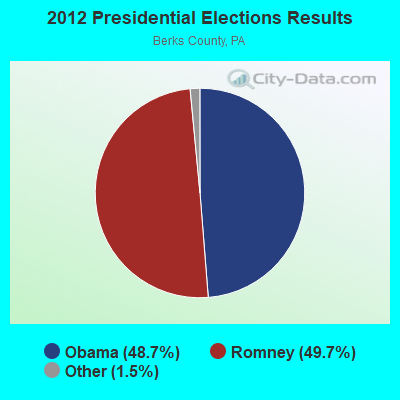
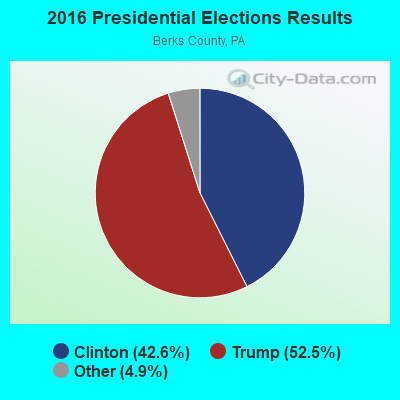
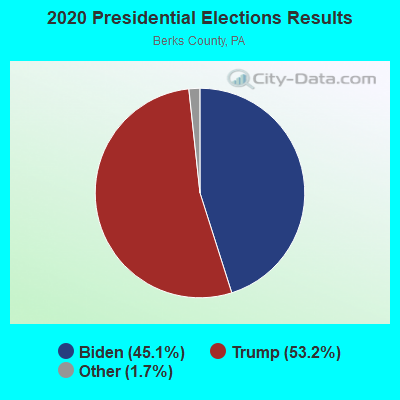
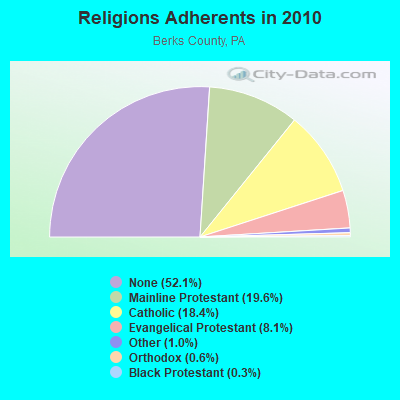
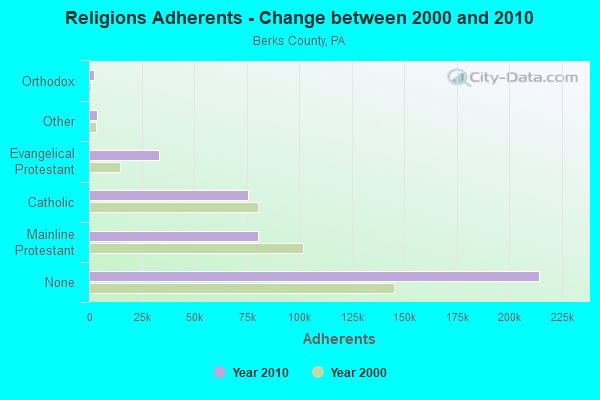
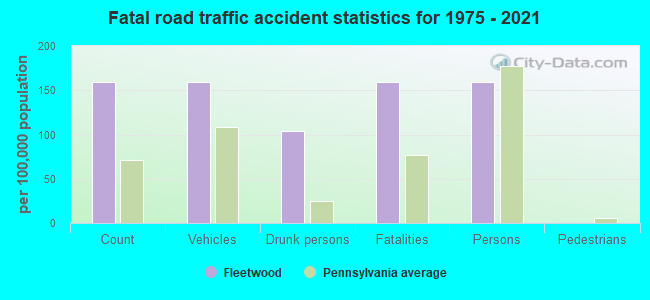
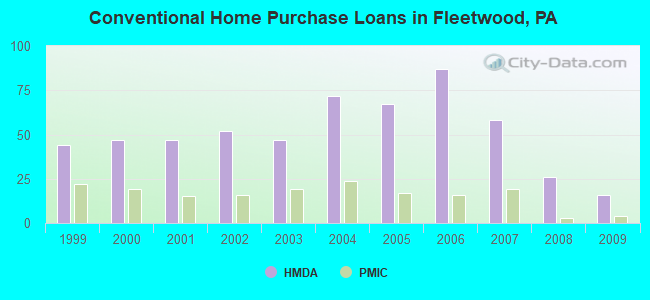
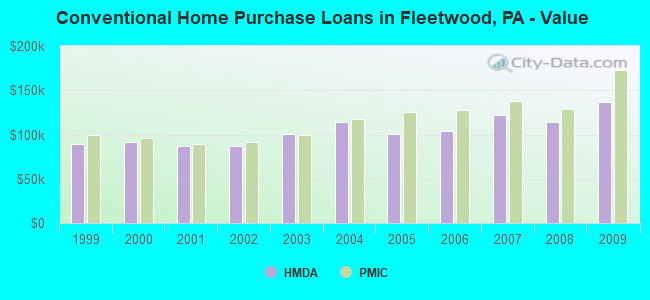
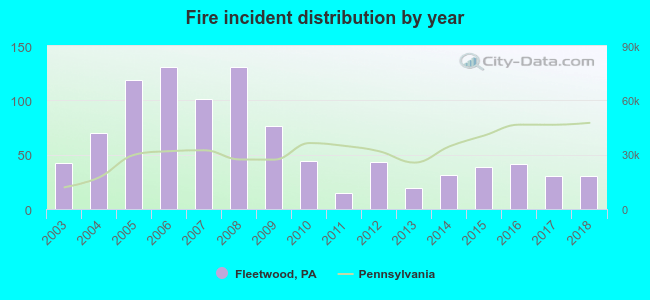 According to the data from the years 2003 - 2018 the average number of fire incidents per year is 60. The highest number of fires - 131 took place in 2006, and the least - 15 in 2011. The data has a dropping trend.
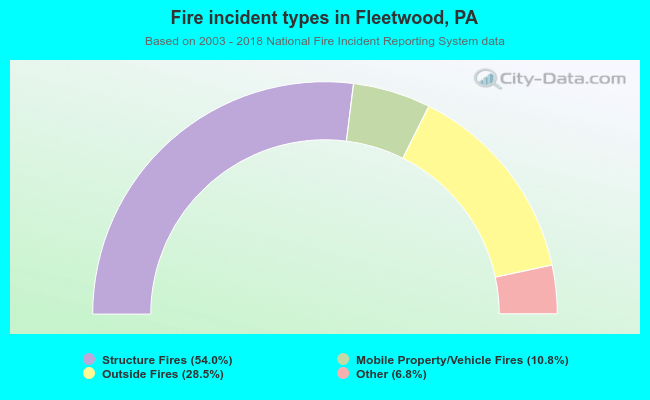 When looking into fire subcategories, the most incidents belonged to: Structure Fires (54.0%), and Outside Fires (28.5%).