Plainfield, Indiana Submit your own pictures of this town and show them to the world
OSM Map
General Map
Google Map
MSN Map
OSM Map
General Map
Google Map
MSN Map
OSM Map
General Map
Google Map
MSN Map
OSM Map
General Map
Google Map
MSN Map
Please wait while loading the map...
Population in 2022: 36,074 (99% urban, 1% rural). Population change since 2000: +96.1%Males: 19,062 Females: 17,012
March 2022 cost of living index in Plainfield: 88.7 (less than average, U.S. average is 100) Percentage of residents living in poverty in 2022: 6.8%for White Non-Hispanic residents , 10.0% for Black residents , 7.0% for Hispanic or Latino residents , 25.5% for American Indian residents , 3.9% for other race residents , 9.2% for two or more races residents )
Profiles of local businesses
Business Search - 14 Million verified businesses
Data:
Median household income ($)
Median household income (% change since 2000)
Household income diversity
Ratio of average income to average house value (%)
Ratio of average income to average rent
Median household income ($) - White
Median household income ($) - Black or African American
Median household income ($) - Asian
Median household income ($) - Hispanic or Latino
Median household income ($) - American Indian and Alaska Native
Median household income ($) - Multirace
Median household income ($) - Other Race
Median household income for houses/condos with a mortgage ($)
Median household income for apartments without a mortgage ($)
Races - White alone (%)
Races - White alone (% change since 2000)
Races - Black alone (%)
Races - Black alone (% change since 2000)
Races - American Indian alone (%)
Races - American Indian alone (% change since 2000)
Races - Asian alone (%)
Races - Asian alone (% change since 2000)
Races - Hispanic (%)
Races - Hispanic (% change since 2000)
Races - Native Hawaiian and Other Pacific Islander alone (%)
Races - Native Hawaiian and Other Pacific Islander alone (% change since 2000)
Races - Two or more races (%)
Races - Two or more races (% change since 2000)
Races - Other race alone (%)
Races - Other race alone (% change since 2000)
Racial diversity
Unemployment (%)
Unemployment (% change since 2000)
Unemployment (%) - White
Unemployment (%) - Black or African American
Unemployment (%) - Asian
Unemployment (%) - Hispanic or Latino
Unemployment (%) - American Indian and Alaska Native
Unemployment (%) - Multirace
Unemployment (%) - Other Race
Population density (people per square mile)
Population - Males (%)
Population - Females (%)
Population - Males (%) - White
Population - Males (%) - Black or African American
Population - Males (%) - Asian
Population - Males (%) - Hispanic or Latino
Population - Males (%) - American Indian and Alaska Native
Population - Males (%) - Multirace
Population - Males (%) - Other Race
Population - Females (%) - White
Population - Females (%) - Black or African American
Population - Females (%) - Asian
Population - Females (%) - Hispanic or Latino
Population - Females (%) - American Indian and Alaska Native
Population - Females (%) - Multirace
Population - Females (%) - Other Race
Coronavirus confirmed cases (Jun 16, 2024)
Deaths caused by coronavirus (Jun 16, 2024)
Coronavirus confirmed cases (per 100k population) (Jun 16, 2024)
Deaths caused by coronavirus (per 100k population) (Jun 16, 2024)
Daily increase in number of cases (Jun 16, 2024)
Weekly increase in number of cases (Jun 16, 2024)
Cases doubled (in days) (Jun 16, 2024)
Hospitalized patients (Apr 18, 2022)
Negative test results (Apr 18, 2022)
Total test results (Apr 18, 2022)
COVID Vaccine doses distributed (per 100k population) (Sep 19, 2023)
COVID Vaccine doses administered (per 100k population) (Sep 19, 2023)
COVID Vaccine doses distributed (Sep 19, 2023)
COVID Vaccine doses administered (Sep 19, 2023)
Likely homosexual households (%)
Likely homosexual households (% change since 2000)
Likely homosexual households - Lesbian couples (%)
Likely homosexual households - Lesbian couples (% change since 2000)
Likely homosexual households - Gay men (%)
Likely homosexual households - Gay men (% change since 2000)
Cost of living index
Median gross rent ($)
Median contract rent ($)
Median monthly housing costs ($)
Median house or condo value ($)
Median house or condo value ($ change since 2000)
Mean house or condo value by units in structure - 1, detached ($)
Mean house or condo value by units in structure - 1, attached ($)
Mean house or condo value by units in structure - 2 ($)
Mean house or condo value by units in structure by units in structure - 3 or 4 ($)
Mean house or condo value by units in structure - 5 or more ($)
Mean house or condo value by units in structure - Boat, RV, van, etc. ($)
Mean house or condo value by units in structure - Mobile home ($)
Median house or condo value ($) - White
Median house or condo value ($) - Black or African American
Median house or condo value ($) - Asian
Median house or condo value ($) - Hispanic or Latino
Median house or condo value ($) - American Indian and Alaska Native
Median house or condo value ($) - Multirace
Median house or condo value ($) - Other Race
Median resident age
Resident age diversity
Median resident age - Males
Median resident age - Females
Median resident age - White
Median resident age - Black or African American
Median resident age - Asian
Median resident age - Hispanic or Latino
Median resident age - American Indian and Alaska Native
Median resident age - Multirace
Median resident age - Other Race
Median resident age - Males - White
Median resident age - Males - Black or African American
Median resident age - Males - Asian
Median resident age - Males - Hispanic or Latino
Median resident age - Males - American Indian and Alaska Native
Median resident age - Males - Multirace
Median resident age - Males - Other Race
Median resident age - Females - White
Median resident age - Females - Black or African American
Median resident age - Females - Asian
Median resident age - Females - Hispanic or Latino
Median resident age - Females - American Indian and Alaska Native
Median resident age - Females - Multirace
Median resident age - Females - Other Race
Commute - mean travel time to work (minutes)
Travel time to work - Less than 5 minutes (%)
Travel time to work - Less than 5 minutes (% change since 2000)
Travel time to work - 5 to 9 minutes (%)
Travel time to work - 5 to 9 minutes (% change since 2000)
Travel time to work - 10 to 19 minutes (%)
Travel time to work - 10 to 19 minutes (% change since 2000)
Travel time to work - 20 to 29 minutes (%)
Travel time to work - 20 to 29 minutes (% change since 2000)
Travel time to work - 30 to 39 minutes (%)
Travel time to work - 30 to 39 minutes (% change since 2000)
Travel time to work - 40 to 59 minutes (%)
Travel time to work - 40 to 59 minutes (% change since 2000)
Travel time to work - 60 to 89 minutes (%)
Travel time to work - 60 to 89 minutes (% change since 2000)
Travel time to work - 90 or more minutes (%)
Travel time to work - 90 or more minutes (% change since 2000)
Marital status - Never married (%)
Marital status - Now married (%)
Marital status - Separated (%)
Marital status - Widowed (%)
Marital status - Divorced (%)
Median family income ($)
Median family income (% change since 2000)
Median non-family income ($)
Median non-family income (% change since 2000)
Median per capita income ($)
Median per capita income (% change since 2000)
Median family income ($) - White
Median family income ($) - Black or African American
Median family income ($) - Asian
Median family income ($) - Hispanic or Latino
Median family income ($) - American Indian and Alaska Native
Median family income ($) - Multirace
Median family income ($) - Other Race
Median year house/condo built
Median year apartment built
Year house built - Built 2005 or later (%)
Year house built - Built 2000 to 2004 (%)
Year house built - Built 1990 to 1999 (%)
Year house built - Built 1980 to 1989 (%)
Year house built - Built 1970 to 1979 (%)
Year house built - Built 1960 to 1969 (%)
Year house built - Built 1950 to 1959 (%)
Year house built - Built 1940 to 1949 (%)
Year house built - Built 1939 or earlier (%)
Average household size
Household density (households per square mile)
Average household size - White
Average household size - Black or African American
Average household size - Asian
Average household size - Hispanic or Latino
Average household size - American Indian and Alaska Native
Average household size - Multirace
Average household size - Other Race
Occupied housing units (%)
Vacant housing units (%)
Owner occupied housing units (%)
Renter occupied housing units (%)
Vacancy status - For rent (%)
Vacancy status - For sale only (%)
Vacancy status - Rented or sold, not occupied (%)
Vacancy status - For seasonal, recreational, or occasional use (%)
Vacancy status - For migrant workers (%)
Vacancy status - Other vacant (%)
Residents with income below the poverty level (%)
Residents with income below 50% of the poverty level (%)
Children below poverty level (%)
Poor families by family type - Married-couple family (%)
Poor families by family type - Male, no wife present (%)
Poor families by family type - Female, no husband present (%)
Poverty status for native-born residents (%)
Poverty status for foreign-born residents (%)
Poverty among high school graduates not in families (%)
Poverty among people who did not graduate high school not in families (%)
Residents with income below the poverty level (%) - White
Residents with income below the poverty level (%) - Black or African American
Residents with income below the poverty level (%) - Asian
Residents with income below the poverty level (%) - Hispanic or Latino
Residents with income below the poverty level (%) - American Indian and Alaska Native
Residents with income below the poverty level (%) - Multirace
Residents with income below the poverty level (%) - Other Race
Air pollution - Air Quality Index (AQI)
Air pollution - CO
Air pollution - NO2
Air pollution - SO2
Air pollution - Ozone
Air pollution - PM10
Air pollution - PM25
Air pollution - Pb
Crime - Murders per 100,000 population
Crime - Rapes per 100,000 population
Crime - Robberies per 100,000 population
Crime - Assaults per 100,000 population
Crime - Burglaries per 100,000 population
Crime - Thefts per 100,000 population
Crime - Auto thefts per 100,000 population
Crime - Arson per 100,000 population
Crime - City-data.com crime index
Crime - Violent crime index
Crime - Property crime index
Crime - Murders per 100,000 population (5 year average)
Crime - Rapes per 100,000 population (5 year average)
Crime - Robberies per 100,000 population (5 year average)
Crime - Assaults per 100,000 population (5 year average)
Crime - Burglaries per 100,000 population (5 year average)
Crime - Thefts per 100,000 population (5 year average)
Crime - Auto thefts per 100,000 population (5 year average)
Crime - Arson per 100,000 population (5 year average)
Crime - City-data.com crime index (5 year average)
Crime - Violent crime index (5 year average)
Crime - Property crime index (5 year average)
1996 Presidential Elections Results (%) - Democratic Party (Clinton)
1996 Presidential Elections Results (%) - Republican Party (Dole)
1996 Presidential Elections Results (%) - Other
2000 Presidential Elections Results (%) - Democratic Party (Gore)
2000 Presidential Elections Results (%) - Republican Party (Bush)
2000 Presidential Elections Results (%) - Other
2004 Presidential Elections Results (%) - Democratic Party (Kerry)
2004 Presidential Elections Results (%) - Republican Party (Bush)
2004 Presidential Elections Results (%) - Other
2008 Presidential Elections Results (%) - Democratic Party (Obama)
2008 Presidential Elections Results (%) - Republican Party (McCain)
2008 Presidential Elections Results (%) - Other
2012 Presidential Elections Results (%) - Democratic Party (Obama)
2012 Presidential Elections Results (%) - Republican Party (Romney)
2012 Presidential Elections Results (%) - Other
2016 Presidential Elections Results (%) - Democratic Party (Clinton)
2016 Presidential Elections Results (%) - Republican Party (Trump)
2016 Presidential Elections Results (%) - Other
2020 Presidential Elections Results (%) - Democratic Party (Biden)
2020 Presidential Elections Results (%) - Republican Party (Trump)
2020 Presidential Elections Results (%) - Other
Ancestries Reported - Arab (%)
Ancestries Reported - Czech (%)
Ancestries Reported - Danish (%)
Ancestries Reported - Dutch (%)
Ancestries Reported - English (%)
Ancestries Reported - French (%)
Ancestries Reported - French Canadian (%)
Ancestries Reported - German (%)
Ancestries Reported - Greek (%)
Ancestries Reported - Hungarian (%)
Ancestries Reported - Irish (%)
Ancestries Reported - Italian (%)
Ancestries Reported - Lithuanian (%)
Ancestries Reported - Norwegian (%)
Ancestries Reported - Polish (%)
Ancestries Reported - Portuguese (%)
Ancestries Reported - Russian (%)
Ancestries Reported - Scotch-Irish (%)
Ancestries Reported - Scottish (%)
Ancestries Reported - Slovak (%)
Ancestries Reported - Subsaharan African (%)
Ancestries Reported - Swedish (%)
Ancestries Reported - Swiss (%)
Ancestries Reported - Ukrainian (%)
Ancestries Reported - United States (%)
Ancestries Reported - Welsh (%)
Ancestries Reported - West Indian (%)
Ancestries Reported - Other (%)
Educational Attainment - No schooling completed (%)
Educational Attainment - Less than high school (%)
Educational Attainment - High school or equivalent (%)
Educational Attainment - Less than 1 year of college (%)
Educational Attainment - 1 or more years of college (%)
Educational Attainment - Associate degree (%)
Educational Attainment - Bachelor's degree (%)
Educational Attainment - Master's degree (%)
Educational Attainment - Professional school degree (%)
Educational Attainment - Doctorate degree (%)
School Enrollment - Nursery, preschool (%)
School Enrollment - Kindergarten (%)
School Enrollment - Grade 1 to 4 (%)
School Enrollment - Grade 5 to 8 (%)
School Enrollment - Grade 9 to 12 (%)
School Enrollment - College undergrad (%)
School Enrollment - Graduate or professional (%)
School Enrollment - Not enrolled in school (%)
School enrollment - Public schools (%)
School enrollment - Private schools (%)
School enrollment - Not enrolled (%)
Median number of rooms in houses and condos
Median number of rooms in apartments
Housing units lacking complete plumbing facilities (%)
Housing units lacking complete kitchen facilities (%)
Density of houses
Urban houses (%)
Rural houses (%)
Households with people 60 years and over (%)
Households with people 65 years and over (%)
Households with people 75 years and over (%)
Households with one or more nonrelatives (%)
Households with no nonrelatives (%)
Population in households (%)
Family households (%)
Nonfamily households (%)
Population in families (%)
Family households with own children (%)
Median number of bedrooms in owner occupied houses
Mean number of bedrooms in owner occupied houses
Median number of bedrooms in renter occupied houses
Mean number of bedrooms in renter occupied houses
Median number of vehichles in owner occupied houses
Mean number of vehichles in owner occupied houses
Median number of vehichles in renter occupied houses
Mean number of vehichles in renter occupied houses
Mortgage status - with mortgage (%)
Mortgage status - with second mortgage (%)
Mortgage status - with home equity loan (%)
Mortgage status - with both second mortgage and home equity loan (%)
Mortgage status - without a mortgage (%)
Average family size
Average family size - White
Average family size - Black or African American
Average family size - Asian
Average family size - Hispanic or Latino
Average family size - American Indian and Alaska Native
Average family size - Multirace
Average family size - Other Race
Geographical mobility - Same house 1 year ago (%)
Geographical mobility - Moved within same county (%)
Geographical mobility - Moved from different county within same state (%)
Geographical mobility - Moved from different state (%)
Geographical mobility - Moved from abroad (%)
Place of birth - Born in state of residence (%)
Place of birth - Born in other state (%)
Place of birth - Native, outside of US (%)
Place of birth - Foreign born (%)
Housing units in structures - 1, detached (%)
Housing units in structures - 1, attached (%)
Housing units in structures - 2 (%)
Housing units in structures - 3 or 4 (%)
Housing units in structures - 5 to 9 (%)
Housing units in structures - 10 to 19 (%)
Housing units in structures - 20 to 49 (%)
Housing units in structures - 50 or more (%)
Housing units in structures - Mobile home (%)
Housing units in structures - Boat, RV, van, etc. (%)
House/condo owner moved in on average (years ago)
Renter moved in on average (years ago)
Year householder moved into unit - Moved in 1999 to March 2000 (%)
Year householder moved into unit - Moved in 1995 to 1998 (%)
Year householder moved into unit - Moved in 1990 to 1994 (%)
Year householder moved into unit - Moved in 1980 to 1989 (%)
Year householder moved into unit - Moved in 1970 to 1979 (%)
Year householder moved into unit - Moved in 1969 or earlier (%)
Means of transportation to work - Drove car alone (%)
Means of transportation to work - Carpooled (%)
Means of transportation to work - Public transportation (%)
Means of transportation to work - Bus or trolley bus (%)
Means of transportation to work - Streetcar or trolley car (%)
Means of transportation to work - Subway or elevated (%)
Means of transportation to work - Railroad (%)
Means of transportation to work - Ferryboat (%)
Means of transportation to work - Taxicab (%)
Means of transportation to work - Motorcycle (%)
Means of transportation to work - Bicycle (%)
Means of transportation to work - Walked (%)
Means of transportation to work - Other means (%)
Working at home (%)
Industry diversity
Most Common Industries - Agriculture, forestry, fishing and hunting, and mining (%)
Most Common Industries - Agriculture, forestry, fishing and hunting (%)
Most Common Industries - Mining, quarrying, and oil and gas extraction (%)
Most Common Industries - Construction (%)
Most Common Industries - Manufacturing (%)
Most Common Industries - Wholesale trade (%)
Most Common Industries - Retail trade (%)
Most Common Industries - Transportation and warehousing, and utilities (%)
Most Common Industries - Transportation and warehousing (%)
Most Common Industries - Utilities (%)
Most Common Industries - Information (%)
Most Common Industries - Finance and insurance, and real estate and rental and leasing (%)
Most Common Industries - Finance and insurance (%)
Most Common Industries - Real estate and rental and leasing (%)
Most Common Industries - Professional, scientific, and management, and administrative and waste management services (%)
Most Common Industries - Professional, scientific, and technical services (%)
Most Common Industries - Management of companies and enterprises (%)
Most Common Industries - Administrative and support and waste management services (%)
Most Common Industries - Educational services, and health care and social assistance (%)
Most Common Industries - Educational services (%)
Most Common Industries - Health care and social assistance (%)
Most Common Industries - Arts, entertainment, and recreation, and accommodation and food services (%)
Most Common Industries - Arts, entertainment, and recreation (%)
Most Common Industries - Accommodation and food services (%)
Most Common Industries - Other services, except public administration (%)
Most Common Industries - Public administration (%)
Occupation diversity
Most Common Occupations - Management, business, science, and arts occupations (%)
Most Common Occupations - Management, business, and financial occupations (%)
Most Common Occupations - Management occupations (%)
Most Common Occupations - Business and financial operations occupations (%)
Most Common Occupations - Computer, engineering, and science occupations (%)
Most Common Occupations - Computer and mathematical occupations (%)
Most Common Occupations - Architecture and engineering occupations (%)
Most Common Occupations - Life, physical, and social science occupations (%)
Most Common Occupations - Education, legal, community service, arts, and media occupations (%)
Most Common Occupations - Community and social service occupations (%)
Most Common Occupations - Legal occupations (%)
Most Common Occupations - Education, training, and library occupations (%)
Most Common Occupations - Arts, design, entertainment, sports, and media occupations (%)
Most Common Occupations - Healthcare practitioners and technical occupations (%)
Most Common Occupations - Health diagnosing and treating practitioners and other technical occupations (%)
Most Common Occupations - Health technologists and technicians (%)
Most Common Occupations - Service occupations (%)
Most Common Occupations - Healthcare support occupations (%)
Most Common Occupations - Protective service occupations (%)
Most Common Occupations - Fire fighting and prevention, and other protective service workers including supervisors (%)
Most Common Occupations - Law enforcement workers including supervisors (%)
Most Common Occupations - Food preparation and serving related occupations (%)
Most Common Occupations - Building and grounds cleaning and maintenance occupations (%)
Most Common Occupations - Personal care and service occupations (%)
Most Common Occupations - Sales and office occupations (%)
Most Common Occupations - Sales and related occupations (%)
Most Common Occupations - Office and administrative support occupations (%)
Most Common Occupations - Natural resources, construction, and maintenance occupations (%)
Most Common Occupations - Farming, fishing, and forestry occupations (%)
Most Common Occupations - Construction and extraction occupations (%)
Most Common Occupations - Installation, maintenance, and repair occupations (%)
Most Common Occupations - Production, transportation, and material moving occupations (%)
Most Common Occupations - Production occupations (%)
Most Common Occupations - Transportation occupations (%)
Most Common Occupations - Material moving occupations (%)
People in Group quarters - Institutionalized population (%)
People in Group quarters - Correctional institutions (%)
People in Group quarters - Federal prisons and detention centers (%)
People in Group quarters - Halfway houses (%)
People in Group quarters - Local jails and other confinement facilities (including police lockups) (%)
People in Group quarters - Military disciplinary barracks (%)
People in Group quarters - State prisons (%)
People in Group quarters - Other types of correctional institutions (%)
People in Group quarters - Nursing homes (%)
People in Group quarters - Hospitals/wards, hospices, and schools for the handicapped (%)
People in Group quarters - Hospitals/wards and hospices for chronically ill (%)
People in Group quarters - Hospices or homes for chronically ill (%)
People in Group quarters - Military hospitals or wards for chronically ill (%)
People in Group quarters - Other hospitals or wards for chronically ill (%)
People in Group quarters - Hospitals or wards for drug/alcohol abuse (%)
People in Group quarters - Mental (Psychiatric) hospitals or wards (%)
People in Group quarters - Schools, hospitals, or wards for the mentally retarded (%)
People in Group quarters - Schools, hospitals, or wards for the physically handicapped (%)
People in Group quarters - Institutions for the deaf (%)
People in Group quarters - Institutions for the blind (%)
People in Group quarters - Orthopedic wards and institutions for the physically handicapped (%)
People in Group quarters - Wards in general hospitals for patients who have no usual home elsewhere (%)
People in Group quarters - Wards in military hospitals for patients who have no usual home elsewhere (%)
People in Group quarters - Juvenile institutions (%)
People in Group quarters - Long-term care (%)
People in Group quarters - Homes for abused, dependent, and neglected children (%)
People in Group quarters - Residential treatment centers for emotionally disturbed children (%)
People in Group quarters - Training schools for juvenile delinquents (%)
People in Group quarters - Short-term care, detention or diagnostic centers for delinquent children (%)
People in Group quarters - Type of juvenile institution unknown (%)
People in Group quarters - Noninstitutionalized population (%)
People in Group quarters - College dormitories (includes college quarters off campus) (%)
People in Group quarters - Military quarters (%)
People in Group quarters - On base (%)
People in Group quarters - Barracks, unaccompanied personnel housing (UPH), (Enlisted/Officer), ;and similar group living quarters for military personnel (%)
People in Group quarters - Transient quarters for temporary residents (%)
People in Group quarters - Military ships (%)
People in Group quarters - Group homes (%)
People in Group quarters - Homes or halfway houses for drug/alcohol abuse (%)
People in Group quarters - Homes for the mentally ill (%)
People in Group quarters - Homes for the mentally retarded (%)
People in Group quarters - Homes for the physically handicapped (%)
People in Group quarters - Other group homes (%)
People in Group quarters - Religious group quarters (%)
People in Group quarters - Dormitories (%)
People in Group quarters - Agriculture workers' dormitories on farms (%)
People in Group quarters - Job Corps and vocational training facilities (%)
People in Group quarters - Other workers' dormitories (%)
People in Group quarters - Crews of maritime vessels (%)
People in Group quarters - Other nonhousehold living situations (%)
People in Group quarters - Other noninstitutional group quarters (%)
Residents speaking English at home (%)
Residents speaking English at home - Born in the United States (%)
Residents speaking English at home - Native, born elsewhere (%)
Residents speaking English at home - Foreign born (%)
Residents speaking Spanish at home (%)
Residents speaking Spanish at home - Born in the United States (%)
Residents speaking Spanish at home - Native, born elsewhere (%)
Residents speaking Spanish at home - Foreign born (%)
Residents speaking other language at home (%)
Residents speaking other language at home - Born in the United States (%)
Residents speaking other language at home - Native, born elsewhere (%)
Residents speaking other language at home - Foreign born (%)
Class of Workers - Employee of private company (%)
Class of Workers - Self-employed in own incorporated business (%)
Class of Workers - Private not-for-profit wage and salary workers (%)
Class of Workers - Local government workers (%)
Class of Workers - State government workers (%)
Class of Workers - Federal government workers (%)
Class of Workers - Self-employed workers in own not incorporated business and Unpaid family workers (%)
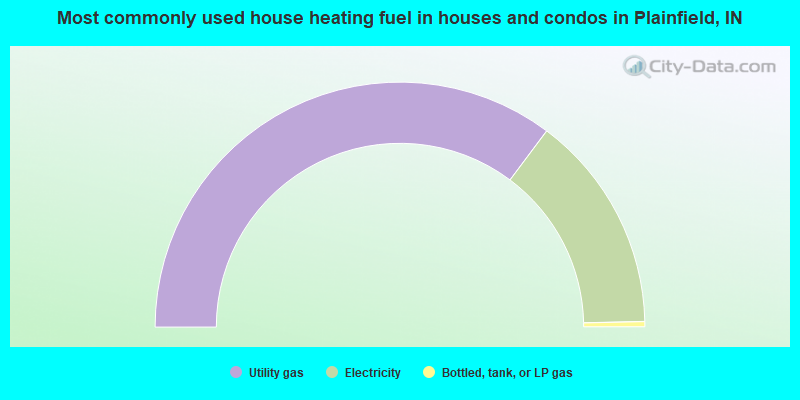
House heating fuel used in houses and condos - Utility gas (%)
House heating fuel used in houses and condos - Bottled, tank, or LP gas (%)
House heating fuel used in houses and condos - Electricity (%)
House heating fuel used in houses and condos - Fuel oil, kerosene, etc. (%)
House heating fuel used in houses and condos - Coal or coke (%)
House heating fuel used in houses and condos - Wood (%)
House heating fuel used in houses and condos - Solar energy (%)
House heating fuel used in houses and condos - Other fuel (%)
House heating fuel used in houses and condos - No fuel used (%)
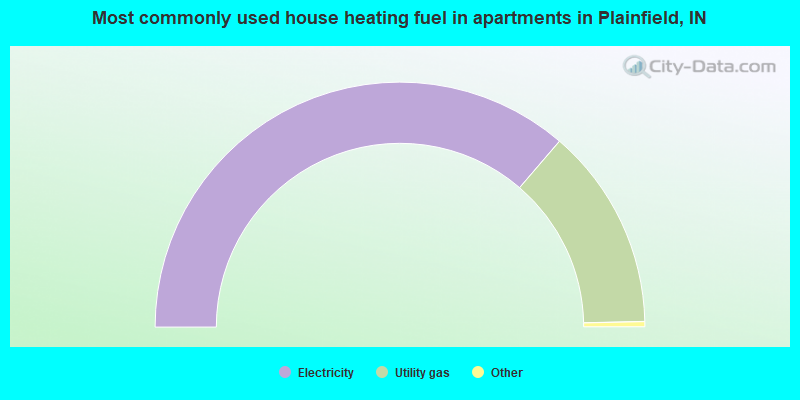
House heating fuel used in apartments - Utility gas (%)
House heating fuel used in apartments - Bottled, tank, or LP gas (%)
House heating fuel used in apartments - Electricity (%)
House heating fuel used in apartments - Fuel oil, kerosene, etc. (%)
House heating fuel used in apartments - Coal or coke (%)
House heating fuel used in apartments - Wood (%)
House heating fuel used in apartments - Solar energy (%)
House heating fuel used in apartments - Other fuel (%)
House heating fuel used in apartments - No fuel used (%)
Armed forces status - In Armed Forces (%)
Armed forces status - Civilian (%)
Armed forces status - Civilian - Veteran (%)
Armed forces status - Civilian - Nonveteran (%)
Fatal accidents locations in years 2005-2021
Fatal accidents locations in 2005
Fatal accidents locations in 2006
Fatal accidents locations in 2007
Fatal accidents locations in 2008
Fatal accidents locations in 2009
Fatal accidents locations in 2010
Fatal accidents locations in 2011
Fatal accidents locations in 2012
Fatal accidents locations in 2013
Fatal accidents locations in 2014
Fatal accidents locations in 2015
Fatal accidents locations in 2016
Fatal accidents locations in 2017
Fatal accidents locations in 2018
Fatal accidents locations in 2019
Fatal accidents locations in 2020
Fatal accidents locations in 2021
Alcohol use - People drinking some alcohol every month (%)
Alcohol use - People not drinking at all (%)
Alcohol use - Average days/month drinking alcohol
Alcohol use - Average drinks/week
Alcohol use - Average days/year people drink much
Audiometry - Average condition of hearing (%)
Audiometry - People that can hear a whisper from across a quiet room (%)
Audiometry - People that can hear normal voice from across a quiet room (%)
Audiometry - Ears ringing, roaring, buzzing (%)
Audiometry - Had a job exposure to loud noise (%)
Audiometry - Had off-work exposure to loud noise (%)
Blood Pressure & Cholesterol - Has high blood pressure (%)
Blood Pressure & Cholesterol - Checking blood pressure at home (%)
Blood Pressure & Cholesterol - Frequently checking blood cholesterol (%)
Blood Pressure & Cholesterol - Has high cholesterol level (%)
Consumer Behavior - Money monthly spent on food at supermarket/grocery store
Consumer Behavior - Money monthly spent on food at other stores
Consumer Behavior - Money monthly spent on eating out
Consumer Behavior - Money monthly spent on carryout/delivered foods
Consumer Behavior - Income spent on food at supermarket/grocery store (%)
Consumer Behavior - Income spent on food at other stores (%)
Consumer Behavior - Income spent on eating out (%)
Consumer Behavior - Income spent on carryout/delivered foods (%)
Current Health Status - General health condition (%)
Current Health Status - Blood donors (%)
Current Health Status - Has blood ever tested for HIV virus (%)
Current Health Status - Left-handed people (%)
Dermatology - People using sunscreen (%)
Diabetes - Diabetics (%)
Diabetes - Had a blood test for high blood sugar (%)
Diabetes - People taking insulin (%)
Diet Behavior & Nutrition - Diet health (%)
Diet Behavior & Nutrition - Milk product consumption (# of products/month)
Diet Behavior & Nutrition - Meals not home prepared (#/week)
Diet Behavior & Nutrition - Meals from fast food or pizza place (#/week)
Diet Behavior & Nutrition - Ready-to-eat foods (#/month)
Diet Behavior & Nutrition - Frozen meals/pizza (#/month)
Drug Use - People that ever used marijuana or hashish (%)
Drug Use - Ever used hard drugs (%)
Drug Use - Ever used any form of cocaine (%)
Drug Use - Ever used heroin (%)
Drug Use - Ever used methamphetamine (%)
Health Insurance - People covered by health insurance (%)
Kidney Conditions-Urology - Avg. # of times urinating at night
Medical Conditions - People with asthma (%)
Medical Conditions - People with anemia (%)
Medical Conditions - People with psoriasis (%)
Medical Conditions - People with overweight (%)
Medical Conditions - Elderly people having difficulties in thinking or remembering (%)
Medical Conditions - People who ever received blood transfusion (%)
Medical Conditions - People having trouble seeing even with glass/contacts (%)
Medical Conditions - People with arthritis (%)
Medical Conditions - People with gout (%)
Medical Conditions - People with congestive heart failure (%)
Medical Conditions - People with coronary heart disease (%)
Medical Conditions - People with angina pectoris (%)
Medical Conditions - People who ever had heart attack (%)
Medical Conditions - People who ever had stroke (%)
Medical Conditions - People with emphysema (%)
Medical Conditions - People with thyroid problem (%)
Medical Conditions - People with chronic bronchitis (%)
Medical Conditions - People with any liver condition (%)
Medical Conditions - People who ever had cancer or malignancy (%)
Mental Health - People who have little interest in doing things (%)
Mental Health - People feeling down, depressed, or hopeless (%)
Mental Health - People who have trouble sleeping or sleeping too much (%)
Mental Health - People feeling tired or having little energy (%)
Mental Health - People with poor appetite or overeating (%)
Mental Health - People feeling bad about themself (%)
Mental Health - People who have trouble concentrating on things (%)
Mental Health - People moving or speaking slowly or too fast (%)
Mental Health - People having thoughts they would be better off dead (%)
Oral Health - Average years since last visit a dentist
Oral Health - People embarrassed because of mouth (%)
Oral Health - People with gum disease (%)
Oral Health - General health of teeth and gums (%)
Oral Health - Average days a week using dental floss/device
Oral Health - Average days a week using mouthwash for dental problem
Oral Health - Average number of teeth
Pesticide Use - Households using pesticides to control insects (%)
Pesticide Use - Households using pesticides to kill weeds (%)
Physical Activity - People doing vigorous-intensity work activities (%)
Physical Activity - People doing moderate-intensity work activities (%)
Physical Activity - People walking or bicycling (%)
Physical Activity - People doing vigorous-intensity recreational activities (%)
Physical Activity - People doing moderate-intensity recreational activities (%)
Physical Activity - Average hours a day doing sedentary activities
Physical Activity - Average hours a day watching TV or videos
Physical Activity - Average hours a day using computer
Physical Functioning - People having limitations keeping them from working (%)
Physical Functioning - People limited in amount of work they can do (%)
Physical Functioning - People that need special equipment to walk (%)
Physical Functioning - People experiencing confusion/memory problems (%)
Physical Functioning - People requiring special healthcare equipment (%)
Prescription Medications - Average number of prescription medicines taking
Preventive Aspirin Use - Adults 40+ taking low-dose aspirin (%)
Reproductive Health - Vaginal deliveries (%)
Reproductive Health - Cesarean deliveries (%)
Reproductive Health - Deliveries resulted in a live birth (%)
Reproductive Health - Pregnancies resulted in a delivery (%)
Reproductive Health - Women breastfeeding newborns (%)
Reproductive Health - Women that had a hysterectomy (%)
Reproductive Health - Women that had both ovaries removed (%)
Reproductive Health - Women that have ever taken birth control pills (%)
Reproductive Health - Women taking birth control pills (%)
Reproductive Health - Women that have ever used Depo-Provera or injectables (%)
Reproductive Health - Women that have ever used female hormones (%)
Sexual Behavior - People 18+ that ever had sex (vaginal, anal, or oral) (%)
Sexual Behavior - Males 18+ that ever had vaginal sex with a woman (%)
Sexual Behavior - Males 18+ that ever performed oral sex on a woman (%)
Sexual Behavior - Males 18+ that ever had anal sex with a woman (%)
Sexual Behavior - Males 18+ that ever had any sex with a man (%)
Sexual Behavior - Females 18+ that ever had vaginal sex with a man (%)
Sexual Behavior - Females 18+ that ever performed oral sex on a man (%)
Sexual Behavior - Females 18+ that ever had anal sex with a man (%)
Sexual Behavior - Females 18+ that ever had any kind of sex with a woman (%)
Sexual Behavior - Average age people first had sex
Sexual Behavior - Average number of female sex partners in lifetime (males 18+)
Sexual Behavior - Average number of female vaginal sex partners in lifetime (males 18+)
Sexual Behavior - Average age people first performed oral sex on a woman (18+)
Sexual Behavior - Average number of woman performed oral sex on in lifetime (18+)
Sexual Behavior - Average number of male sex partners in lifetime (males 18+)
Sexual Behavior - Average number of male anal sex partners in lifetime (males 18+)
Sexual Behavior - Average age people first performed oral sex on a man (18+)
Sexual Behavior - Average number of male oral sex partners in lifetime (18+)
Sexual Behavior - People using protection when performing oral sex (%)
Sexual Behavior - Average number of times people have vaginal or anal sex a year
Sexual Behavior - People having sex without condom (%)
Sexual Behavior - Average number of male sex partners in lifetime (females 18+)
Sexual Behavior - Average number of male vaginal sex partners in lifetime (females 18+)
Sexual Behavior - Average number of female sex partners in lifetime (females 18+)
Sexual Behavior - Circumcised males 18+ (%)
Sleep Disorders - Average hours sleeping at night
Sleep Disorders - People that has trouble sleeping (%)
Smoking-Cigarette Use - People smoking cigarettes (%)
Taste & Smell - People 40+ having problems with smell (%)
Taste & Smell - People 40+ having problems with taste (%)
Taste & Smell - People 40+ that ever had wisdom teeth removed (%)
Taste & Smell - People 40+ that ever had tonsils teeth removed (%)
Taste & Smell - People 40+ that ever had a loss of consciousness because of a head injury (%)
Taste & Smell - People 40+ that ever had a broken nose or other serious injury to face or skull (%)
Taste & Smell - People 40+ that ever had two or more sinus infections (%)
Weight - Average height (inches)
Weight - Average weight (pounds)
Weight - Average BMI
Weight - People that are obese (%)
Weight - People that ever were obese (%)
Weight - People trying to lose weight (%)
According to our research of Indiana and other state lists, there were 37 registered sex offenders living in Plainfield, Indiana as of June 16, 2024 . The ratio of all residents to sex offenders in Plainfield is 825 to 1.The ratio of registered sex offenders to all residents in this city is lower than the state average.
Officers per 1,000 residents here:
1.64Indiana average:
2.16
Latest news from Plainfield, IN collected exclusively by city-data.com from local newspapers, TV, and radio stations
Ancestries: American (37.2%), German (9.3%), English (9.2%), Irish (5.0%), Ethiopian (3.9%), European (2.5%).
Current Local Time:
Land area: 18.0 square miles.
Population density: 2,006 people per square mile (low).
3,697 residents are foreign born (4.4% Asia , 2.7% Africa , 2.0% Latin America ).
This town:
10.1%Indiana:
5.6%
Median real estate property taxes paid for housing units with mortgages in 2022: $2,201 (0.8%)Median real estate property taxes paid for housing units with no mortgage in 2022: $1,937 (0.9%)
Nearest city with pop. 50,000+: Indianapolis, IN
Nearest city with pop. 1,000,000+: Chicago, IL
Nearest cities:
Latitude: 39.70 N, Longitude: 86.38 W
Daytime population change due to commuting: +16,602 (+45.5%)Workers who live and work in this town: 7,688 (44.7%)
Plainfield tourist attractions:
Single-family new house construction building permits:
2022: 102 buildings , average cost: $343,3002021: 276 buildings , average cost: $320,9002020: 213 buildings , average cost: $269,9002019: 244 buildings , average cost: $250,8002018: 304 buildings , average cost: $231,8002017: 250 buildings , average cost: $217,8002016: 268 buildings , average cost: $221,3002015: 167 buildings , average cost: $181,3002014: 149 buildings , average cost: $186,5002013: 161 buildings , average cost: $189,0002012: 145 buildings , average cost: $187,7002011: 95 buildings , average cost: $173,0002010: 71 buildings , average cost: $176,9002009: 102 buildings , average cost: $181,7002008: 88 buildings , average cost: $228,3002007: 119 buildings , average cost: $207,3002006: 218 buildings , average cost: $185,0002005: 359 buildings , average cost: $162,4002004: 365 buildings , average cost: $142,7002003: 309 buildings , average cost: $130,3002002: 480 buildings , average cost: $101,9002001: 453 buildings , average cost: $101,9002000: 454 buildings , average cost: $101,6001999: 253 buildings , average cost: $99,5001998: 151 buildings , average cost: $86,7001997: 121 buildings , average cost: $79,700Unemployment in December 2023:
Most common occupations in Plainfield, IN (%)
Both Males Females
Other sales and related occupations, including supervisors (5.6%)
Other office and administrative support workers, including supervisors (5.2%)
Driver/sales workers and truck drivers (4.7%)
Electrical equipment mechanics and other installation, maintenance, and repair workers, including supervisors (4.6%)
Building and grounds cleaning and maintenance occupations (3.5%)
Other production occupations, including supervisors (3.3%)
Secretaries and administrative assistants (3.3%)
Electrical equipment mechanics and other installation, maintenance, and repair workers, including supervisors (8.9%)
Driver/sales workers and truck drivers (7.9%)
Other production occupations, including supervisors (5.0%)
Material recording, scheduling, dispatching, and distributing workers (4.7%)
Vehicle and mobile equipment mechanics, installers, and repairers (4.4%)
Other sales and related occupations, including supervisors (4.3%)
Building and grounds cleaning and maintenance occupations (4.0%)
Other office and administrative support workers, including supervisors (7.7%)
Other sales and related occupations, including supervisors (7.0%)
Secretaries and administrative assistants (6.9%)
Preschool, kindergarten, elementary, and middle school teachers (4.5%)
Customer service representatives (4.2%)
Information and record clerks, except customer service representatives (4.1%)
Registered nurses (3.7%)
Tornado activity:
Plainfield-area historical tornado activity is slightly above Indiana state average. It is 119% greater than the overall U.S. average.
On 5/14/1972, a category F4 (max. wind speeds 207-260 mph) tornado 17.0 miles away from the Plainfield town center injured 20 people and caused between $50,000 and $500,000 in damages.
On 6/11/1998, a category F4 tornado 23.8 miles away from the town center injured 4 people and caused $2 million in damages.
Earthquake activity:
Plainfield-area historical earthquake activity is significantly above Indiana state average. It is 90% greater than the overall U.S. average. On 4/18/2008 at 09:36:59, a magnitude 5.4 (5.1 MB, 4.8 MS, 5.4 MW, 5.2 MW, Class: Moderate, Intensity: VI - VII) earthquake occurred 118.0 miles away from the city center On 4/18/2008 at 09:36:59, a magnitude 5.2 (5.2 MW, Depth: 8.9 mi) earthquake occurred 118.0 miles away from the city center On 6/10/1987 at 23:48:54, a magnitude 5.1 (4.9 MB, 4.4 MS, 4.6 MS, 5.1 LG) earthquake occurred 100.7 miles away from the city center On 7/27/1980 at 18:52:21, a magnitude 5.2 (5.1 MB, 4.7 MS, 5.0 UK, 5.2 UK) earthquake occurred 167.0 miles away from Plainfield center On 6/18/2002 at 17:37:15, a magnitude 5.0 (4.3 MB, 4.6 MW, 5.0 LG) earthquake occurred 140.2 miles away from the city center On 4/18/2008 at 15:14:16, a magnitude 4.8 (4.5 MB, 4.8 MW, 4.6 MW, Class: Light, Intensity: IV - V) earthquake occurred 115.3 miles away from Plainfield center Magnitude types: regional Lg-wave magnitude (LG), body-wave magnitude (MB), surface-wave magnitude (MS), moment magnitude (MW) Natural disasters: The number of natural disasters in Hendricks County (11) is smaller than the US average (15).Major Disasters (Presidential) Declared: 7Emergencies Declared: 3Floods: 4, Storms: 4, Tornadoes: 3, Winter Storms: 3, Blizzard: 1, Hurricane: 1, Snow: 1, Snowstorm: 1, Other: 1 (Note: some incidents may be assigned to more than one category). Main business address for: BRIGHTPOINT INC WHOLESALE-ELECTRONIC PARTS & EQUIPMENT, NEC ), PSI ENERGY INC ELECTRIC SERVICES ), LINCOLN BANCORP /IN/ SAVINGS INSTITUTION, FEDERALLY CHARTERED ).
Hospitals and medical centers in Plainfield: DAMAR SERVICES, INC.--MAIN ST (411 E MAIN ST) PLAINFIELD HEALTH CARE CENTER (3700 CLARKS CREEK RD)
VINEWOOD NURSING HOME (404 NORTH VINE STREET)
DSI - PLAINFIELD (8110 NETWORK DRIVE)
GRACE HOME HEALTH CARE SERVICES (1712 E MAIN ST)
Heliports located in Plainfield: Amtrak station near Plainfield: 13 miles: INDIANAPOLIS (350 S. ILLINOIS ST.) Services: ticket office, partially wheelchair accessible, public payphones, full-service food facilities, free short-term parking, paid long-term parking, call for car rental service, taxi stand, intercity bus service.
Colleges/universities with over 2000 students nearest to Plainfield:
Indiana University-Purdue University-Indianapolis (about 13 miles; Indianapolis, IN ; Full-time enrollment: 22,751)
Marian University (about 13 miles; Indianapolis, IN ; FT enrollment: 2,476)
American College of Education (about 13 miles; Indianapolis, IN ; FT enrollment: 2,718)
University of Indianapolis (about 14 miles; Indianapolis, IN ; FT enrollment: 4,625)
Harrison College-Indianapolis (about 14 miles; Indianapolis, IN ; FT enrollment: 4,244)
Ivy Tech Community College (about 15 miles; Indianapolis, IN ; FT enrollment: 71,493)
Butler University (about 16 miles; Indianapolis, IN ; FT enrollment: 4,388)
Public high school in Plainfield:
Public elementary/middle schools in Plainfield:
Private elementary/middle school in Plainfield:
See full list of schools located in Plainfield Library in Plainfield: PLAINFIELD-GUILFORD TOWNSHIP PUBLIC LIBRARY Operating income: $1,447,376; Location: 1120 STAFFORD ROAD; 121,606 books ; 4,905 audio materials ; 6,762 video materials ; 7 local licensed databases ; 37 state licensed databases ; 421 print serial subscriptions )
Notable locations in Plainfield: (A) , Plainfield Fire Department (B) , Indiana Youth Center (C) , Plainfield Fire Department Headquarters (D) , Plainfield Fire Department Station 122 (E) , Plainfield Fire Department Station 121 (F) . Display/hide their locations on the map
Main business address in Plainfield include: (A) , PSI ENERGY INC (B) , LINCOLN BANCORP /IN/ (C) . Display/hide their locations on the map
Churches in Plainfield include: (A) , First Baptist Church (B) , Plainfield United Methodist Church (C) , Saint Mark's Episcopal Church (D) , Hope United Presbyterian Church (E) , Calvary Bible Wesleyan Church (F) , Plainfield Friends Meetinghouse (G) , New Beginning Church (H) , Bethel African Methodist Episcopal Church (I) . Display/hide their locations on the map
Cemeteries: (1) , Maple Hill Cemetery (2) , Sugar Grove Cemetery (3) . Display/hide their locations on the map
Reservoir: (A) . Display/hide its location on the map
Creeks: (A) , George Creek (B) , North Creek (C) , Center Creek (D) , Middle Creek (E) , Luck Creek (F) . Display/hide their locations on the map
Parks in Plainfield include: (1) , Swinford Park (2) , Franklin Park (3) . Display/hide their locations on the map
Hotels: (1) , Hampton Inn Indianapolis-SW-Plainfield (2244 Hadley Road) (2) , Days Inn Indianapolis Plainfield (2245 East Hadley Road) (3) , Amerihost Inn Plainfield IN (6105 Cambridge Way) (4) , Clover-West Motel (3155 East Main Street) (5) , Amerihost Inn - Plainfield (6105 Cambridge Way) (6) , Lees Inn & Suites Plainfield (6010 Gateway Drive) (7) , Ramada Limited (6023 Gateway Drive) (8) , Ramada Limited Plainfield IN (6023 Gateway Drive) (9) . Display/hide their approximate locations on the map
Court: (1) . Display/hide its approximate location on the map
Birthplace of: Kelly Faris - Basketball player, Forrest Tucker - Actor, Paul Franklin (American football) - Football player.
Hendricks County has a predicted average indoor radon screening level greater than 4 pCi/L (pico curies per liter) - Highest Potential Drinking water stations with addresses in Plainfield and their reported violations in the past:
LIBERTY WATER (Population served: 373, Groundwater):
Past health violations:
MCL, Monthly (TCR) - In JUN-2006, Contaminant: Coliform. Follow-up actions: St Public Notif requested (JUN-26-2006), St Violation/Reminder Notice (JUN-26-2006), St Public Notif received (JUL-07-2006), St Compliance achieved (OCT-26-2009)
MCL, Monthly (TCR) - In MAY-2006, Contaminant: Coliform. Follow-up actions: St Boil Water Order (MAY-19-2006), St Violation/Reminder Notice (MAY-19-2006), St Public Notif requested (MAY-19-2006), St Public Notif received (MAY-25-2006), St Compliance achieved (OCT-26-2009)
MCL, Monthly (TCR) - In APR-2006, Contaminant: Coliform. Follow-up actions: St Boil Water Order (APR-17-2006), St Violation/Reminder Notice (APR-17-2006), St Public Notif requested (APR-17-2006), St Public Notif received (MAY-25-2006), St Compliance achieved (OCT-26-2009)
MCL, Monthly (TCR) - In MAY-2005, Contaminant: Coliform. Follow-up actions: St Boil Water Order (MAY-23-2005), St Violation/Reminder Notice (MAY-23-2005), St Public Notif received (MAY-23-2005), St Public Notif requested (MAY-23-2005), St Compliance achieved (MAR-09-2006)
Serves KY, Population served: 150, Groundwater):
Past monitoring violations:
Monitoring and Reporting (DBP) - Between OCT-2011 and DEC-2011, Contaminant: Total Haloacetic Acids (HAA5). Follow-up actions: St Public Notif requested (FEB-01-2012), St Formal NOV issued (FEB-01-2012), St Public Notif received (FEB-27-2012), St Compliance achieved (MAY-14-2012)
Monitoring and Reporting (DBP) - Between OCT-2011 and DEC-2011, Contaminant: TTHM. Follow-up actions: St Public Notif requested (FEB-01-2012), St Formal NOV issued (FEB-01-2012), St Public Notif received (FEB-27-2012), St Compliance achieved (MAY-14-2012)
One regular monitoring violation
Population served: 25, Groundwater):
Past health violations:
MCL, Monthly (TCR) - In DEC-2008, Contaminant: Coliform. Follow-up actions: St Public Notif requested (FEB-20-2009), St Violation/Reminder Notice (FEB-20-2009), St Compliance achieved (MAR-10-2010)
Past monitoring violations:
Monitoring, Repeat Major (TCR) - In DEC-2008, Contaminant: Coliform (TCR). Follow-up actions: St Public Notif requested (FEB-20-2009), St Violation/Reminder Notice (FEB-20-2009), St Compliance achieved (MAR-10-2010)
6 routine major monitoring violations
One regular monitoring violation
Average household size: This town:
2.6 peopleIndiana:
2.5 people
Percentage of family households: This town:
69.3%Whole state:
66.9%
Percentage of households with unmarried partners: This town:
6.7%Whole state:
6.9%
Likely homosexual households (counted as self-reported same-sex unmarried-partner households)
Lesbian couples: 0.5% of all households Gay men: 0.3% of all households
People in group quarters in Plainfield in 2010:
2,444 people in state prisons
145 people in nursing facilities/skilled-nursing facilities
20 people in other noninstitutional facilities
6 people in group homes for juveniles (non-correctional)
People in group quarters in Plainfield in 2000:
649 people in state prisons
329 people in halfway houses
181 people in nursing homes
8 people in homes for the mentally retarded
Banks with most branches in Plainfield (2011 data):
Old National Bank: Plainfield Branch, Plainfield/Kroger Branch, East Main Street/Wal-Mart Branch. Info updated 2011/08/01: Bank assets: $8,467.9 mil, Deposits: $6,653.1 mil, headquarters in Evansville, IN, positive income , 195 total offices , Holding Company: Old National Bancorp
The Huntington National Bank: Plainfield Branch at 2200 Stafford Road, branch established on 1997/06/16. Info updated 2012/04/02: Bank assets: $54,183.4 mil, Deposits: $44,300.3 mil, headquarters in Columbus, OH, positive income , Commercial Lending Specialization, 878 total offices , Holding Company: Huntington Bancshares Incorporated
First National Bank: Plainfield Branch at 101 West Main Street, branch established on 2002/12/02. Info updated 2006/11/03: Bank assets: $247.5 mil, Deposits: $223.7 mil, headquarters in Cloverdale, IN, positive income , 7 total offices , Holding Company: First National Bank Corp
State Bank of Lizton: Plainfield Branch at 2100 Stafford Road, branch established on 2009/12/01. Info updated 2006/11/03: Bank assets: $376.5 mil, Deposits: $337.0 mil, headquarters in Lizton, IN, positive income , Commercial Lending Specialization, 10 total offices , Holding Company: Lizton Financial Corporation
BMO Harris Bank National Association: Plainfield Branch at 2609 East Main Street, Suite G, branch established on 1998/05/11. Info updated 2011/07/14: Bank assets: $97,264.0 mil, Deposits: $75,624.6 mil, headquarters in Chicago, IL, positive income , 717 total offices , Holding Company: Bank Of Montreal
First Merchants Bank National Association: Plainfield at 1121 East Main Street, branch established on 2005/04/11. Info updated 2012/02/13: Bank assets: $4,154.9 mil, Deposits: $3,154.7 mil, headquarters in Muncie, IN, positive income , Commercial Lending Specialization, 89 total offices , Holding Company: First Merchants Corporation
Hendricks County Bank and Trust Company: Plainfield Branch at 1649 East Main Street, branch established on 1960/03/24. Info updated 2006/11/03: Bank assets: $146.2 mil, Deposits: $126.9 mil, headquarters in Brownsburg, IN, negative income in the last year , Commercial Lending Specialization, 5 total offices , Holding Company: Midstate Financial Corporation
PNC Bank, National Association: Plainfield at 2401 East Main Street, branch established on 1983/06/27. Info updated 2012/03/20: Bank assets: $263,309.6 mil, Deposits: $197,343.0 mil, headquarters in Wilmington, DE, positive income , Commercial Lending Specialization, 3085 total offices , Holding Company: Pnc Financial Services Group, Inc., The
Flagstar Bank, FSB: Plainfield Branch at 2485 E. Main Street, branch established on 2005/02/23. Info updated 2011/07/21: Bank assets: $13,623.5 mil, Deposits: $7,802.8 mil, headquarters in Troy, MI, negative income in the last year , Mortgage Lending Specialization, 135 total offices
3 other banks with 3 local branches
For population 15 years and over in Plainfield:
Never married: 33.7%Now married: 46.7%Separated: 0.6%Widowed: 5.1%Divorced: 13.9% For population 25 years and over in Plainfield:
High school or higher: 89.9%Bachelor's degree or higher: 31.3%Graduate or professional degree: 11.3%Unemployed: 3.1%Mean travel time to work (commute): 18.5 minutes
Education Gini index (Inequality in education) Here:
10.5Indiana average:
11.3
Religion statistics for Plainfield, IN (based on Hendricks County data)
Religion Adherents Congregations Evangelical Protestant 31,617 76 Mainline Protestant 11,909 32 Catholic 10,861 3 Other 4,591 11 Black Protestant 317 2 None 86,153 -
Source: Clifford Grammich, Kirk Hadaway, Richard Houseal, Dale E.Jones, Alexei Krindatch, Richie Stanley and Richard H.Taylor. 2012. 2010 U.S.Religion Census: Religious Congregations & Membership Study. Association of Statisticians of American Religious Bodies. Jones, Dale E., et al. 2002. Congregations and Membership in the United States 2000. Nashville, TN: Glenmary Research Center. Graphs represent county-level data
Food Environment Statistics: Number of grocery stores : 9Hendricks County :
0.67 / 10,000 pop.State :
1.73 / 10,000 pop.
Number of supercenters and club stores : 4Hendricks County :
0.30 / 10,000 pop.State :
0.21 / 10,000 pop.
Number of convenience stores (no gas) : 2Hendricks County :
0.15 / 10,000 pop.Indiana :
0.50 / 10,000 pop.
Number of convenience stores (with gas) : 43Hendricks County :
3.20 / 10,000 pop.State :
3.57 / 10,000 pop.
Number of full-service restaurants : 91This county :
6.78 / 10,000 pop.Indiana :
6.78 / 10,000 pop.
Adult obesity rate : Hendricks County :
27.6%Indiana :
29.0%
Low-income preschool obesity rate : This county :
16.0%Indiana :
14.3%
Health and Nutrition: Healthy diet rate : Plainfield:
51.1%Indiana:
49.3%
Average overall health of teeth and gums : Plainfield:
48.9%Indiana:
46.2%
Average BMI : Plainfield:
28.8Indiana:
28.7
People feeling badly about themselves : This city:
21.3%State:
21.3%
People not drinking alcohol at all : Plainfield:
10.3%Indiana:
10.6%
Average hours sleeping at night : Overweight people : This city:
34.6%Indiana:
33.9%
General health condition : Plainfield:
57.9%Indiana:
56.1%
Average condition of hearing : More about Health and Nutrition of Plainfield, IN Residents
Local government employment and payroll (March 2022)
Function
Full-time employees
Monthly full-time payroll
Average yearly full-time wage
Part-time employees
Monthly part-time payroll
Firefighters
88 $551,364 $75,186 0 $0 Police Protection - Officers
68 $467,701 $82,535 0 $0 Other and Unallocable
42 $200,087 $57,168 2 $1,457 Parks and Recreation
24 $89,889 $44,945 101 $65,034 Financial Administration
24 $55,269 $27,635 2 $1,872 Sewerage
19 $99,185 $62,643 0 $0 Streets and Highways
15 $70,536 $56,429 0 $0 Other Government Administration
14 $79,823 $68,420 0 $0 Water Supply
11 $60,280 $65,760 0 $0 Police - Other
7 $32,050 $54,943 0 $0 Judicial and Legal
3 $10,925 $43,700 0 $0 Housing and Community Development (Local)
1 $8,268 $99,216 0 $0 Fire - Other
1 $4,652 $55,824 1 $837
Totals for Government
317 $1,730,029 $65,490 106 $69,200
Plainfield government finances - Expenditure in 2021 (per resident):
Construction - Regular Highways: $3,329,000 ($92.28)
Current Operations - Local Fire Protection: $9,548,000 ($264.68)
Sewerage: $6,038,000 ($167.38)Central Staff Services: $4,662,000 ($129.23)General - Other: $4,544,000 ($125.96)Water Utilities: $4,344,000 ($120.42)Police Protection: $4,049,000 ($112.24)Parks and Recreation: $3,987,000 ($110.52)Regular Highways: $1,265,000 ($35.07)Financial Administration: $756,000 ($20.96)Judicial and Legal Services: $321,000 ($8.90)General - Interest on Debt: $5,214,000 ($144.54)
Other Capital Outlay - Sewerage: $2,708,000 ($75.07)
Parks and Recreation: $2,303,000 ($63.84)Water Utilities: $739,000 ($20.49)Local Fire Protection: $533,000 ($14.78)Police Protection: $91,000 ($2.52)Total Salaries and Wages: $19,151,000 ($530.88)
Water Utilities - Interest on Debt: $101,000 ($2.80)
Plainfield government finances - Revenue in 2021 (per resident):
Charges - Sewerage: $13,780,000 ($381.99)
Parks and Recreation: $835,000 ($23.15)Miscellaneous Commercial Activities: $220,000 ($6.10)Federal Intergovernmental - Public Welfare: $1,523,000 ($42.22)
Miscellaneous - General Revenue - Other: $1,202,000 ($33.32)
Interest Earnings: $988,000 ($27.39)Rents: $47,000 ($1.30)Donations From Private Sources: $19,000 ($0.53)Revenue - Water Utilities: $4,809,000 ($133.31)
State Intergovernmental - Highways: $1,714,000 ($47.51)
General Local Government Support: $170,000 ($4.71)Public Welfare: $42,000 ($1.16)Tax - Property: $37,941,000 ($1051.75)
Public Utilities Sales: $3,249,000 ($90.06)Motor Vehicle License: $1,202,000 ($33.32)Other Selective Sales: $1,132,000 ($31.38)
Plainfield government finances - Debt in 2021 (per resident):
Long Term Debt - Outstanding Unspecified Public Purpose: $144,865,000 ($4015.77)
Beginning Outstanding - Unspecified Public Purpose: $107,245,000 ($2972.92)Issue, Unspecified Public Purpose: $53,995,000 ($1496.78)Retired Unspecified Public Purpose: $16,375,000 ($453.93)Short Term Debt Outstanding - Beginning: $3,387,000 ($93.89)
End of Fiscal Year: $2,436,000 ($67.53)
Plainfield government finances - Cash and Securities in 2021 (per resident):
Bond Funds - Cash and Securities: $35,675,000 ($988.94)
Other Funds - Cash and Securities: $20,700,000 ($573.82)
Sinking Funds - Cash and Securities: $7,543,000 ($209.10)
Businesses in Plainfield, IN
Name Count Name Count
AT&T 1 Justice 2 Ace Hardware 1 KFC 1 Advance Auto Parts 1 Kohl's 1 Aeropostale 1 Kroger 1 American Eagle Outfitters 1 La Quinta 1 Ann Taylor 1 Lane Bryant 1 Applebee's 1 LensCrafters 1 Arby's 2 Long John Silver's 1 AutoZone 1 Maurices 1 Barnes & Noble 1 McDonald's 2 Bath & Body Works 1 Motel 6 1 Baymont Inn 1 Motherhood Maternity 1 Best Western 1 Nike 7 Big O Tires 1 Old Navy 1 Buffalo Wild Wings 1 Pac Sun 1 Burger King 1 Panda Express 1 CVS 2 Panera Bread 1 Cambria 1 Payless 1 Charlotte Russe 1 PetSmart 1 Chevrolet 1 Pier 1 Imports 1 Chick-Fil-A 1 Pizza Hut 1 Chico's 1 Qdoba Mexican Grill 1 Circle K 1 Quiznos 1 Cold Stone Creamery 1 RadioShack 1 Coldwater Creek 1 Red Robin 1 Comfort Inn 1 Rue21 1 Cracker Barrel 1 SAS Shoes 1 Dairy Queen 1 Sephora 1 Days Inn 1 Shoe Carnival 1 Deb 1 Sprint Nextel 1 Dennys 1 Staples 1 Discount Tire 1 Starbucks 1 Domino's Pizza 1 Steak 'n Shake 1 DressBarn 1 Subway 4 Dressbarn 1 Super 8 1 Fashion Bug 1 T-Mobile 2 FedEx 8 T.J.Maxx 1 Finish Line 1 Taco Bell 1 Ford 1 Target 1 GNC 1 Toys"R"Us 1 GameStop 1 U-Haul 1 Goodwill 1 UPS 10 H&R Block 1 Value City Furniture 1 Hardee's 1 Vans 1 Hilton 2 Verizon Wireless 2 Holiday Inn 2 Victoria's Secret 1 Hot Topic 1 Walgreens 1 JCPenney 1 Walmart 1 Jimmy John's 1 Wendy's 1 JoS. A. Bank 1 White Castle 1 Journeys 1 Wingate 1
Strongest AM radio stations in Plainfield:
WIBC (1070 AM; 50 kW; INDIANAPOLIS, IN; Owner: EMMIS RADIO LICENSE CORPORATION)
WTLC (1310 AM; 5 kW; INDIANAPOLIS, IN; Owner: RADIO ONE OF INDIANA, LLC)
WXLW (950 AM; 5 kW; INDIANAPOLIS, IN)
WXNT (1430 AM; 5 kW; INDIANAPOLIS, IN; Owner: MYSTAR COMMUNICATIONS CORPORATION)
WNTS (1590 AM; 5 kW; BEECH GROVE, IN; Owner: S + M BROADCASTING CO., INC.)
WNDE (1260 AM; 5 kW; INDIANAPOLIS, IN; Owner: CAPSTAR TX LIMITED PARTNERSHIP)
WBRI (1500 AM; daytime; 5 kW; INDIANAPOLIS, IN)
WLW (700 AM; 50 kW; CINCINNATI, OH; Owner: JACOR BROADCASTING CORPORATION)
WHAS (840 AM; 50 kW; LOUISVILLE, KY; Owner: CLEAR CHANNEL BROADCASTING LICENSES, INC.)
WOWO (1190 AM; 50 kW; FORT WAYNE, IN; Owner: PATHFINDER COMMUNICATIONS CORPORATION)
WSAI (1530 AM; 50 kW; CINCINNATI, OH; Owner: JACOR BROADCASTING CORPORATION)
WGCL (1370 AM; 5 kW; BLOOMINGTON, IN; Owner: SARKES TARZIAN, INC,)
WSYW (810 AM; daytime; 0 kW; INDIANAPOLIS, IN; Owner: CONTINENTAL BROADCAST GROUP, LLC)
Strongest FM radio stations in Plainfield:
WRDZ-FM (98.3 FM; PLAINFIELD, IN; Owner: ABC, INC.)
WHHH (96.3 FM; INDIANAPOLIS, IN; Owner: RADIO ONE OF INDIANA, LLC)
WFBQ (94.7 FM; INDIANAPOLIS, IN; Owner: CAPSTAR TX LIMITED PARTNERSHIP)
WEDJ (107.1 FM; DANVILLE, IN; Owner: CONTINENTAL BROADCAST GROUP, LLC)
WRZX (103.3 FM; INDIANAPOLIS, IN; Owner: CAPSTAR TX LIMITED PARTNERSHIP)
WENS (97.1 FM; SHELBYVILLE, IN; Owner: EMMIS RADIO LICENSE CORPORATION)
WNOU (93.1 FM; INDIANAPOLIS, IN; Owner: EMMIS RADIO LICENSE CORPORATION)
WTPI (107.9 FM; INDIANAPOLIS, IN; Owner: MYSTAR COMMUNICATIONS CORPORATION)
WZPL (99.5 FM; GREENFIELD, IN; Owner: MYSTAR COMMUNICATIONS CORPORATION)
WFMS (95.5 FM; INDIANAPOLIS, IN; Owner: WFMS LICO, INC)
WYXB (105.7 FM; INDIANAPOLIS, IN; Owner: EMMIS RADIO LICENSE CORPORATION)
WTTS (92.3 FM; BLOOMINGTON, IN; Owner: SARKES TARZIAN, INC.)
WKLU (101.9 FM; BROWNSBURG, IN; Owner: QUINN BROADCASTING, INC.)
WFYI-FM (90.1 FM; INDIANAPOLIS, IN; Owner: METROPOLITAN IN. PUBLIC B/CING, INC.)
WYJZ (100.9 FM; LEBANON, IN; Owner: RADIO ONE OF INDIANA, LLC)
WCBK-FM (102.3 FM; MARTINSVILLE, IN; Owner: MID-AMERICA RADIO GROUP, INC.)
WTLC-FM (106.7 FM; GREENWOOD, IN; Owner: RADIO ONE OF INDIANA, LLC)
WGLD (104.5 FM; INDIANAPOLIS, IN; Owner: INDY LICO, INC)
WSPM (89.1 FM; CLOVERDALE, IN; Owner: HOOSIER BROADCASTING CORPORATION)
WIJY (95.9 FM; FRANKLIN, IN; Owner: PILGRIM COMMUNICATIONS, LLC)
TV broadcast stations around Plainfield:
WKOG-LP (Channel 31; INDIANAPOLIS, IN; Owner: KINGDOM OF GOD MINISTRIES, INC.)
WDNI-LP (Channel 65; INDIANAPOLIS, IN; Owner: RADIO ONE OF INDIANA, LLC)
WIPX-LP (Channel 51; INDIANAPOLIS, IN; Owner: PAXSON COMMUNICATIONS LICENSE COMPANY, LLC)
WISH-TV (Channel 8; INDIANAPOLIS, IN; Owner: INDIANA BROADCASTING, LLC)
WXIN (Channel 59; INDIANAPOLIS, IN; Owner: TRIBUNE TELEVISION COMPANY)
WHMB-TV (Channel 40; INDIANAPOLIS, IN; Owner: LESEA BROADCASTING CORPORATION)
WRTV (Channel 6; INDIANAPOLIS, IN; Owner: MCGRAW-HILL BROADCASTING COMPANY, INC.)
WBXI-CA (Channel 47; INDIANAPOLIS, IN; Owner: THE BOX WORLDWIDE LLC)
WTHR (Channel 13; INDIANAPOLIS, IN; Owner: VIDEOINDIANA, INC.)
WFYI (Channel 20; INDIANAPOLIS, IN; Owner: METROPOLITAN INDIANAPOLIS PUBLIC BROADCASTING, INC.)
WTBU-TV (Channel 69; INDIANAPOLIS, IN; Owner: BUTLER UNIVERSITY)
WIIH-CA (Channel 11; INDIANAPOLIS, IN; Owner: INDIANA BROADCASTING, LLC)
WALV-CA (Channel 50; INDIANAPOLIS, IN; Owner: VIDEOHIO, INC..)
WTTV (Channel 4; BLOOMINGTON, IN; Owner: TRIBUNE BROADCAST HOLDINGS, INC.)
WIPX (Channel 63; BLOOMINGTON, IN; Owner: PAXSON INDIANAPOLIS LICENSE, INC.)
WCLJ (Channel 42; BLOOMINGTON, IN; Owner: TRINITY BROADCASTING OF INDIANA, INC.)
WTIU (Channel 30; BLOOMINGTON, IN; Owner: THE TRUSTEES OF INDIANA UNIVERSITY)
WNDY-TV (Channel 23; MARION, IN; Owner: UPN STATIONS GROUP INC.)
WREP-LP (Channel 15; MARTINSVILLE, IN; Owner: METROPOLITAN SCH. DIST. MARTINSVILLE)
National Bridge Inventory (NBI) Statistics 86 Number of bridges784ft / 239m Total length $2,606,000 Total costs1,133,978 Total average daily traffic135,854 Total average daily truck traffic
New bridges - historical statistics
1 1900-1909 3 1930-1939 3 1940-1949 1 1950-1959 25 1960-1969 3 1970-1979 7 1980-1989 6 1990-1999 26 2000-2009 8 2010-2019 3 2020-2022
See full National Bridge Inventory statistics for Plainfield, IN
Home Mortgage Disclosure Act Aggregated Statistics For Year 2009(Based on 1 full and 3 partial tracts) A) FHA, FSA/RHS & VA B) Conventional C) Refinancings D) Home Improvement Loans F) Non-occupant Loans on G) Loans On Manufactured Number Average Value Number Average Value Number Average Value Number Average Value Number Average Value Number Average Value
LOANS ORIGINATED 166 $133,211 115 $153,402 567 $152,101 14 $61,553 22 $87,930 1 $37,320 APPLICATIONS APPROVED, NOT ACCEPTED 7 $126,259 9 $156,749 35 $158,923 5 $105,254 2 $100,155 2 $77,075 APPLICATIONS DENIED 29 $120,754 7 $116,430 190 $153,943 13 $60,577 8 $118,286 1 $73,810 APPLICATIONS WITHDRAWN 18 $138,519 12 $164,568 101 $144,528 1 $41,470 3 $103,973 0 $0 FILES CLOSED FOR INCOMPLETENESS 3 $117,987 1 $158,060 33 $150,572 1 $204,200 0 $0 0 $0
Aggregated Statistics For Year 2008(Based on 1 full and 3 partial tracts) A) FHA, FSA/RHS & VA B) Conventional C) Refinancings D) Home Improvement Loans E) Loans on Dwellings For 5+ Families F) Non-occupant Loans on G) Loans On Manufactured Number Average Value Number Average Value Number Average Value Number Average Value Number Average Value Number Average Value Number Average Value
LOANS ORIGINATED 131 $137,392 187 $143,541 278 $151,640 30 $44,596 1 $2,970,940 38 $91,104 2 $52,355 APPLICATIONS APPROVED, NOT ACCEPTED 7 $151,500 17 $165,968 39 $137,054 3 $66,727 0 $0 1 $111,700 0 $0 APPLICATIONS DENIED 25 $123,700 24 $127,550 141 $150,477 38 $30,429 0 $0 7 $127,120 3 $51,110 APPLICATIONS WITHDRAWN 8 $150,209 17 $158,065 86 $157,565 4 $93,495 0 $0 6 $84,632 1 $120,400 FILES CLOSED FOR INCOMPLETENESS 5 $122,578 4 $118,638 18 $159,005 1 $63,610 0 $0 2 $74,960 0 $0
Aggregated Statistics For Year 2007(Based on 1 full and 3 partial tracts) A) FHA, FSA/RHS & VA B) Conventional C) Refinancings D) Home Improvement Loans E) Loans on Dwellings For 5+ Families F) Non-occupant Loans on G) Loans On Manufactured Number Average Value Number Average Value Number Average Value Number Average Value Number Average Value Number Average Value Number Average Value
LOANS ORIGINATED 67 $132,053 373 $126,363 275 $130,087 38 $46,133 2 $13,292,160 47 $87,701 2 $43,160 APPLICATIONS APPROVED, NOT ACCEPTED 4 $140,930 30 $127,049 55 $114,440 13 $59,492 0 $0 7 $125,656 0 $0 APPLICATIONS DENIED 15 $135,938 54 $123,963 220 $126,409 52 $44,916 0 $0 19 $88,567 4 $43,252 APPLICATIONS WITHDRAWN 14 $146,911 42 $135,493 83 $129,046 8 $103,369 1 $394,270 9 $101,413 0 $0 FILES CLOSED FOR INCOMPLETENESS 3 $145,157 8 $121,764 32 $134,440 0 $0 0 $0 2 $83,060 0 $0
Aggregated Statistics For Year 2006(Based on 1 full and 3 partial tracts) A) FHA, FSA/RHS & VA B) Conventional C) Refinancings D) Home Improvement Loans E) Loans on Dwellings For 5+ Families F) Non-occupant Loans on G) Loans On Manufactured Number Average Value Number Average Value Number Average Value Number Average Value Number Average Value Number Average Value Number Average Value
LOANS ORIGINATED 83 $138,580 523 $117,083 281 $123,558 48 $39,445 1 $203,300 104 $80,738 1 $84,190 APPLICATIONS APPROVED, NOT ACCEPTED 10 $135,505 64 $109,437 60 $113,178 7 $57,937 0 $0 15 $87,796 1 $50,460 APPLICATIONS DENIED 18 $125,965 91 $106,708 215 $123,189 53 $39,767 1 $318,290 27 $73,432 4 $56,562 APPLICATIONS WITHDRAWN 9 $133,030 60 $113,770 122 $137,478 10 $98,394 0 $0 16 $127,762 0 $0 FILES CLOSED FOR INCOMPLETENESS 4 $156,610 27 $118,467 43 $152,460 0 $0 1 $401,800 5 $91,018 0 $0
Aggregated Statistics For Year 2005(Based on 1 full and 3 partial tracts) A) FHA, FSA/RHS & VA B) Conventional C) Refinancings D) Home Improvement Loans F) Non-occupant Loans on G) Loans On Manufactured Number Average Value Number Average Value Number Average Value Number Average Value Number Average Value Number Average Value
LOANS ORIGINATED 78 $130,178 407 $122,647 411 $121,742 65 $34,043 59 $92,493 2 $65,450 APPLICATIONS APPROVED, NOT ACCEPTED 6 $134,675 40 $112,251 59 $130,508 12 $27,862 4 $135,760 2 $22,155 APPLICATIONS DENIED 10 $129,940 76 $115,499 266 $123,227 47 $43,339 16 $103,287 2 $47,110 APPLICATIONS WITHDRAWN 6 $131,512 51 $113,158 123 $123,448 20 $119,760 11 $109,863 2 $101,525 FILES CLOSED FOR INCOMPLETENESS 3 $97,860 14 $102,454 61 $144,079 2 $17,715 1 $52,440 0 $0
Aggregated Statistics For Year 2004(Based on 1 full and 3 partial tracts) A) FHA, FSA/RHS & VA B) Conventional C) Refinancings D) Home Improvement Loans F) Non-occupant Loans on G) Loans On Manufactured Number Average Value Number Average Value Number Average Value Number Average Value Number Average Value Number Average Value
LOANS ORIGINATED 118 $127,295 348 $126,228 443 $121,369 46 $43,909 66 $86,619 2 $73,155 APPLICATIONS APPROVED, NOT ACCEPTED 7 $125,991 37 $126,851 77 $120,012 11 $28,278 5 $81,018 2 $22,890 APPLICATIONS DENIED 14 $117,518 55 $114,303 244 $122,864 34 $34,291 12 $95,562 10 $59,110 APPLICATIONS WITHDRAWN 11 $134,425 30 $129,846 118 $127,595 8 $72,246 4 $102,235 1 $22,150 FILES CLOSED FOR INCOMPLETENESS 2 $126,580 9 $125,097 52 $126,060 3 $52,373 2 $65,735 0 $0
Aggregated Statistics For Year 2003(Based on 1 full and 3 partial tracts) A) FHA, FSA/RHS & VA B) Conventional C) Refinancings D) Home Improvement Loans E) Loans on Dwellings For 5+ Families F) Non-occupant Loans on Number Average Value Number Average Value Number Average Value Number Average Value Number Average Value Number Average Value
LOANS ORIGINATED 121 $125,726 246 $127,824 1,118 $119,282 32 $21,163 1 $1,353,940 73 $88,912 APPLICATIONS APPROVED, NOT ACCEPTED 6 $116,288 21 $109,886 121 $115,078 12 $37,018 0 $0 11 $78,653 APPLICATIONS DENIED 15 $115,026 34 $91,440 258 $117,440 26 $19,263 0 $0 17 $226,859 APPLICATIONS WITHDRAWN 13 $129,456 30 $111,662 152 $122,140 2 $43,315 0 $0 10 $76,677 FILES CLOSED FOR INCOMPLETENESS 3 $118,240 5 $97,888 40 $138,532 2 $47,130 0 $0 2 $73,160
Aggregated Statistics For Year 2002(Based on 1 full and 3 partial tracts) A) FHA, FSA/RHS & VA B) Conventional C) Refinancings D) Home Improvement Loans F) Non-occupant Loans on Number Average Value Number Average Value Number Average Value Number Average Value Number Average Value
LOANS ORIGINATED 144 $114,657 233 $115,078 779 $119,330 42 $22,566 59 $88,110 APPLICATIONS APPROVED, NOT ACCEPTED 7 $114,653 15 $104,971 110 $104,552 10 $24,583 2 $68,380 APPLICATIONS DENIED 12 $128,252 19 $125,178 192 $105,127 24 $11,925 7 $81,724 APPLICATIONS WITHDRAWN 15 $124,391 22 $115,097 81 $110,293 3 $36,783 6 $92,120 FILES CLOSED FOR INCOMPLETENESS 2 $89,575 4 $107,562 49 $111,114 2 $69,290 1 $32,170
Aggregated Statistics For Year 2001(Based on 1 full and 3 partial tracts) A) FHA, FSA/RHS & VA B) Conventional C) Refinancings D) Home Improvement Loans E) Loans on Dwellings For 5+ Families F) Non-occupant Loans on Number Average Value Number Average Value Number Average Value Number Average Value Number Average Value Number Average Value
LOANS ORIGINATED 194 $115,953 212 $117,137 618 $109,074 41 $26,342 1 $511,440 49 $97,399 APPLICATIONS APPROVED, NOT ACCEPTED 8 $112,415 18 $83,347 70 $91,735 8 $19,381 0 $0 0 $0 APPLICATIONS DENIED 12 $133,244 52 $52,665 173 $86,685 32 $11,500 0 $0 10 $55,640 APPLICATIONS WITHDRAWN 11 $119,083 18 $121,643 87 $99,991 7 $28,980 0 $0 5 $87,530 FILES CLOSED FOR INCOMPLETENESS 3 $123,257 5 $95,564 40 $109,736 2 $14,640 0 $0 2 $103,345
Aggregated Statistics For Year 2000(Based on 1 full and 3 partial tracts) A) FHA, FSA/RHS & VA B) Conventional C) Refinancings D) Home Improvement Loans F) Non-occupant Loans on Number Average Value Number Average Value Number Average Value Number Average Value Number Average Value
LOANS ORIGINATED 148 $111,976 195 $107,381 151 $89,420 61 $25,347 26 $86,564 APPLICATIONS APPROVED, NOT ACCEPTED 6 $103,235 22 $85,385 48 $71,887 21 $15,927 3 $59,760 APPLICATIONS DENIED 9 $108,748 56 $61,116 101 $65,100 32 $13,999 10 $49,736 APPLICATIONS WITHDRAWN 9 $111,310 13 $94,925 50 $69,713 10 $54,410 2 $71,855 FILES CLOSED FOR INCOMPLETENESS 3 $132,290 7 $102,047 12 $103,117 0 $0 1 $64,310
Aggregated Statistics For Year 1999(Based on 2 full and 1 partial tracts) A) FHA, FSA/RHS & VA B) Conventional C) Refinancings D) Home Improvement Loans F) Non-occupant Loans on Number Average Value Number Average Value Number Average Value Number Average Value Number Average Value
LOANS ORIGINATED 139 $102,915 237 $105,191 321 $83,264 73 $12,441 41 $84,641 APPLICATIONS APPROVED, NOT ACCEPTED 4 $93,285 21 $71,073 62 $74,897 21 $14,915 5 $61,628 APPLICATIONS DENIED 5 $100,726 56 $86,414 112 $82,520 33 $11,017 5 $66,904 APPLICATIONS WITHDRAWN 8 $101,229 24 $104,745 88 $91,429 5 $60,542 8 $75,374 FILES CLOSED FOR INCOMPLETENESS 1 $94,000 7 $99,209 19 $81,974 0 $0 0 $0
Detailed HMDA statistics for the following Tracts:
2106.02
, 2107.00 , 2108.00 , 2109.00
Private Mortgage Insurance Companies Aggregated Statistics For Year 2009(Based on 1 full and 3 partial tracts) A) Conventional B) Refinancings C) Non-occupant Loans on Number Average Value Number Average Value Number Average Value
LOANS ORIGINATED 31 $171,864 34 $170,213 1 $202,090 APPLICATIONS APPROVED, NOT ACCEPTED 7 $168,773 9 $194,548 1 $30,820 APPLICATIONS DENIED 3 $140,927 9 $164,638 0 $0 APPLICATIONS WITHDRAWN 2 $194,935 4 $126,545 0 $0 FILES CLOSED FOR INCOMPLETENESS 1 $67,810 0 $0 1 $46,230
Aggregated Statistics For Year 2008(Based on 1 full and 3 partial tracts) A) Conventional B) Refinancings C) Non-occupant Loans on Number Average Value Number Average Value Number Average Value
LOANS ORIGINATED 76 $157,860 53 $180,900 7 $104,110 APPLICATIONS APPROVED, NOT ACCEPTED 21 $156,933 23 $181,559 2 $121,055 APPLICATIONS DENIED 10 $114,252 1 $244,420 5 $83,276 APPLICATIONS WITHDRAWN 3 $95,053 3 $155,087 1 $30,820 FILES CLOSED FOR INCOMPLETENESS 1 $144,120 2 $93,780 1 $92,510
Aggregated Statistics For Year 2007(Based on 1 full and 3 partial tracts) A) Conventional B) Refinancings C) Non-occupant Loans on Number Average Value Number Average Value Number Average Value
LOANS ORIGINATED 146 $133,055 54 $160,271 10 $94,111 APPLICATIONS APPROVED, NOT ACCEPTED 20 $143,982 9 $185,783 0 $0 APPLICATIONS DENIED 1 $121,260 5 $142,934 1 $163,040 APPLICATIONS WITHDRAWN 4 $178,742 2 $160,745 1 $42,570 FILES CLOSED FOR INCOMPLETENESS 0 $0 0 $0 0 $0
Aggregated Statistics For Year 2006(Based on 1 full and 3 partial tracts) A) Conventional B) Refinancings C) Non-occupant Loans on Number Average Value Number Average Value Number Average Value
LOANS ORIGINATED 115 $141,554 28 $143,523 15 $96,618 APPLICATIONS APPROVED, NOT ACCEPTED 14 $154,767 9 $153,692 2 $79,895 APPLICATIONS DENIED 0 $0 1 $152,420 1 $65,030 APPLICATIONS WITHDRAWN 4 $144,872 1 $142,110 0 $0 FILES CLOSED FOR INCOMPLETENESS 0 $0 1 $205,190 0 $0
Aggregated Statistics For Year 2005(Based on 1 full and 3 partial tracts) A) Conventional B) Refinancings C) Non-occupant Loans on Number Average Value Number Average Value Number Average Value
LOANS ORIGINATED 71 $145,814 46 $138,563 10 $100,314 APPLICATIONS APPROVED, NOT ACCEPTED 10 $186,217 8 $180,219 1 $90,120 APPLICATIONS DENIED 1 $93,400 0 $0 0 $0 APPLICATIONS WITHDRAWN 6 $150,127 1 $202,030 0 $0 FILES CLOSED FOR INCOMPLETENESS 0 $0 0 $0 0 $0
Aggregated Statistics For Year 2004(Based on 1 full and 3 partial tracts) A) Conventional B) Refinancings C) Non-occupant Loans on Number Average Value Number Average Value Number Average Value
LOANS ORIGINATED 74 $136,520 42 $143,267 14 $86,321 APPLICATIONS APPROVED, NOT ACCEPTED 14 $157,901 16 $167,740 2 $60,920 APPLICATIONS DENIED 0 $0 2 $140,585 0 $0 APPLICATIONS WITHDRAWN 3 $150,223 4 $175,340 1 $237,930 FILES CLOSED FOR INCOMPLETENESS 0 $0 1 $120,440 0 $0
Aggregated Statistics For Year 2003(Based on 1 full and 3 partial tracts) A) Conventional B) Refinancings C) Non-occupant Loans on Number Average Value Number Average Value Number Average Value
LOANS ORIGINATED 74 $142,473 150 $136,689 8 $95,868 APPLICATIONS APPROVED, NOT ACCEPTED 21 $135,565 33 $149,013 4 $78,715 APPLICATIONS DENIED 3 $114,023 2 $137,105 1 $77,560 APPLICATIONS WITHDRAWN 2 $194,720 9 $180,491 1 $104,790 FILES CLOSED FOR INCOMPLETENESS 0 $0 0 $0 0 $0
Aggregated Statistics For Year 2002(Based on 1 full and 3 partial tracts) A) Conventional B) Refinancings C) Non-occupant Loans on Number Average Value Number Average Value Number Average Value
LOANS ORIGINATED 58 $126,897 103 $137,283 11 $80,420 APPLICATIONS APPROVED, NOT ACCEPTED 7 $152,601 27 $127,527 0 $0 APPLICATIONS DENIED 1 $128,000 2 $89,860 0 $0 APPLICATIONS WITHDRAWN 3 $134,460 7 $141,929 1 $132,770 FILES CLOSED FOR INCOMPLETENESS 0 $0 0 $0 0 $0
Aggregated Statistics For Year 2001(Based on 1 full and 3 partial tracts) A) Conventional B) Refinancings C) Non-occupant Loans on Number Average Value Number Average Value Number Average Value
LOANS ORIGINATED 79 $131,497 89 $127,029 9 $80,643 APPLICATIONS APPROVED, NOT ACCEPTED 6 $135,693 9 $136,279 0 $0 APPLICATIONS DENIED 1 $125,260 0 $0 1 $125,260 APPLICATIONS WITHDRAWN 1 $92,030 1 $122,110 0 $0 FILES CLOSED FOR INCOMPLETENESS 0 $0 0 $0 0 $0
Aggregated Statistics For Year 2000(Based on 1 full and 3 partial tracts) A) Conventional B) Refinancings C) Non-occupant Loans on Number Average Value Number Average Value Number Average Value
LOANS ORIGINATED 57 $126,307 11 $121,404 3 $83,387 APPLICATIONS APPROVED, NOT ACCEPTED 5 $139,510 3 $120,943 1 $78,320 APPLICATIONS DENIED 1 $53,940 1 $104,680 1 $53,940 APPLICATIONS WITHDRAWN 1 $35,640 0 $0 1 $35,640 FILES CLOSED FOR INCOMPLETENESS 1 $59,940 0 $0 1 $35,640
Aggregated Statistics For Year 1999(Based on 2 full and 1 partial tracts) A) Conventional B) Refinancings C) Non-occupant Loans on Number Average Value Number Average Value Number Average Value
LOANS ORIGINATED 65 $125,033 32 $122,091 4 $104,250 APPLICATIONS APPROVED, NOT ACCEPTED 3 $199,520 8 $96,372 0 $0 APPLICATIONS DENIED 2 $108,275 1 $107,740 0 $0 APPLICATIONS WITHDRAWN 0 $0 0 $0 0 $0 FILES CLOSED FOR INCOMPLETENESS 0 $0 0 $0 0 $0
Detailed PMIC statistics for the following Tracts:
2106.02
, 2107.00 , 2108.00 , 2109.00 Fire-safe hotels and motels in Plainfield, Indiana:
Holiday Inn Express Plainfield, 6296 Cambridge Way, Plainfield, Indiana 46168 Phone: (317) 839-9000, Fax: (317) 838-0000
Baymont Inn, 6010 Gateway Dr, Plainfield, Indiana 46168 Phone: (317) 837-9000, Fax: (317) 837-1100
Amerihost Inn Plainfield, 6105 Cambridge Way, Plainfield, Indiana 46168 Phone: (317) 838-9300, Fax: (317) 838-7018
Comfort Inn, 6107 Cambridge Way, Plainfield, Indiana 46168 Phone: (317) 839-9600, Fax: (317) 839-7455
Hampton Inn Indianapolis SW/Plainfield, 2244 E Perry Rd, Plainfield, Indiana 46168 Phone: (317) 839-9993, Fax: (317) 839-0460
Wingate Inn Plainfield/Indianapolis Airport, 6300 Gateway Dr, Plainfield, Indiana 46168 Phone: (317) 279-2500, Fax: (317) 279-2511
Homewood Suites By Hilton Plainfield, 2264 E Hadley Rd, Plainfield, Indiana 46168 Phone: (317) 839-1900, Fax: (317) 839-2200
Staybridge Suites, 6295 Cambridge Way, Plainfield, Indiana 46168 Phone: (317) 839-2700, Fax: (317) 839-2300
6 other hotels and motels
All 14 fire-safe hotels and motels in Plainfield, Indiana
Most common first names in Plainfield, IN among deceased individuals Name Count Lived (average)
Mary 179 79.2 years William 114 73.7 years James 101 72.0 years John 99 72.4 years Robert 95 71.6 years Helen 70 83.2 years Charles 70 74.6 years Dorothy 56 80.4 years Donald 51 70.2 years Ruth 47 80.3 years
Most common last names in Plainfield, IN among deceased individuals Last name Count Lived (average)
Smith 49 76.7 years Johnson 40 75.8 years Wilson 30 76.5 years Miller 26 78.5 years Jones 26 77.8 years Brown 22 74.6 years Taylor 20 70.8 years Williams 20 76.4 years White 19 82.0 years Anderson 18 78.6 years
Plainfield compared to Indiana state average:
Unemployed percentage significantly below state average. Black race population percentage above state average. Hispanic race population percentage above state average. Median age below state average. Foreign-born population percentage significantly above state average. Length of stay since moving in significantly above state average. House age below state average. Institutionalized population percentage significantly above state average. Percentage of population with a bachelor's degree or higher above state average. Plainfield on our top lists :
#10 on the list of "Top 101 cities with the largest percentage of people in halfway houses (population 1,000+)"
#90 on the list of "Top 101 cities with the most residents born in Other Eastern Asia (population 500+)"
#41 on the list of "Top 101 counties with the largest number of children under 18 without health insurance coverage in 2000 (pop. 50,000+)"
#51 on the list of "Top 101 counties with the largest number of people without health insurance coverage in 2000 (pop. 50,000+)"
#71 on the list of "Top 101 counties with the lowest percentage of residents relocating from foreign countries between 2010 and 2011"
#93 on the list of "Top 101 counties with the lowest total withdrawal of fresh water for public supply (pop. 50,000+)"
#101 on the list of "Top 101 counties with the lowest percentage of residents relocating to foreign countries in 2011"
Top Patent Applicants
Justin Honegger (8)
Mark J. Blackwelder (8)
Eric Konkle (6)
Michael Abraham Karam (6)
Mark Jon Blackwelder (5)
Tab M. Heffernan (5)
Richard Earl Jones, Jr. (5)
Paul A. Richardson (4)
Edward E. Sowers (4)
Mohammad A. Kheiri (4)
Total of 161 patent applications in 2008-2024.
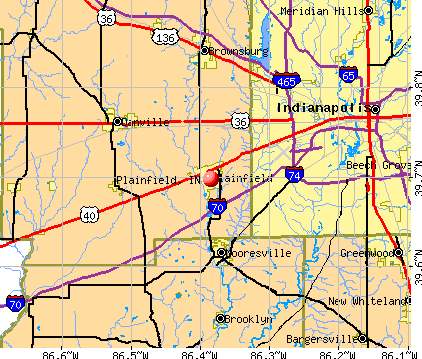


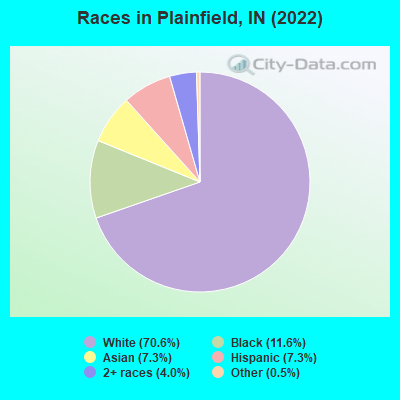
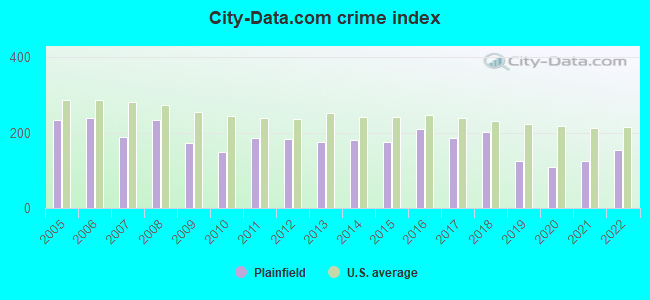
 Recent articles from our blog. Our writers, many of them Ph.D. graduates or candidates, create easy-to-read articles on a wide variety of topics.

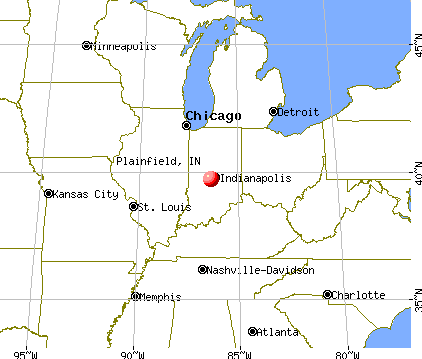
 (14.2 miles
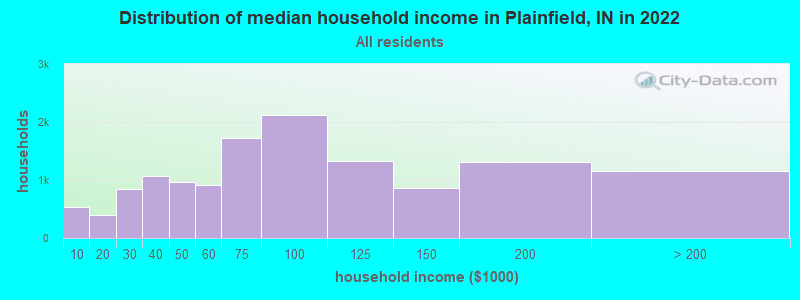
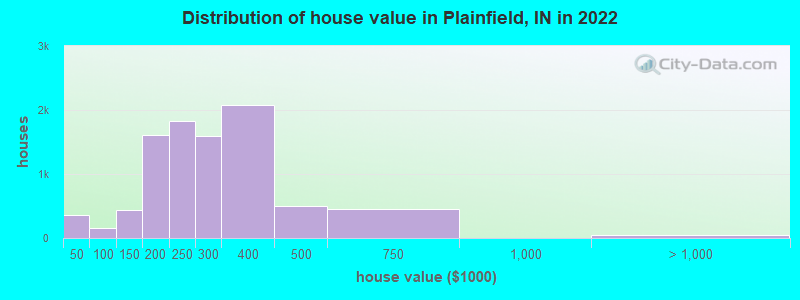
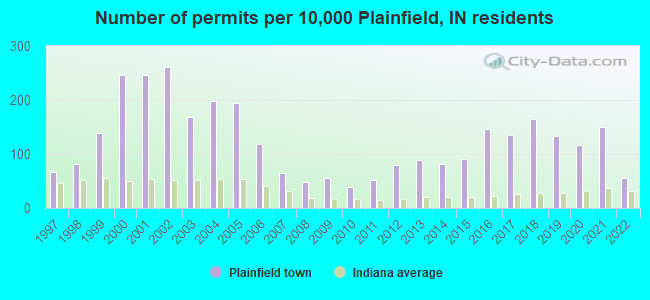
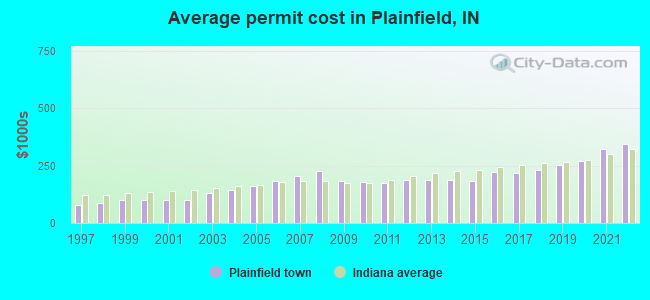
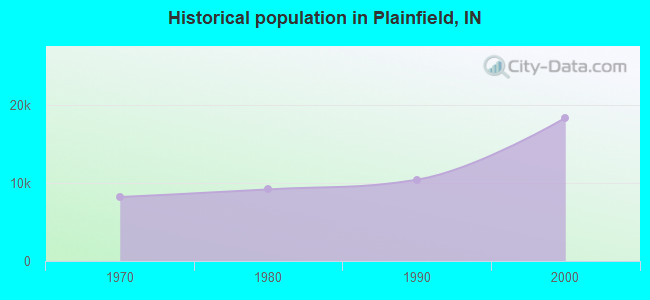
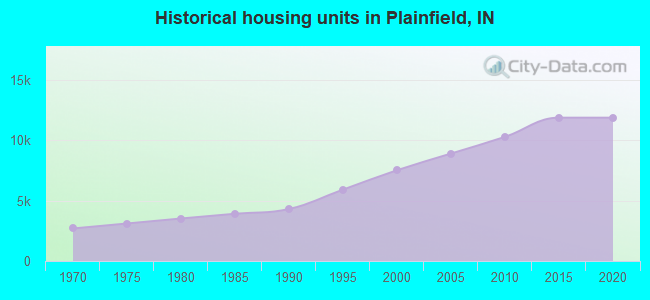
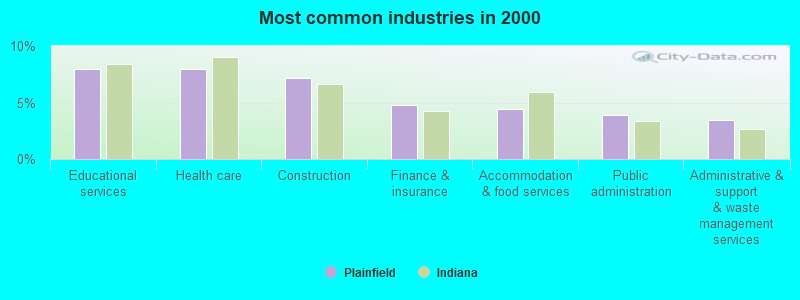
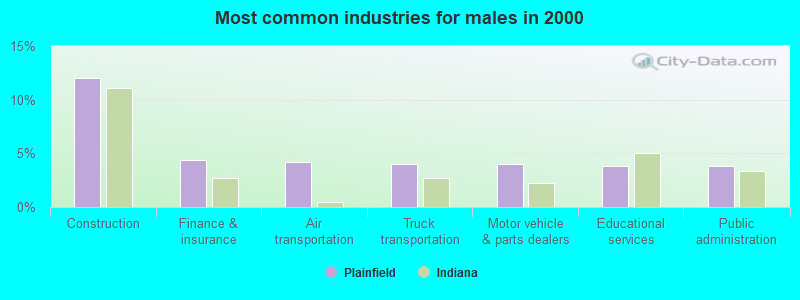
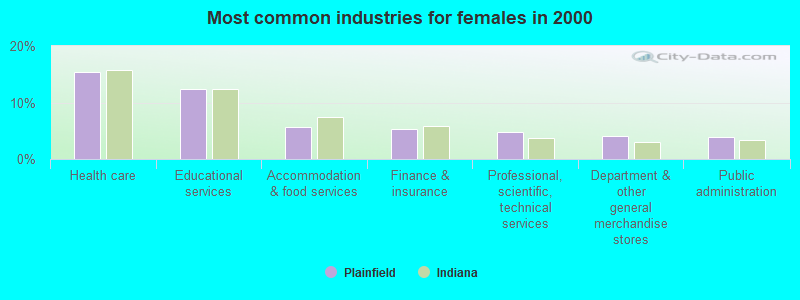
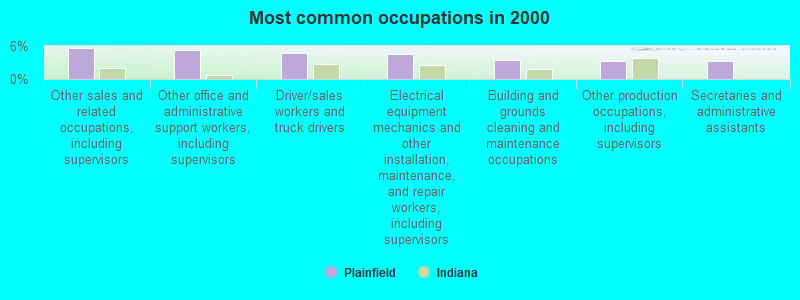
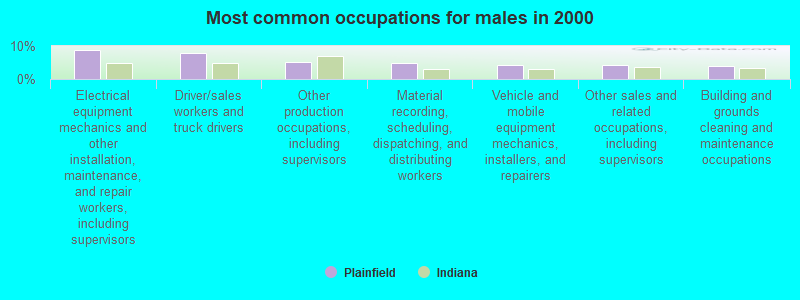
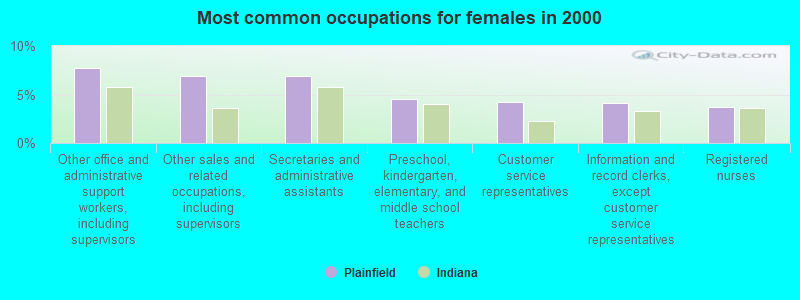

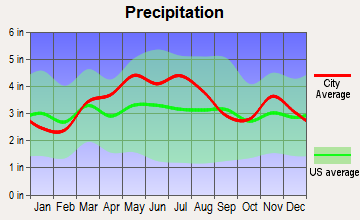


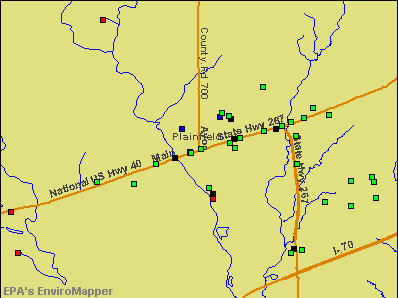

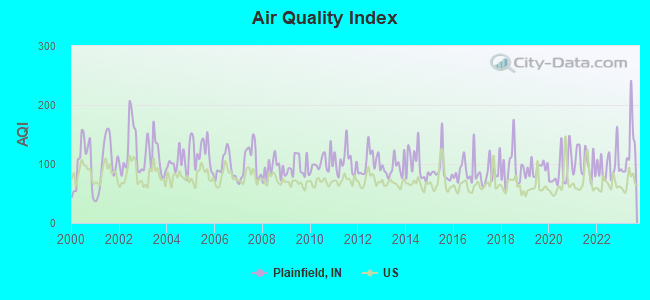
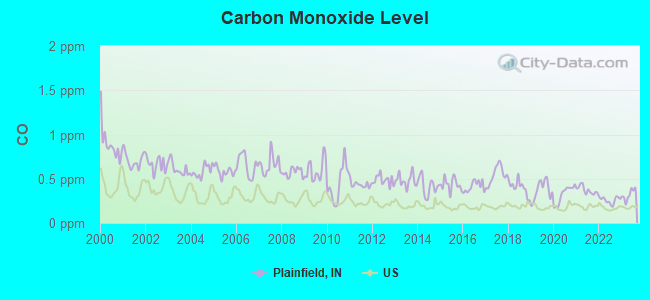
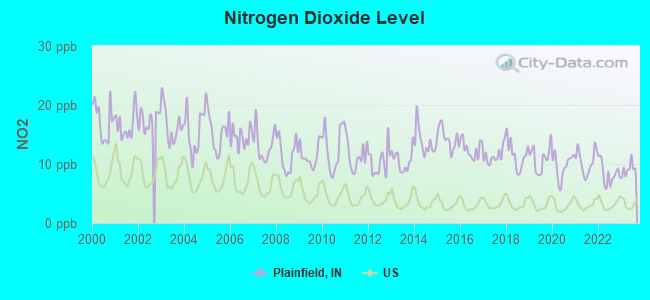
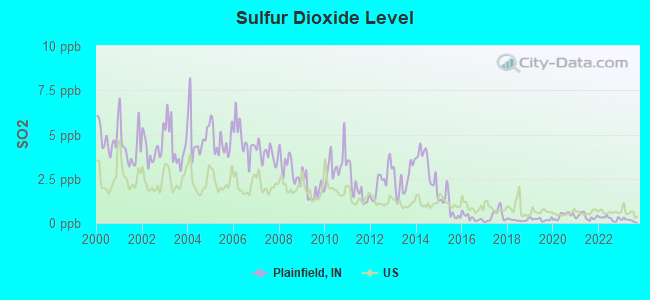
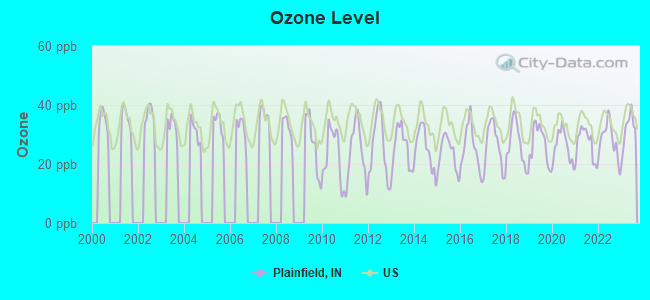
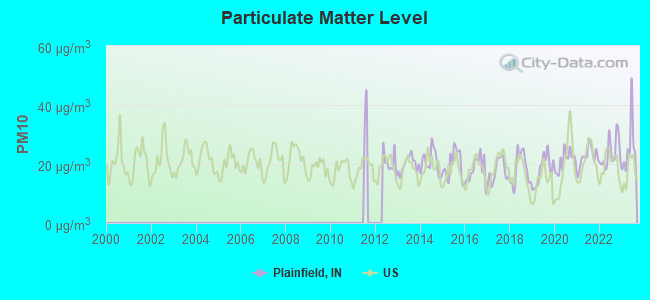
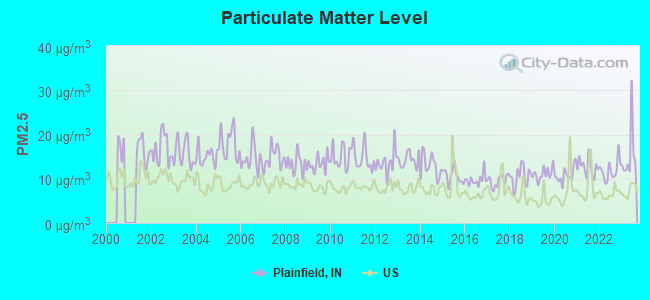
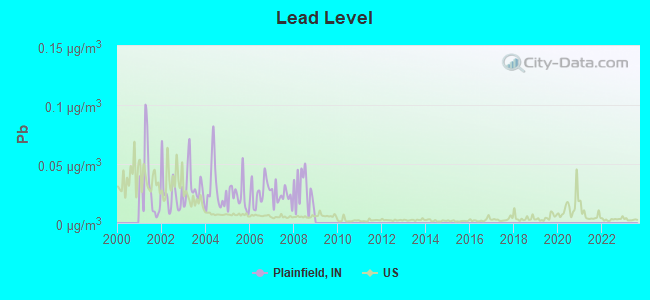

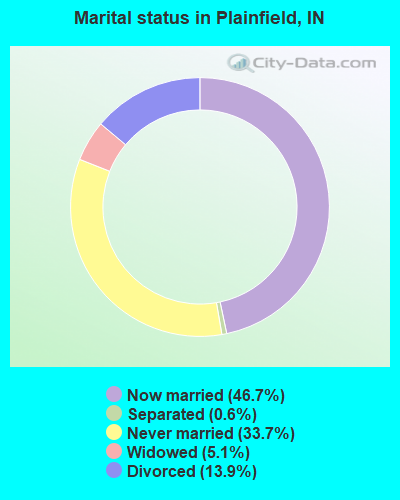
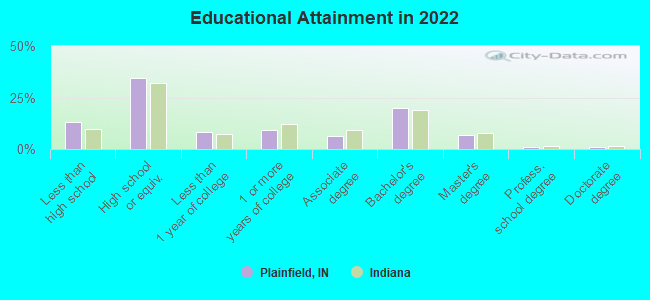
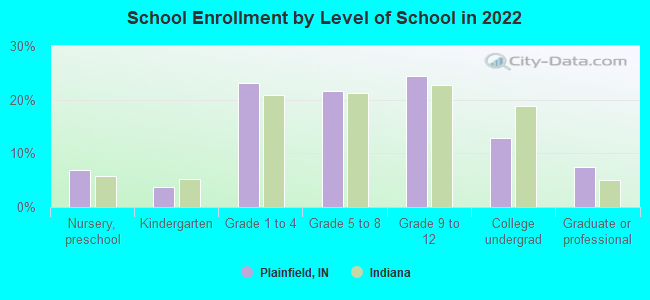
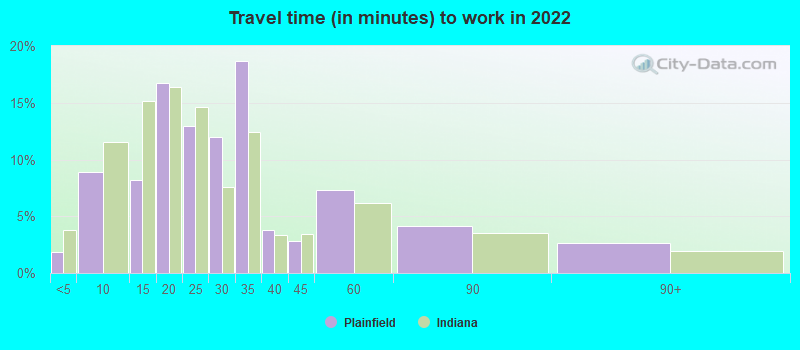
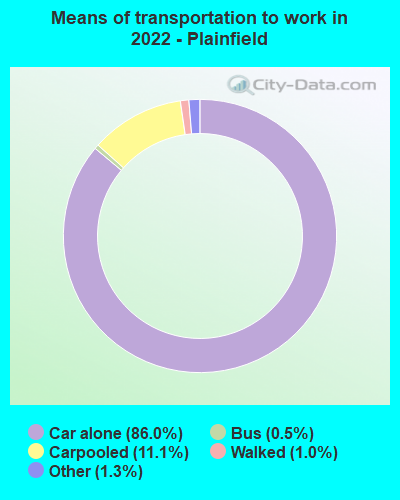
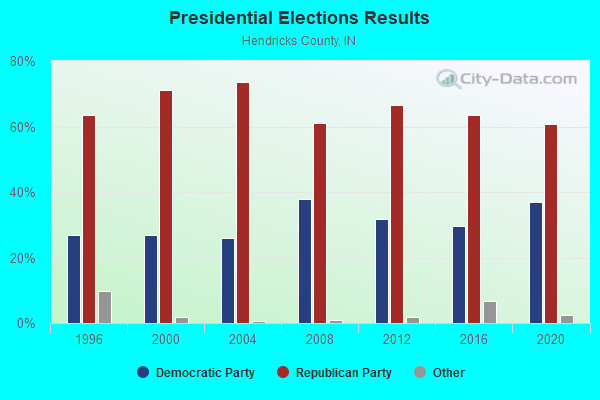
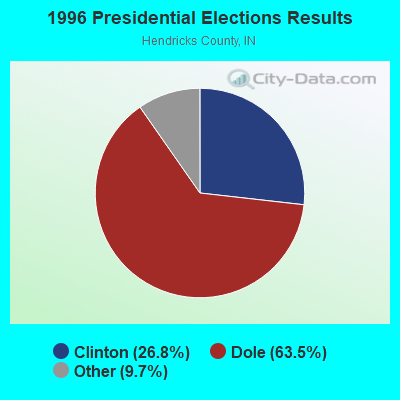

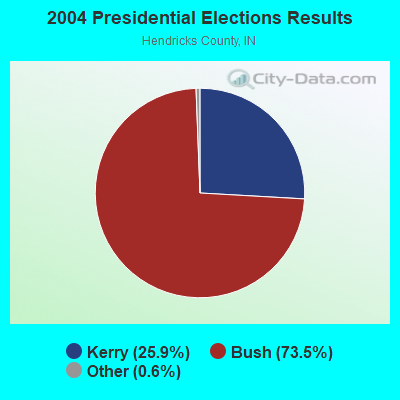
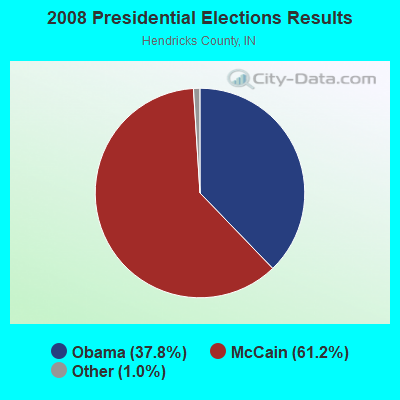

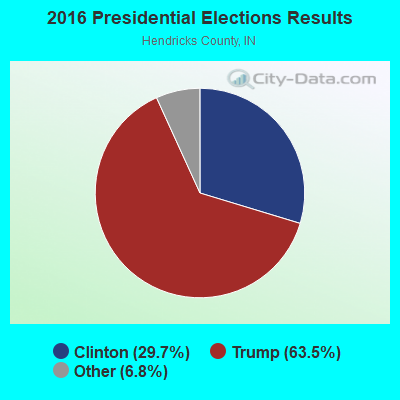
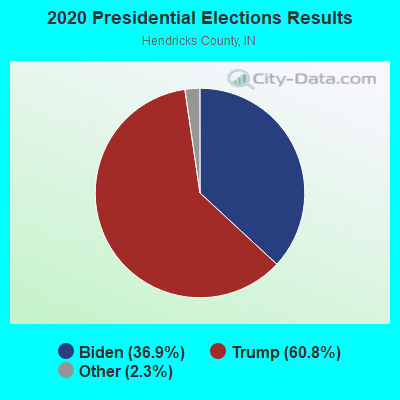
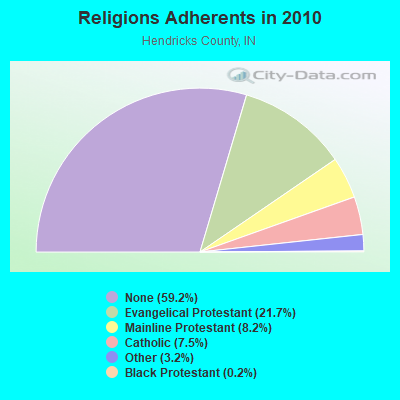
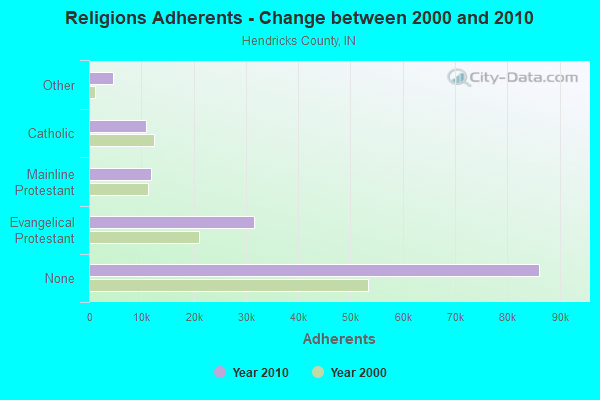
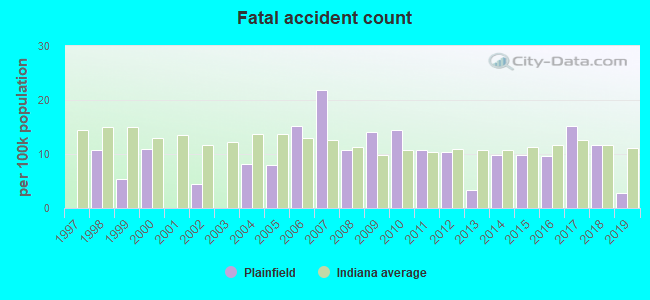
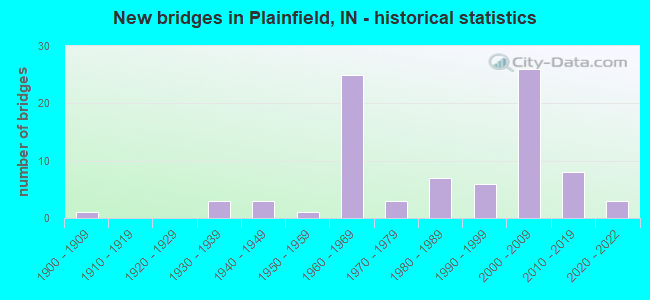
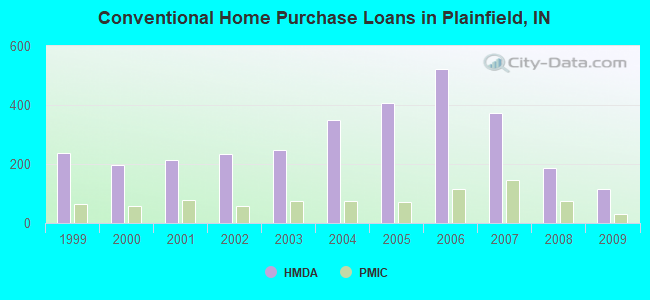
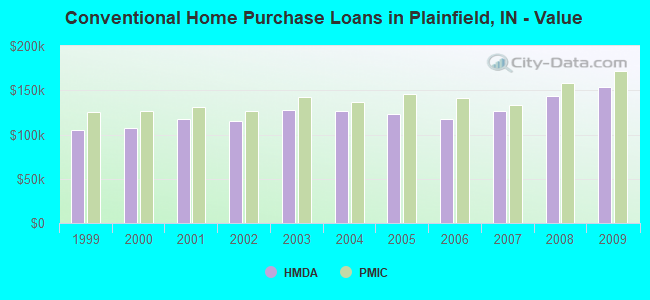
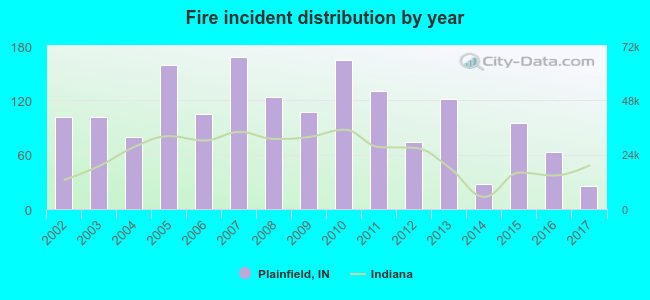 Based on the data from the years 2002 - 2017 the average number of fires per year is 103. The highest number of reported fires - 168 took place in 2007, and the least - 25 in 2017. The data has a decreasing trend.
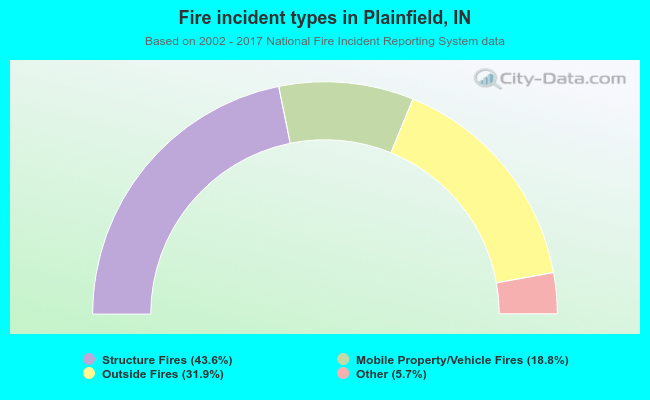 When looking into fire subcategories, the most incidents belonged to: Structure Fires (43.6%), and Outside Fires (31.9%).