
Kristine Barseghyan, Ph.D. (ABD) Social Sciences
In this post, we’ll examine the Bureau of Labor Statistics’ 2012 Consumer Expenditure Report. After almost four years of abstinence, Americans started spending again. In 2012, the average expenditures per consumer rose to $51,442, which is 3.5 percent higher than in 2011. It exceeded the highest spending recorded in 2008, after which the effects of the recession led to a low of $48,109 in 2010. In 2011, when the average expenditures and prices for goods and services had almost the same increase rate, there was hardly any increase in actual expenditures at all. In 2012, expenditures rose more than prices.
Chart 1 shows the decline of all major expenditure lines in 2009-2010 due to the Great Recession, except for a 5 percent increase in health care. Most of the major household spending lines started recovering in 2010-2011. Housing showed the slowest recovery rate with only a 0.5 percent increase in 2012.

Nevertheless, in 2012, housing expenses still constituted one-third of the total consumer expenditures (Chart 2). Transportation held the second-largest share, due to a 20.3 percent increase in vehicle purchases. Donations to churches and religious organizations (which increased by 13.1 percent) boosted the total cash contribution expenditures up to 11.2 percent, making it the fastest-growing line in 2012.

The average annual expenditure for a single-person household is $36,152. Though single-parent families may have almost the same housing, transportation, insurance or other needs, they spend almost half as much as two-parent families — $38,667 and $72,814 respectively. Among race and ethnic groups, the white non-Hispanic population has the highest cash contribution (4 percent), health care (7.4 percent) and entertainment (5.4 percent) expenses. The Hispanic population spent the most on transportation (19.7 percent) and food expenses (15.5 percent), while the black population spent the most on housing expenses (37.3 percent).
The lower an individual’s income is, the higher their share of food, housing and transportation expenses will be; the lowest quintile of the population spends 71.3 percent on all three, while the highest quintile spends only 57.7 percent (Chart 3). The rich are more predisposed to spend toward the future — the highest quintile’s average annual expenditure on personal insurance and pension is $15,534 (15.6 percent) versus $489 (2.2 percent) of the lowest quintile. The higher an individual’s income is, the higher their share of entertainment, cash contributions and personal insurance and pension expenditures.

Housing expenses increase with population. People who live in urban areas with a population of 5 million or more pay an average of 38.2 percent of their expenses on housing; those who live in non-urban areas pay only 29 percent. However, the residents of big cities save on transportation and health care. Food, apparel and cash contributions remain at the same level for all types of areas (Chart 4).

Neither New York, Boston nor Los Angeles, but Washington, D.C. leads among major metropolitan areas in the average annual amounts spent on food, housing, apparel and health care (Table 1). Houston leads in transportation costs ($11,811), and Phoenix in entertainment ($4,045).

Okay, what is wrong with increased expenditures? Nothing, if they are driven by an increase in earnings.
Americans spend more because they go into debt more easily. In the third quarter of 2013, U.S. households added to their debt burden at the fastest pace in five years, with increases across all debt categories. According to the Household Debt and Credit Report, household indebtedness increased to $11.28 trillion in the July-September period.[i]
Mortgages, the largest component of household debt, increased by 0.7 percent, reaching $7.90 trillion, which is $1.32 trillion less than its peak in 2008. The picture is one of faster debt growth when mortgages are excluded (Chart 5). Non-housing household debt balances increased by 2.7 percent with $31 billion increases in auto loans, $33 billion in student loans and $4 billion in credit card debt. American consumers currently owe an aggregate of $0.67 trillion[ii] in credit card debt, which makes $7,128 per household and $15,279 per indebted household.[iii]

If you, as an ordinary American citizen, may feel concerned with the increase in the average consumer debt, economists are happy about it. They say higher debts dispel the worries that consumers clamp down on large spending, such as mortgage and education loans, and daily discretionary spending, such as going out to eat or shopping at the mall. The more indebted we are, the better for the economy; consumer spending represents more than two-thirds of economic demand in the U.S.
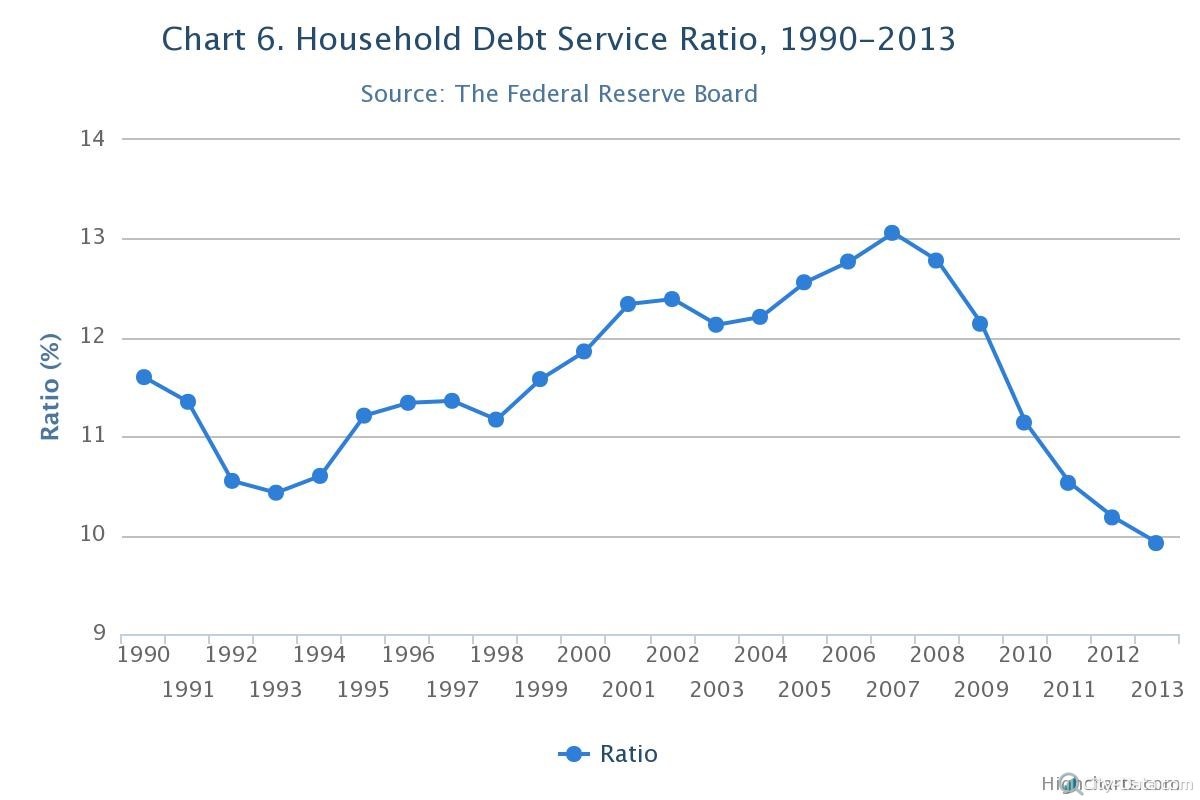
Consumer debt is what we spend beyond our means. In 2012, 60.4 million U.S. households had some kind of consumer debt. Though the household debt service ratio has been declining since 2007, in 2013, households still pay in average 10 percent of their disposable income to meet their mortgage and consumer debt obligations (Chart 6).
Today we earn and spend more than we would dream of in decades past. What makes such a lifestyle possible for many of us is the consumer debt system. With savings levels of nearly zero, we enjoy owning a house, having more fun, buying new clothes, eating out or getting a prestigious education. What we pay for that way of living is the peace of mind.
References
[i] Brai Odion-Esene, “NY Fed: US Q3 Consumer Debt Posts Largest Increase Since 2008”, MNI, November 14, 2013; https://mninews.marketnews.com/terms-use
[ii] Federal Reserve Bank of New York, Quarterly Report on Household Debt and Credit, http://www.newyorkfed.org/microeconomics/hhdc.html#2013/q3
[iii] Tim Chen, “American Household Credit Card Debt Statistics: 2013”, Nerd Wallet Finance, http://www.nerdwallet.com/blog/credit-card-data/average-credit-card-debt-household/
About Kristine Barseghyan
Kristine Barseghyan, Ph.D. (ABD) Social Sciences
Kristine has a Ph.D. in Social Sciences (ABD), and works as a Democratic Governance and International Development Consultant.
From 2004 to 2012, she worked as program officer for United Nations Development Programme and United States International Agency for International Development. Since 2013, she is a freelance consultant for international development organizations.
Other posts by Kristine Barseghyan:
Luxembourg economic is great it will continue if they do no join the EU free trade, free trade benefit only the corporations and destroy the income of the working class, the people of Luxembourg should learn from what happen to the American workers and the United States as a country. The US economic is base in debt, consumers debt and national debt destroyed the economic, Americans do not produce any thing any more they import about 80% of consumers goods, our balance of trade in the last 30 years is a continue deficit due to free trade. Countries like the US and Luxembourg can not compete with cheap labor ; here is a website that show what the workers of the world make per year.https://en.wikipedia.org/wiki/List_of_minimum_wages_by_country
Free trade and globalization is an agenda of the worlds oligarchs, control of the world commerce to exploit the world’s working class and the slavery of humanity. Greed is destroying the EU and the United States.