
Kristine Barseghyan, Ph.D. (ABD) Social Sciences
The phrase “I’d rather cry in a BMW than laugh on a bicycle,” now a catchphrase, belongs to a 20-year-old female contestant on a Chinese game show. For her, like for many of us, sadness in luxury is preferable to happiness in necessity. But when the conditions for happiness are that high, frustration with reality makes people unhappy. China is generally not a very happy nation — it finished in a low 93rd in the World Happiness Report published by the United Nations in September 2013.[i] In contrast, Denmark, which has the second most bicycles per capita (4,500,000 bicycles per 5,560,628 people, 80.1 percent of the population being cyclists)[ii], is the happiest nation in the world. BMWs are not for everyone, but bicycles are.
According to the United Nations Report, the difference in the level of happiness nations experience depends on six key variables: real Gross Domestic Product (GDP) per capita, healthy life expectancy, having someone to count on, perceived freedom to make life choices, generosity and freedom from corruption.[iii] And the case of the U.S. makes this point clear: Higher average incomes do not necessarily improve average well-being.
The paradox of the U.S. is that although the richer the individual is the happier he or she is, the society as a whole is not becoming happier as it is becoming richer (Figure 1). There can be several reasons for this. People usually want to become richer compared to others, so when everybody rises together and their relative status remains unchanged, there is no reason for increased happiness. Other possible reasons can be that the societal factors (job insecurity, loss of social trust, rising anxiety levels, bad health insurance, etc.) counteract any benefits felt from the higher incomes.
The last, but not least important explanation is that the income gains have not been evenly shared, but have gone disproportionately to those at the top of the income distribution. The U.S. has the highest income inequality among member-states of the Organization for Economic Co-operation and Development (OECD), far behind the happy Nordic countries at the top of the happiest nations in the world and followed only by Turkey, Russia, Mexico and China.[iv]

According to the Harris Poll® Happiness index, a third of Americans (33 percent) are very happy. Women are generally happier than men (35 percent versus 32 percent), and African Americans (36 percent) are happier than whites (34 percent) and Hispanics (28 percent), who have seen a significant decline in their happiness in the recent years. People with post-graduate degrees (38 percent) and high school graduates (34 percent) are considerably happier than college graduates and people with some college education (32 percent each).[v]
Certain vulnerable groups have experienced a decline in happiness in the last couple years. The percentage of those very happy among the disabled has dropped from 34 percent to 31 percent — another decline which may have ties to cuts or feared cuts in social services. The percent of college graduates that feel very happy has dropped since 2011 (from 35 percent to 32 percent) due to either the poor job market and increasing difficulty to return monetary investments in education; between 2011 and 2013, the student debt increased from 0.87 billion to 1.03 billion.[vi]
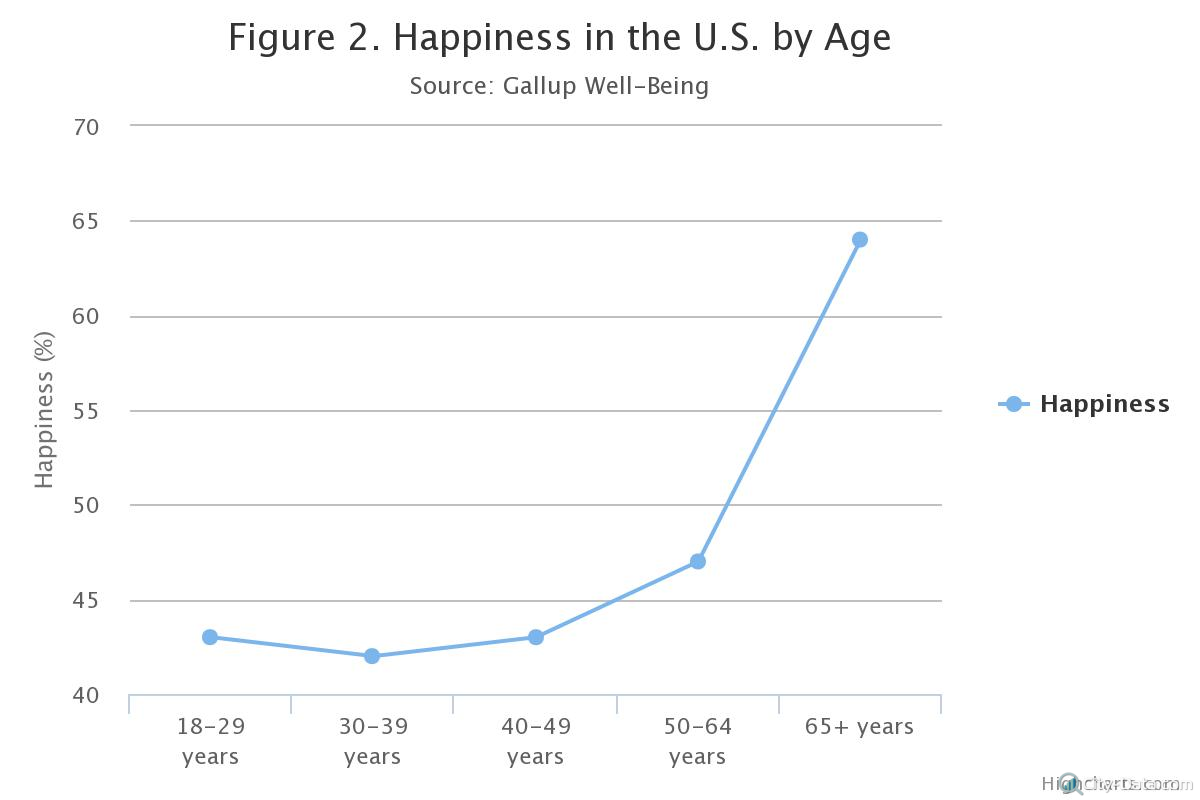
Contrary to gloomy stereotypes associated with getting older, happiness increases with age. Declining slowly upon entering adult life from youth up until the crisis of middle-age, the level of happiness moves up again when approaching older age: 64 percent of people above 65 years old are happy.[vii] While some researchers try to explain happiness after 65 by external factors such absence of teenage children, older people being richer, etc., others argue that, if income, employment and children were controlled, the picture would be the same. So, the growing happiness that follows middle-aged misery must be the result of internal changes, such as a better ability to control emotions and anger, accept misfortune and deal with conflicts.[viii]
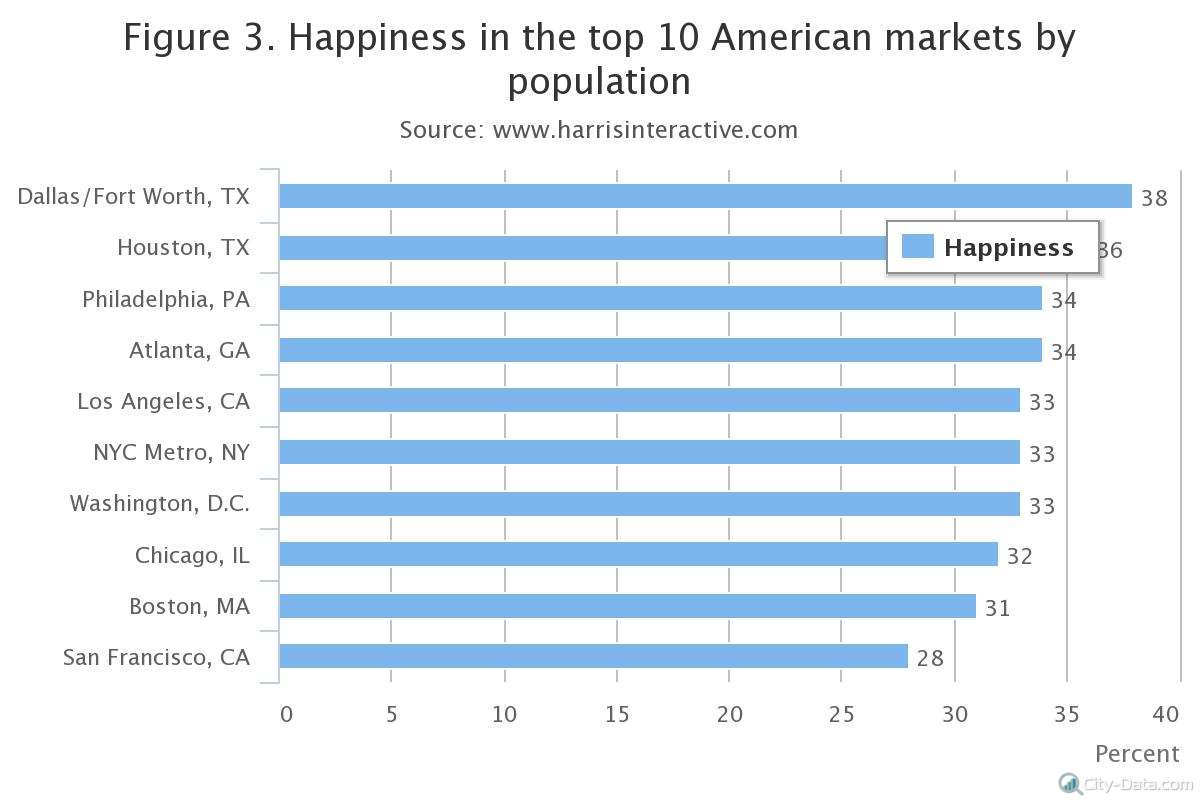
Happiness depends not only on demographic characteristics such as sex, age or race but also on location. Those living in cities are slightly happier than their rural and suburban counterparts. Half of those living in urban communities are happy, compared to 48 percent of those living in rural communities and 45 percent in suburban communities.[ix] Among key metropolitan areas, Dallas and Houston in Texas are the happiest places to live, while the population of San Francisco has the least number of very happy people. New York, Washington, D.C. and Los Angeles are somewhere in between, offering the same level of happiness at 33 percent of happy people in each.
A decreasing sense of happiness makes people less optimistic about their future. Compared to 2011, smaller percentages of Americans are optimistic (from 75 percent in 2011 to 67 percent in 2013). More people believe that they will not benefit much from the things that they do in the near future — from 42 percent in 2011 to 38 percent in 2013.[x]
The U.S. GNI per capita income is actually higher than in most of the countries ahead of the U.S. in the global ranking of happiness. There are about 130 countries that showed up as less happy than the U.S. in 2013. Despite our outstanding technological and economic progress over the past half-century, we are without significant achievements in life satisfaction and the subjective happiness of our population. In contrast, uncertainties and anxieties are high, social and economic inequalities have widened considerably and social trust is in decline. There is an impression that the U.S. has not been very effective at turning its great business capacities, human resources, productivity and natural wealth to the best aim: increased happiness.
References
[i] John Helliwell, Richard Layard and Jeffrey Sachs, eds., World Happiness Report, The Earth Institute, Columbia University, 2013; Available at http://www.earth.columbia.edu/sitefiles/file/Sachs%20Writing/2012/World%20Happiness%20Report.pdf
[ii] “Top 10 Countries with Most Bicycles per Capita”; Available at http://top10hell.com/top-10-countries-with-most-bicycles-per-capita/
[iii] ibid.,
[iv] OECD 2013, “How’s Life? At a Glance” in How’s Life 2013: Measuring Well-Being., OECD Publishing; Available at http://www.keepeek.com/Digital-Asset-Management/oecd/economics/how-s-life-2013/how-s-life-at-a-glance_how_life-2013-6-en#page6
[v] “Are You Happy?It May Depend on Age, Race/Ethnicity and Other Factors,” The Harris Poll® #30, May 30, 2013; Available at http://www.harrisinteractive.com/NewsRoom/HarrisPolls/tabid/447/ctl/ReadCustom%20Default/mid/1508/ArticleId/1200/Default.aspx
[vi] Please make a link to my article “Generation Y – Freshly Educated and Deeply Indebted”
[vii] Steve Crabtree, “U.S. Seniors Maintain Happiness Highs With Less Social Time,” Gallup Well-Being, December 12, 2011; Available at: http://www.gallup.com/poll/151457/seniors-maintain-happiness-highs-less-social-time.aspx
[viii] “The U-bend of life: Why, beyond middle age, people get happier as they get older,” The Economist, Dec 16th, 2010; Available at http://www.economist.com/node/17722567
[ix] Steve Crabtree, “U.S. Seniors Maintain Happiness Highs With Less Social Time,” Gallup Well-Being, December 12, 2011; Available at: http://www.gallup.com/poll/151457/seniors-maintain-happiness-highs-less-social-time.aspx
[x]“Are You Happy? It May Depend on Age, Race/Ethnicity and Other Factors,” The Harris Poll® #30, May 30, 2013; Available at http://www.harrisinteractive.com/NewsRoom/HarrisPolls/tabid/447/ctl/ReadCustom%20Default/mid/1508/ArticleId/1200/Default.aspx
About Kristine Barseghyan
Kristine Barseghyan, Ph.D. (ABD) Social Sciences
Kristine has a Ph.D. in Social Sciences (ABD), and works as a Democratic Governance and International Development Consultant.
From 2004 to 2012, she worked as program officer for United Nations Development Programme and United States International Agency for International Development. Since 2013, she is a freelance consultant for international development organizations.
Other posts by Kristine Barseghyan:
1) Too much unsupported supposition. Data doesn’t support your extensive comments on cause, only the circumstance.
2) Happier if difference in income, but inequality causing unhappiness. So, which is it? Even the suppositions are inconsistent.