Arnold, Maryland Submit your own pictures of this place and show them to the world
OSM Map
General Map
Google Map
MSN Map
OSM Map
General Map
Google Map
MSN Map
OSM Map
General Map
Google Map
MSN Map
OSM Map
General Map
Google Map
MSN Map
Please wait while loading the map...
Population in 2010: 23,106. Population change since 2000: -1.3%Males: 11,308 Females: 11,798
March 2022 cost of living index in Arnold: 108.0 (more than average, U.S. average is 100) Percentage of residents living in poverty in 2022: 3.4%for White Non-Hispanic residents , 5.4% for Black residents , 5.9% for Hispanic or Latino residents , 36.9% for other race residents , 4.9% for two or more races residents )
Profiles of local businesses
Business Search - 14 Million verified businesses
Data:
Median household income ($)
Median household income (% change since 2000)
Household income diversity
Ratio of average income to average house value (%)
Ratio of average income to average rent
Median household income ($) - White
Median household income ($) - Black or African American
Median household income ($) - Asian
Median household income ($) - Hispanic or Latino
Median household income ($) - American Indian and Alaska Native
Median household income ($) - Multirace
Median household income ($) - Other Race
Median household income for houses/condos with a mortgage ($)
Median household income for apartments without a mortgage ($)
Races - White alone (%)
Races - White alone (% change since 2000)
Races - Black alone (%)
Races - Black alone (% change since 2000)
Races - American Indian alone (%)
Races - American Indian alone (% change since 2000)
Races - Asian alone (%)
Races - Asian alone (% change since 2000)
Races - Hispanic (%)
Races - Hispanic (% change since 2000)
Races - Native Hawaiian and Other Pacific Islander alone (%)
Races - Native Hawaiian and Other Pacific Islander alone (% change since 2000)
Races - Two or more races (%)
Races - Two or more races (% change since 2000)
Races - Other race alone (%)
Races - Other race alone (% change since 2000)
Racial diversity
Unemployment (%)
Unemployment (% change since 2000)
Unemployment (%) - White
Unemployment (%) - Black or African American
Unemployment (%) - Asian
Unemployment (%) - Hispanic or Latino
Unemployment (%) - American Indian and Alaska Native
Unemployment (%) - Multirace
Unemployment (%) - Other Race
Population density (people per square mile)
Population - Males (%)
Population - Females (%)
Population - Males (%) - White
Population - Males (%) - Black or African American
Population - Males (%) - Asian
Population - Males (%) - Hispanic or Latino
Population - Males (%) - American Indian and Alaska Native
Population - Males (%) - Multirace
Population - Males (%) - Other Race
Population - Females (%) - White
Population - Females (%) - Black or African American
Population - Females (%) - Asian
Population - Females (%) - Hispanic or Latino
Population - Females (%) - American Indian and Alaska Native
Population - Females (%) - Multirace
Population - Females (%) - Other Race
Coronavirus confirmed cases (Apr 27, 2024)
Deaths caused by coronavirus (Apr 27, 2024)
Coronavirus confirmed cases (per 100k population) (Apr 27, 2024)
Deaths caused by coronavirus (per 100k population) (Apr 27, 2024)
Daily increase in number of cases (Apr 27, 2024)
Weekly increase in number of cases (Apr 27, 2024)
Cases doubled (in days) (Apr 27, 2024)
Hospitalized patients (Apr 18, 2022)
Negative test results (Apr 18, 2022)
Total test results (Apr 18, 2022)
COVID Vaccine doses distributed (per 100k population) (Sep 19, 2023)
COVID Vaccine doses administered (per 100k population) (Sep 19, 2023)
COVID Vaccine doses distributed (Sep 19, 2023)
COVID Vaccine doses administered (Sep 19, 2023)
Likely homosexual households (%)
Likely homosexual households (% change since 2000)
Likely homosexual households - Lesbian couples (%)
Likely homosexual households - Lesbian couples (% change since 2000)
Likely homosexual households - Gay men (%)
Likely homosexual households - Gay men (% change since 2000)
Cost of living index
Median gross rent ($)
Median contract rent ($)
Median monthly housing costs ($)
Median house or condo value ($)
Median house or condo value ($ change since 2000)
Mean house or condo value by units in structure - 1, detached ($)
Mean house or condo value by units in structure - 1, attached ($)
Mean house or condo value by units in structure - 2 ($)
Mean house or condo value by units in structure by units in structure - 3 or 4 ($)
Mean house or condo value by units in structure - 5 or more ($)
Mean house or condo value by units in structure - Boat, RV, van, etc. ($)
Mean house or condo value by units in structure - Mobile home ($)
Median house or condo value ($) - White
Median house or condo value ($) - Black or African American
Median house or condo value ($) - Asian
Median house or condo value ($) - Hispanic or Latino
Median house or condo value ($) - American Indian and Alaska Native
Median house or condo value ($) - Multirace
Median house or condo value ($) - Other Race
Median resident age
Resident age diversity
Median resident age - Males
Median resident age - Females
Median resident age - White
Median resident age - Black or African American
Median resident age - Asian
Median resident age - Hispanic or Latino
Median resident age - American Indian and Alaska Native
Median resident age - Multirace
Median resident age - Other Race
Median resident age - Males - White
Median resident age - Males - Black or African American
Median resident age - Males - Asian
Median resident age - Males - Hispanic or Latino
Median resident age - Males - American Indian and Alaska Native
Median resident age - Males - Multirace
Median resident age - Males - Other Race
Median resident age - Females - White
Median resident age - Females - Black or African American
Median resident age - Females - Asian
Median resident age - Females - Hispanic or Latino
Median resident age - Females - American Indian and Alaska Native
Median resident age - Females - Multirace
Median resident age - Females - Other Race
Commute - mean travel time to work (minutes)
Travel time to work - Less than 5 minutes (%)
Travel time to work - Less than 5 minutes (% change since 2000)
Travel time to work - 5 to 9 minutes (%)
Travel time to work - 5 to 9 minutes (% change since 2000)
Travel time to work - 10 to 19 minutes (%)
Travel time to work - 10 to 19 minutes (% change since 2000)
Travel time to work - 20 to 29 minutes (%)
Travel time to work - 20 to 29 minutes (% change since 2000)
Travel time to work - 30 to 39 minutes (%)
Travel time to work - 30 to 39 minutes (% change since 2000)
Travel time to work - 40 to 59 minutes (%)
Travel time to work - 40 to 59 minutes (% change since 2000)
Travel time to work - 60 to 89 minutes (%)
Travel time to work - 60 to 89 minutes (% change since 2000)
Travel time to work - 90 or more minutes (%)
Travel time to work - 90 or more minutes (% change since 2000)
Marital status - Never married (%)
Marital status - Now married (%)
Marital status - Separated (%)
Marital status - Widowed (%)
Marital status - Divorced (%)
Median family income ($)
Median family income (% change since 2000)
Median non-family income ($)
Median non-family income (% change since 2000)
Median per capita income ($)
Median per capita income (% change since 2000)
Median family income ($) - White
Median family income ($) - Black or African American
Median family income ($) - Asian
Median family income ($) - Hispanic or Latino
Median family income ($) - American Indian and Alaska Native
Median family income ($) - Multirace
Median family income ($) - Other Race
Median year house/condo built
Median year apartment built
Year house built - Built 2005 or later (%)
Year house built - Built 2000 to 2004 (%)
Year house built - Built 1990 to 1999 (%)
Year house built - Built 1980 to 1989 (%)
Year house built - Built 1970 to 1979 (%)
Year house built - Built 1960 to 1969 (%)
Year house built - Built 1950 to 1959 (%)
Year house built - Built 1940 to 1949 (%)
Year house built - Built 1939 or earlier (%)
Average household size
Household density (households per square mile)
Average household size - White
Average household size - Black or African American
Average household size - Asian
Average household size - Hispanic or Latino
Average household size - American Indian and Alaska Native
Average household size - Multirace
Average household size - Other Race
Occupied housing units (%)
Vacant housing units (%)
Owner occupied housing units (%)
Renter occupied housing units (%)
Vacancy status - For rent (%)
Vacancy status - For sale only (%)
Vacancy status - Rented or sold, not occupied (%)
Vacancy status - For seasonal, recreational, or occasional use (%)
Vacancy status - For migrant workers (%)
Vacancy status - Other vacant (%)
Residents with income below the poverty level (%)
Residents with income below 50% of the poverty level (%)
Children below poverty level (%)
Poor families by family type - Married-couple family (%)
Poor families by family type - Male, no wife present (%)
Poor families by family type - Female, no husband present (%)
Poverty status for native-born residents (%)
Poverty status for foreign-born residents (%)
Poverty among high school graduates not in families (%)
Poverty among people who did not graduate high school not in families (%)
Residents with income below the poverty level (%) - White
Residents with income below the poverty level (%) - Black or African American
Residents with income below the poverty level (%) - Asian
Residents with income below the poverty level (%) - Hispanic or Latino
Residents with income below the poverty level (%) - American Indian and Alaska Native
Residents with income below the poverty level (%) - Multirace
Residents with income below the poverty level (%) - Other Race
Air pollution - Air Quality Index (AQI)
Air pollution - CO
Air pollution - NO2
Air pollution - SO2
Air pollution - Ozone
Air pollution - PM10
Air pollution - PM25
Air pollution - Pb
Crime - Murders per 100,000 population
Crime - Rapes per 100,000 population
Crime - Robberies per 100,000 population
Crime - Assaults per 100,000 population
Crime - Burglaries per 100,000 population
Crime - Thefts per 100,000 population
Crime - Auto thefts per 100,000 population
Crime - Arson per 100,000 population
Crime - City-data.com crime index
Crime - Violent crime index
Crime - Property crime index
Crime - Murders per 100,000 population (5 year average)
Crime - Rapes per 100,000 population (5 year average)
Crime - Robberies per 100,000 population (5 year average)
Crime - Assaults per 100,000 population (5 year average)
Crime - Burglaries per 100,000 population (5 year average)
Crime - Thefts per 100,000 population (5 year average)
Crime - Auto thefts per 100,000 population (5 year average)
Crime - Arson per 100,000 population (5 year average)
Crime - City-data.com crime index (5 year average)
Crime - Violent crime index (5 year average)
Crime - Property crime index (5 year average)
1996 Presidential Elections Results (%) - Democratic Party (Clinton)
1996 Presidential Elections Results (%) - Republican Party (Dole)
1996 Presidential Elections Results (%) - Other
2000 Presidential Elections Results (%) - Democratic Party (Gore)
2000 Presidential Elections Results (%) - Republican Party (Bush)
2000 Presidential Elections Results (%) - Other
2004 Presidential Elections Results (%) - Democratic Party (Kerry)
2004 Presidential Elections Results (%) - Republican Party (Bush)
2004 Presidential Elections Results (%) - Other
2008 Presidential Elections Results (%) - Democratic Party (Obama)
2008 Presidential Elections Results (%) - Republican Party (McCain)
2008 Presidential Elections Results (%) - Other
2012 Presidential Elections Results (%) - Democratic Party (Obama)
2012 Presidential Elections Results (%) - Republican Party (Romney)
2012 Presidential Elections Results (%) - Other
2016 Presidential Elections Results (%) - Democratic Party (Clinton)
2016 Presidential Elections Results (%) - Republican Party (Trump)
2016 Presidential Elections Results (%) - Other
2020 Presidential Elections Results (%) - Democratic Party (Biden)
2020 Presidential Elections Results (%) - Republican Party (Trump)
2020 Presidential Elections Results (%) - Other
Ancestries Reported - Arab (%)
Ancestries Reported - Czech (%)
Ancestries Reported - Danish (%)
Ancestries Reported - Dutch (%)
Ancestries Reported - English (%)
Ancestries Reported - French (%)
Ancestries Reported - French Canadian (%)
Ancestries Reported - German (%)
Ancestries Reported - Greek (%)
Ancestries Reported - Hungarian (%)
Ancestries Reported - Irish (%)
Ancestries Reported - Italian (%)
Ancestries Reported - Lithuanian (%)
Ancestries Reported - Norwegian (%)
Ancestries Reported - Polish (%)
Ancestries Reported - Portuguese (%)
Ancestries Reported - Russian (%)
Ancestries Reported - Scotch-Irish (%)
Ancestries Reported - Scottish (%)
Ancestries Reported - Slovak (%)
Ancestries Reported - Subsaharan African (%)
Ancestries Reported - Swedish (%)
Ancestries Reported - Swiss (%)
Ancestries Reported - Ukrainian (%)
Ancestries Reported - United States (%)
Ancestries Reported - Welsh (%)
Ancestries Reported - West Indian (%)
Ancestries Reported - Other (%)
Educational Attainment - No schooling completed (%)
Educational Attainment - Less than high school (%)
Educational Attainment - High school or equivalent (%)
Educational Attainment - Less than 1 year of college (%)
Educational Attainment - 1 or more years of college (%)
Educational Attainment - Associate degree (%)
Educational Attainment - Bachelor's degree (%)
Educational Attainment - Master's degree (%)
Educational Attainment - Professional school degree (%)
Educational Attainment - Doctorate degree (%)
School Enrollment - Nursery, preschool (%)
School Enrollment - Kindergarten (%)
School Enrollment - Grade 1 to 4 (%)
School Enrollment - Grade 5 to 8 (%)
School Enrollment - Grade 9 to 12 (%)
School Enrollment - College undergrad (%)
School Enrollment - Graduate or professional (%)
School Enrollment - Not enrolled in school (%)
School enrollment - Public schools (%)
School enrollment - Private schools (%)
School enrollment - Not enrolled (%)
Median number of rooms in houses and condos
Median number of rooms in apartments
Housing units lacking complete plumbing facilities (%)
Housing units lacking complete kitchen facilities (%)
Density of houses
Urban houses (%)
Rural houses (%)
Households with people 60 years and over (%)
Households with people 65 years and over (%)
Households with people 75 years and over (%)
Households with one or more nonrelatives (%)
Households with no nonrelatives (%)
Population in households (%)
Family households (%)
Nonfamily households (%)
Population in families (%)
Family households with own children (%)
Median number of bedrooms in owner occupied houses
Mean number of bedrooms in owner occupied houses
Median number of bedrooms in renter occupied houses
Mean number of bedrooms in renter occupied houses
Median number of vehichles in owner occupied houses
Mean number of vehichles in owner occupied houses
Median number of vehichles in renter occupied houses
Mean number of vehichles in renter occupied houses
Mortgage status - with mortgage (%)
Mortgage status - with second mortgage (%)
Mortgage status - with home equity loan (%)
Mortgage status - with both second mortgage and home equity loan (%)
Mortgage status - without a mortgage (%)
Average family size
Average family size - White
Average family size - Black or African American
Average family size - Asian
Average family size - Hispanic or Latino
Average family size - American Indian and Alaska Native
Average family size - Multirace
Average family size - Other Race
Geographical mobility - Same house 1 year ago (%)
Geographical mobility - Moved within same county (%)
Geographical mobility - Moved from different county within same state (%)
Geographical mobility - Moved from different state (%)
Geographical mobility - Moved from abroad (%)
Place of birth - Born in state of residence (%)
Place of birth - Born in other state (%)
Place of birth - Native, outside of US (%)
Place of birth - Foreign born (%)
Housing units in structures - 1, detached (%)
Housing units in structures - 1, attached (%)
Housing units in structures - 2 (%)
Housing units in structures - 3 or 4 (%)
Housing units in structures - 5 to 9 (%)
Housing units in structures - 10 to 19 (%)
Housing units in structures - 20 to 49 (%)
Housing units in structures - 50 or more (%)
Housing units in structures - Mobile home (%)
Housing units in structures - Boat, RV, van, etc. (%)
House/condo owner moved in on average (years ago)
Renter moved in on average (years ago)
Year householder moved into unit - Moved in 1999 to March 2000 (%)
Year householder moved into unit - Moved in 1995 to 1998 (%)
Year householder moved into unit - Moved in 1990 to 1994 (%)
Year householder moved into unit - Moved in 1980 to 1989 (%)
Year householder moved into unit - Moved in 1970 to 1979 (%)
Year householder moved into unit - Moved in 1969 or earlier (%)
Means of transportation to work - Drove car alone (%)
Means of transportation to work - Carpooled (%)
Means of transportation to work - Public transportation (%)
Means of transportation to work - Bus or trolley bus (%)
Means of transportation to work - Streetcar or trolley car (%)
Means of transportation to work - Subway or elevated (%)
Means of transportation to work - Railroad (%)
Means of transportation to work - Ferryboat (%)
Means of transportation to work - Taxicab (%)
Means of transportation to work - Motorcycle (%)
Means of transportation to work - Bicycle (%)
Means of transportation to work - Walked (%)
Means of transportation to work - Other means (%)
Working at home (%)
Industry diversity
Most Common Industries - Agriculture, forestry, fishing and hunting, and mining (%)
Most Common Industries - Agriculture, forestry, fishing and hunting (%)
Most Common Industries - Mining, quarrying, and oil and gas extraction (%)
Most Common Industries - Construction (%)
Most Common Industries - Manufacturing (%)
Most Common Industries - Wholesale trade (%)
Most Common Industries - Retail trade (%)
Most Common Industries - Transportation and warehousing, and utilities (%)
Most Common Industries - Transportation and warehousing (%)
Most Common Industries - Utilities (%)
Most Common Industries - Information (%)
Most Common Industries - Finance and insurance, and real estate and rental and leasing (%)
Most Common Industries - Finance and insurance (%)
Most Common Industries - Real estate and rental and leasing (%)
Most Common Industries - Professional, scientific, and management, and administrative and waste management services (%)
Most Common Industries - Professional, scientific, and technical services (%)
Most Common Industries - Management of companies and enterprises (%)
Most Common Industries - Administrative and support and waste management services (%)
Most Common Industries - Educational services, and health care and social assistance (%)
Most Common Industries - Educational services (%)
Most Common Industries - Health care and social assistance (%)
Most Common Industries - Arts, entertainment, and recreation, and accommodation and food services (%)
Most Common Industries - Arts, entertainment, and recreation (%)
Most Common Industries - Accommodation and food services (%)
Most Common Industries - Other services, except public administration (%)
Most Common Industries - Public administration (%)
Occupation diversity
Most Common Occupations - Management, business, science, and arts occupations (%)
Most Common Occupations - Management, business, and financial occupations (%)
Most Common Occupations - Management occupations (%)
Most Common Occupations - Business and financial operations occupations (%)
Most Common Occupations - Computer, engineering, and science occupations (%)
Most Common Occupations - Computer and mathematical occupations (%)
Most Common Occupations - Architecture and engineering occupations (%)
Most Common Occupations - Life, physical, and social science occupations (%)
Most Common Occupations - Education, legal, community service, arts, and media occupations (%)
Most Common Occupations - Community and social service occupations (%)
Most Common Occupations - Legal occupations (%)
Most Common Occupations - Education, training, and library occupations (%)
Most Common Occupations - Arts, design, entertainment, sports, and media occupations (%)
Most Common Occupations - Healthcare practitioners and technical occupations (%)
Most Common Occupations - Health diagnosing and treating practitioners and other technical occupations (%)
Most Common Occupations - Health technologists and technicians (%)
Most Common Occupations - Service occupations (%)
Most Common Occupations - Healthcare support occupations (%)
Most Common Occupations - Protective service occupations (%)
Most Common Occupations - Fire fighting and prevention, and other protective service workers including supervisors (%)
Most Common Occupations - Law enforcement workers including supervisors (%)
Most Common Occupations - Food preparation and serving related occupations (%)
Most Common Occupations - Building and grounds cleaning and maintenance occupations (%)
Most Common Occupations - Personal care and service occupations (%)
Most Common Occupations - Sales and office occupations (%)
Most Common Occupations - Sales and related occupations (%)
Most Common Occupations - Office and administrative support occupations (%)
Most Common Occupations - Natural resources, construction, and maintenance occupations (%)
Most Common Occupations - Farming, fishing, and forestry occupations (%)
Most Common Occupations - Construction and extraction occupations (%)
Most Common Occupations - Installation, maintenance, and repair occupations (%)
Most Common Occupations - Production, transportation, and material moving occupations (%)
Most Common Occupations - Production occupations (%)
Most Common Occupations - Transportation occupations (%)
Most Common Occupations - Material moving occupations (%)
People in Group quarters - Institutionalized population (%)
People in Group quarters - Correctional institutions (%)
People in Group quarters - Federal prisons and detention centers (%)
People in Group quarters - Halfway houses (%)
People in Group quarters - Local jails and other confinement facilities (including police lockups) (%)
People in Group quarters - Military disciplinary barracks (%)
People in Group quarters - State prisons (%)
People in Group quarters - Other types of correctional institutions (%)
People in Group quarters - Nursing homes (%)
People in Group quarters - Hospitals/wards, hospices, and schools for the handicapped (%)
People in Group quarters - Hospitals/wards and hospices for chronically ill (%)
People in Group quarters - Hospices or homes for chronically ill (%)
People in Group quarters - Military hospitals or wards for chronically ill (%)
People in Group quarters - Other hospitals or wards for chronically ill (%)
People in Group quarters - Hospitals or wards for drug/alcohol abuse (%)
People in Group quarters - Mental (Psychiatric) hospitals or wards (%)
People in Group quarters - Schools, hospitals, or wards for the mentally retarded (%)
People in Group quarters - Schools, hospitals, or wards for the physically handicapped (%)
People in Group quarters - Institutions for the deaf (%)
People in Group quarters - Institutions for the blind (%)
People in Group quarters - Orthopedic wards and institutions for the physically handicapped (%)
People in Group quarters - Wards in general hospitals for patients who have no usual home elsewhere (%)
People in Group quarters - Wards in military hospitals for patients who have no usual home elsewhere (%)
People in Group quarters - Juvenile institutions (%)
People in Group quarters - Long-term care (%)
People in Group quarters - Homes for abused, dependent, and neglected children (%)
People in Group quarters - Residential treatment centers for emotionally disturbed children (%)
People in Group quarters - Training schools for juvenile delinquents (%)
People in Group quarters - Short-term care, detention or diagnostic centers for delinquent children (%)
People in Group quarters - Type of juvenile institution unknown (%)
People in Group quarters - Noninstitutionalized population (%)
People in Group quarters - College dormitories (includes college quarters off campus) (%)
People in Group quarters - Military quarters (%)
People in Group quarters - On base (%)
People in Group quarters - Barracks, unaccompanied personnel housing (UPH), (Enlisted/Officer), ;and similar group living quarters for military personnel (%)
People in Group quarters - Transient quarters for temporary residents (%)
People in Group quarters - Military ships (%)
People in Group quarters - Group homes (%)
People in Group quarters - Homes or halfway houses for drug/alcohol abuse (%)
People in Group quarters - Homes for the mentally ill (%)
People in Group quarters - Homes for the mentally retarded (%)
People in Group quarters - Homes for the physically handicapped (%)
People in Group quarters - Other group homes (%)
People in Group quarters - Religious group quarters (%)
People in Group quarters - Dormitories (%)
People in Group quarters - Agriculture workers' dormitories on farms (%)
People in Group quarters - Job Corps and vocational training facilities (%)
People in Group quarters - Other workers' dormitories (%)
People in Group quarters - Crews of maritime vessels (%)
People in Group quarters - Other nonhousehold living situations (%)
People in Group quarters - Other noninstitutional group quarters (%)
Residents speaking English at home (%)
Residents speaking English at home - Born in the United States (%)
Residents speaking English at home - Native, born elsewhere (%)
Residents speaking English at home - Foreign born (%)
Residents speaking Spanish at home (%)
Residents speaking Spanish at home - Born in the United States (%)
Residents speaking Spanish at home - Native, born elsewhere (%)
Residents speaking Spanish at home - Foreign born (%)
Residents speaking other language at home (%)
Residents speaking other language at home - Born in the United States (%)
Residents speaking other language at home - Native, born elsewhere (%)
Residents speaking other language at home - Foreign born (%)
Class of Workers - Employee of private company (%)
Class of Workers - Self-employed in own incorporated business (%)
Class of Workers - Private not-for-profit wage and salary workers (%)
Class of Workers - Local government workers (%)
Class of Workers - State government workers (%)
Class of Workers - Federal government workers (%)
Class of Workers - Self-employed workers in own not incorporated business and Unpaid family workers (%)
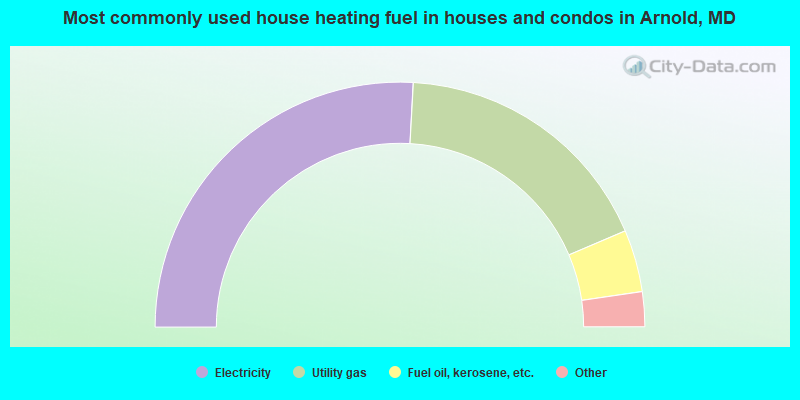
House heating fuel used in houses and condos - Utility gas (%)
House heating fuel used in houses and condos - Bottled, tank, or LP gas (%)
House heating fuel used in houses and condos - Electricity (%)
House heating fuel used in houses and condos - Fuel oil, kerosene, etc. (%)
House heating fuel used in houses and condos - Coal or coke (%)
House heating fuel used in houses and condos - Wood (%)
House heating fuel used in houses and condos - Solar energy (%)
House heating fuel used in houses and condos - Other fuel (%)
House heating fuel used in houses and condos - No fuel used (%)
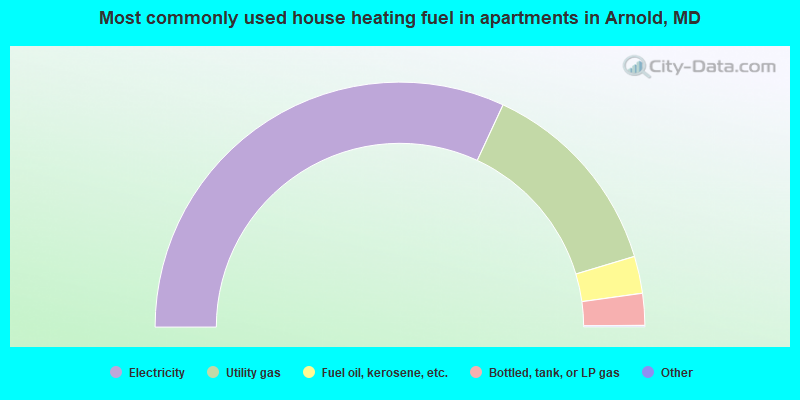
House heating fuel used in apartments - Utility gas (%)
House heating fuel used in apartments - Bottled, tank, or LP gas (%)
House heating fuel used in apartments - Electricity (%)
House heating fuel used in apartments - Fuel oil, kerosene, etc. (%)
House heating fuel used in apartments - Coal or coke (%)
House heating fuel used in apartments - Wood (%)
House heating fuel used in apartments - Solar energy (%)
House heating fuel used in apartments - Other fuel (%)
House heating fuel used in apartments - No fuel used (%)
Armed forces status - In Armed Forces (%)
Armed forces status - Civilian (%)
Armed forces status - Civilian - Veteran (%)
Armed forces status - Civilian - Nonveteran (%)
Fatal accidents locations in years 2005-2021
Fatal accidents locations in 2005
Fatal accidents locations in 2006
Fatal accidents locations in 2007
Fatal accidents locations in 2008
Fatal accidents locations in 2009
Fatal accidents locations in 2010
Fatal accidents locations in 2011
Fatal accidents locations in 2012
Fatal accidents locations in 2013
Fatal accidents locations in 2014
Fatal accidents locations in 2015
Fatal accidents locations in 2016
Fatal accidents locations in 2017
Fatal accidents locations in 2018
Fatal accidents locations in 2019
Fatal accidents locations in 2020
Fatal accidents locations in 2021
Alcohol use - People drinking some alcohol every month (%)
Alcohol use - People not drinking at all (%)
Alcohol use - Average days/month drinking alcohol
Alcohol use - Average drinks/week
Alcohol use - Average days/year people drink much
Audiometry - Average condition of hearing (%)
Audiometry - People that can hear a whisper from across a quiet room (%)
Audiometry - People that can hear normal voice from across a quiet room (%)
Audiometry - Ears ringing, roaring, buzzing (%)
Audiometry - Had a job exposure to loud noise (%)
Audiometry - Had off-work exposure to loud noise (%)
Blood Pressure & Cholesterol - Has high blood pressure (%)
Blood Pressure & Cholesterol - Checking blood pressure at home (%)
Blood Pressure & Cholesterol - Frequently checking blood cholesterol (%)
Blood Pressure & Cholesterol - Has high cholesterol level (%)
Consumer Behavior - Money monthly spent on food at supermarket/grocery store
Consumer Behavior - Money monthly spent on food at other stores
Consumer Behavior - Money monthly spent on eating out
Consumer Behavior - Money monthly spent on carryout/delivered foods
Consumer Behavior - Income spent on food at supermarket/grocery store (%)
Consumer Behavior - Income spent on food at other stores (%)
Consumer Behavior - Income spent on eating out (%)
Consumer Behavior - Income spent on carryout/delivered foods (%)
Current Health Status - General health condition (%)
Current Health Status - Blood donors (%)
Current Health Status - Has blood ever tested for HIV virus (%)
Current Health Status - Left-handed people (%)
Dermatology - People using sunscreen (%)
Diabetes - Diabetics (%)
Diabetes - Had a blood test for high blood sugar (%)
Diabetes - People taking insulin (%)
Diet Behavior & Nutrition - Diet health (%)
Diet Behavior & Nutrition - Milk product consumption (# of products/month)
Diet Behavior & Nutrition - Meals not home prepared (#/week)
Diet Behavior & Nutrition - Meals from fast food or pizza place (#/week)
Diet Behavior & Nutrition - Ready-to-eat foods (#/month)
Diet Behavior & Nutrition - Frozen meals/pizza (#/month)
Drug Use - People that ever used marijuana or hashish (%)
Drug Use - Ever used hard drugs (%)
Drug Use - Ever used any form of cocaine (%)
Drug Use - Ever used heroin (%)
Drug Use - Ever used methamphetamine (%)
Health Insurance - People covered by health insurance (%)
Kidney Conditions-Urology - Avg. # of times urinating at night
Medical Conditions - People with asthma (%)
Medical Conditions - People with anemia (%)
Medical Conditions - People with psoriasis (%)
Medical Conditions - People with overweight (%)
Medical Conditions - Elderly people having difficulties in thinking or remembering (%)
Medical Conditions - People who ever received blood transfusion (%)
Medical Conditions - People having trouble seeing even with glass/contacts (%)
Medical Conditions - People with arthritis (%)
Medical Conditions - People with gout (%)
Medical Conditions - People with congestive heart failure (%)
Medical Conditions - People with coronary heart disease (%)
Medical Conditions - People with angina pectoris (%)
Medical Conditions - People who ever had heart attack (%)
Medical Conditions - People who ever had stroke (%)
Medical Conditions - People with emphysema (%)
Medical Conditions - People with thyroid problem (%)
Medical Conditions - People with chronic bronchitis (%)
Medical Conditions - People with any liver condition (%)
Medical Conditions - People who ever had cancer or malignancy (%)
Mental Health - People who have little interest in doing things (%)
Mental Health - People feeling down, depressed, or hopeless (%)
Mental Health - People who have trouble sleeping or sleeping too much (%)
Mental Health - People feeling tired or having little energy (%)
Mental Health - People with poor appetite or overeating (%)
Mental Health - People feeling bad about themself (%)
Mental Health - People who have trouble concentrating on things (%)
Mental Health - People moving or speaking slowly or too fast (%)
Mental Health - People having thoughts they would be better off dead (%)
Oral Health - Average years since last visit a dentist
Oral Health - People embarrassed because of mouth (%)
Oral Health - People with gum disease (%)
Oral Health - General health of teeth and gums (%)
Oral Health - Average days a week using dental floss/device
Oral Health - Average days a week using mouthwash for dental problem
Oral Health - Average number of teeth
Pesticide Use - Households using pesticides to control insects (%)
Pesticide Use - Households using pesticides to kill weeds (%)
Physical Activity - People doing vigorous-intensity work activities (%)
Physical Activity - People doing moderate-intensity work activities (%)
Physical Activity - People walking or bicycling (%)
Physical Activity - People doing vigorous-intensity recreational activities (%)
Physical Activity - People doing moderate-intensity recreational activities (%)
Physical Activity - Average hours a day doing sedentary activities
Physical Activity - Average hours a day watching TV or videos
Physical Activity - Average hours a day using computer
Physical Functioning - People having limitations keeping them from working (%)
Physical Functioning - People limited in amount of work they can do (%)
Physical Functioning - People that need special equipment to walk (%)
Physical Functioning - People experiencing confusion/memory problems (%)
Physical Functioning - People requiring special healthcare equipment (%)
Prescription Medications - Average number of prescription medicines taking
Preventive Aspirin Use - Adults 40+ taking low-dose aspirin (%)
Reproductive Health - Vaginal deliveries (%)
Reproductive Health - Cesarean deliveries (%)
Reproductive Health - Deliveries resulted in a live birth (%)
Reproductive Health - Pregnancies resulted in a delivery (%)
Reproductive Health - Women breastfeeding newborns (%)
Reproductive Health - Women that had a hysterectomy (%)
Reproductive Health - Women that had both ovaries removed (%)
Reproductive Health - Women that have ever taken birth control pills (%)
Reproductive Health - Women taking birth control pills (%)
Reproductive Health - Women that have ever used Depo-Provera or injectables (%)
Reproductive Health - Women that have ever used female hormones (%)
Sexual Behavior - People 18+ that ever had sex (vaginal, anal, or oral) (%)
Sexual Behavior - Males 18+ that ever had vaginal sex with a woman (%)
Sexual Behavior - Males 18+ that ever performed oral sex on a woman (%)
Sexual Behavior - Males 18+ that ever had anal sex with a woman (%)
Sexual Behavior - Males 18+ that ever had any sex with a man (%)
Sexual Behavior - Females 18+ that ever had vaginal sex with a man (%)
Sexual Behavior - Females 18+ that ever performed oral sex on a man (%)
Sexual Behavior - Females 18+ that ever had anal sex with a man (%)
Sexual Behavior - Females 18+ that ever had any kind of sex with a woman (%)
Sexual Behavior - Average age people first had sex
Sexual Behavior - Average number of female sex partners in lifetime (males 18+)
Sexual Behavior - Average number of female vaginal sex partners in lifetime (males 18+)
Sexual Behavior - Average age people first performed oral sex on a woman (18+)
Sexual Behavior - Average number of woman performed oral sex on in lifetime (18+)
Sexual Behavior - Average number of male sex partners in lifetime (males 18+)
Sexual Behavior - Average number of male anal sex partners in lifetime (males 18+)
Sexual Behavior - Average age people first performed oral sex on a man (18+)
Sexual Behavior - Average number of male oral sex partners in lifetime (18+)
Sexual Behavior - People using protection when performing oral sex (%)
Sexual Behavior - Average number of times people have vaginal or anal sex a year
Sexual Behavior - People having sex without condom (%)
Sexual Behavior - Average number of male sex partners in lifetime (females 18+)
Sexual Behavior - Average number of male vaginal sex partners in lifetime (females 18+)
Sexual Behavior - Average number of female sex partners in lifetime (females 18+)
Sexual Behavior - Circumcised males 18+ (%)
Sleep Disorders - Average hours sleeping at night
Sleep Disorders - People that has trouble sleeping (%)
Smoking-Cigarette Use - People smoking cigarettes (%)
Taste & Smell - People 40+ having problems with smell (%)
Taste & Smell - People 40+ having problems with taste (%)
Taste & Smell - People 40+ that ever had wisdom teeth removed (%)
Taste & Smell - People 40+ that ever had tonsils teeth removed (%)
Taste & Smell - People 40+ that ever had a loss of consciousness because of a head injury (%)
Taste & Smell - People 40+ that ever had a broken nose or other serious injury to face or skull (%)
Taste & Smell - People 40+ that ever had two or more sinus infections (%)
Weight - Average height (inches)
Weight - Average weight (pounds)
Weight - Average BMI
Weight - People that are obese (%)
Weight - People that ever were obese (%)
Weight - People trying to lose weight (%)
According to our research of Maryland and other state lists, there were 13 registered sex offenders living in Arnold, Maryland as of April 26, 2024 . The ratio of all residents to sex offenders in Arnold is 1,767 to 1.The ratio of registered sex offenders to all residents in this city is lower than the state average.
Latest news from Arnold, MD collected exclusively by city-data.com from local newspapers, TV, and radio stations
Ancestries: German (13.0%), Irish (7.7%), American (7.5%), English (6.8%), Italian (6.2%), Greek (5.0%).
Current Local Time:
Land area: 10.8 square miles.
Population density: 2,139 people per square mile (low).
2,026 residents are foreign born (3.0% Latin America , 2.8% Asia , 1.0% Europe ).
This place:
8.1%Maryland:
15.7%
Median real estate property taxes paid for housing units with mortgages in 2022: $4,135 (0.8%)Median real estate property taxes paid for housing units with no mortgage in 2022: $3,932 (0.7%)
Nearest city with pop. 50,000+: Bowie, MD (14.5 miles
Nearest city with pop. 200,000+: Baltimore, MD
Nearest city with pop. 1,000,000+: Philadelphia, PA
Nearest cities:
Jennings, MD (2.2 miles),
Latitude: 39.05 N, Longitude: 76.50 W
Daytime population change due to commuting: -6,170 (-24.6%)Workers who live and work in this place: 4,056 (31.3%)
Property values in Arnold, MD
Unemployment in December 2023:
Most common occupations in Arnold, MD (%)
Both Males Females
Other management occupations, except farmers and farm managers (6.6%)
Preschool, kindergarten, elementary, and middle school teachers (4.8%)
Other office and administrative support workers, including supervisors (4.4%)
Computer specialists (4.2%)
Other sales and related occupations, including supervisors (4.2%)
Retail sales workers, except cashiers (4.0%)
Secretaries and administrative assistants (3.8%)
Other management occupations, except farmers and farm managers (8.5%)
Computer specialists (6.1%)
Engineers (5.3%)
Sales representatives, services, wholesale and manufacturing (4.8%)
Retail sales workers, except cashiers (4.3%)
Other sales and related occupations, including supervisors (4.1%)
Top executives (3.7%)
Preschool, kindergarten, elementary, and middle school teachers (9.0%)
Secretaries and administrative assistants (7.9%)
Other office and administrative support workers, including supervisors (6.5%)
Other management occupations, except farmers and farm managers (4.6%)
Other sales and related occupations, including supervisors (4.3%)
Retail sales workers, except cashiers (3.7%)
Registered nurses (3.6%)
Tornado activity:
Arnold-area historical tornado activity is slightly above Maryland state average. It is 8% greater than the overall U.S. average.
On 6/9/1961, a category F3 (max. wind speeds 158-206 mph) tornado 12.5 miles away from the Arnold place center caused between $50,000 and $500,000 in damages.
On 4/28/2002, a category F4 (max. wind speeds 207-260 mph) tornado 39.2 miles away from the place center killed 3 people and injured 122 people and caused $124 million in damages.
Earthquake activity:
Arnold-area historical earthquake activity is significantly above Maryland state average. It is 60% smaller than the overall U.S. average. On 8/23/2011 at 17:51:04, a magnitude 5.8 (5.8 MW, Depth: 3.7 mi, Class: Moderate, Intensity: VI - VII) earthquake occurred 110.8 miles away from the city center On 1/16/1994 at 01:49:16, a magnitude 4.6 (4.6 MB, 4.6 LG, Depth: 3.1 mi, Class: Light, Intensity: IV - V) earthquake occurred 92.0 miles away from Arnold center On 8/25/2011 at 05:07:52, a magnitude 4.5 (4.5 ML, Depth: 4.2 mi) earthquake occurred 110.1 miles away from the city center On 12/9/2003 at 20:59:18, a magnitude 4.5 (4.5 ML, Depth: 6.2 mi) earthquake occurred 123.7 miles away from the city center On 12/9/2003 at 20:59:14, a magnitude 4.5 (4.5 MB, 4.5 LG) earthquake occurred 126.6 miles away from Arnold center On 9/25/1998 at 19:52:52, a magnitude 5.2 (4.8 MB, 4.3 MS, 5.2 LG, 4.5 MW, Depth: 3.1 mi) earthquake occurred 266.3 miles away from the city center Magnitude types: regional Lg-wave magnitude (LG), body-wave magnitude (MB), local magnitude (ML), surface-wave magnitude (MS), moment magnitude (MW) Natural disasters: The number of natural disasters in Anne Arundel County (20) is greater than the US average (15).Major Disasters (Presidential) Declared: 15Emergencies Declared: 5Hurricanes: 6, Winter Storms: 6, Snowstorms: 4, Floods: 3, Storms: 3, Tropical Storms: 2, Blizzard: 1, Heavy Rain: 1, Ice Storm: 1, Snowfall: 1, Tornado: 1, Other: 1 (Note: some incidents may be assigned to more than one category). Hospitals and medical centers in Arnold: FUTURE CARE CHESAPEAKE (305 COLLEGE PARKWAY)
US RENAL CARE - CHESAPEAKE (305 COLLEGE PKY)
Other hospitals and medical centers near Arnold: ANNE ARUNDEL MEDICAL CENTER (about 5 miles away; ANNAPOLIS, MD)
FMC - ANNE ARUNDEL (Dialysis Facility, about 5 miles away; ANNAPOLIS, MD)
ARUNDEL GENL HOSP HOSPICE (Hospital, about 5 miles away; ANNAPOLIS, MD)
HOME CALL - ANNAPOLIS (Home Health Center, about 6 miles away; ANNAPOLIS, MD)
CROWNSVILLE HOSPITAL CENTER (Hospital, about 6 miles away; CROWNSVILLE, MD)
THE ARBOR (Nursing Home, about 6 miles away; ANNAPOLIS, MD)
ANNE ARUNDEL CO HLTH DEPT (Home Health Center, about 6 miles away; ANNAPOLIS, MD)
Amtrak stations near Arnold: 15 miles: BWI AIRPORT RAIL STATION (BALTIMORE, AMTRAK WAY) Services: ticket office, fully wheelchair accessible, enclosed waiting area, public restrooms, public payphones, snack bar, ATM, paid short-term parking, paid long-term parking, call for car rental service, call for taxi service, public transit connection.
20 miles: BALTIMORE (1500 N. CHARLES ST.) Services: ticket office, fully wheelchair accessible, enclosed waiting area, public restrooms, public payphones, full-service food facilities, snack bar, vending machines, ATM, paid short-term parking, paid long-term parking, call for car rental service, taxi stand, public transit connection.
College/University in Arnold: Anne Arundel Community College Full-time enrollment: 10,501; Location: 101 College Pky; Public; Website: www.aacc.edu)
Other colleges/universities with over 2000 students near Arnold:
United States Naval Academy (about 5 miles; Annapolis, MD ; Full-time enrollment: 5,681)
Bowie State University (about 15 miles; Bowie, MD ; FT enrollment: 4,517)
All-State Career-Baltimore (about 16 miles; Baltimore, MD ; FT enrollment: 2,287)
University of Maryland-Baltimore (about 19 miles; Baltimore, MD ; FT enrollment: 3,162)
University of Maryland-Baltimore County (about 19 miles; Baltimore, MD ; FT enrollment: 11,160)
University of Baltimore (about 20 miles; Baltimore, MD ; FT enrollment: 3,592)
Maryland Institute College of Art (about 20 miles; Baltimore, MD ; FT enrollment: 2,267)
Public elementary/middle schools in Arnold:
Private elementary/middle schools in Arnold: CHESAPEAKE ACADEMY Students: 239, Location: 1185 BALTIMORE ANNAPOLIS BLVD, Grades: PK-5)
ARNOLD CHRISTIAN ACADEMY Students: 33, Location: 365 JONES STATION RD, Grades: KG-8)
ANTIOCH CHRISTIAN SCHOOL Students: 10, Location: 1535 RITCHIE HWY, Grades: 7-8)
See full list of schools located in Arnold
Notable locations in Arnold: (A) , Bay Hills Country Club (B) , Severna Park Golf Center (C) , Severn Commerce Center (D) , Wilsons Wharf (E) , Broadneck Medical Center (F) , Arnold Senior Citizens Center (G) , Truxal Library (H) , Pascal Center For Performing Arts (I) , Ludlum Hall (J) , Jenkins Gymnasium (K) , Humanities Building (L) , Dragun Science Building (M) , Careers Center (N) , Jones Station Fire Department (O) , Arnold Volunteer Fire Department (P) . Display/hide their locations on the map
Shopping Centers: (1) , Arnold Station Shopping Center (2) , Bay Hills Shopping Center (3) . Display/hide their locations on the map
Churches in Arnold include: (A) , College Parkway Baptist Church (B) , Temple Beth Sholom (C) , Antioch Church (D) , Church of Christ (E) , Gloria Dei Lutheran Church (F) , Mount Calvary United Methodist Church (G) , My Father's House Church (H) , Saint Conrad Friary (I) . Display/hide their locations on the map
Cemetery: (1) . Display/hide its location on the map
Lakes and reservoirs: (A) , Winterberry Pond (B) , Fox Pond (C) , Lake Placid (D) , Timberneck Pond (E) , Bohdal Pond (F) , Hartings Ponds (G) , Spriggs Pond (H) . Display/hide their locations on the map
Streams, rivers, and creeks: (A) , Rowles Branch (B) . Display/hide their locations on the map
Parks in Arnold include: (1) , Olson Memorial Pool (2) , Siegert Field (3) , Arnold Park (4) , Twin Oaks Park (5) , Magovista Park (6) , Belvedere Park (7) . Display/hide their locations on the map
Tourist attractions: (1) , AAA Mid-Atlantic - AAA Mid-Atlantic Insurance Agency- Arnold Branch (Tours & Charters; 1450 Ritchie Highway Suite 110) (2) , AAA Travel (Tours & Charters; 1450 Ritchie Highway Suite 110) (3) . Display/hide their approximate locations on the map
Anne Arundel County has a predicted average indoor radon screening level between 2 and 4 pCi/L (pico curies per liter) - Moderate Potential Drinking water stations with addresses in Arnold and their reported violations in the past:
KAUFMANNS OFFICE BUILDING (Address: 277K PENINSULA FARM ROAD Population served: 25, Groundwater):
Past monitoring violations:
Initial Tap Sampling for Pb and Cu - In JAN-01-2013, Contaminant: Lead and Copper Rule. Follow-up actions: St Violation/Reminder Notice (4 times from MAY-01-2012 to APR-12-2013), St Compliance achieved (APR-19-2013)
3 routine major monitoring violations
Average household size: This place:
2.7 peopleMaryland:
2.6 people
Percentage of family households: This place:
75.3%Whole state:
67.1%
Percentage of households with unmarried partners: This place:
5.3%Whole state:
6.4%
Likely homosexual households (counted as self-reported same-sex unmarried-partner households)
Lesbian couples: 0.4% of all households Gay men: 0.3% of all households
People in group quarters in Arnold in 2010:
138 people in nursing facilities/skilled-nursing facilities
21 people in other noninstitutional facilities
4 people in group homes intended for adults
People in group quarters in Arnold in 2000:
190 people in nursing homes
104 people in homes for the mentally retarded
20 people in other noninstitutional group quarters
4 people in other group homes
Banks with branches in Arnold (2011 data):
Manufacturers and Traders Trust Company: Bay Hills Branch at 1230 Bay Dale Drive, branch established on 1978/08/21. Info updated 2011/08/08: Bank assets: $76,887.1 mil, Deposits: $60,064.2 mil, headquarters in Buffalo, NY, positive income , Commercial Lending Specialization, 808 total offices , Holding Company: M&T Bank Corporation
SunTrust Bank: Arnold Safeway Branch at 1451 Ritchie Hwy, branch established on 2008/11/14. Info updated 2010/05/27: Bank assets: $171,291.7 mil, Deposits: $129,833.2 mil, headquarters in Atlanta, GA, positive income , Commercial Lending Specialization, 1716 total offices , Holding Company: Suntrust Banks, Inc.
TD Bank, National Association: Arnold Branch at 1470 Richie Hwy, branch established on 2009/10/03. Info updated 2010/10/04: Bank assets: $188,912.6 mil, Deposits: $153,149.8 mil, headquarters in Wilmington, DE, positive income , 1314 total offices , Holding Company: Toronto-Dominion Bank, The
Essex Bank: Arnold Branch at 1460 Ritchie Highway, branch established on 1987/06/30. Info updated 2009/12/01: Bank assets: $1,091.2 mil, Deposits: $934.0 mil, headquarters in Tappahannock, VA, positive income , Commercial Lending Specialization, 24 total offices , Holding Company: Community Bankers Trust Corporation
Branch Banking and Trust Company: Arnold Branch at 2 Arnold Road, branch established on 1973/04/09. Info updated 2010/03/29: Bank assets: $168,867.6 mil, Deposits: $127,549.5 mil, headquarters in Winston Salem, NC, positive income , Commercial Lending Specialization, 1793 total offices , Holding Company: Bb&T Corporation
For population 15 years and over in Arnold:
Never married: 27.0%Now married: 60.1%Separated: 1.7%Widowed: 3.2%Divorced: 8.0% For population 25 years and over in Arnold:
High school or higher: 97.7%Bachelor's degree or higher: 56.1%Graduate or professional degree: 24.2%Unemployed: 2.6%Mean travel time to work (commute): 23.2 minutes
Education Gini index (Inequality in education) Here:
9.0Maryland average:
12.7
Religion statistics for Arnold, MD (based on Anne Arundel County data)
Religion Adherents Congregations Catholic 95,116 20 Mainline Protestant 49,450 107 Evangelical Protestant 44,446 182 Other 7,076 28 Black Protestant 5,609 11 Orthodox 3,250 2 None 332,709 -
Source: Clifford Grammich, Kirk Hadaway, Richard Houseal, Dale E.Jones, Alexei Krindatch, Richie Stanley and Richard H.Taylor. 2012. 2010 U.S.Religion Census: Religious Congregations & Membership Study. Association of Statisticians of American Religious Bodies. Jones, Dale E., et al. 2002. Congregations and Membership in the United States 2000. Nashville, TN: Glenmary Research Center. Graphs represent county-level data
Food Environment Statistics: Number of grocery stores : 79Anne Arundel County :
1.55 / 10,000 pop.Maryland :
1.96 / 10,000 pop.
Number of supercenters and club stores : 6This county :
0.12 / 10,000 pop.State :
0.07 / 10,000 pop.
Number of convenience stores (no gas) : 56Anne Arundel County :
1.10 / 10,000 pop.Maryland :
1.22 / 10,000 pop.
Number of convenience stores (with gas) : 116Anne Arundel County :
2.27 / 10,000 pop.State :
2.05 / 10,000 pop.
Number of full-service restaurants : 297Here :
5.82 / 10,000 pop.State :
5.40 / 10,000 pop.
Adult diabetes rate : This county :
8.4%Maryland :
9.1%
Adult obesity rate : Anne Arundel County :
25.5%Maryland :
26.7%
Low-income preschool obesity rate : This county :
15.2%State :
15.5%
Health and Nutrition: Healthy diet rate : Arnold:
52.8%Maryland:
50.1%
Average overall health of teeth and gums : This city:
52.2%Maryland:
47.6%
Average BMI : This city:
28.6Maryland:
28.8
People feeling badly about themselves : People not drinking alcohol at all : Arnold:
8.7%Maryland:
11.3%
Average hours sleeping at night : Overweight people : This city:
35.7%State:
34.1%
General health condition : Average condition of hearing : This city:
80.5%State:
80.5%
More about Health and Nutrition of Arnold, MD Residents
8.53% of this county's 2021 resident taxpayers lived in other counties in 2020 ($82,630 average adjusted gross income )
Here:
8.53%Maryland average:
7.42%
0.15% of residents moved from foreign countries ($1,366 average AGI )Anne Arundel County:
0.15%Maryland average:
0.05%
Top counties from which taxpayers relocated into this county between 2020 and 2021:
8.46% of this county's 2020 resident taxpayers moved to other counties in 2021 ($91,056 average adjusted gross income )
Here:
8.46%Maryland average:
7.91%
0.11% of residents moved to foreign countries ($1,325 average AGI )Anne Arundel County:
0.11%Maryland average:
0.04%
Top counties to which taxpayers relocated from this county between 2020 and 2021:
Businesses in Arnold, MD
Name Count Name Count
7-Eleven 1 McDonald's 1 Decora Cabinetry 4 Rite Aid 1 Domino's Pizza 1 Safeway 1 FedEx 2 Starbucks 1 GNC 2 Subway 1 H&R Block 1 UPS 3 MasterBrand Cabinets 8 Vons 1
Strongest AM radio stations in Arnold:
WBIS (1190 AM; 50 kW; ANNAPOLIS, MD; Owner: NATIONS RADIO, LLC)
WNAV (1430 AM; 5 kW; ANNAPOLIS, MD; Owner: SAJAK BROADCASTING CORP.)
WWLG (1370 AM; 50 kW; BALTIMORE, MD; Owner: M-10 BROADCASTING, INC.)
WCBM (680 AM; 50 kW; BALTIMORE, MD; Owner: WCBM MARYLAND, INC.)
WTEM (980 AM; 50 kW; WASHINGTON, DC; Owner: AMFM RADIO LICENSES, L.L.C.)
WBAL (1090 AM; 50 kW; BALTIMORE, MD; Owner: HEARST RADIO, INC.)
WPGC (1580 AM; 50 kW; MORNINGSIDE, MD; Owner: INFINITY WPGC(AM), INC.)
WTOP (1500 AM; 50 kW; WASHINGTON, DC; Owner: BONNEVILLE HOLDING COMPANY)
WGOP (700 AM; daytime; 25 kW; WALKERSVILLE, MD; Owner: BIRACH BROADCASTING CORPORATION)
WWGB (1030 AM; daytime; 50 kW; INDIAN HEAD, MD; Owner: GOOD BODY MEDIA, LLC)
WMET (1150 AM; 50 kW; GAITHERSBURG, MD; Owner: BELTWAY ACQUISITION CORPORATION)
WUST (1120 AM; daytime; 20 kW; WASHINGTON, DC)
WYRE (810 AM; daytime; 0 kW; ANNAPOLIS, MD)
Strongest FM radio stations in Arnold:
WFSI (107.9 FM; ANNAPOLIS, MD; Owner: FAMILY STATIONS, INC.)
WWMX (106.5 FM; BALTIMORE, MD; Owner: INFINITY RADIO OPERATIONS INC.)
WIYY (97.9 FM; BALTIMORE, MD; Owner: HEARST RADIO, INC.)
WPOC (93.1 FM; BALTIMORE, MD; Owner: CITICASTERS LICENSES, L.P.)
WLIF (101.9 FM; BALTIMORE, MD; Owner: INFINITY WLIF, INC.)
WWIN-FM (95.9 FM; GLEN BURNIE, MD; Owner: RADIO ONE LICENSES, LLC)
WRBS (95.1 FM; BALTIMORE, MD; Owner: PETER & JOHN RADIO FELLOWSHIP, INC.)
WXYV (105.7 FM; CATONSVILLE, MD; Owner: INFINITY RADIO OPERATIONS INC.)
WERQ-FM (92.3 FM; BALTIMORE, MD; Owner: RADIO ONE LICENSES, LLC)
WRNR-FM (103.1 FM; GRASONVILLE, MD; Owner: EMPIRE BROADCASTING SYSTEM, INC.)
WZBA (100.7 FM; WESTMINSTER, MD; Owner: SHAMROCK COMMUNICATIONS, INC.)
WWDC-FM (101.1 FM; WASHINGTON, DC; Owner: AMFM RADIO LICENSES, L.L.C.)
WRQX (107.3 FM; WASHINGTON, DC; Owner: WMAL, INC.)
WHUR-FM (96.3 FM; WASHINGTON, DC; Owner: THE HOWARD UNIVERSITY)
WASH (97.1 FM; WASHINGTON, DC; Owner: AMFM RADIO LICENSES, L.L.C.)
WPGC-FM (95.5 FM; MORNINGSIDE, MD; Owner: INFINITY BROADCASTING CORPORATION OF MARYLAND)
WARW (94.7 FM; BETHESDA, MD; Owner: INFINITY BROADCASTING OPERATIONS, INC.)
WBZS-FM (92.7 FM; PRINCE FREDERICK, MD; Owner: MEGA COMMUNICATIONS OF PRINCE FREDERICK LICENSEE, LLC)
WYPR (88.1 FM; BALTIMORE, MD; Owner: WYPR LICENSE HOLDING LLC)
WIHT (99.5 FM; WASHINGTON, DC; Owner: AMFM RADIO LICENSES, L.L.C.)
TV broadcast stations around Arnold:
WMPT (Channel 22; ANNAPOLIS, MD; Owner: MARYLAND PUBLIC BROADCASTING COMMISSION)
W63BP (Channel 63; ANNAPOLIS, MD; Owner: ANNAPOLIS BROADCASTING COMPANY, INC.)
W61BY (Channel 61; ANNAPOLIS, MD; Owner: ANNAPOLIS BROADCASTING COMPANY, INC.)
WBAL-TV (Channel 11; BALTIMORE, MD; Owner: WBAL HEARST-ARGYLE TV, INC. (CA CORP.))
WMAR-TV (Channel 2; BALTIMORE, MD; Owner: SCRIPPS HOWARD BROADCASTING COMPANY)
WBFF (Channel 45; BALTIMORE, MD; Owner: CHESAPEAKE TELEVISION LICENSEE, LLC)
WNUV (Channel 54; BALTIMORE, MD; Owner: BALTIMORE (WNUV-TV) LICENSEE, INC.)
WJZ-TV (Channel 13; BALTIMORE, MD; Owner: VIACOM INC.)
WUTB (Channel 24; BALTIMORE, MD; Owner: FOX TELEVISION STATIONS, INC.)
WMPB (Channel 67; BALTIMORE, MD; Owner: MARYLAND PUBLIC BROADCASTING COMMISSION)
WJLA-TV (Channel 7; WASHINGTON, DC; Owner: ACC LICENSEE, INC.)
WUSA (Channel 9; WASHINGTON, DC; Owner: THE DETROIT NEWS, INC.)
WTTG (Channel 5; WASHINGTON, DC; Owner: FOX TELEVISION STATIONS, INC.)
WBDC-TV (Channel 50; WASHINGTON, DC; Owner: WBDC BROADCASTING, INC.)
WETA-TV (Channel 26; WASHINGTON, DC; Owner: THE GREATER WASHINGTON ED TELECOMM. ASSOC)
WHUT-TV (Channel 32; WASHINGTON, DC; Owner: HOWARD UNIVERSITY)
WDCA (Channel 20; WASHINGTON, DC; Owner: FOX TELEVISION STATIONS, INC.)
WIAV-LP (Channel 58; WASHINGTON, DC; Owner: ASIAVISION, INC.)
WRC-TV (Channel 4; WASHINGTON, DC; Owner: NBC SUBSIDIARY (WRC-TV), INC.)
National Bridge Inventory (NBI) Statistics 9 Number of bridges2,218ft / 676m Total length $3,056,000 Total costs498,431 Total average daily traffic30,802 Total average daily truck traffic
FCC Registered Antenna Towers: 29 (
See the full list of FCC Registered Antenna Towers in Arnold )
FCC Registered Broadcast Land Mobile Towers: 6
370 Shore Acres Rd (Lat: 39.038722 Lon: -76.488861), Call Sign: KNGY503, Assigned Frequencies: 155.295 MHz, Grant Date: 05/23/2013, Expiration Date: 06/30/2023, Cancellation Date: 09/02/2023, Registrant: Teltronic, Inc., 4220 Shannon Dr., Suite L, Baltimore, MD 21213-2144, Phone: (443) 524-4509, Fax: (443) 524-1926, Email:
Intersection Of Oceanic Drive Access Road To Westinghouse West End Of Bay Bridge (Lat: 39.013167 Lon: -76.406639), Type: Pole, Structure height: 30 m, Overall height: 40 m, Call Sign: WPPB313, Assigned Frequencies: 47.2600 MHz, 47.3200 MHz, Grant Date: 07/23/2014, Expiration Date: 10/01/2024, Certifier: Gerrit Veenhof, Registrant: Mdot State Highway Administration, 5901 Baltimore National Pike, Catonsville, MD 21228, Phone: (410) 455-8330, Fax: (410) 744-4716, Email:
Lat: 39.052083 Lon: -76.521444, Call Sign: WQJA690, Assigned Frequencies: 462.125 MHz, 463.462 MHz, 464.450 MHz, 468.462 MHz, 469.450 MHz, 457.487 MHz, Grant Date: 06/25/2018, Expiration Date: 07/08/2028, Certifier: Keith Edwards, Registrant: Comm-Tronics, Inc., 120 Roesler Road, Glen Burnie, MD 21060, Phone: (410) 768-3333, Fax: (410) 768-9365, Email:
Lat: 39.044583 Lon: -76.497417, Call Sign: WQQC246, Assigned Frequencies: 451.637 MHz, 456.637 MHz, 452.037 MHz, Grant Date: 07/30/2022, Expiration Date: 10/22/2032, Certifier: Matt Martin, Registrant: Bay Hills Golf, LLC, 5429 Lbj Freeway, Suite 400, Dallas, TX 75240, Phone: (817) 312-4318, Fax: (972) 960-7719, Email:
ARNOLD WELLS, 503 College Pkwy, Unit T (Lat: 39.036972 Lon: -76.482000), Type: Ltower, Structure height: 91.4 m, Overall height: 93.9 m, Call Sign: WRCY690, Assigned Frequencies: 854.187 MHz, 856.012 MHz, 856.412 MHz, 854.512 MHz, 854.712 MHz, 855.837 MHz, 856.162 MHz, 856.512 MHz, Grant Date: 02/27/2019, Expiration Date: 02/27/2029, Certifier: William Dehoff Jr, Registrant: County Of Anne Arundel, 44 Calvert Street, Ms 1117, Annapolis, MD 21401, Phone: (410) 222-2020, Email:
Lat: 39.058889 Lon: -76.513611, Call Sign: WRDS495, Assigned Frequencies: 451.362 MHz, 451.387 MHz, 456.362 MHz, Grant Date: 07/10/2019, Expiration Date: 07/10/2029, Certifier: Alan Levy, Registrant: Procom Corporation, 8260 Patuxent Range Road, Jessup, MD 20794, Phone: (301) 497-9080, Fax: (301) 497-9082, Email:
FCC Registered Microwave Towers: 11 (
See the full list of FCC Registered Microwave Towers in this town )
FCC Registered Maritime Coast & Aviation Ground Towers: 1 (
See the full list of FCC Registered Maritime Coast & Aviation Ground Towers )
FCC Registered Amateur Radio Licenses: 156 (
See the full list of FCC Registered Amateur Radio Licenses in Arnold )
FAA Registered Aircraft: 11 (
See the full list of FAA Registered Aircraft in Arnold )
Home Mortgage Disclosure Act Aggregated Statistics For Year 2009(Based on 4 full tracts) A) FHA, FSA/RHS & VA B) Conventional C) Refinancings D) Home Improvement Loans F) Non-occupant Loans on Number Average Value Number Average Value Number Average Value Number Average Value Number Average Value
LOANS ORIGINATED 148 $289,355 105 $355,648 1,033 $294,022 44 $175,223 33 $270,051 APPLICATIONS APPROVED, NOT ACCEPTED 6 $282,558 6 $615,667 83 $312,248 3 $186,090 4 $284,750 APPLICATIONS DENIED 6 $269,050 15 $423,934 228 $338,788 14 $137,784 12 $264,654 APPLICATIONS WITHDRAWN 12 $306,945 15 $501,751 232 $303,150 7 $179,081 8 $244,261 FILES CLOSED FOR INCOMPLETENESS 2 $234,000 4 $409,718 35 $269,665 3 $323,670 6 $273,037
Aggregated Statistics For Year 2008(Based on 4 full tracts) A) FHA, FSA/RHS & VA B) Conventional C) Refinancings D) Home Improvement Loans E) Loans on Dwellings For 5+ Families F) Non-occupant Loans on G) Loans On Manufactured Number Average Value Number Average Value Number Average Value Number Average Value Number Average Value Number Average Value Number Average Value
LOANS ORIGINATED 79 $297,380 169 $347,101 540 $275,492 57 $332,859 1 $4,200,000 46 $232,270 1 $24,020 APPLICATIONS APPROVED, NOT ACCEPTED 5 $292,200 7 $910,000 44 $255,715 12 $326,033 0 $0 5 $296,362 2 $111,000 APPLICATIONS DENIED 3 $273,333 20 $330,900 218 $299,929 27 $94,997 0 $0 11 $201,234 3 $28,273 APPLICATIONS WITHDRAWN 8 $294,375 23 $379,617 130 $274,338 12 $182,765 1 $401,700 9 $187,678 0 $0 FILES CLOSED FOR INCOMPLETENESS 2 $261,125 6 $361,897 16 $318,854 2 $417,950 0 $0 1 $217,000 0 $0
Aggregated Statistics For Year 2007(Based on 4 full tracts) A) FHA, FSA/RHS & VA B) Conventional C) Refinancings D) Home Improvement Loans E) Loans on Dwellings For 5+ Families F) Non-occupant Loans on G) Loans On Manufactured Number Average Value Number Average Value Number Average Value Number Average Value Number Average Value Number Average Value Number Average Value
LOANS ORIGINATED 23 $257,025 368 $303,376 632 $282,818 104 $157,697 0 $0 56 $295,980 2 $46,610 APPLICATIONS APPROVED, NOT ACCEPTED 0 $0 33 $270,047 81 $266,083 16 $107,057 0 $0 5 $300,486 1 $50,930 APPLICATIONS DENIED 0 $0 33 $439,737 215 $357,687 45 $116,562 0 $0 6 $459,000 1 $42,000 APPLICATIONS WITHDRAWN 4 $233,328 45 $320,265 153 $307,170 14 $172,879 0 $0 5 $340,396 0 $0 FILES CLOSED FOR INCOMPLETENESS 0 $0 9 $287,367 53 $307,439 4 $99,665 1 $500,000 5 $437,200 0 $0
Aggregated Statistics For Year 2006(Based on 4 full tracts) A) FHA, FSA/RHS & VA B) Conventional C) Refinancings D) Home Improvement Loans F) Non-occupant Loans on G) Loans On Manufactured Number Average Value Number Average Value Number Average Value Number Average Value Number Average Value Number Average Value
LOANS ORIGINATED 17 $287,095 554 $255,979 789 $276,090 136 $129,529 96 $209,919 2 $26,910 APPLICATIONS APPROVED, NOT ACCEPTED 1 $294,000 45 $249,517 100 $214,015 29 $91,832 9 $189,202 0 $0 APPLICATIONS DENIED 1 $222,000 46 $206,629 219 $314,052 39 $83,611 11 $244,454 1 $59,000 APPLICATIONS WITHDRAWN 3 $288,350 65 $271,410 212 $284,398 18 $53,046 13 $258,272 0 $0 FILES CLOSED FOR INCOMPLETENESS 1 $192,000 16 $168,197 46 $290,360 11 $73,225 6 $162,500 0 $0
Aggregated Statistics For Year 2005(Based on 4 full tracts) A) FHA, FSA/RHS & VA B) Conventional C) Refinancings D) Home Improvement Loans E) Loans on Dwellings For 5+ Families F) Non-occupant Loans on G) Loans On Manufactured Number Average Value Number Average Value Number Average Value Number Average Value Number Average Value Number Average Value Number Average Value
LOANS ORIGINATED 8 $245,396 707 $271,218 1,210 $255,323 138 $134,425 3 $164,000 149 $214,199 1 $93,000 APPLICATIONS APPROVED, NOT ACCEPTED 0 $0 45 $288,356 114 $264,629 21 $91,440 0 $0 10 $127,010 1 $50,000 APPLICATIONS DENIED 1 $371,000 74 $238,067 174 $263,208 44 $76,435 0 $0 14 $154,652 1 $68,000 APPLICATIONS WITHDRAWN 2 $228,720 80 $280,996 357 $236,179 24 $161,815 0 $0 14 $371,941 0 $0 FILES CLOSED FOR INCOMPLETENESS 0 $0 16 $282,957 62 $265,218 8 $117,316 0 $0 3 $247,000 0 $0
Aggregated Statistics For Year 2004(Based on 4 full tracts) A) FHA, FSA/RHS & VA B) Conventional C) Refinancings D) Home Improvement Loans F) Non-occupant Loans on G) Loans On Manufactured Number Average Value Number Average Value Number Average Value Number Average Value Number Average Value Number Average Value
LOANS ORIGINATED 36 $192,603 640 $235,725 1,262 $217,784 114 $106,111 126 $186,848 1 $47,000 APPLICATIONS APPROVED, NOT ACCEPTED 1 $158,000 43 $274,318 138 $185,160 27 $65,229 6 $214,457 0 $0 APPLICATIONS DENIED 1 $117,000 58 $198,445 237 $195,019 54 $49,039 20 $145,584 4 $30,948 APPLICATIONS WITHDRAWN 3 $173,333 59 $251,899 290 $207,313 25 $107,289 13 $182,669 1 $9,610 FILES CLOSED FOR INCOMPLETENESS 1 $176,820 15 $175,031 37 $194,598 8 $96,030 3 $91,000 0 $0
Aggregated Statistics For Year 2003(Based on 4 full tracts) A) FHA, FSA/RHS & VA B) Conventional C) Refinancings D) Home Improvement Loans E) Loans on Dwellings For 5+ Families F) Non-occupant Loans on Number Average Value Number Average Value Number Average Value Number Average Value Number Average Value Number Average Value
LOANS ORIGINATED 79 $182,091 553 $229,644 2,790 $192,953 84 $72,296 1 $9,800,000 147 $137,601 APPLICATIONS APPROVED, NOT ACCEPTED 5 $176,400 38 $185,948 242 $177,998 24 $37,070 0 $0 7 $111,286 APPLICATIONS DENIED 2 $225,835 40 $145,712 244 $153,948 26 $52,744 0 $0 22 $140,217 APPLICATIONS WITHDRAWN 10 $167,013 49 $207,638 409 $176,609 10 $53,271 0 $0 19 $138,554 FILES CLOSED FOR INCOMPLETENESS 1 $116,000 8 $209,290 67 $177,165 3 $31,667 0 $0 2 $149,000
Aggregated Statistics For Year 2002(Based on 4 full tracts) A) FHA, FSA/RHS & VA B) Conventional C) Refinancings D) Home Improvement Loans F) Non-occupant Loans on Number Average Value Number Average Value Number Average Value Number Average Value Number Average Value
LOANS ORIGINATED 146 $163,093 515 $200,347 1,894 $191,100 73 $52,277 92 $145,996 APPLICATIONS APPROVED, NOT ACCEPTED 5 $173,362 28 $196,544 157 $166,754 17 $57,989 8 $93,028 APPLICATIONS DENIED 8 $136,226 23 $158,697 201 $154,200 39 $22,149 10 $187,501 APPLICATIONS WITHDRAWN 7 $192,571 60 $255,804 281 $160,771 14 $41,233 7 $131,121 FILES CLOSED FOR INCOMPLETENESS 2 $224,500 9 $152,392 59 $189,186 3 $34,220 3 $101,510
Aggregated Statistics For Year 2001(Based on 4 full tracts) A) FHA, FSA/RHS & VA B) Conventional C) Refinancings D) Home Improvement Loans F) Non-occupant Loans on Number Average Value Number Average Value Number Average Value Number Average Value Number Average Value
LOANS ORIGINATED 175 $138,539 445 $181,937 1,294 $171,066 86 $32,609 67 $137,497 APPLICATIONS APPROVED, NOT ACCEPTED 5 $153,854 31 $119,284 128 $138,497 31 $29,730 3 $79,827 APPLICATIONS DENIED 5 $117,244 27 $124,969 235 $127,353 55 $24,530 4 $182,500 APPLICATIONS WITHDRAWN 16 $143,441 28 $177,557 216 $159,120 18 $45,588 5 $125,000 FILES CLOSED FOR INCOMPLETENESS 0 $0 8 $375,840 35 $215,165 3 $24,677 0 $0
Aggregated Statistics For Year 2000(Based on 4 full tracts) A) FHA, FSA/RHS & VA B) Conventional C) Refinancings D) Home Improvement Loans F) Non-occupant Loans on Number Average Value Number Average Value Number Average Value Number Average Value Number Average Value
LOANS ORIGINATED 178 $127,524 387 $168,781 231 $134,659 103 $26,130 35 $131,281 APPLICATIONS APPROVED, NOT ACCEPTED 4 $109,605 28 $131,027 44 $160,492 29 $26,717 5 $92,000 APPLICATIONS DENIED 13 $123,703 27 $140,486 150 $116,749 48 $23,976 5 $76,016 APPLICATIONS WITHDRAWN 15 $125,145 43 $165,354 76 $118,547 19 $47,809 2 $30,000 FILES CLOSED FOR INCOMPLETENESS 4 $114,262 3 $128,600 17 $112,706 2 $33,415 0 $0
Aggregated Statistics For Year 1999(Based on 4 full tracts) A) FHA, FSA/RHS & VA B) Conventional C) Refinancings D) Home Improvement Loans F) Non-occupant Loans on Number Average Value Number Average Value Number Average Value Number Average Value Number Average Value
LOANS ORIGINATED 229 $126,015 409 $194,024 675 $151,102 99 $28,325 37 $165,585 APPLICATIONS APPROVED, NOT ACCEPTED 4 $126,728 19 $122,852 110 $122,688 23 $34,971 2 $82,740 APPLICATIONS DENIED 7 $115,246 29 $159,946 166 $116,836 37 $26,959 4 $80,898 APPLICATIONS WITHDRAWN 25 $119,246 52 $185,206 136 $118,373 18 $54,557 8 $108,714 FILES CLOSED FOR INCOMPLETENESS 0 $0 8 $179,142 25 $125,326 1 $35,000 1 $128,000
Detailed HMDA statistics for the following Tracts:
7308.00
, 7311.01 , 7311.02 , 7311.03
Private Mortgage Insurance Companies Aggregated Statistics For Year 2009(Based on 3 full tracts) A) Conventional B) Refinancings Number Average Value Number Average Value
LOANS ORIGINATED 18 $325,258 10 $304,100 APPLICATIONS APPROVED, NOT ACCEPTED 3 $293,333 5 $345,122 APPLICATIONS DENIED 4 $393,902 1 $206,000 APPLICATIONS WITHDRAWN 2 $368,305 1 $322,000 FILES CLOSED FOR INCOMPLETENESS 0 $0 0 $0
Aggregated Statistics For Year 2008(Based on 4 full tracts) A) Conventional B) Refinancings C) Non-occupant Loans on Number Average Value Number Average Value Number Average Value
LOANS ORIGINATED 35 $322,010 28 $338,088 2 $288,545 APPLICATIONS APPROVED, NOT ACCEPTED 15 $270,356 14 $270,186 1 $194,000 APPLICATIONS DENIED 8 $297,231 4 $315,978 3 $262,667 APPLICATIONS WITHDRAWN 3 $413,393 0 $0 0 $0 FILES CLOSED FOR INCOMPLETENESS 1 $360,000 2 $259,500 0 $0
Aggregated Statistics For Year 2007(Based on 4 full tracts) A) Conventional B) Refinancings C) Non-occupant Loans on Number Average Value Number Average Value Number Average Value
LOANS ORIGINATED 55 $292,688 26 $326,618 0 $0 APPLICATIONS APPROVED, NOT ACCEPTED 12 $409,236 3 $385,903 0 $0 APPLICATIONS DENIED 1 $360,000 0 $0 0 $0 APPLICATIONS WITHDRAWN 3 $322,520 4 $510,882 1 $250,820 FILES CLOSED FOR INCOMPLETENESS 0 $0 0 $0 0 $0
Aggregated Statistics For Year 2006(Based on 4 full tracts) A) Conventional B) Refinancings C) Non-occupant Loans on Number Average Value Number Average Value Number Average Value
LOANS ORIGINATED 35 $330,527 20 $294,944 4 $241,718 APPLICATIONS APPROVED, NOT ACCEPTED 11 $349,126 4 $324,000 2 $200,000 APPLICATIONS DENIED 3 $309,057 0 $0 0 $0 APPLICATIONS WITHDRAWN 0 $0 0 $0 0 $0 FILES CLOSED FOR INCOMPLETENESS 0 $0 0 $0 0 $0
Aggregated Statistics For Year 2005(Based on 4 full tracts) A) Conventional B) Refinancings C) Non-occupant Loans on Number Average Value Number Average Value Number Average Value
LOANS ORIGINATED 20 $275,432 27 $248,782 4 $208,750 APPLICATIONS APPROVED, NOT ACCEPTED 7 $217,923 4 $266,758 1 $125,890 APPLICATIONS DENIED 1 $672,700 0 $0 0 $0 APPLICATIONS WITHDRAWN 1 $298,870 2 $239,695 0 $0 FILES CLOSED FOR INCOMPLETENESS 0 $0 0 $0 0 $0
Aggregated Statistics For Year 2004(Based on 4 full tracts) A) Conventional B) Refinancings C) Non-occupant Loans on Number Average Value Number Average Value Number Average Value
LOANS ORIGINATED 61 $254,125 36 $192,086 12 $185,492 APPLICATIONS APPROVED, NOT ACCEPTED 8 $250,766 8 $299,742 0 $0 APPLICATIONS DENIED 1 $140,000 4 $525,750 1 $140,000 APPLICATIONS WITHDRAWN 1 $191,000 2 $396,545 0 $0 FILES CLOSED FOR INCOMPLETENESS 0 $0 0 $0 0 $0
Aggregated Statistics For Year 2003(Based on 4 full tracts) A) Conventional B) Refinancings C) Non-occupant Loans on Number Average Value Number Average Value Number Average Value
LOANS ORIGINATED 81 $224,810 99 $174,964 10 $146,144 APPLICATIONS APPROVED, NOT ACCEPTED 15 $225,408 29 $170,929 3 $134,333 APPLICATIONS DENIED 1 $182,590 2 $231,765 0 $0 APPLICATIONS WITHDRAWN 6 $139,437 9 $191,659 0 $0 FILES CLOSED FOR INCOMPLETENESS 0 $0 0 $0 0 $0
Aggregated Statistics For Year 2002(Based on 4 full tracts) A) Conventional B) Refinancings C) Non-occupant Loans on Number Average Value Number Average Value Number Average Value
LOANS ORIGINATED 87 $185,947 101 $179,950 12 $137,865 APPLICATIONS APPROVED, NOT ACCEPTED 7 $144,993 27 $186,290 3 $100,667 APPLICATIONS DENIED 2 $329,000 1 $505,000 1 $170,000 APPLICATIONS WITHDRAWN 7 $135,714 9 $139,679 5 $144,800 FILES CLOSED FOR INCOMPLETENESS 0 $0 0 $0 0 $0
Aggregated Statistics For Year 2001(Based on 4 full tracts) A) Conventional B) Refinancings C) Non-occupant Loans on Number Average Value Number Average Value Number Average Value
LOANS ORIGINATED 69 $194,949 73 $173,916 7 $100,424 APPLICATIONS APPROVED, NOT ACCEPTED 0 $0 12 $166,921 0 $0 APPLICATIONS DENIED 1 $96,100 5 $125,732 0 $0 APPLICATIONS WITHDRAWN 2 $169,135 1 $149,000 0 $0 FILES CLOSED FOR INCOMPLETENESS 0 $0 3 $160,607 0 $0
Aggregated Statistics For Year 2000(Based on 4 full tracts) A) Conventional B) Refinancings C) Non-occupant Loans on Number Average Value Number Average Value Number Average Value
LOANS ORIGINATED 68 $167,462 24 $171,244 5 $107,232 APPLICATIONS APPROVED, NOT ACCEPTED 12 $186,270 4 $226,035 1 $140,000 APPLICATIONS DENIED 1 $119,000 3 $186,667 0 $0 APPLICATIONS WITHDRAWN 3 $188,213 2 $116,595 0 $0 FILES CLOSED FOR INCOMPLETENESS 0 $0 0 $0 0 $0
Aggregated Statistics For Year 1999(Based on 4 full tracts) A) Conventional B) Refinancings C) Non-occupant Loans on Number Average Value Number Average Value Number Average Value
LOANS ORIGINATED 106 $180,536 70 $151,121 6 $133,577 APPLICATIONS APPROVED, NOT ACCEPTED 11 $223,599 12 $145,705 0 $0 APPLICATIONS DENIED 2 $262,575 2 $148,815 0 $0 APPLICATIONS WITHDRAWN 1 $102,310 4 $196,792 0 $0 FILES CLOSED FOR INCOMPLETENESS 4 $249,520 1 $141,700 0 $0
Detailed PMIC statistics for the following Tracts:
7308.00
, 7311.01 , 7311.02 , 7311.03
Most common first names in Arnold, MD among deceased individuals Name Count Lived (average)
John 83 74.8 years Mary 83 79.3 years William 73 74.1 years Robert 65 71.8 years Charles 63 73.8 years James 60 69.1 years Joseph 40 74.3 years Margaret 38 80.7 years Richard 37 71.7 years Dorothy 35 76.4 years
Most common last names in Arnold, MD among deceased individuals Last name Count Lived (average)
Smith 25 76.5 years Brown 20 72.4 years Jones 17 66.9 years Johnson 16 74.0 years Anderson 12 79.5 years Moore 12 76.3 years Miller 12 78.0 years Thompson 9 73.4 years Wright 9 84.2 years Martin 8 75.8 years
Arnold compared to Maryland state average:
Unemployed percentage significantly below state average. Black race population percentage significantly below state average. Median age above state average. Foreign-born population percentage below state average. Renting percentage below state average. Length of stay since moving in significantly above state average. Percentage of population with a bachelor's degree or higher above state average.
Top Patent Applicants
Francis J. Kub (46)
William F. Niland (17)
Mark Titus (14)
Jonathan M. Ross (12)
Michael Dewey (11)
James C. Barrow (10)
Frank M. Shannon (7)
Iain J. Attwater (5)
David A. Blank (5)
Richard J. Shanks (5)
Total of 217 patent applications in 2008-2024.
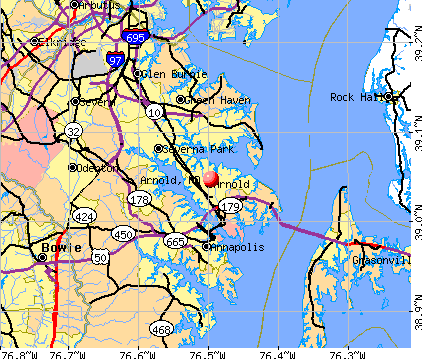


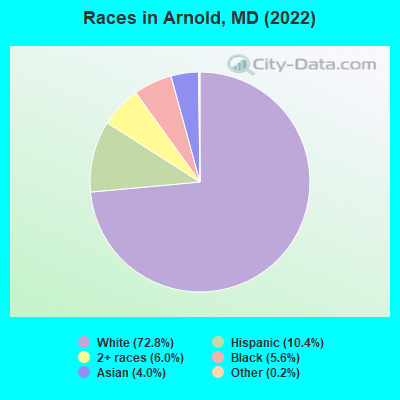
 Recent articles from our blog. Our writers, many of them Ph.D. graduates or candidates, create easy-to-read articles on a wide variety of topics.

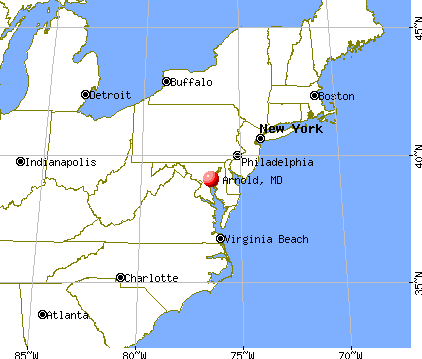
 , pop. 50,269).
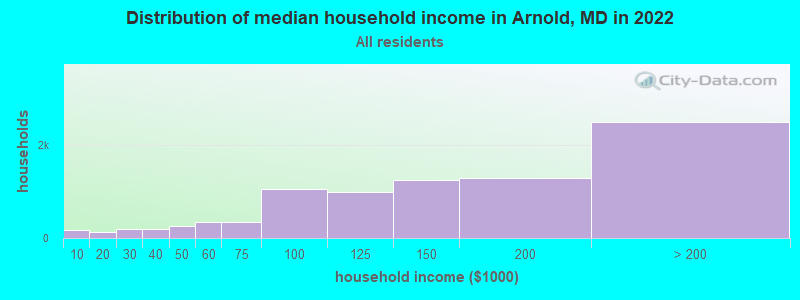
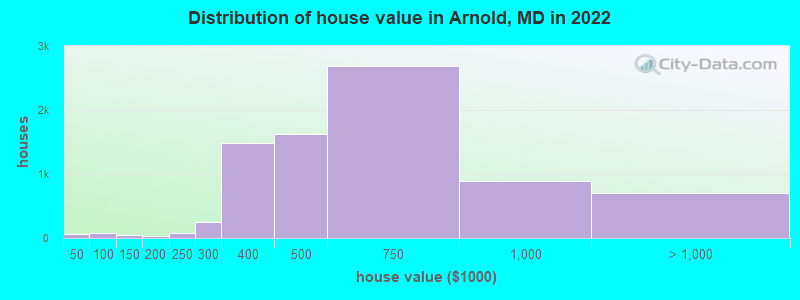
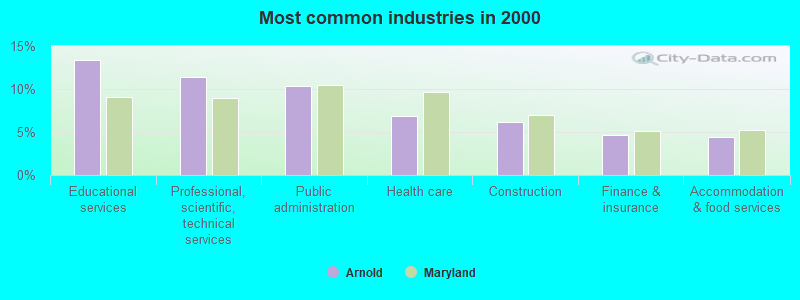
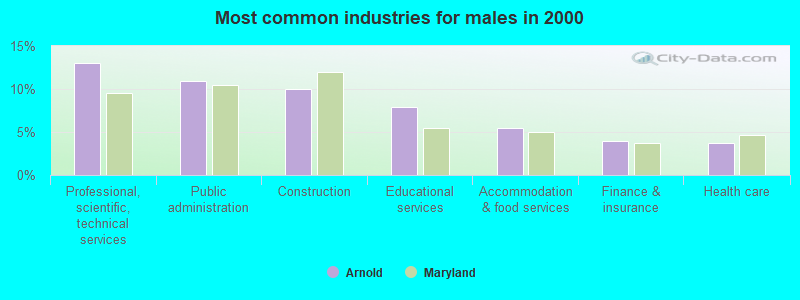
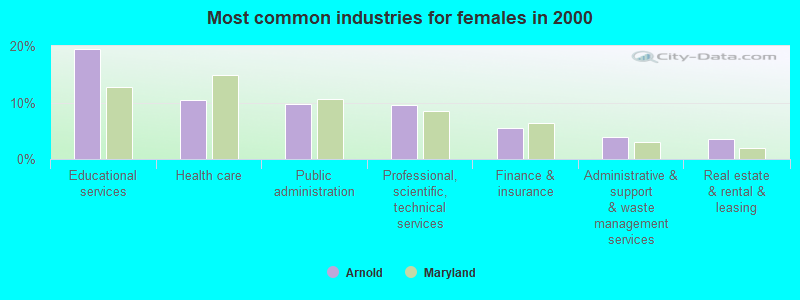
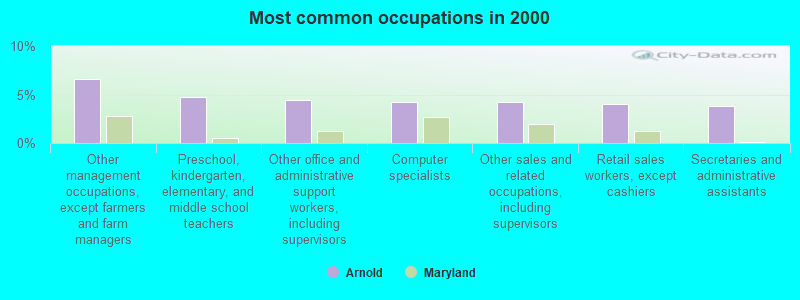
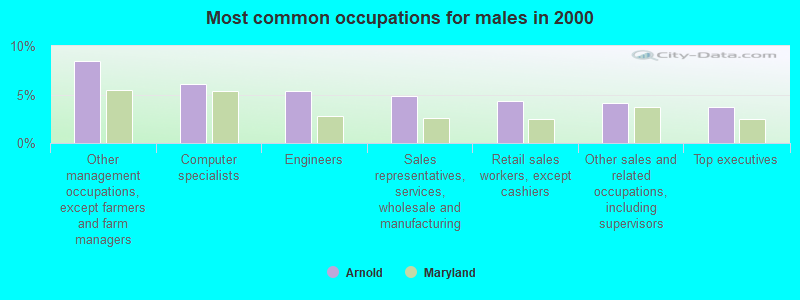
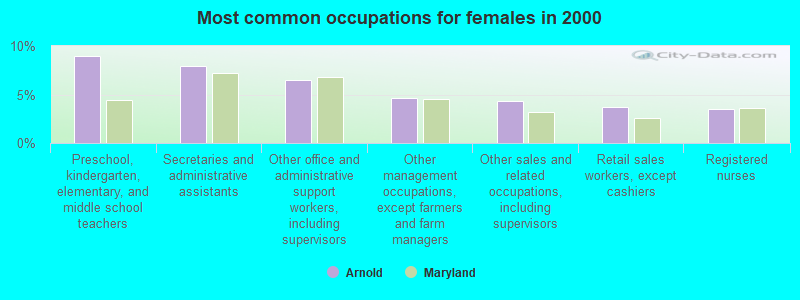


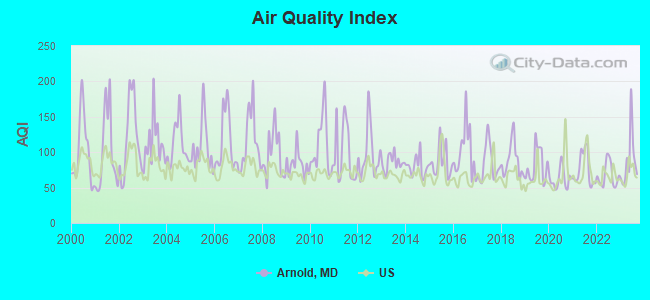
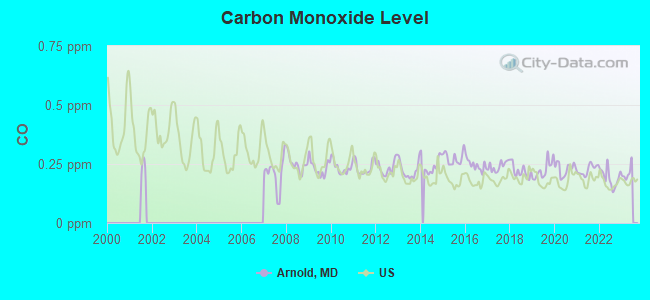
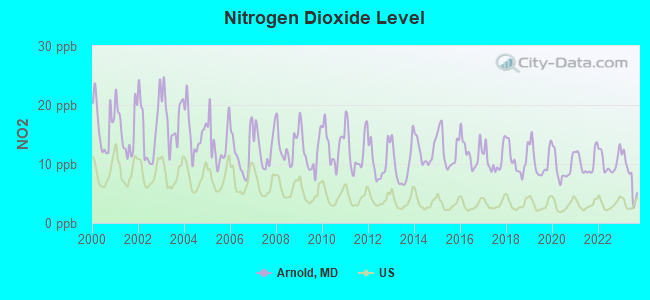
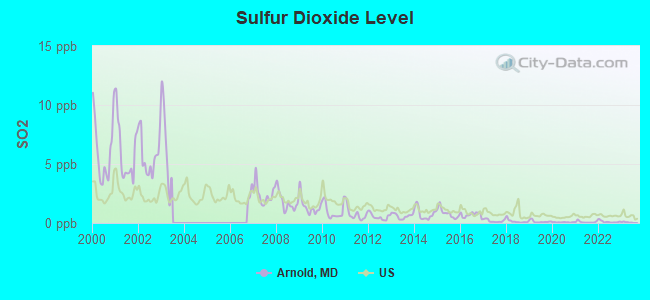
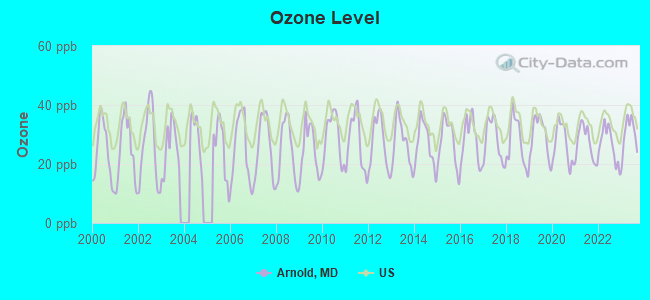
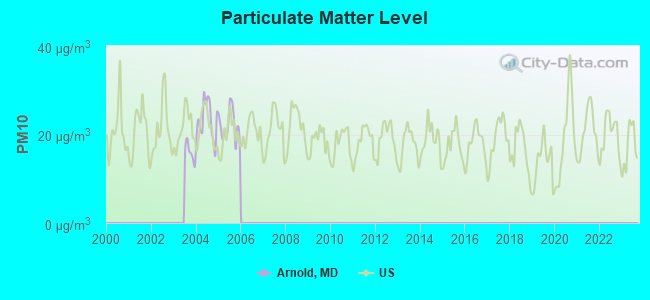
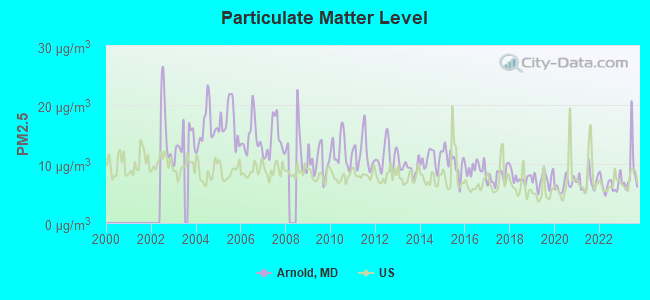
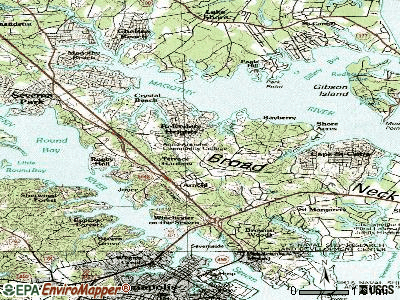
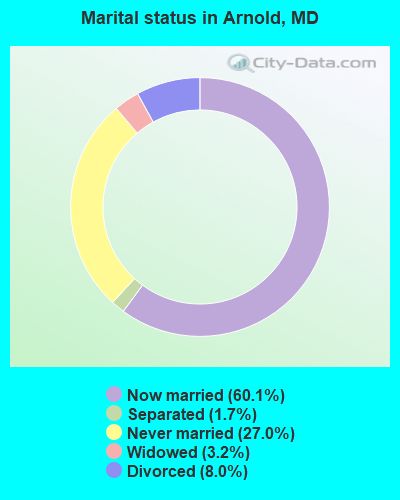

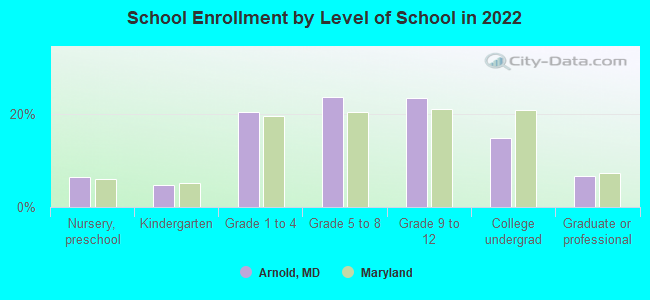
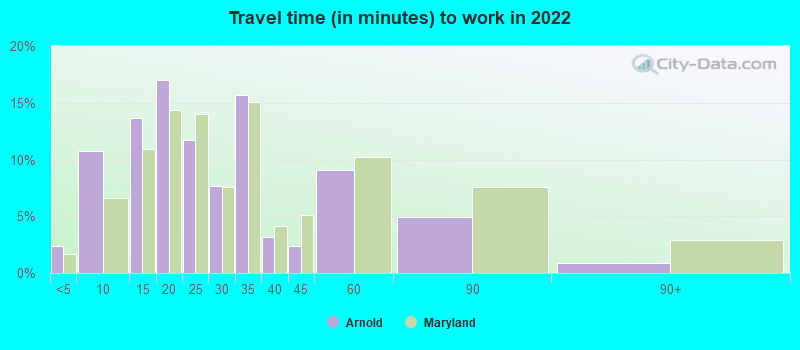
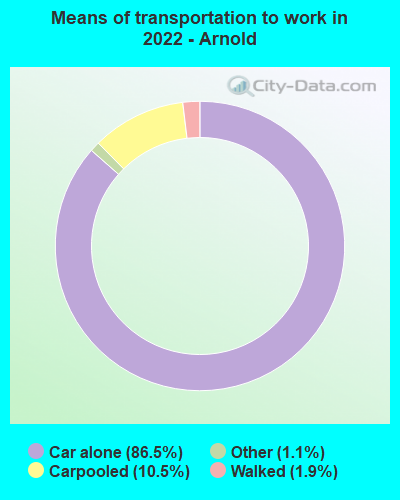
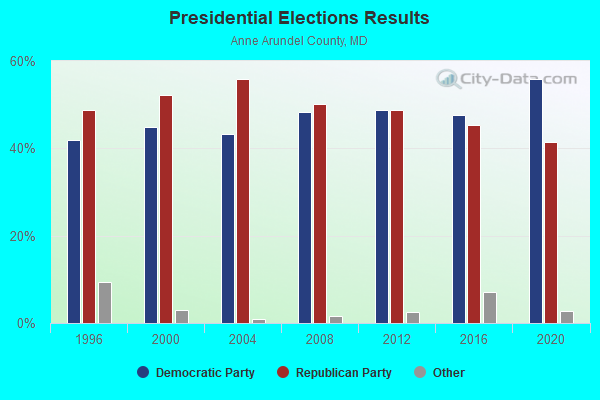
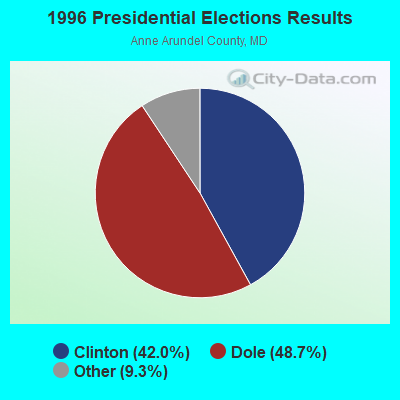
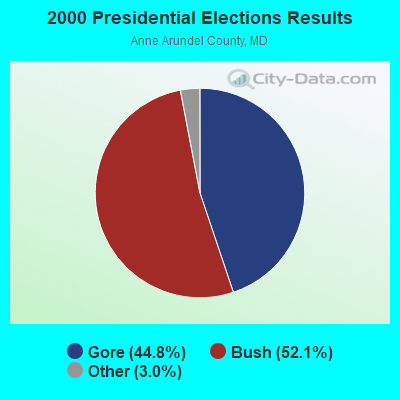
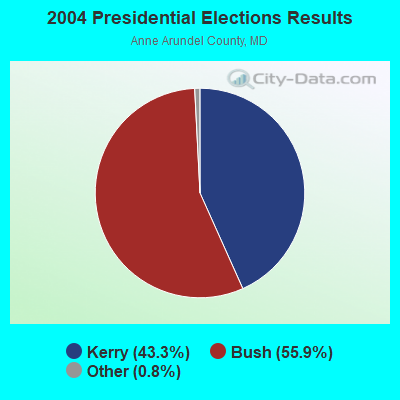
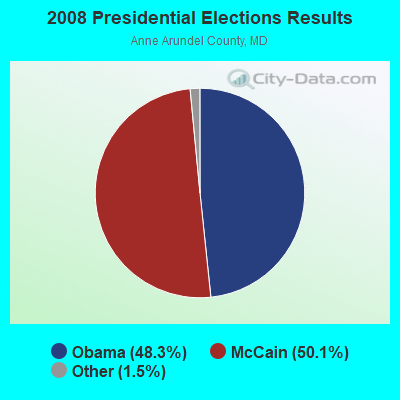
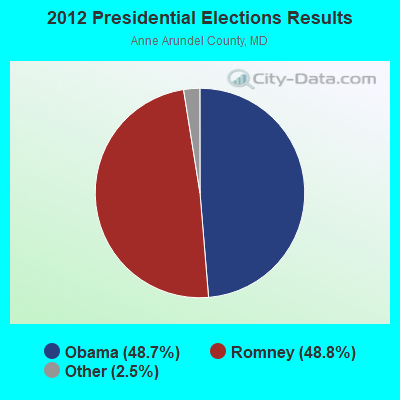
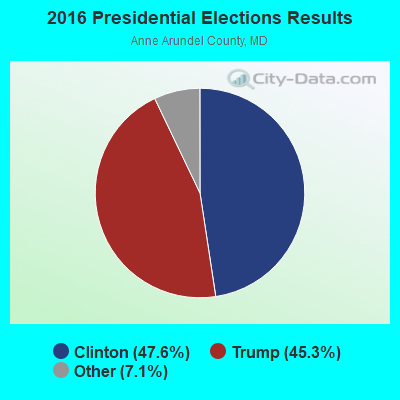
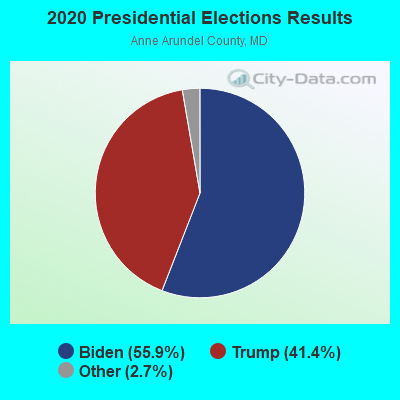
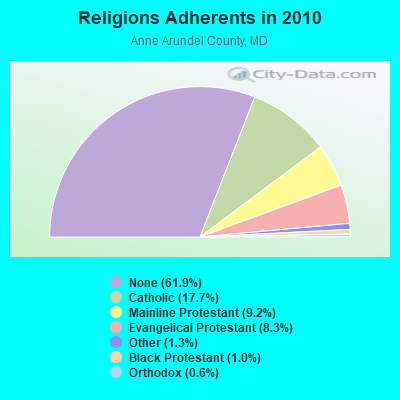
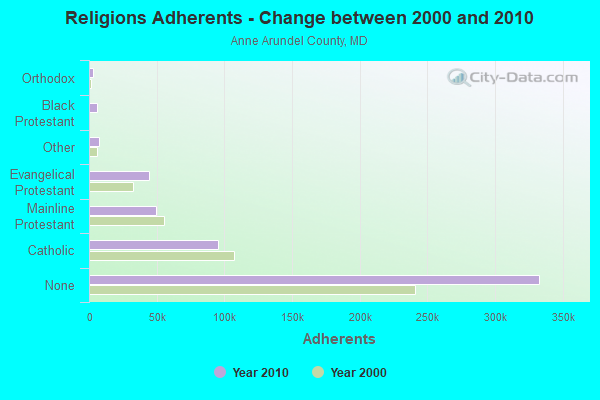
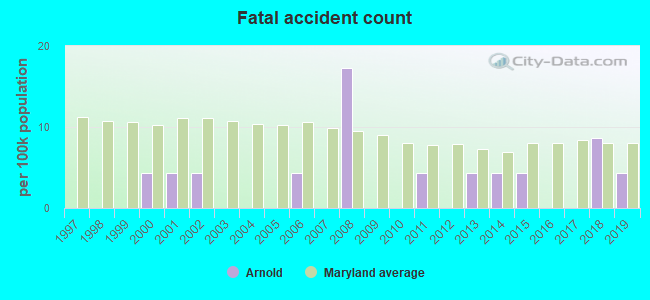
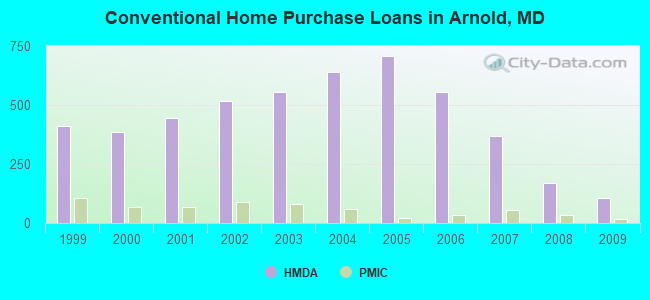
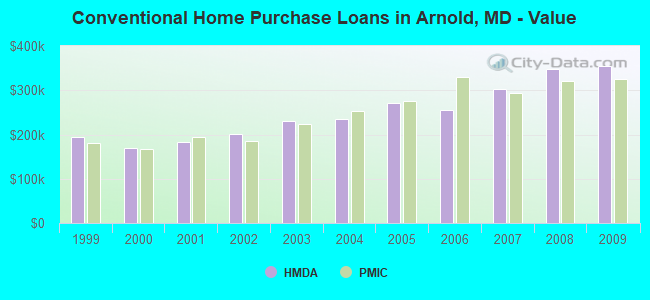
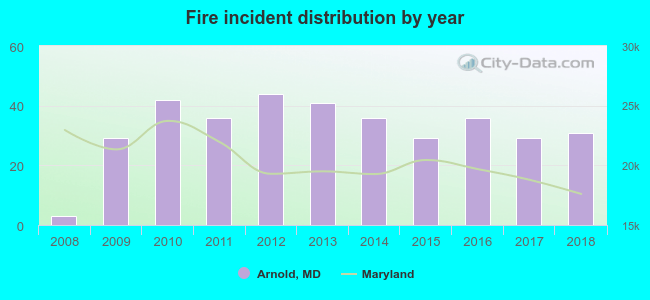 According to the data from the years 2008 - 2018 the average number of fires per year is 32. The highest number of reported fire incidents - 44 took place in 2012, and the least - 3 in 2008. The data has an increasing trend.
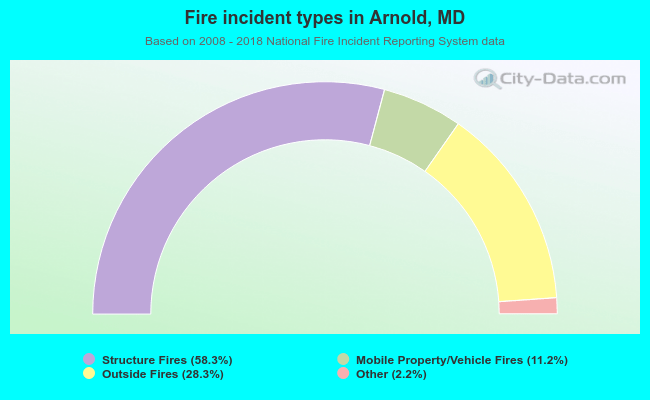 When looking into fire subcategories, the most reports belonged to: Structure Fires (58.3%), and Outside Fires (28.3%).