Belvedere Park, Georgia Submit your own pictures of this place and show them to the world
OSM Map
General Map
Google Map
MSN Map
OSM Map
General Map
Google Map
MSN Map
OSM Map
General Map
Google Map
MSN Map
OSM Map
General Map
Google Map
MSN Map
Please wait while loading the map...
Population in 2010: 15,152. Population change since 2000: -20.0%Males: 7,151 Females: 8,001
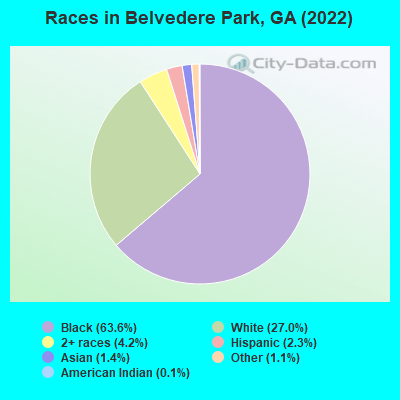
March 2022 cost of living index in Belvedere Park: 102.1 (near average, U.S. average is 100) Percentage of residents living in poverty in 2022: 14.7%for White Non-Hispanic residents , 17.3% for Black residents , 12.1% for Hispanic or Latino residents , 39.3% for American Indian residents , 6.6% for other race residents , 27.1% for two or more races residents )Business Search - 14 Million verified businesses
Data:
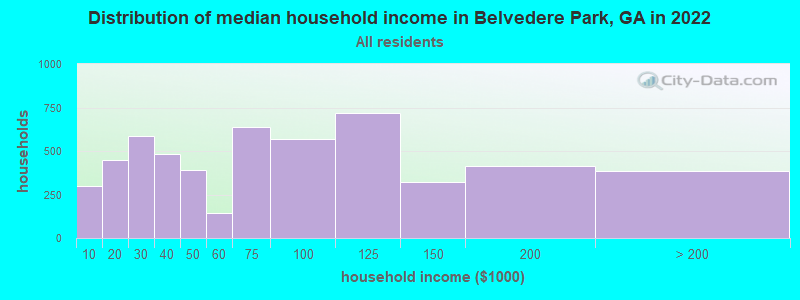
Median household income ($)
Median household income (% change since 2000)
Household income diversity
Ratio of average income to average house value (%)
Ratio of average income to average rent
Median household income ($) - White
Median household income ($) - Black or African American
Median household income ($) - Asian
Median household income ($) - Hispanic or Latino
Median household income ($) - American Indian and Alaska Native
Median household income ($) - Multirace
Median household income ($) - Other Race
Median household income for houses/condos with a mortgage ($)
Median household income for apartments without a mortgage ($)
Races - White alone (%)
Races - White alone (% change since 2000)
Races - Black alone (%)
Races - Black alone (% change since 2000)
Races - American Indian alone (%)
Races - American Indian alone (% change since 2000)
Races - Asian alone (%)
Races - Asian alone (% change since 2000)
Races - Hispanic (%)
Races - Hispanic (% change since 2000)
Races - Native Hawaiian and Other Pacific Islander alone (%)
Races - Native Hawaiian and Other Pacific Islander alone (% change since 2000)
Races - Two or more races (%)
Races - Two or more races (% change since 2000)
Races - Other race alone (%)
Races - Other race alone (% change since 2000)
Racial diversity
Unemployment (%)
Unemployment (% change since 2000)
Unemployment (%) - White
Unemployment (%) - Black or African American
Unemployment (%) - Asian
Unemployment (%) - Hispanic or Latino
Unemployment (%) - American Indian and Alaska Native
Unemployment (%) - Multirace
Unemployment (%) - Other Race
Population density (people per square mile)
Population - Males (%)
Population - Females (%)
Population - Males (%) - White
Population - Males (%) - Black or African American
Population - Males (%) - Asian
Population - Males (%) - Hispanic or Latino
Population - Males (%) - American Indian and Alaska Native
Population - Males (%) - Multirace
Population - Males (%) - Other Race
Population - Females (%) - White
Population - Females (%) - Black or African American
Population - Females (%) - Asian
Population - Females (%) - Hispanic or Latino
Population - Females (%) - American Indian and Alaska Native
Population - Females (%) - Multirace
Population - Females (%) - Other Race
Coronavirus confirmed cases (Apr 28, 2024)
Deaths caused by coronavirus (Apr 28, 2024)
Coronavirus confirmed cases (per 100k population) (Apr 28, 2024)
Deaths caused by coronavirus (per 100k population) (Apr 28, 2024)
Daily increase in number of cases (Apr 28, 2024)
Weekly increase in number of cases (Apr 28, 2024)
Cases doubled (in days) (Apr 28, 2024)
Hospitalized patients (Apr 18, 2022)
Negative test results (Apr 18, 2022)
Total test results (Apr 18, 2022)
COVID Vaccine doses distributed (per 100k population) (Sep 19, 2023)
COVID Vaccine doses administered (per 100k population) (Sep 19, 2023)
COVID Vaccine doses distributed (Sep 19, 2023)
COVID Vaccine doses administered (Sep 19, 2023)
Likely homosexual households (%)
Likely homosexual households (% change since 2000)
Likely homosexual households - Lesbian couples (%)
Likely homosexual households - Lesbian couples (% change since 2000)
Likely homosexual households - Gay men (%)
Likely homosexual households - Gay men (% change since 2000)
Cost of living index
Median gross rent ($)
Median contract rent ($)
Median monthly housing costs ($)
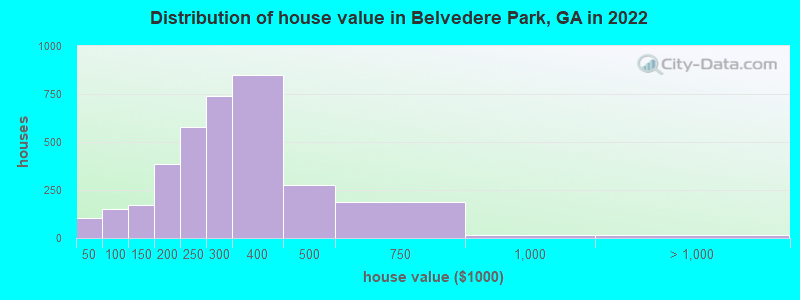
Median house or condo value ($)
Median house or condo value ($ change since 2000)
Mean house or condo value by units in structure - 1, detached ($)
Mean house or condo value by units in structure - 1, attached ($)
Mean house or condo value by units in structure - 2 ($)
Mean house or condo value by units in structure by units in structure - 3 or 4 ($)
Mean house or condo value by units in structure - 5 or more ($)
Mean house or condo value by units in structure - Boat, RV, van, etc. ($)
Mean house or condo value by units in structure - Mobile home ($)
Median house or condo value ($) - White
Median house or condo value ($) - Black or African American
Median house or condo value ($) - Asian
Median house or condo value ($) - Hispanic or Latino
Median house or condo value ($) - American Indian and Alaska Native
Median house or condo value ($) - Multirace
Median house or condo value ($) - Other Race
Median resident age
Resident age diversity
Median resident age - Males
Median resident age - Females
Median resident age - White
Median resident age - Black or African American
Median resident age - Asian
Median resident age - Hispanic or Latino
Median resident age - American Indian and Alaska Native
Median resident age - Multirace
Median resident age - Other Race
Median resident age - Males - White
Median resident age - Males - Black or African American
Median resident age - Males - Asian
Median resident age - Males - Hispanic or Latino
Median resident age - Males - American Indian and Alaska Native
Median resident age - Males - Multirace
Median resident age - Males - Other Race
Median resident age - Females - White
Median resident age - Females - Black or African American
Median resident age - Females - Asian
Median resident age - Females - Hispanic or Latino
Median resident age - Females - American Indian and Alaska Native
Median resident age - Females - Multirace
Median resident age - Females - Other Race
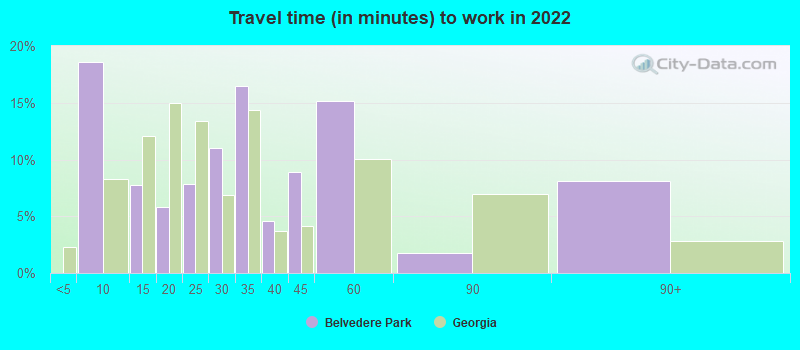
Commute - mean travel time to work (minutes)
Travel time to work - Less than 5 minutes (%)
Travel time to work - Less than 5 minutes (% change since 2000)
Travel time to work - 5 to 9 minutes (%)
Travel time to work - 5 to 9 minutes (% change since 2000)
Travel time to work - 10 to 19 minutes (%)
Travel time to work - 10 to 19 minutes (% change since 2000)
Travel time to work - 20 to 29 minutes (%)
Travel time to work - 20 to 29 minutes (% change since 2000)
Travel time to work - 30 to 39 minutes (%)
Travel time to work - 30 to 39 minutes (% change since 2000)
Travel time to work - 40 to 59 minutes (%)
Travel time to work - 40 to 59 minutes (% change since 2000)
Travel time to work - 60 to 89 minutes (%)
Travel time to work - 60 to 89 minutes (% change since 2000)
Travel time to work - 90 or more minutes (%)
Travel time to work - 90 or more minutes (% change since 2000)
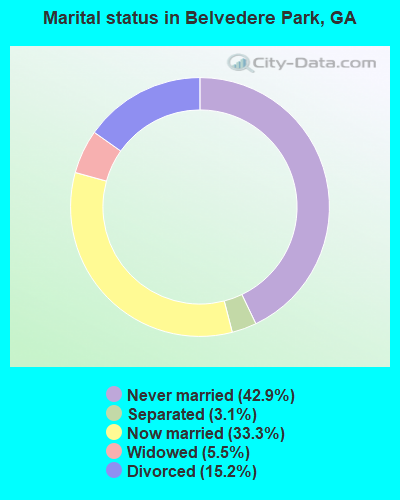
Marital status - Never married (%)
Marital status - Now married (%)
Marital status - Separated (%)
Marital status - Widowed (%)
Marital status - Divorced (%)
Median family income ($)
Median family income (% change since 2000)
Median non-family income ($)
Median non-family income (% change since 2000)
Median per capita income ($)
Median per capita income (% change since 2000)
Median family income ($) - White
Median family income ($) - Black or African American
Median family income ($) - Asian
Median family income ($) - Hispanic or Latino
Median family income ($) - American Indian and Alaska Native
Median family income ($) - Multirace
Median family income ($) - Other Race
Median year house/condo built
Median year apartment built
Year house built - Built 2005 or later (%)
Year house built - Built 2000 to 2004 (%)
Year house built - Built 1990 to 1999 (%)
Year house built - Built 1980 to 1989 (%)
Year house built - Built 1970 to 1979 (%)
Year house built - Built 1960 to 1969 (%)
Year house built - Built 1950 to 1959 (%)
Year house built - Built 1940 to 1949 (%)
Year house built - Built 1939 or earlier (%)
Average household size
Household density (households per square mile)
Average household size - White
Average household size - Black or African American
Average household size - Asian
Average household size - Hispanic or Latino
Average household size - American Indian and Alaska Native
Average household size - Multirace
Average household size - Other Race
Occupied housing units (%)
Vacant housing units (%)
Owner occupied housing units (%)
Renter occupied housing units (%)
Vacancy status - For rent (%)
Vacancy status - For sale only (%)
Vacancy status - Rented or sold, not occupied (%)
Vacancy status - For seasonal, recreational, or occasional use (%)
Vacancy status - For migrant workers (%)
Vacancy status - Other vacant (%)
Residents with income below the poverty level (%)
Residents with income below 50% of the poverty level (%)
Children below poverty level (%)
Poor families by family type - Married-couple family (%)
Poor families by family type - Male, no wife present (%)
Poor families by family type - Female, no husband present (%)
Poverty status for native-born residents (%)
Poverty status for foreign-born residents (%)
Poverty among high school graduates not in families (%)
Poverty among people who did not graduate high school not in families (%)
Residents with income below the poverty level (%) - White
Residents with income below the poverty level (%) - Black or African American
Residents with income below the poverty level (%) - Asian
Residents with income below the poverty level (%) - Hispanic or Latino
Residents with income below the poverty level (%) - American Indian and Alaska Native
Residents with income below the poverty level (%) - Multirace
Residents with income below the poverty level (%) - Other Race
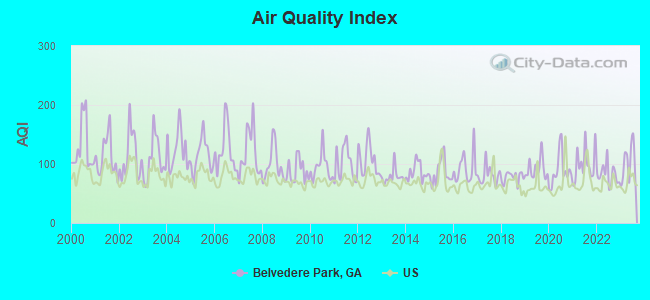
Air pollution - Air Quality Index (AQI)
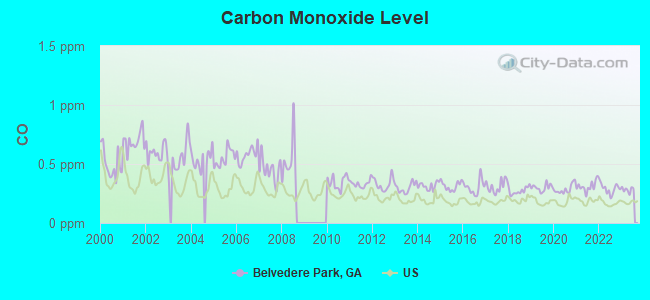
Air pollution - CO
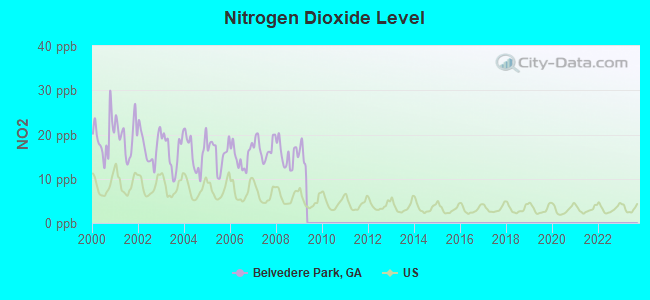
Air pollution - NO2
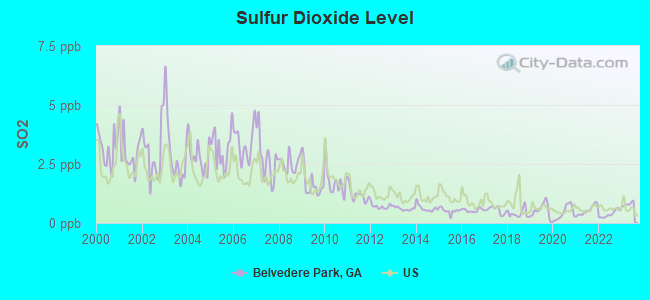
Air pollution - SO2
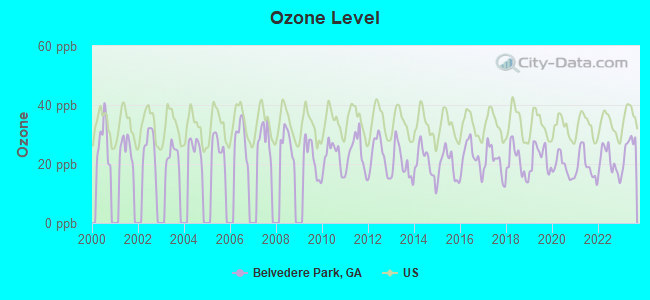
Air pollution - Ozone
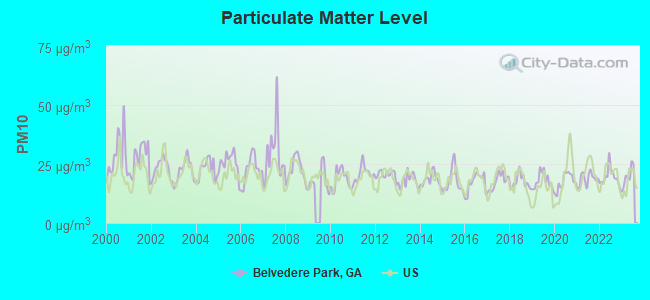
Air pollution - PM10
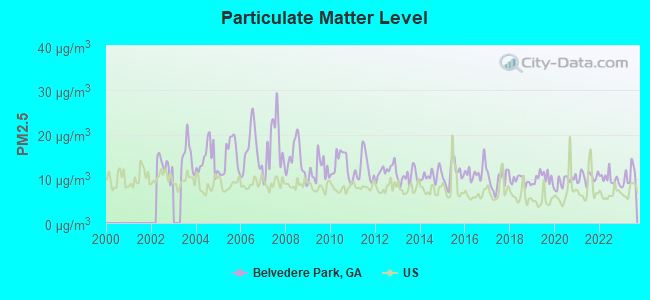
Air pollution - PM25
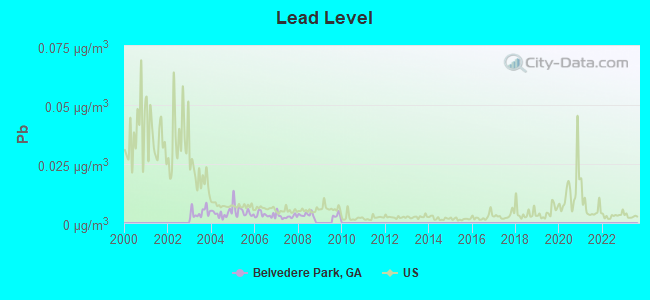
Air pollution - Pb
Crime - Murders per 100,000 population
Crime - Rapes per 100,000 population
Crime - Robberies per 100,000 population
Crime - Assaults per 100,000 population
Crime - Burglaries per 100,000 population
Crime - Thefts per 100,000 population
Crime - Auto thefts per 100,000 population
Crime - Arson per 100,000 population
Crime - City-data.com crime index
Crime - Violent crime index
Crime - Property crime index
Crime - Murders per 100,000 population (5 year average)
Crime - Rapes per 100,000 population (5 year average)
Crime - Robberies per 100,000 population (5 year average)
Crime - Assaults per 100,000 population (5 year average)
Crime - Burglaries per 100,000 population (5 year average)
Crime - Thefts per 100,000 population (5 year average)
Crime - Auto thefts per 100,000 population (5 year average)
Crime - Arson per 100,000 population (5 year average)
Crime - City-data.com crime index (5 year average)
Crime - Violent crime index (5 year average)
Crime - Property crime index (5 year average)
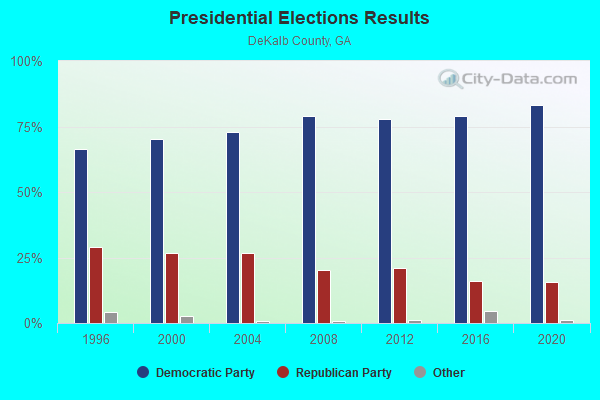
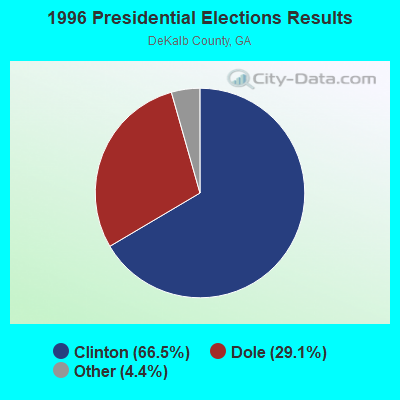
1996 Presidential Elections Results (%) - Democratic Party (Clinton)
1996 Presidential Elections Results (%) - Republican Party (Dole)
1996 Presidential Elections Results (%) - Other
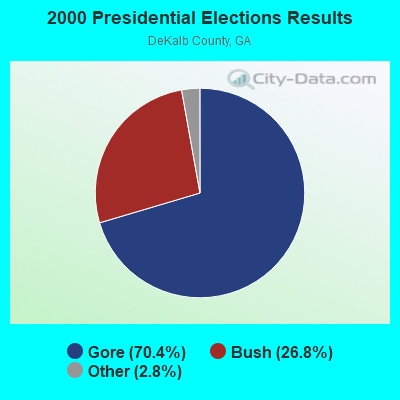
2000 Presidential Elections Results (%) - Democratic Party (Gore)
2000 Presidential Elections Results (%) - Republican Party (Bush)
2000 Presidential Elections Results (%) - Other
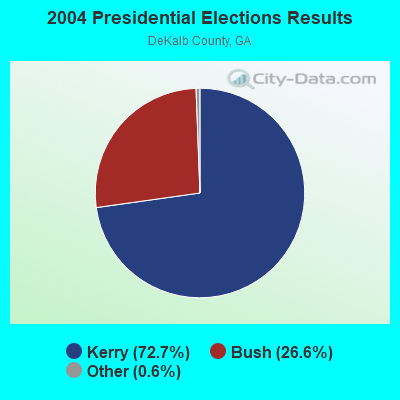
2004 Presidential Elections Results (%) - Democratic Party (Kerry)
2004 Presidential Elections Results (%) - Republican Party (Bush)
2004 Presidential Elections Results (%) - Other
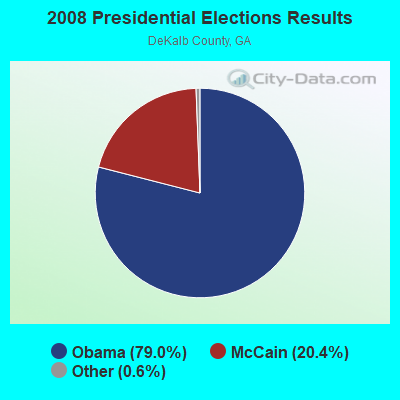
2008 Presidential Elections Results (%) - Democratic Party (Obama)
2008 Presidential Elections Results (%) - Republican Party (McCain)
2008 Presidential Elections Results (%) - Other
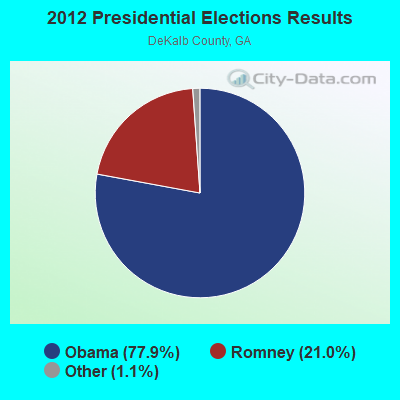
2012 Presidential Elections Results (%) - Democratic Party (Obama)
2012 Presidential Elections Results (%) - Republican Party (Romney)
2012 Presidential Elections Results (%) - Other
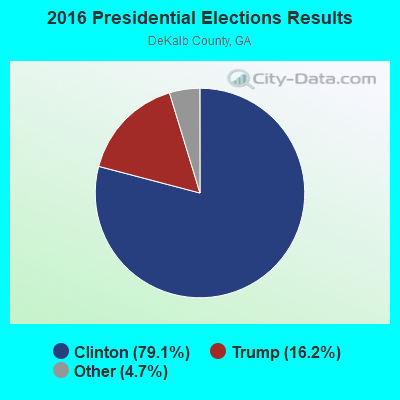
2016 Presidential Elections Results (%) - Democratic Party (Clinton)
2016 Presidential Elections Results (%) - Republican Party (Trump)
2016 Presidential Elections Results (%) - Other
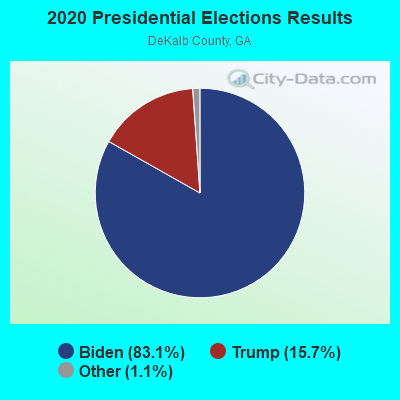
2020 Presidential Elections Results (%) - Democratic Party (Biden)
2020 Presidential Elections Results (%) - Republican Party (Trump)
2020 Presidential Elections Results (%) - Other
Ancestries Reported - Arab (%)
Ancestries Reported - Czech (%)
Ancestries Reported - Danish (%)
Ancestries Reported - Dutch (%)
Ancestries Reported - English (%)
Ancestries Reported - French (%)
Ancestries Reported - French Canadian (%)
Ancestries Reported - German (%)
Ancestries Reported - Greek (%)
Ancestries Reported - Hungarian (%)
Ancestries Reported - Irish (%)
Ancestries Reported - Italian (%)
Ancestries Reported - Lithuanian (%)
Ancestries Reported - Norwegian (%)
Ancestries Reported - Polish (%)
Ancestries Reported - Portuguese (%)
Ancestries Reported - Russian (%)
Ancestries Reported - Scotch-Irish (%)
Ancestries Reported - Scottish (%)
Ancestries Reported - Slovak (%)
Ancestries Reported - Subsaharan African (%)
Ancestries Reported - Swedish (%)
Ancestries Reported - Swiss (%)
Ancestries Reported - Ukrainian (%)
Ancestries Reported - United States (%)
Ancestries Reported - Welsh (%)
Ancestries Reported - West Indian (%)
Ancestries Reported - Other (%)
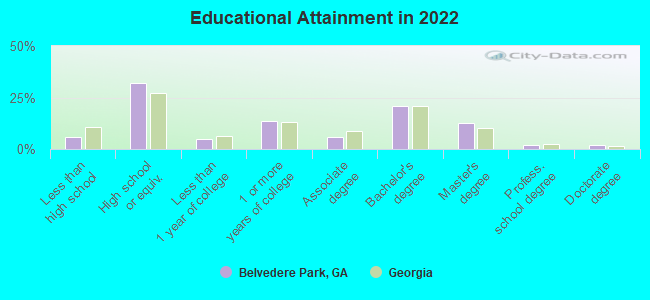
Educational Attainment - No schooling completed (%)
Educational Attainment - Less than high school (%)
Educational Attainment - High school or equivalent (%)
Educational Attainment - Less than 1 year of college (%)
Educational Attainment - 1 or more years of college (%)
Educational Attainment - Associate degree (%)
Educational Attainment - Bachelor's degree (%)
Educational Attainment - Master's degree (%)
Educational Attainment - Professional school degree (%)
Educational Attainment - Doctorate degree (%)
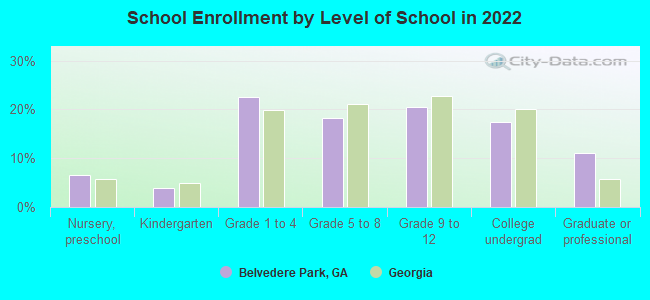
School Enrollment - Nursery, preschool (%)
School Enrollment - Kindergarten (%)
School Enrollment - Grade 1 to 4 (%)
School Enrollment - Grade 5 to 8 (%)
School Enrollment - Grade 9 to 12 (%)
School Enrollment - College undergrad (%)
School Enrollment - Graduate or professional (%)
School Enrollment - Not enrolled in school (%)
School enrollment - Public schools (%)
School enrollment - Private schools (%)
School enrollment - Not enrolled (%)
Median number of rooms in houses and condos
Median number of rooms in apartments
Housing units lacking complete plumbing facilities (%)
Housing units lacking complete kitchen facilities (%)
Density of houses
Urban houses (%)
Rural houses (%)
Households with people 60 years and over (%)
Households with people 65 years and over (%)
Households with people 75 years and over (%)
Households with one or more nonrelatives (%)
Households with no nonrelatives (%)
Population in households (%)
Family households (%)
Nonfamily households (%)
Population in families (%)
Family households with own children (%)
Median number of bedrooms in owner occupied houses
Mean number of bedrooms in owner occupied houses
Median number of bedrooms in renter occupied houses
Mean number of bedrooms in renter occupied houses
Median number of vehichles in owner occupied houses
Mean number of vehichles in owner occupied houses
Median number of vehichles in renter occupied houses
Mean number of vehichles in renter occupied houses
Mortgage status - with mortgage (%)
Mortgage status - with second mortgage (%)
Mortgage status - with home equity loan (%)
Mortgage status - with both second mortgage and home equity loan (%)
Mortgage status - without a mortgage (%)
Average family size
Average family size - White
Average family size - Black or African American
Average family size - Asian
Average family size - Hispanic or Latino
Average family size - American Indian and Alaska Native
Average family size - Multirace
Average family size - Other Race
Geographical mobility - Same house 1 year ago (%)
Geographical mobility - Moved within same county (%)
Geographical mobility - Moved from different county within same state (%)
Geographical mobility - Moved from different state (%)
Geographical mobility - Moved from abroad (%)
Place of birth - Born in state of residence (%)
Place of birth - Born in other state (%)
Place of birth - Native, outside of US (%)
Place of birth - Foreign born (%)
Housing units in structures - 1, detached (%)
Housing units in structures - 1, attached (%)
Housing units in structures - 2 (%)
Housing units in structures - 3 or 4 (%)
Housing units in structures - 5 to 9 (%)
Housing units in structures - 10 to 19 (%)
Housing units in structures - 20 to 49 (%)
Housing units in structures - 50 or more (%)
Housing units in structures - Mobile home (%)
Housing units in structures - Boat, RV, van, etc. (%)
House/condo owner moved in on average (years ago)
Renter moved in on average (years ago)
Year householder moved into unit - Moved in 1999 to March 2000 (%)
Year householder moved into unit - Moved in 1995 to 1998 (%)
Year householder moved into unit - Moved in 1990 to 1994 (%)
Year householder moved into unit - Moved in 1980 to 1989 (%)
Year householder moved into unit - Moved in 1970 to 1979 (%)
Year householder moved into unit - Moved in 1969 or earlier (%)
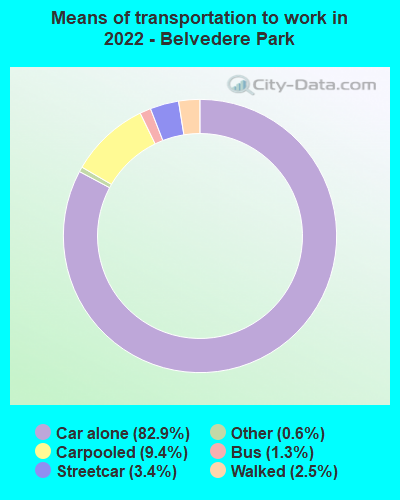
Means of transportation to work - Drove car alone (%)
Means of transportation to work - Carpooled (%)
Means of transportation to work - Public transportation (%)
Means of transportation to work - Bus or trolley bus (%)
Means of transportation to work - Streetcar or trolley car (%)
Means of transportation to work - Subway or elevated (%)
Means of transportation to work - Railroad (%)
Means of transportation to work - Ferryboat (%)
Means of transportation to work - Taxicab (%)
Means of transportation to work - Motorcycle (%)
Means of transportation to work - Bicycle (%)
Means of transportation to work - Walked (%)
Means of transportation to work - Other means (%)
Working at home (%)
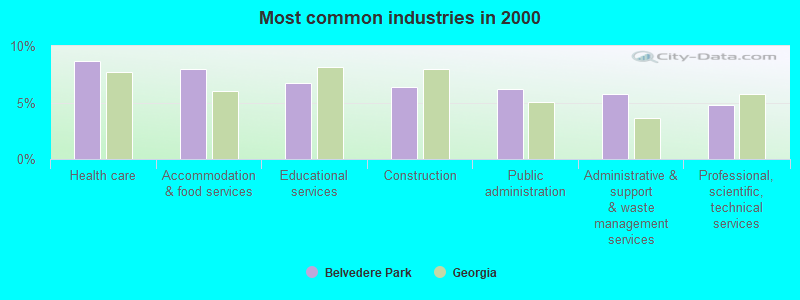
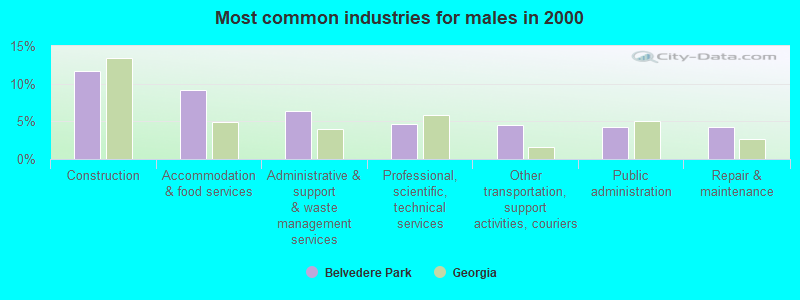
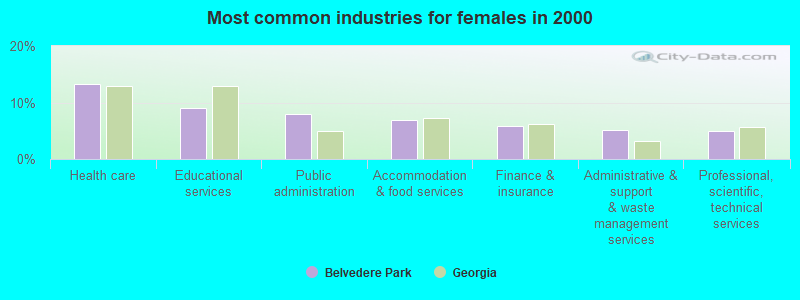
Industry diversity
Most Common Industries - Agriculture, forestry, fishing and hunting, and mining (%)
Most Common Industries - Agriculture, forestry, fishing and hunting (%)
Most Common Industries - Mining, quarrying, and oil and gas extraction (%)
Most Common Industries - Construction (%)
Most Common Industries - Manufacturing (%)
Most Common Industries - Wholesale trade (%)
Most Common Industries - Retail trade (%)
Most Common Industries - Transportation and warehousing, and utilities (%)
Most Common Industries - Transportation and warehousing (%)
Most Common Industries - Utilities (%)
Most Common Industries - Information (%)
Most Common Industries - Finance and insurance, and real estate and rental and leasing (%)
Most Common Industries - Finance and insurance (%)
Most Common Industries - Real estate and rental and leasing (%)
Most Common Industries - Professional, scientific, and management, and administrative and waste management services (%)
Most Common Industries - Professional, scientific, and technical services (%)
Most Common Industries - Management of companies and enterprises (%)
Most Common Industries - Administrative and support and waste management services (%)
Most Common Industries - Educational services, and health care and social assistance (%)
Most Common Industries - Educational services (%)
Most Common Industries - Health care and social assistance (%)
Most Common Industries - Arts, entertainment, and recreation, and accommodation and food services (%)
Most Common Industries - Arts, entertainment, and recreation (%)
Most Common Industries - Accommodation and food services (%)
Most Common Industries - Other services, except public administration (%)
Most Common Industries - Public administration (%)
Occupation diversity
Most Common Occupations - Management, business, science, and arts occupations (%)
Most Common Occupations - Management, business, and financial occupations (%)
Most Common Occupations - Management occupations (%)
Most Common Occupations - Business and financial operations occupations (%)
Most Common Occupations - Computer, engineering, and science occupations (%)
Most Common Occupations - Computer and mathematical occupations (%)
Most Common Occupations - Architecture and engineering occupations (%)
Most Common Occupations - Life, physical, and social science occupations (%)
Most Common Occupations - Education, legal, community service, arts, and media occupations (%)
Most Common Occupations - Community and social service occupations (%)
Most Common Occupations - Legal occupations (%)
Most Common Occupations - Education, training, and library occupations (%)
Most Common Occupations - Arts, design, entertainment, sports, and media occupations (%)
Most Common Occupations - Healthcare practitioners and technical occupations (%)
Most Common Occupations - Health diagnosing and treating practitioners and other technical occupations (%)
Most Common Occupations - Health technologists and technicians (%)
Most Common Occupations - Service occupations (%)
Most Common Occupations - Healthcare support occupations (%)
Most Common Occupations - Protective service occupations (%)
Most Common Occupations - Fire fighting and prevention, and other protective service workers including supervisors (%)
Most Common Occupations - Law enforcement workers including supervisors (%)
Most Common Occupations - Food preparation and serving related occupations (%)
Most Common Occupations - Building and grounds cleaning and maintenance occupations (%)
Most Common Occupations - Personal care and service occupations (%)
Most Common Occupations - Sales and office occupations (%)
Most Common Occupations - Sales and related occupations (%)
Most Common Occupations - Office and administrative support occupations (%)
Most Common Occupations - Natural resources, construction, and maintenance occupations (%)
Most Common Occupations - Farming, fishing, and forestry occupations (%)
Most Common Occupations - Construction and extraction occupations (%)
Most Common Occupations - Installation, maintenance, and repair occupations (%)
Most Common Occupations - Production, transportation, and material moving occupations (%)
Most Common Occupations - Production occupations (%)
Most Common Occupations - Transportation occupations (%)
Most Common Occupations - Material moving occupations (%)
People in Group quarters - Institutionalized population (%)
People in Group quarters - Correctional institutions (%)
People in Group quarters - Federal prisons and detention centers (%)
People in Group quarters - Halfway houses (%)
People in Group quarters - Local jails and other confinement facilities (including police lockups) (%)
People in Group quarters - Military disciplinary barracks (%)
People in Group quarters - State prisons (%)
People in Group quarters - Other types of correctional institutions (%)
People in Group quarters - Nursing homes (%)
People in Group quarters - Hospitals/wards, hospices, and schools for the handicapped (%)
People in Group quarters - Hospitals/wards and hospices for chronically ill (%)
People in Group quarters - Hospices or homes for chronically ill (%)
People in Group quarters - Military hospitals or wards for chronically ill (%)
People in Group quarters - Other hospitals or wards for chronically ill (%)
People in Group quarters - Hospitals or wards for drug/alcohol abuse (%)
People in Group quarters - Mental (Psychiatric) hospitals or wards (%)
People in Group quarters - Schools, hospitals, or wards for the mentally retarded (%)
People in Group quarters - Schools, hospitals, or wards for the physically handicapped (%)
People in Group quarters - Institutions for the deaf (%)
People in Group quarters - Institutions for the blind (%)
People in Group quarters - Orthopedic wards and institutions for the physically handicapped (%)
People in Group quarters - Wards in general hospitals for patients who have no usual home elsewhere (%)
People in Group quarters - Wards in military hospitals for patients who have no usual home elsewhere (%)
People in Group quarters - Juvenile institutions (%)
People in Group quarters - Long-term care (%)
People in Group quarters - Homes for abused, dependent, and neglected children (%)
People in Group quarters - Residential treatment centers for emotionally disturbed children (%)
People in Group quarters - Training schools for juvenile delinquents (%)
People in Group quarters - Short-term care, detention or diagnostic centers for delinquent children (%)
People in Group quarters - Type of juvenile institution unknown (%)
People in Group quarters - Noninstitutionalized population (%)
People in Group quarters - College dormitories (includes college quarters off campus) (%)
People in Group quarters - Military quarters (%)
People in Group quarters - On base (%)
People in Group quarters - Barracks, unaccompanied personnel housing (UPH), (Enlisted/Officer), ;and similar group living quarters for military personnel (%)
People in Group quarters - Transient quarters for temporary residents (%)
People in Group quarters - Military ships (%)
People in Group quarters - Group homes (%)
People in Group quarters - Homes or halfway houses for drug/alcohol abuse (%)
People in Group quarters - Homes for the mentally ill (%)
People in Group quarters - Homes for the mentally retarded (%)
People in Group quarters - Homes for the physically handicapped (%)
People in Group quarters - Other group homes (%)
People in Group quarters - Religious group quarters (%)
People in Group quarters - Dormitories (%)
People in Group quarters - Agriculture workers' dormitories on farms (%)
People in Group quarters - Job Corps and vocational training facilities (%)
People in Group quarters - Other workers' dormitories (%)
People in Group quarters - Crews of maritime vessels (%)
People in Group quarters - Other nonhousehold living situations (%)
People in Group quarters - Other noninstitutional group quarters (%)
Residents speaking English at home (%)
Residents speaking English at home - Born in the United States (%)
Residents speaking English at home - Native, born elsewhere (%)
Residents speaking English at home - Foreign born (%)
Residents speaking Spanish at home (%)
Residents speaking Spanish at home - Born in the United States (%)
Residents speaking Spanish at home - Native, born elsewhere (%)
Residents speaking Spanish at home - Foreign born (%)
Residents speaking other language at home (%)
Residents speaking other language at home - Born in the United States (%)
Residents speaking other language at home - Native, born elsewhere (%)
Residents speaking other language at home - Foreign born (%)
Class of Workers - Employee of private company (%)
Class of Workers - Self-employed in own incorporated business (%)
Class of Workers - Private not-for-profit wage and salary workers (%)
Class of Workers - Local government workers (%)
Class of Workers - State government workers (%)
Class of Workers - Federal government workers (%)
Class of Workers - Self-employed workers in own not incorporated business and Unpaid family workers (%)
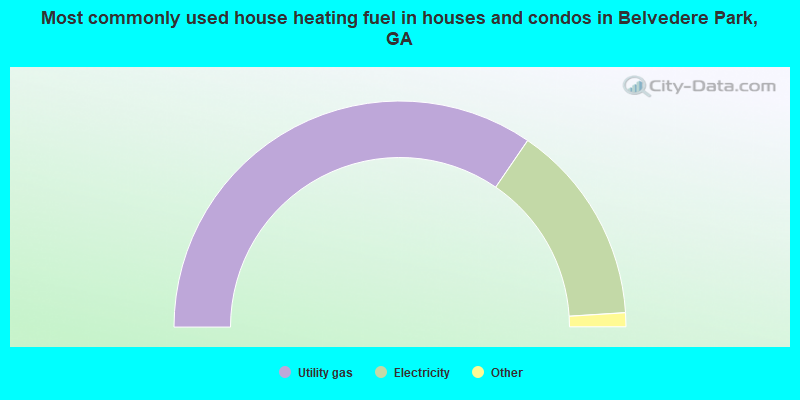
House heating fuel used in houses and condos - Utility gas (%)
House heating fuel used in houses and condos - Bottled, tank, or LP gas (%)
House heating fuel used in houses and condos - Electricity (%)
House heating fuel used in houses and condos - Fuel oil, kerosene, etc. (%)
House heating fuel used in houses and condos - Coal or coke (%)
House heating fuel used in houses and condos - Wood (%)
House heating fuel used in houses and condos - Solar energy (%)
House heating fuel used in houses and condos - Other fuel (%)
House heating fuel used in houses and condos - No fuel used (%)
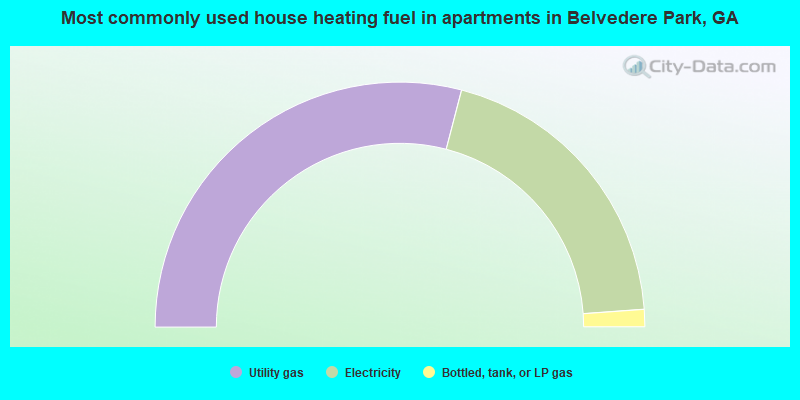
House heating fuel used in apartments - Utility gas (%)
House heating fuel used in apartments - Bottled, tank, or LP gas (%)
House heating fuel used in apartments - Electricity (%)
House heating fuel used in apartments - Fuel oil, kerosene, etc. (%)
House heating fuel used in apartments - Coal or coke (%)
House heating fuel used in apartments - Wood (%)
House heating fuel used in apartments - Solar energy (%)
House heating fuel used in apartments - Other fuel (%)
House heating fuel used in apartments - No fuel used (%)
Armed forces status - In Armed Forces (%)
Armed forces status - Civilian (%)
Armed forces status - Civilian - Veteran (%)
Armed forces status - Civilian - Nonveteran (%)
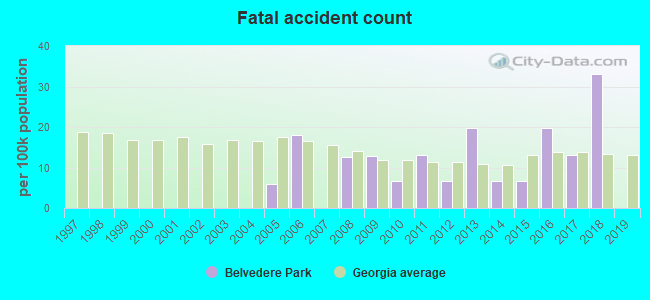
Fatal accidents locations in years 2005-2021
Fatal accidents locations in 2005
Fatal accidents locations in 2006
Fatal accidents locations in 2007
Fatal accidents locations in 2008
Fatal accidents locations in 2009
Fatal accidents locations in 2010
Fatal accidents locations in 2011
Fatal accidents locations in 2012
Fatal accidents locations in 2013
Fatal accidents locations in 2014
Fatal accidents locations in 2015
Fatal accidents locations in 2016
Fatal accidents locations in 2017
Fatal accidents locations in 2018
Fatal accidents locations in 2019
Fatal accidents locations in 2020
Fatal accidents locations in 2021
Alcohol use - People drinking some alcohol every month (%)
Alcohol use - People not drinking at all (%)
Alcohol use - Average days/month drinking alcohol
Alcohol use - Average drinks/week
Alcohol use - Average days/year people drink much
Audiometry - Average condition of hearing (%)
Audiometry - People that can hear a whisper from across a quiet room (%)
Audiometry - People that can hear normal voice from across a quiet room (%)
Audiometry - Ears ringing, roaring, buzzing (%)
Audiometry - Had a job exposure to loud noise (%)
Audiometry - Had off-work exposure to loud noise (%)
Blood Pressure & Cholesterol - Has high blood pressure (%)
Blood Pressure & Cholesterol - Checking blood pressure at home (%)
Blood Pressure & Cholesterol - Frequently checking blood cholesterol (%)
Blood Pressure & Cholesterol - Has high cholesterol level (%)
Consumer Behavior - Money monthly spent on food at supermarket/grocery store
Consumer Behavior - Money monthly spent on food at other stores
Consumer Behavior - Money monthly spent on eating out
Consumer Behavior - Money monthly spent on carryout/delivered foods
Consumer Behavior - Income spent on food at supermarket/grocery store (%)
Consumer Behavior - Income spent on food at other stores (%)
Consumer Behavior - Income spent on eating out (%)
Consumer Behavior - Income spent on carryout/delivered foods (%)
Current Health Status - General health condition (%)
Current Health Status - Blood donors (%)
Current Health Status - Has blood ever tested for HIV virus (%)
Current Health Status - Left-handed people (%)
Dermatology - People using sunscreen (%)
Diabetes - Diabetics (%)
Diabetes - Had a blood test for high blood sugar (%)
Diabetes - People taking insulin (%)
Diet Behavior & Nutrition - Diet health (%)
Diet Behavior & Nutrition - Milk product consumption (# of products/month)
Diet Behavior & Nutrition - Meals not home prepared (#/week)
Diet Behavior & Nutrition - Meals from fast food or pizza place (#/week)
Diet Behavior & Nutrition - Ready-to-eat foods (#/month)
Diet Behavior & Nutrition - Frozen meals/pizza (#/month)
Drug Use - People that ever used marijuana or hashish (%)
Drug Use - Ever used hard drugs (%)
Drug Use - Ever used any form of cocaine (%)
Drug Use - Ever used heroin (%)
Drug Use - Ever used methamphetamine (%)
Health Insurance - People covered by health insurance (%)
Kidney Conditions-Urology - Avg. # of times urinating at night
Medical Conditions - People with asthma (%)
Medical Conditions - People with anemia (%)
Medical Conditions - People with psoriasis (%)
Medical Conditions - People with overweight (%)
Medical Conditions - Elderly people having difficulties in thinking or remembering (%)
Medical Conditions - People who ever received blood transfusion (%)
Medical Conditions - People having trouble seeing even with glass/contacts (%)
Medical Conditions - People with arthritis (%)
Medical Conditions - People with gout (%)
Medical Conditions - People with congestive heart failure (%)
Medical Conditions - People with coronary heart disease (%)
Medical Conditions - People with angina pectoris (%)
Medical Conditions - People who ever had heart attack (%)
Medical Conditions - People who ever had stroke (%)
Medical Conditions - People with emphysema (%)
Medical Conditions - People with thyroid problem (%)
Medical Conditions - People with chronic bronchitis (%)
Medical Conditions - People with any liver condition (%)
Medical Conditions - People who ever had cancer or malignancy (%)
Mental Health - People who have little interest in doing things (%)
Mental Health - People feeling down, depressed, or hopeless (%)
Mental Health - People who have trouble sleeping or sleeping too much (%)
Mental Health - People feeling tired or having little energy (%)
Mental Health - People with poor appetite or overeating (%)
Mental Health - People feeling bad about themself (%)
Mental Health - People who have trouble concentrating on things (%)
Mental Health - People moving or speaking slowly or too fast (%)
Mental Health - People having thoughts they would be better off dead (%)
Oral Health - Average years since last visit a dentist
Oral Health - People embarrassed because of mouth (%)
Oral Health - People with gum disease (%)
Oral Health - General health of teeth and gums (%)
Oral Health - Average days a week using dental floss/device
Oral Health - Average days a week using mouthwash for dental problem
Oral Health - Average number of teeth
Pesticide Use - Households using pesticides to control insects (%)
Pesticide Use - Households using pesticides to kill weeds (%)
Physical Activity - People doing vigorous-intensity work activities (%)
Physical Activity - People doing moderate-intensity work activities (%)
Physical Activity - People walking or bicycling (%)
Physical Activity - People doing vigorous-intensity recreational activities (%)
Physical Activity - People doing moderate-intensity recreational activities (%)
Physical Activity - Average hours a day doing sedentary activities
Physical Activity - Average hours a day watching TV or videos
Physical Activity - Average hours a day using computer
Physical Functioning - People having limitations keeping them from working (%)
Physical Functioning - People limited in amount of work they can do (%)
Physical Functioning - People that need special equipment to walk (%)
Physical Functioning - People experiencing confusion/memory problems (%)
Physical Functioning - People requiring special healthcare equipment (%)
Prescription Medications - Average number of prescription medicines taking
Preventive Aspirin Use - Adults 40+ taking low-dose aspirin (%)
Reproductive Health - Vaginal deliveries (%)
Reproductive Health - Cesarean deliveries (%)
Reproductive Health - Deliveries resulted in a live birth (%)
Reproductive Health - Pregnancies resulted in a delivery (%)
Reproductive Health - Women breastfeeding newborns (%)
Reproductive Health - Women that had a hysterectomy (%)
Reproductive Health - Women that had both ovaries removed (%)
Reproductive Health - Women that have ever taken birth control pills (%)
Reproductive Health - Women taking birth control pills (%)
Reproductive Health - Women that have ever used Depo-Provera or injectables (%)
Reproductive Health - Women that have ever used female hormones (%)
Sexual Behavior - People 18+ that ever had sex (vaginal, anal, or oral) (%)
Sexual Behavior - Males 18+ that ever had vaginal sex with a woman (%)
Sexual Behavior - Males 18+ that ever performed oral sex on a woman (%)
Sexual Behavior - Males 18+ that ever had anal sex with a woman (%)
Sexual Behavior - Males 18+ that ever had any sex with a man (%)
Sexual Behavior - Females 18+ that ever had vaginal sex with a man (%)
Sexual Behavior - Females 18+ that ever performed oral sex on a man (%)
Sexual Behavior - Females 18+ that ever had anal sex with a man (%)
Sexual Behavior - Females 18+ that ever had any kind of sex with a woman (%)
Sexual Behavior - Average age people first had sex
Sexual Behavior - Average number of female sex partners in lifetime (males 18+)
Sexual Behavior - Average number of female vaginal sex partners in lifetime (males 18+)
Sexual Behavior - Average age people first performed oral sex on a woman (18+)
Sexual Behavior - Average number of woman performed oral sex on in lifetime (18+)
Sexual Behavior - Average number of male sex partners in lifetime (males 18+)
Sexual Behavior - Average number of male anal sex partners in lifetime (males 18+)
Sexual Behavior - Average age people first performed oral sex on a man (18+)
Sexual Behavior - Average number of male oral sex partners in lifetime (18+)
Sexual Behavior - People using protection when performing oral sex (%)
Sexual Behavior - Average number of times people have vaginal or anal sex a year
Sexual Behavior - People having sex without condom (%)
Sexual Behavior - Average number of male sex partners in lifetime (females 18+)
Sexual Behavior - Average number of male vaginal sex partners in lifetime (females 18+)
Sexual Behavior - Average number of female sex partners in lifetime (females 18+)
Sexual Behavior - Circumcised males 18+ (%)
Sleep Disorders - Average hours sleeping at night
Sleep Disorders - People that has trouble sleeping (%)
Smoking-Cigarette Use - People smoking cigarettes (%)
Taste & Smell - People 40+ having problems with smell (%)
Taste & Smell - People 40+ having problems with taste (%)
Taste & Smell - People 40+ that ever had wisdom teeth removed (%)
Taste & Smell - People 40+ that ever had tonsils teeth removed (%)
Taste & Smell - People 40+ that ever had a loss of consciousness because of a head injury (%)
Taste & Smell - People 40+ that ever had a broken nose or other serious injury to face or skull (%)
Taste & Smell - People 40+ that ever had two or more sinus infections (%)
Weight - Average height (inches)
Weight - Average weight (pounds)
Weight - Average BMI
Weight - People that are obese (%)
Weight - People that ever were obese (%)
Weight - People trying to lose weight (%)
Latest news from Belvedere Park, GA collected exclusively by city-data.com from local newspapers, TV, and radio stations
Ancestries: English (3.5%), African (2.6%), German (2.0%), Bahamian (1.7%), American (1.7%), European (1.5%).
Current Local Time:
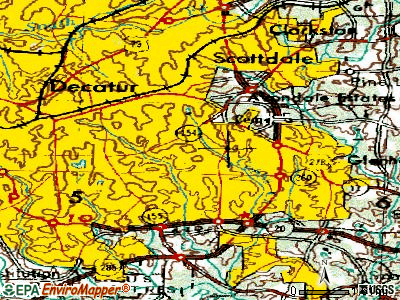
Land area: 4.98 square miles.
Population density: 3,041 people per square mile (average).
1,015 residents are foreign born (4.7% Latin America , 0.9% Africa ).
This place:
7.0%Georgia:
10.4%
Median real estate property taxes paid for housing units with mortgages in 2022: $2,679 (0.9%)Median real estate property taxes paid for housing units with no mortgage in 2022: $1,425 (0.7%)
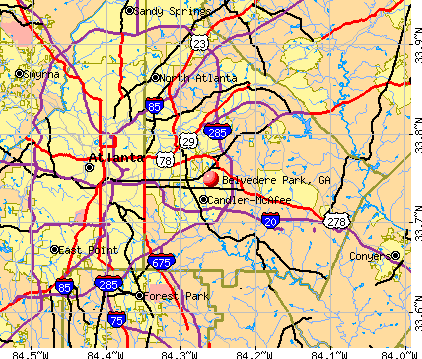
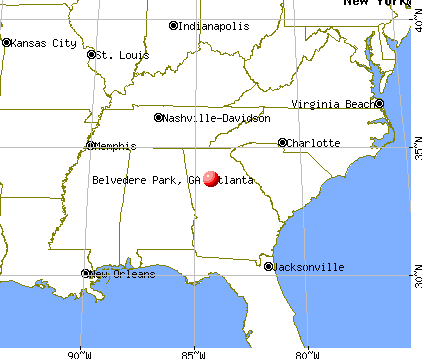
Nearest city with pop. 50,000+: Atlanta, GA
Nearest city with pop. 1,000,000+: Chicago, IL
Nearest cities:
Latitude: 33.75 N, Longitude: 84.26 W
Daytime population change due to commuting: -4,453 (-30.5%)Workers who live and work in this place: 1,806 (24.7%)
Property values in Belvedere Park, GA
Unemployment in December 2023:
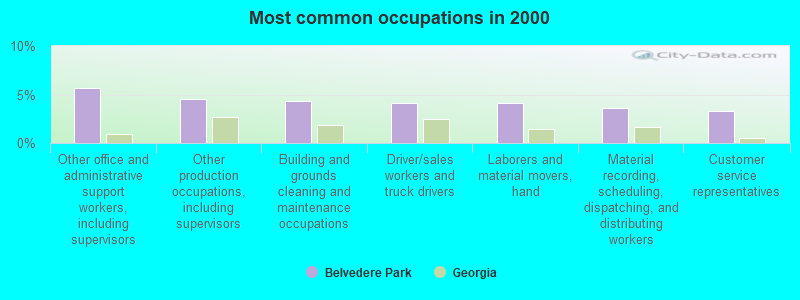
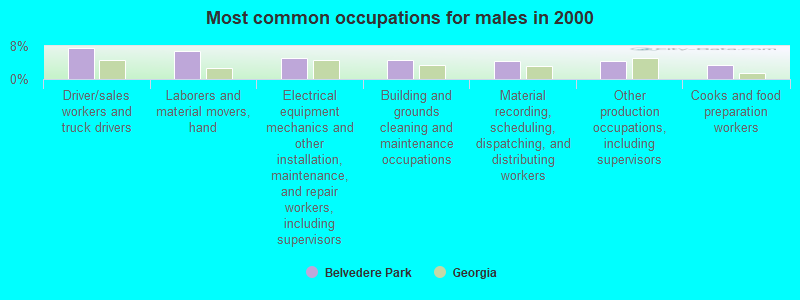
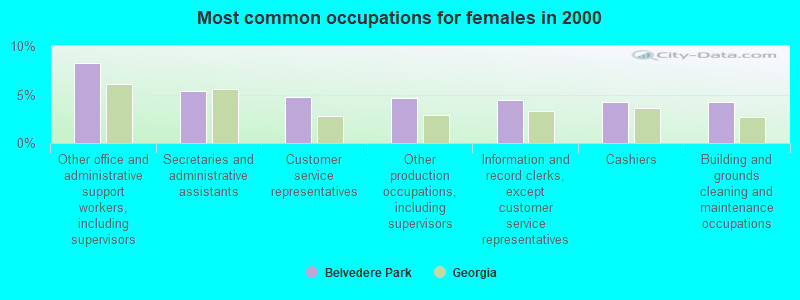
Most common occupations in Belvedere Park, GA (%)
Both Males Females
Other office and administrative support workers, including supervisors (5.7%)
Other production occupations, including supervisors (4.5%)
Building and grounds cleaning and maintenance occupations (4.3%)
Driver/sales workers and truck drivers (4.1%)
Laborers and material movers, hand (4.1%)
Material recording, scheduling, dispatching, and distributing workers (3.6%)
Customer service representatives (3.3%)
Driver/sales workers and truck drivers (7.6%)
Laborers and material movers, hand (6.8%)
Electrical equipment mechanics and other installation, maintenance, and repair workers, including supervisors (5.2%)
Building and grounds cleaning and maintenance occupations (4.5%)
Material recording, scheduling, dispatching, and distributing workers (4.4%)
Other production occupations, including supervisors (4.4%)
Cooks and food preparation workers (3.4%)
Other office and administrative support workers, including supervisors (8.2%)
Secretaries and administrative assistants (5.4%)
Customer service representatives (4.8%)
Other production occupations, including supervisors (4.7%)
Information and record clerks, except customer service representatives (4.4%)
Cashiers (4.3%)
Building and grounds cleaning and maintenance occupations (4.2%)
Tornado activity:
Belvedere Park-area historical tornado activity is slightly above Georgia state average. It is 53% greater than the overall U.S. average.
On 11/22/1992, a category F4 (max. wind speeds 207-260 mph) tornado 26.4 miles away from the Belvedere Park place center injured 46 people and caused between $5,000,000 and $50,000,000 in damages.
On 1/10/1972, a category F3 (max. wind speeds 158-206 mph) tornado 4.1 miles away from the place center killed one person and injured 9 people and caused between $50,000 and $500,000 in damages.
Earthquake activity:
Belvedere Park-area historical earthquake activity is significantly above Georgia state average. It is 49% greater than the overall U.S. average. On 4/29/2003 at 08:59:39, a magnitude 4.9 (4.4 MB, 4.6 MW, 4.9 LG, Class: Light, Intensity: IV - V) earthquake occurred 93.8 miles away from Belvedere Park center On 8/2/1974 at 08:52:09, a magnitude 4.9 (4.3 MB, 4.9 LG) earthquake occurred 102.2 miles away from the city center On 4/29/2003 at 08:59:39, a magnitude 4.6 (4.6 MW, Depth: 12.3 mi) earthquake occurred 93.9 miles away from the city center On 11/30/1973 at 07:48:41, a magnitude 4.7 (4.7 MB, 4.6 ML) earthquake occurred 142.8 miles away from Belvedere Park center On 1/18/1999 at 07:00:53, a magnitude 4.8 (4.8 MB, 4.0 LG, Depth: 0.6 mi) earthquake occurred 174.2 miles away from Belvedere Park center On 8/9/2020 at 12:07:37, a magnitude 5.1 (5.1 MW, Depth: 4.7 mi, Class: Moderate, Intensity: VI - VII) earthquake occurred 260.1 miles away from Belvedere Park center Magnitude types: regional Lg-wave magnitude (LG), body-wave magnitude (MB), local magnitude (ML), moment magnitude (MW) Natural disasters: The number of natural disasters in DeKalb County (12) is smaller than the US average (15).Major Disasters (Presidential) Declared: 7Emergencies Declared: 4Floods: 3, Hurricanes: 3, Storms: 3, Tornadoes: 3, Winter Storms: 3, Drought: 1, Snowfall: 1, Other: 1 (Note: some incidents may be assigned to more than one category). Hospitals and medical centers near Belvedere Park: GOLDEN LIVINGCENTER - GLENWOOD (Nursing Home, about 1 miles away; DECATUR, GA)
EASTLAKE DIALYSIS (Dialysis Facility, about 2 miles away; DECATUR, GA)
DECATUR DIALYSIS CENTER (Dialysis Facility, about 2 miles away; DECATUR, GA)
MCAFEE DIALYSIS (Dialysis Facility, about 2 miles away; DECATUR, GA)
DEKALB MEDICAL CENTER AT DECATUR (Hospital, about 3 miles away; DECATUR, GA)
EMORY DIALYSIS LLC (Dialysis Facility, about 3 miles away; DECATUR, GA)
EAST DEKALB DIALYSIS (Dialysis Facility, about 3 miles away; DECATUR, GA)
Amtrak station near Belvedere Park: 9 miles: ATLANTA (1688 PEACHTREE ST. NW) Services: ticket office, partially wheelchair accessible, enclosed waiting area, public restrooms, public payphones, vending machines, paid short-term parking, paid long-term parking, taxi stand, public transit connection.
Colleges/universities with over 2000 students nearest to Belvedere Park:
DeVry University-Georgia (about 3 miles; Decatur, GA ; Full-time enrollment: 4,157)
Georgia Piedmont Technical College (about 4 miles; Clarkston, GA ; FT enrollment: 3,276)
Georgia Perimeter College (about 5 miles; Decatur, GA ; FT enrollment: 17,138)
Emory University (about 6 miles; Atlanta, GA ; FT enrollment: 14,382)
Georgia State University (about 8 miles; Atlanta, GA ; FT enrollment: 30,264)
Georgia Institute of Technology-Main Campus (about 9 miles; Atlanta, GA ; FT enrollment: 24,183)
Spelman College (about 9 miles; Atlanta, GA ; FT enrollment: 2,383)
Notable location: (A) . Display/hide its location on the map
Shopping Centers: (1) , Columbia Village Shopping Center (2) , Columbia Shopping Center (3) , Belvedere South Shopping Center (4) , Belvedere Shopping Center (5) . Display/hide their locations on the map
Churches in Belvedere Park include: (A) , Glencoe Church (B) , Midway Church (C) . Display/hide their locations on the map
Creek: (A) . Display/hide its location on the map
Parks in Belvedere Park include: (1) , Meadowdale Park (2) , Midway Park (3) , Derril Park (4) , Belvedere Park (5) . Display/hide their locations on the map
DeKalb County has a predicted average indoor radon screening level greater than 4 pCi/L (pico curies per liter) - Highest Potential Average household size: This place:
2.6 peopleGeorgia:
2.6 people
Percentage of family households: This place:
60.6%Whole state:
68.5%
Percentage of households with unmarried partners: This place:
9.3%Whole state:
5.9%
Likely homosexual households (counted as self-reported same-sex unmarried-partner households)
Lesbian couples: 1.6% of all households Gay men: 1.0% of all households
People in group quarters in Belvedere Park in 2010:
25 people in group homes intended for adults
6 people in group homes for juveniles (non-correctional)
4 people in nursing facilities/skilled-nursing facilities
4 people in residential treatment centers for adults
2 people in other noninstitutional facilities
people in other noninstitutional group quarters in 2000For population 15 years and over in Belvedere Park:
Never married: 42.9%Now married: 33.3%Separated: 3.1%Widowed: 5.5%Divorced: 15.2% For population 25 years and over in Belvedere Park:
High school or higher: 94.0%Bachelor's degree or higher: 37.8%Graduate or professional degree: 16.0%Unemployed: 6.9%Mean travel time to work (commute): 26.4 minutes
Education Gini index (Inequality in education) Here:
10.6Georgia average:
12.2
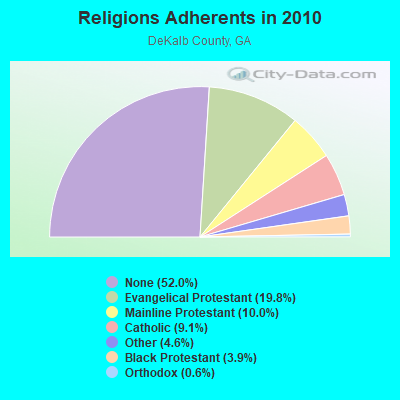
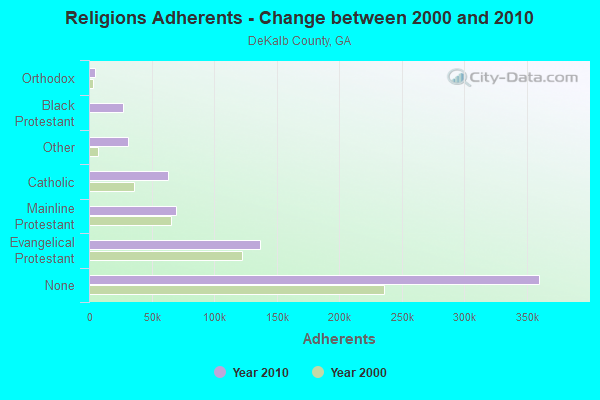
Religion statistics for Belvedere Park, GA (based on DeKalb County data)
Religion Adherents Congregations Evangelical Protestant 136,806 276 Mainline Protestant 69,164 104 Catholic 62,844 11 Other 31,499 63 Black Protestant 27,228 58 Orthodox 4,458 8 None 359,894 -
Source: Clifford Grammich, Kirk Hadaway, Richard Houseal, Dale E.Jones, Alexei Krindatch, Richie Stanley and Richard H.Taylor. 2012. 2010 U.S.Religion Census: Religious Congregations & Membership Study. Association of Statisticians of American Religious Bodies. Jones, Dale E., et al. 2002. Congregations and Membership in the United States 2000. Nashville, TN: Glenmary Research Center. Graphs represent county-level data
Food Environment Statistics: Number of grocery stores : 128Here :
1.75 / 10,000 pop.State :
1.91 / 10,000 pop.
Number of supercenters and club stores : 3This county :
0.04 / 10,000 pop.Georgia :
0.15 / 10,000 pop.
Number of convenience stores (no gas) : 60Here :
0.82 / 10,000 pop.Georgia :
0.86 / 10,000 pop.
Number of convenience stores (with gas) : 259Here :
3.53 / 10,000 pop.Georgia :
5.12 / 10,000 pop.
Number of full-service restaurants : 520Here :
7.09 / 10,000 pop.Georgia :
7.41 / 10,000 pop.
Low-income preschool obesity rate : DeKalb County :
15.5%State :
14.6%
Health and Nutrition: Healthy diet rate : Belvedere Park:
48.1%Georgia:
48.9%
Average overall health of teeth and gums : Belvedere Park:
46.0%Georgia:
46.5%
Average BMI : Belvedere Park:
30.1Georgia:
28.9
People feeling badly about themselves : Belvedere Park:
18.3%Georgia:
20.4%
People not drinking alcohol at all : This city:
13.3%Georgia:
10.8%
Average hours sleeping at night : Overweight people : Belvedere Park:
36.1%Georgia:
33.5%
General health condition : This city:
54.7%Georgia:
56.2%
Average condition of hearing : More about Health and Nutrition of Belvedere Park, GA Residents
11.63% of this county's 2021 resident taxpayers lived in other counties in 2020 ($62,119 average adjusted gross income )
Here:
11.63%Georgia average:
10.21%
0.02% of residents moved from foreign countries ($97 average AGI )DeKalb County:
0.02%Georgia average:
0.04%
Top counties from which taxpayers relocated into this county between 2020 and 2021:
12.30% of this county's 2020 resident taxpayers moved to other counties in 2021 ($66,119 average adjusted gross income )
Here:
12.30%Georgia average:
9.60%
0.01% of residents moved to foreign countries ($74 average AGI )DeKalb County:
0.01%Georgia average:
0.03%
Top counties to which taxpayers relocated from this county between 2020 and 2021: Strongest AM radio stations in Belvedere Park:
WGUN (1010 AM; 50 kW; ATLANTA, GA; Owner: WGUN, INC.)
WSB (750 AM; 50 kW; ATLANTA, GA; Owner: CXR HOLDINGS, INC.)
WQXI (790 AM; 28 kW; ATLANTA, GA; Owner: JEFFERSON-PILOT COMMUNICATIONS COMPANY OF GEORGIA)
WGST (640 AM; 50 kW; ATLANTA, GA; Owner: CITICASTERS LICENSES, L.P.)
WGKA (1190 AM; 25 kW; ATLANTA, GA; Owner: SALEM MEDIA OF GEORGIA, INC.)
WPBC (1310 AM; 2 kW; DECATUR, GA; Owner: PACIFIC STAR BROADCASTING, INC.)
WAEC (860 AM; 5 kW; ATLANTA, GA; Owner: WAEC LICENSE LIMITED PARTNERSHIP)
WCNN (680 AM; 50 kW; NORTH ATLANTA, GA; Owner: DICKEY BROADCASTING COMPANY)
WWWE (1100 AM; daytime; 5 kW; HAPEVILLE, GA; Owner: WAEC LICENSE LIMITED PARTNERSHP)
WAOK (1380 AM; 50 kW; ATLANTA, GA; Owner: INFINITY BROADCASTING OPERATIONS, INC.)
WAFS (920 AM; 5 kW; ATLANTA, GA; Owner: THE MOODY BIBLE INSTITUTE OF CHICAGO)
WNIV (970 AM; 5 kW; ATLANTA, GA; Owner: SALEM MEDIA OF GEORGIA, INC.)
WMLB (1160 AM; 50 kW; EAST POINT, GA; Owner: ATLANTA AREA BROADCASTING, INC.)
Strongest FM radio stations in Belvedere Park:
WZGC (92.9 FM; ATLANTA, GA; Owner: INFINITY BROADCASTING CORP. OF ATLANTA)
WSB-FM (98.5 FM; ATLANTA, GA; Owner: CXR HOLDINGS, INC.)
WSTR (94.1 FM; SMYRNA, GA; Owner: JEFFERSON-PILOT COMMUNICATIONS COMPANY OF GEORGIA)
WVEE (103.3 FM; ATLANTA, GA; Owner: INFINITY BROADCASTING OPERATIONS, INC.)
WKHX-FM (101.5 FM; MARIETTA, GA; Owner: ABC, INC.)
WKLS (96.1 FM; ATLANTA, GA; Owner: CITICASTERS LICENSES, L.P.)
WLTM (94.9 FM; ATLANTA, GA; Owner: CITICASTERS LICENSES, L.P.)
WWWQ (100.5 FM; ANNISTON, AL; Owner: WNNX LICO, INC.)
WNNX (99.7 FM; ATLANTA, GA; Owner: WNNX LICO, INC.)
WABE (90.1 FM; ATLANTA, GA; Owner: BOARD OF EDUCATION, CITY OF ATLANTA)
WRFG (89.3 FM; ATLANTA, GA; Owner: RADIO FREE GEORGIA BROADCASTING FOUNDATION INC)
WRAS (88.5 FM; ATLANTA, GA; Owner: GEORGIA STATE UNIVERSITY)
WREK (91.1 FM; ATLANTA, GA; Owner: RADIO COMMNS. BD, GEORGIA INST. TECH)
WCLK (91.9 FM; ATLANTA, GA; Owner: CLARK ATLANTA UNIVERSITY)
WFSH-FM (104.7 FM; ATHENS, GA; Owner: SOUTH TEXAS BROADCASTING, INC.)
WFOX (97.1 FM; GAINESVILLE, GA; Owner: COX RADIO, INC.)
WAMJ (102.5 FM; MABLETON, GA; Owner: NEW MABLETON BROADCASTING CORPORATION)
W221AZ (92.1 FM; LILBURN, GA; Owner: TOCCOA FALLS COLLEGE)
WYAY (106.7 FM; GAINESVILLE, GA; Owner: ABC, INC.)
WLCL (105.7 FM; CANTON, GA; Owner: CHEROKEE BROADCASTING CO., INC.)
TV broadcast stations around Belvedere Park:
WXIA-TV (Channel 11; ATLANTA, GA; Owner: GANNETT GEORGIA, L.P.)
WAGA (Channel 5; ATLANTA, GA; Owner: FOX TELEVISION STATIONS, INC.)
WUVG (Channel 34; ATHENS, GA; Owner: UNIVISION ATLANTA LLC)
WPBA (Channel 30; ATLANTA, GA; Owner: BOARD OF EDUCATION OF THE CITY OF ATLANTA)
WSB-TV (Channel 2; ATLANTA, GA; Owner: WSB-TV HOLDINGS, INC.)
WHSG (Channel 63; MONROE, GA; Owner: TRINITY BROADCASTING NETWORK)
WTBS (Channel 17; ATLANTA, GA; Owner: SUPERSTATION, INC.)
WUPA (Channel 69; ATLANTA, GA; Owner: VIACOM STATIONS GROUP OF ATLANTA INC.)
WATL (Channel 36; ATLANTA, GA; Owner: WATL, LLC)
WGCL-TV (Channel 46; ATLANTA, GA; Owner: MEREDITH CORPORATION)
WIRE-CA (Channel 40; ATLANTA, GA; Owner: COMMERCIAL BROADCASTING CORP.)
WANN-LP (Channel 32; ATLANTA, GA; Owner: PRISM BROADCASTING NETWORK, INC.)
WDTA-LP (Channel 53; FAYETTEVILLE, GA; Owner: WORD OF GOD FELLOWSHIP, INC.)
WTHC-LP (Channel 42; ATLANTA, GA; Owner: THE ATLANTA CHANNEL, INC.)
WANX-LP (Channel 26; ATLANTA, GA; Owner: PRISM BROADCASTING NETWORK, INC.)
W24AL (Channel 24; ATLANTA, GA; Owner: VENTANA TELEVISION, INC.)
WATC (Channel 57; ATLANTA, GA; Owner: COMMUNITY TELEVISION, INC.)
WGTV (Channel 8; ATHENS, GA; Owner: GEORGIA PUBLIC TELECOMMUNICATIONS COMMISSION)
WSKC-LP (Channel 59; ATLANTA, GA; Owner: KM LPTV OF ATLANTA, L.L.C.)
W04DB (Channel 4; ATLANTA, GA; Owner: VVILPTV, INC.)
W52CL (Channel 52; MACON, GA; Owner: TRINITY BROADCASTING NETWORK)
W38CU (Channel 38; ATLANTA, GA; Owner: KOREAN AMERICAN TV BROADCASTING CORP.)
National Bridge Inventory (NBI) Statistics 30 Number of bridges226ft / 68.9m Total length $18,162,000 Total costs1,448,038 Total average daily traffic16,121 Total average daily truck traffic
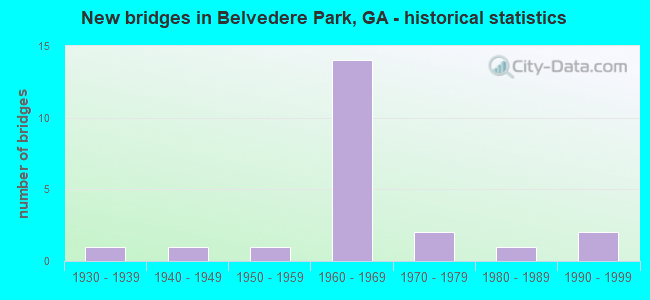
New bridges - historical statistics
1 1930-1939 1 1940-1949 1 1950-1959 14 1960-1969 2 1970-1979 1 1980-1989 2 1990-1999
See full National Bridge Inventory statistics for Belvedere Park, GA
FCC Registered Microwave Towers: 2
GA-ATL209B, 1277 Columbia Dr (Lat: 33.752389 Lon: -84.267000), Type: Mtower, Structure height: 59.4 m, Call Sign: WQIR753, Assigned Frequencies: 19375.0 MHz, 19475.0 MHz, 19375.0 MHz, 19375.0 MHz, 19375.0 MHz, 19375.0 MHz, 19375.0 MHz, 19375.0 MHz, 19475.0 MHz, 19475.0 MHz... (+4 more), Grant Date: 03/27/2018, Expiration Date: 04/24/2028, Cancellation Date: 09/08/2021, Certifier: Nadja Sodos-Wallace, Registrant: T-Mobile Usa, Inc., 12920 Se 38th Street, Bellevue, WA 98006, Phone: (425) 383-8401, Fax: (425) 383-4840, Email:
SCOTTDALE, 4037 Memorial Dr (Lat: 33.766389 Lon: -84.251944), Type: Mast, Structure height: 56.4 m, Overall height: 60.6 m, Call Sign: WQSA900, Assigned Frequencies: 11385.0 MHz, 11465.0 MHz, 11525.0 MHz, 11605.0 MHz, Grant Date: 08/23/2013, Expiration Date: 08/23/2023, Cancellation Date: 03/25/2014, Certifier: Steven A Regitz, Registrant: Verizon Wireless, 1120 Sanctuary Pkwy #150 Gasa5reg, Alpharetta, GA 30009-7630, Phone: (770) 797-1070, Fax: (770) 797-1036, Email:
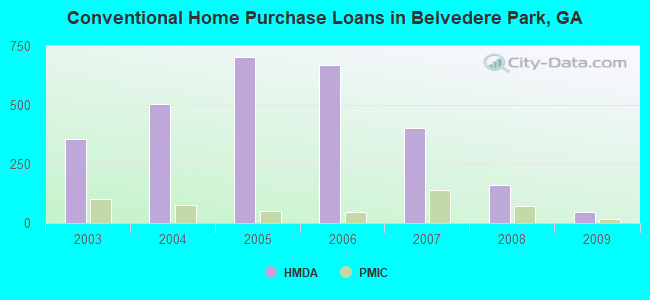
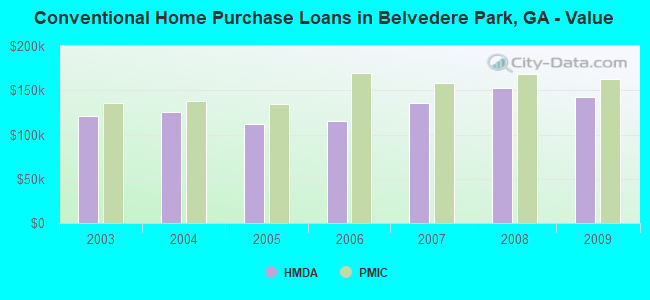
Home Mortgage Disclosure Act Aggregated Statistics For Year 2009(Based on 2 full and 3 partial tracts) A) FHA, FSA/RHS & VA B) Conventional C) Refinancings D) Home Improvement Loans E) Loans on Dwellings For 5+ Families F) Non-occupant Loans on G) Loans On Manufactured Number Average Value Number Average Value Number Average Value Number Average Value Number Average Value Number Average Value Number Average Value
LOANS ORIGINATED 70 $152,557 48 $142,368 212 $161,405 9 $46,464 2 $100,500 52 $94,042 0 $0 APPLICATIONS APPROVED, NOT ACCEPTED 5 $93,908 4 $91,175 26 $160,182 5 $18,834 0 $0 3 $24,567 0 $0 APPLICATIONS DENIED 12 $111,704 21 $94,124 119 $122,188 21 $29,602 0 $0 28 $74,764 0 $0 APPLICATIONS WITHDRAWN 14 $120,245 6 $57,978 89 $136,387 3 $101,380 0 $0 11 $87,308 0 $0 FILES CLOSED FOR INCOMPLETENESS 3 $147,533 3 $188,743 22 $142,565 1 $68,000 0 $0 1 $12,000 1 $154,000
Aggregated Statistics For Year 2008(Based on 2 full and 3 partial tracts) A) FHA, FSA/RHS & VA B) Conventional C) Refinancings D) Home Improvement Loans E) Loans on Dwellings For 5+ Families F) Non-occupant Loans on G) Loans On Manufactured Number Average Value Number Average Value Number Average Value Number Average Value Number Average Value Number Average Value Number Average Value
LOANS ORIGINATED 59 $160,318 159 $152,467 211 $142,910 20 $77,388 2 $2,100,000 141 $116,314 1 $50,050 APPLICATIONS APPROVED, NOT ACCEPTED 6 $166,512 16 $137,326 57 $132,845 7 $78,510 0 $0 24 $106,986 0 $0 APPLICATIONS DENIED 24 $130,373 50 $118,626 252 $122,959 51 $64,923 0 $0 99 $104,224 0 $0 APPLICATIONS WITHDRAWN 9 $162,366 29 $122,952 84 $150,888 6 $40,405 0 $0 32 $96,719 0 $0 FILES CLOSED FOR INCOMPLETENESS 2 $204,000 11 $142,456 26 $124,777 3 $109,607 0 $0 22 $120,625 0 $0
Aggregated Statistics For Year 2007(Based on 2 full and 3 partial tracts) A) FHA, FSA/RHS & VA B) Conventional C) Refinancings D) Home Improvement Loans E) Loans on Dwellings For 5+ Families F) Non-occupant Loans on Number Average Value Number Average Value Number Average Value Number Average Value Number Average Value Number Average Value
LOANS ORIGINATED 18 $161,432 403 $135,041 313 $133,970 43 $68,373 2 $3,081,915 223 $111,625 APPLICATIONS APPROVED, NOT ACCEPTED 2 $172,470 71 $125,806 87 $117,630 14 $59,976 0 $0 46 $109,542 APPLICATIONS DENIED 9 $127,344 289 $139,152 482 $123,206 97 $60,961 1 $1,600,000 243 $122,217 APPLICATIONS WITHDRAWN 4 $151,875 81 $153,449 192 $130,415 10 $87,472 1 $1,200,000 66 $119,992 FILES CLOSED FOR INCOMPLETENESS 0 $0 31 $133,342 40 $130,396 6 $57,062 0 $0 15 $120,324
Aggregated Statistics For Year 2006(Based on 2 full and 3 partial tracts) A) FHA, FSA/RHS & VA B) Conventional C) Refinancings D) Home Improvement Loans E) Loans on Dwellings For 5+ Families F) Non-occupant Loans on G) Loans On Manufactured Number Average Value Number Average Value Number Average Value Number Average Value Number Average Value Number Average Value Number Average Value
LOANS ORIGINATED 26 $158,822 670 $115,593 485 $113,736 61 $66,977 1 $2,237,670 390 $103,128 0 $0 APPLICATIONS APPROVED, NOT ACCEPTED 1 $122,000 140 $107,955 129 $112,373 15 $51,251 0 $0 76 $114,766 0 $0 APPLICATIONS DENIED 4 $122,625 406 $113,327 447 $124,427 89 $63,821 0 $0 252 $117,985 1 $23,840 APPLICATIONS WITHDRAWN 1 $209,000 188 $109,745 228 $117,544 20 $81,654 0 $0 98 $94,126 1 $125,000 FILES CLOSED FOR INCOMPLETENESS 1 $242,000 52 $110,630 69 $119,449 3 $94,347 0 $0 24 $107,627 0 $0
Aggregated Statistics For Year 2005(Based on 2 full and 3 partial tracts) A) FHA, FSA/RHS & VA B) Conventional C) Refinancings D) Home Improvement Loans F) Non-occupant Loans on G) Loans On Manufactured Number Average Value Number Average Value Number Average Value Number Average Value Number Average Value Number Average Value
LOANS ORIGINATED 19 $153,057 703 $112,002 546 $113,967 46 $81,259 410 $109,812 0 $0 APPLICATIONS APPROVED, NOT ACCEPTED 0 $0 109 $112,089 113 $111,939 14 $62,765 63 $110,802 1 $189,000 APPLICATIONS DENIED 3 $146,357 325 $112,251 433 $112,165 75 $49,521 164 $117,670 1 $180,360 APPLICATIONS WITHDRAWN 5 $189,056 169 $117,839 287 $115,488 24 $116,297 98 $125,603 1 $114,390 FILES CLOSED FOR INCOMPLETENESS 1 $88,180 42 $101,232 81 $108,194 2 $80,295 33 $96,946 0 $0
Aggregated Statistics For Year 2004(Based on 2 full and 3 partial tracts) A) FHA, FSA/RHS & VA B) Conventional C) Refinancings D) Home Improvement Loans F) Non-occupant Loans on G) Loans On Manufactured Number Average Value Number Average Value Number Average Value Number Average Value Number Average Value Number Average Value
LOANS ORIGINATED 19 $122,516 504 $125,157 638 $108,632 45 $63,805 395 $110,659 0 $0 APPLICATIONS APPROVED, NOT ACCEPTED 1 $108,000 74 $118,290 121 $107,146 12 $58,050 69 $122,213 0 $0 APPLICATIONS DENIED 3 $54,967 159 $113,147 465 $106,782 64 $53,578 123 $121,402 1 $98,000 APPLICATIONS WITHDRAWN 4 $149,740 60 $133,441 191 $101,091 11 $69,583 59 $101,202 0 $0 FILES CLOSED FOR INCOMPLETENESS 1 $133,000 26 $115,929 93 $95,650 6 $51,395 17 $92,879 0 $0
Aggregated Statistics For Year 2003(Based on 2 full and 3 partial tracts) A) FHA, FSA/RHS & VA B) Conventional C) Refinancings D) Home Improvement Loans E) Loans on Dwellings For 5+ Families F) Non-occupant Loans on Number Average Value Number Average Value Number Average Value Number Average Value Number Average Value Number Average Value
LOANS ORIGINATED 19 $111,528 356 $121,418 895 $106,931 22 $36,390 1 $3,638,460 349 $104,353 APPLICATIONS APPROVED, NOT ACCEPTED 2 $106,100 55 $129,293 116 $98,882 12 $53,697 0 $0 50 $106,562 APPLICATIONS DENIED 5 $132,716 124 $121,219 393 $98,505 43 $34,258 0 $0 123 $114,955 APPLICATIONS WITHDRAWN 5 $125,538 57 $120,679 185 $102,388 5 $45,634 0 $0 57 $110,387 FILES CLOSED FOR INCOMPLETENESS 3 $139,757 20 $125,020 45 $99,240 2 $59,960 0 $0 15 $112,200
Detailed HMDA statistics for the following Tracts:
0229.00
, 0231.01 , 0231.02 , 0231.07 , 0231.08
Private Mortgage Insurance Companies Aggregated Statistics For Year 2009(Based on 2 full and 3 partial tracts) A) Conventional B) Refinancings C) Non-occupant Loans on Number Average Value Number Average Value Number Average Value
LOANS ORIGINATED 16 $162,801 11 $221,761 0 $0 APPLICATIONS APPROVED, NOT ACCEPTED 7 $153,727 7 $213,613 3 $108,470 APPLICATIONS DENIED 0 $0 1 $450,730 0 $0 APPLICATIONS WITHDRAWN 2 $137,415 2 $142,640 0 $0 FILES CLOSED FOR INCOMPLETENESS 1 $157,400 1 $163,000 1 $78,760
Aggregated Statistics For Year 2008(Based on 2 full and 3 partial tracts) A) Conventional B) Refinancings C) Non-occupant Loans on Number Average Value Number Average Value Number Average Value
LOANS ORIGINATED 74 $168,223 26 $194,377 22 $110,931 APPLICATIONS APPROVED, NOT ACCEPTED 45 $152,133 14 $192,531 12 $122,140 APPLICATIONS DENIED 13 $124,374 2 $171,580 7 $107,716 APPLICATIONS WITHDRAWN 3 $162,137 3 $108,003 1 $156,410 FILES CLOSED FOR INCOMPLETENESS 4 $149,245 2 $151,500 3 $136,087
Aggregated Statistics For Year 2007(Based on 2 full and 3 partial tracts) A) Conventional B) Refinancings C) Non-occupant Loans on Number Average Value Number Average Value Number Average Value
LOANS ORIGINATED 141 $158,605 41 $147,333 38 $124,566 APPLICATIONS APPROVED, NOT ACCEPTED 21 $164,767 6 $152,580 10 $139,879 APPLICATIONS DENIED 6 $145,875 1 $199,570 5 $129,158 APPLICATIONS WITHDRAWN 11 $165,136 4 $153,520 3 $134,667 FILES CLOSED FOR INCOMPLETENESS 2 $110,430 0 $0 1 $144,000
Aggregated Statistics For Year 2006(Based on 2 full and 3 partial tracts) A) Conventional B) Refinancings C) Non-occupant Loans on Number Average Value Number Average Value Number Average Value
LOANS ORIGINATED 47 $169,525 17 $129,721 8 $125,315 APPLICATIONS APPROVED, NOT ACCEPTED 8 $175,240 9 $150,041 3 $136,120 APPLICATIONS DENIED 0 $0 0 $0 0 $0 APPLICATIONS WITHDRAWN 3 $155,960 0 $0 1 $70,940 FILES CLOSED FOR INCOMPLETENESS 1 $151,000 0 $0 0 $0
Aggregated Statistics For Year 2005(Based on 2 full and 3 partial tracts) A) Conventional B) Refinancings C) Non-occupant Loans on Number Average Value Number Average Value Number Average Value
LOANS ORIGINATED 50 $134,130 23 $128,720 21 $123,232 APPLICATIONS APPROVED, NOT ACCEPTED 8 $164,204 9 $132,318 2 $124,500 APPLICATIONS DENIED 1 $85,200 0 $0 1 $85,200 APPLICATIONS WITHDRAWN 3 $146,780 3 $155,137 2 $191,670 FILES CLOSED FOR INCOMPLETENESS 0 $0 1 $122,000 1 $122,000
Aggregated Statistics For Year 2004(Based on 2 full and 3 partial tracts) A) Conventional B) Refinancings C) Non-occupant Loans on Number Average Value Number Average Value Number Average Value
LOANS ORIGINATED 77 $137,798 41 $130,160 33 $113,540 APPLICATIONS APPROVED, NOT ACCEPTED 21 $138,061 15 $122,449 12 $128,262 APPLICATIONS DENIED 1 $153,000 0 $0 0 $0 APPLICATIONS WITHDRAWN 11 $156,334 6 $118,488 8 $149,131 FILES CLOSED FOR INCOMPLETENESS 0 $0 2 $90,385 2 $90,385
Aggregated Statistics For Year 2003(Based on 2 full and 3 partial tracts) A) Conventional B) Refinancings C) Non-occupant Loans on Number Average Value Number Average Value Number Average Value
LOANS ORIGINATED 101 $135,105 66 $125,112 46 $119,364 APPLICATIONS APPROVED, NOT ACCEPTED 26 $138,592 22 $117,964 14 $131,551 APPLICATIONS DENIED 8 $149,046 5 $156,468 7 $141,591 APPLICATIONS WITHDRAWN 16 $145,121 11 $139,835 5 $121,116 FILES CLOSED FOR INCOMPLETENESS 1 $126,000 1 $126,000 2 $126,000
Detailed PMIC statistics for the following Tracts:
0229.00
, 0231.01 , 0231.02 , 0231.07 , 0231.08 Belvedere Park compared to Georgia state average:
Unemployed percentage below state average. Hispanic race population percentage significantly below state average. Foreign-born population percentage below state average. Length of stay since moving in significantly above state average. House age above state average. Percentage of population with a bachelor's degree or higher above state average. Belvedere Park on our top lists :
#9 on the list of "Top 101 cities with the largest percentage of likely lesbian couples (counted as self-reported female-female unmarried-partner households) (population 5,000+)"
#28 on the list of "Top 101 cities with the largest percentage of likely homosexual households (counted as self-reported same-sex unmarried-partner households) (population 5,000+)"
#49 on the list of "Top 101 cities with the most people taking a bus, a trolley bus, a streetcar, or a trolley car to work (population 5,000+)"
#64 on the list of "Top 100 cities with declining populations from 2000 to 2014 (pop. 5,000+)"
#69 on the list of "Top 101 cities with the largest percentage of likely gay men couples (counted as self-reported male-male unmarried-partner households) (population 5,000+)"
#2 on the list of "Top 101 counties with the highest average weight of females"
#5 on the list of "Top 101 counties with the lowest Sulfur Oxides Annual air pollution readings in 2012 (µg/m3 )"
#15 on the list of "Top 101 counties with the highest percentage of residents relocating to other counties in 2011 (pop. 50,000+)"
#16 on the list of "Top 101 counties with the highest Particulate Matter (PM2.5 ) Annual air pollution readings in 2012 (µg/m3 )"
#17 on the list of "Top 101 counties with the highest percentage of residents relocating from other counties between 2010 and 2011 (pop. 50,000+)"


 Recent articles from our blog. Our writers, many of them Ph.D. graduates or candidates, create easy-to-read articles on a wide variety of topics.

 (8.3 miles