Carnegie, Pennsylvania Submit your own pictures of this borough and show them to the world
OSM Map
General Map
Google Map
MSN Map
OSM Map
General Map
Google Map
MSN Map
OSM Map
General Map
Google Map
MSN Map
OSM Map
General Map
Google Map
MSN Map
Please wait while loading the map...
Population in 2022: 7,925 (100% urban, 0% rural). Population change since 2000: -5.5%Males: 4,022 Females: 3,903
March 2022 cost of living index in Carnegie: 93.2 (less than average, U.S. average is 100) Percentage of residents living in poverty in 2022: 10.6%for White Non-Hispanic residents , 33.5% for Black residents , 5.2% for Hispanic or Latino residents , 3.8% for other race residents , 25.3% for two or more races residents )
Profiles of local businesses
Business Search - 14 Million verified businesses
Data:
Median household income ($)
Median household income (% change since 2000)
Household income diversity
Ratio of average income to average house value (%)
Ratio of average income to average rent
Median household income ($) - White
Median household income ($) - Black or African American
Median household income ($) - Asian
Median household income ($) - Hispanic or Latino
Median household income ($) - American Indian and Alaska Native
Median household income ($) - Multirace
Median household income ($) - Other Race
Median household income for houses/condos with a mortgage ($)
Median household income for apartments without a mortgage ($)
Races - White alone (%)
Races - White alone (% change since 2000)
Races - Black alone (%)
Races - Black alone (% change since 2000)
Races - American Indian alone (%)
Races - American Indian alone (% change since 2000)
Races - Asian alone (%)
Races - Asian alone (% change since 2000)
Races - Hispanic (%)
Races - Hispanic (% change since 2000)
Races - Native Hawaiian and Other Pacific Islander alone (%)
Races - Native Hawaiian and Other Pacific Islander alone (% change since 2000)
Races - Two or more races (%)
Races - Two or more races (% change since 2000)
Races - Other race alone (%)
Races - Other race alone (% change since 2000)
Racial diversity
Unemployment (%)
Unemployment (% change since 2000)
Unemployment (%) - White
Unemployment (%) - Black or African American
Unemployment (%) - Asian
Unemployment (%) - Hispanic or Latino
Unemployment (%) - American Indian and Alaska Native
Unemployment (%) - Multirace
Unemployment (%) - Other Race
Population density (people per square mile)
Population - Males (%)
Population - Females (%)
Population - Males (%) - White
Population - Males (%) - Black or African American
Population - Males (%) - Asian
Population - Males (%) - Hispanic or Latino
Population - Males (%) - American Indian and Alaska Native
Population - Males (%) - Multirace
Population - Males (%) - Other Race
Population - Females (%) - White
Population - Females (%) - Black or African American
Population - Females (%) - Asian
Population - Females (%) - Hispanic or Latino
Population - Females (%) - American Indian and Alaska Native
Population - Females (%) - Multirace
Population - Females (%) - Other Race
Coronavirus confirmed cases (Apr 27, 2024)
Deaths caused by coronavirus (Apr 27, 2024)
Coronavirus confirmed cases (per 100k population) (Apr 27, 2024)
Deaths caused by coronavirus (per 100k population) (Apr 27, 2024)
Daily increase in number of cases (Apr 27, 2024)
Weekly increase in number of cases (Apr 27, 2024)
Cases doubled (in days) (Apr 27, 2024)
Hospitalized patients (Apr 18, 2022)
Negative test results (Apr 18, 2022)
Total test results (Apr 18, 2022)
COVID Vaccine doses distributed (per 100k population) (Sep 19, 2023)
COVID Vaccine doses administered (per 100k population) (Sep 19, 2023)
COVID Vaccine doses distributed (Sep 19, 2023)
COVID Vaccine doses administered (Sep 19, 2023)
Likely homosexual households (%)
Likely homosexual households (% change since 2000)
Likely homosexual households - Lesbian couples (%)
Likely homosexual households - Lesbian couples (% change since 2000)
Likely homosexual households - Gay men (%)
Likely homosexual households - Gay men (% change since 2000)
Cost of living index
Median gross rent ($)
Median contract rent ($)
Median monthly housing costs ($)
Median house or condo value ($)
Median house or condo value ($ change since 2000)
Mean house or condo value by units in structure - 1, detached ($)
Mean house or condo value by units in structure - 1, attached ($)
Mean house or condo value by units in structure - 2 ($)
Mean house or condo value by units in structure by units in structure - 3 or 4 ($)
Mean house or condo value by units in structure - 5 or more ($)
Mean house or condo value by units in structure - Boat, RV, van, etc. ($)
Mean house or condo value by units in structure - Mobile home ($)
Median house or condo value ($) - White
Median house or condo value ($) - Black or African American
Median house or condo value ($) - Asian
Median house or condo value ($) - Hispanic or Latino
Median house or condo value ($) - American Indian and Alaska Native
Median house or condo value ($) - Multirace
Median house or condo value ($) - Other Race
Median resident age
Resident age diversity
Median resident age - Males
Median resident age - Females
Median resident age - White
Median resident age - Black or African American
Median resident age - Asian
Median resident age - Hispanic or Latino
Median resident age - American Indian and Alaska Native
Median resident age - Multirace
Median resident age - Other Race
Median resident age - Males - White
Median resident age - Males - Black or African American
Median resident age - Males - Asian
Median resident age - Males - Hispanic or Latino
Median resident age - Males - American Indian and Alaska Native
Median resident age - Males - Multirace
Median resident age - Males - Other Race
Median resident age - Females - White
Median resident age - Females - Black or African American
Median resident age - Females - Asian
Median resident age - Females - Hispanic or Latino
Median resident age - Females - American Indian and Alaska Native
Median resident age - Females - Multirace
Median resident age - Females - Other Race
Commute - mean travel time to work (minutes)
Travel time to work - Less than 5 minutes (%)
Travel time to work - Less than 5 minutes (% change since 2000)
Travel time to work - 5 to 9 minutes (%)
Travel time to work - 5 to 9 minutes (% change since 2000)
Travel time to work - 10 to 19 minutes (%)
Travel time to work - 10 to 19 minutes (% change since 2000)
Travel time to work - 20 to 29 minutes (%)
Travel time to work - 20 to 29 minutes (% change since 2000)
Travel time to work - 30 to 39 minutes (%)
Travel time to work - 30 to 39 minutes (% change since 2000)
Travel time to work - 40 to 59 minutes (%)
Travel time to work - 40 to 59 minutes (% change since 2000)
Travel time to work - 60 to 89 minutes (%)
Travel time to work - 60 to 89 minutes (% change since 2000)
Travel time to work - 90 or more minutes (%)
Travel time to work - 90 or more minutes (% change since 2000)
Marital status - Never married (%)
Marital status - Now married (%)
Marital status - Separated (%)
Marital status - Widowed (%)
Marital status - Divorced (%)
Median family income ($)
Median family income (% change since 2000)
Median non-family income ($)
Median non-family income (% change since 2000)
Median per capita income ($)
Median per capita income (% change since 2000)
Median family income ($) - White
Median family income ($) - Black or African American
Median family income ($) - Asian
Median family income ($) - Hispanic or Latino
Median family income ($) - American Indian and Alaska Native
Median family income ($) - Multirace
Median family income ($) - Other Race
Median year house/condo built
Median year apartment built
Year house built - Built 2005 or later (%)
Year house built - Built 2000 to 2004 (%)
Year house built - Built 1990 to 1999 (%)
Year house built - Built 1980 to 1989 (%)
Year house built - Built 1970 to 1979 (%)
Year house built - Built 1960 to 1969 (%)
Year house built - Built 1950 to 1959 (%)
Year house built - Built 1940 to 1949 (%)
Year house built - Built 1939 or earlier (%)
Average household size
Household density (households per square mile)
Average household size - White
Average household size - Black or African American
Average household size - Asian
Average household size - Hispanic or Latino
Average household size - American Indian and Alaska Native
Average household size - Multirace
Average household size - Other Race
Occupied housing units (%)
Vacant housing units (%)
Owner occupied housing units (%)
Renter occupied housing units (%)
Vacancy status - For rent (%)
Vacancy status - For sale only (%)
Vacancy status - Rented or sold, not occupied (%)
Vacancy status - For seasonal, recreational, or occasional use (%)
Vacancy status - For migrant workers (%)
Vacancy status - Other vacant (%)
Residents with income below the poverty level (%)
Residents with income below 50% of the poverty level (%)
Children below poverty level (%)
Poor families by family type - Married-couple family (%)
Poor families by family type - Male, no wife present (%)
Poor families by family type - Female, no husband present (%)
Poverty status for native-born residents (%)
Poverty status for foreign-born residents (%)
Poverty among high school graduates not in families (%)
Poverty among people who did not graduate high school not in families (%)
Residents with income below the poverty level (%) - White
Residents with income below the poverty level (%) - Black or African American
Residents with income below the poverty level (%) - Asian
Residents with income below the poverty level (%) - Hispanic or Latino
Residents with income below the poverty level (%) - American Indian and Alaska Native
Residents with income below the poverty level (%) - Multirace
Residents with income below the poverty level (%) - Other Race
Air pollution - Air Quality Index (AQI)
Air pollution - CO
Air pollution - NO2
Air pollution - SO2
Air pollution - Ozone
Air pollution - PM10
Air pollution - PM25
Air pollution - Pb
Crime - Murders per 100,000 population
Crime - Rapes per 100,000 population
Crime - Robberies per 100,000 population
Crime - Assaults per 100,000 population
Crime - Burglaries per 100,000 population
Crime - Thefts per 100,000 population
Crime - Auto thefts per 100,000 population
Crime - Arson per 100,000 population
Crime - City-data.com crime index
Crime - Violent crime index
Crime - Property crime index
Crime - Murders per 100,000 population (5 year average)
Crime - Rapes per 100,000 population (5 year average)
Crime - Robberies per 100,000 population (5 year average)
Crime - Assaults per 100,000 population (5 year average)
Crime - Burglaries per 100,000 population (5 year average)
Crime - Thefts per 100,000 population (5 year average)
Crime - Auto thefts per 100,000 population (5 year average)
Crime - Arson per 100,000 population (5 year average)
Crime - City-data.com crime index (5 year average)
Crime - Violent crime index (5 year average)
Crime - Property crime index (5 year average)
1996 Presidential Elections Results (%) - Democratic Party (Clinton)
1996 Presidential Elections Results (%) - Republican Party (Dole)
1996 Presidential Elections Results (%) - Other
2000 Presidential Elections Results (%) - Democratic Party (Gore)
2000 Presidential Elections Results (%) - Republican Party (Bush)
2000 Presidential Elections Results (%) - Other
2004 Presidential Elections Results (%) - Democratic Party (Kerry)
2004 Presidential Elections Results (%) - Republican Party (Bush)
2004 Presidential Elections Results (%) - Other
2008 Presidential Elections Results (%) - Democratic Party (Obama)
2008 Presidential Elections Results (%) - Republican Party (McCain)
2008 Presidential Elections Results (%) - Other
2012 Presidential Elections Results (%) - Democratic Party (Obama)
2012 Presidential Elections Results (%) - Republican Party (Romney)
2012 Presidential Elections Results (%) - Other
2016 Presidential Elections Results (%) - Democratic Party (Clinton)
2016 Presidential Elections Results (%) - Republican Party (Trump)
2016 Presidential Elections Results (%) - Other
2020 Presidential Elections Results (%) - Democratic Party (Biden)
2020 Presidential Elections Results (%) - Republican Party (Trump)
2020 Presidential Elections Results (%) - Other
Ancestries Reported - Arab (%)
Ancestries Reported - Czech (%)
Ancestries Reported - Danish (%)
Ancestries Reported - Dutch (%)
Ancestries Reported - English (%)
Ancestries Reported - French (%)
Ancestries Reported - French Canadian (%)
Ancestries Reported - German (%)
Ancestries Reported - Greek (%)
Ancestries Reported - Hungarian (%)
Ancestries Reported - Irish (%)
Ancestries Reported - Italian (%)
Ancestries Reported - Lithuanian (%)
Ancestries Reported - Norwegian (%)
Ancestries Reported - Polish (%)
Ancestries Reported - Portuguese (%)
Ancestries Reported - Russian (%)
Ancestries Reported - Scotch-Irish (%)
Ancestries Reported - Scottish (%)
Ancestries Reported - Slovak (%)
Ancestries Reported - Subsaharan African (%)
Ancestries Reported - Swedish (%)
Ancestries Reported - Swiss (%)
Ancestries Reported - Ukrainian (%)
Ancestries Reported - United States (%)
Ancestries Reported - Welsh (%)
Ancestries Reported - West Indian (%)
Ancestries Reported - Other (%)
Educational Attainment - No schooling completed (%)
Educational Attainment - Less than high school (%)
Educational Attainment - High school or equivalent (%)
Educational Attainment - Less than 1 year of college (%)
Educational Attainment - 1 or more years of college (%)
Educational Attainment - Associate degree (%)
Educational Attainment - Bachelor's degree (%)
Educational Attainment - Master's degree (%)
Educational Attainment - Professional school degree (%)
Educational Attainment - Doctorate degree (%)
School Enrollment - Nursery, preschool (%)
School Enrollment - Kindergarten (%)
School Enrollment - Grade 1 to 4 (%)
School Enrollment - Grade 5 to 8 (%)
School Enrollment - Grade 9 to 12 (%)
School Enrollment - College undergrad (%)
School Enrollment - Graduate or professional (%)
School Enrollment - Not enrolled in school (%)
School enrollment - Public schools (%)
School enrollment - Private schools (%)
School enrollment - Not enrolled (%)
Median number of rooms in houses and condos
Median number of rooms in apartments
Housing units lacking complete plumbing facilities (%)
Housing units lacking complete kitchen facilities (%)
Density of houses
Urban houses (%)
Rural houses (%)
Households with people 60 years and over (%)
Households with people 65 years and over (%)
Households with people 75 years and over (%)
Households with one or more nonrelatives (%)
Households with no nonrelatives (%)
Population in households (%)
Family households (%)
Nonfamily households (%)
Population in families (%)
Family households with own children (%)
Median number of bedrooms in owner occupied houses
Mean number of bedrooms in owner occupied houses
Median number of bedrooms in renter occupied houses
Mean number of bedrooms in renter occupied houses
Median number of vehichles in owner occupied houses
Mean number of vehichles in owner occupied houses
Median number of vehichles in renter occupied houses
Mean number of vehichles in renter occupied houses
Mortgage status - with mortgage (%)
Mortgage status - with second mortgage (%)
Mortgage status - with home equity loan (%)
Mortgage status - with both second mortgage and home equity loan (%)
Mortgage status - without a mortgage (%)
Average family size
Average family size - White
Average family size - Black or African American
Average family size - Asian
Average family size - Hispanic or Latino
Average family size - American Indian and Alaska Native
Average family size - Multirace
Average family size - Other Race
Geographical mobility - Same house 1 year ago (%)
Geographical mobility - Moved within same county (%)
Geographical mobility - Moved from different county within same state (%)
Geographical mobility - Moved from different state (%)
Geographical mobility - Moved from abroad (%)
Place of birth - Born in state of residence (%)
Place of birth - Born in other state (%)
Place of birth - Native, outside of US (%)
Place of birth - Foreign born (%)
Housing units in structures - 1, detached (%)
Housing units in structures - 1, attached (%)
Housing units in structures - 2 (%)
Housing units in structures - 3 or 4 (%)
Housing units in structures - 5 to 9 (%)
Housing units in structures - 10 to 19 (%)
Housing units in structures - 20 to 49 (%)
Housing units in structures - 50 or more (%)
Housing units in structures - Mobile home (%)
Housing units in structures - Boat, RV, van, etc. (%)
House/condo owner moved in on average (years ago)
Renter moved in on average (years ago)
Year householder moved into unit - Moved in 1999 to March 2000 (%)
Year householder moved into unit - Moved in 1995 to 1998 (%)
Year householder moved into unit - Moved in 1990 to 1994 (%)
Year householder moved into unit - Moved in 1980 to 1989 (%)
Year householder moved into unit - Moved in 1970 to 1979 (%)
Year householder moved into unit - Moved in 1969 or earlier (%)
Means of transportation to work - Drove car alone (%)
Means of transportation to work - Carpooled (%)
Means of transportation to work - Public transportation (%)
Means of transportation to work - Bus or trolley bus (%)
Means of transportation to work - Streetcar or trolley car (%)
Means of transportation to work - Subway or elevated (%)
Means of transportation to work - Railroad (%)
Means of transportation to work - Ferryboat (%)
Means of transportation to work - Taxicab (%)
Means of transportation to work - Motorcycle (%)
Means of transportation to work - Bicycle (%)
Means of transportation to work - Walked (%)
Means of transportation to work - Other means (%)
Working at home (%)
Industry diversity
Most Common Industries - Agriculture, forestry, fishing and hunting, and mining (%)
Most Common Industries - Agriculture, forestry, fishing and hunting (%)
Most Common Industries - Mining, quarrying, and oil and gas extraction (%)
Most Common Industries - Construction (%)
Most Common Industries - Manufacturing (%)
Most Common Industries - Wholesale trade (%)
Most Common Industries - Retail trade (%)
Most Common Industries - Transportation and warehousing, and utilities (%)
Most Common Industries - Transportation and warehousing (%)
Most Common Industries - Utilities (%)
Most Common Industries - Information (%)
Most Common Industries - Finance and insurance, and real estate and rental and leasing (%)
Most Common Industries - Finance and insurance (%)
Most Common Industries - Real estate and rental and leasing (%)
Most Common Industries - Professional, scientific, and management, and administrative and waste management services (%)
Most Common Industries - Professional, scientific, and technical services (%)
Most Common Industries - Management of companies and enterprises (%)
Most Common Industries - Administrative and support and waste management services (%)
Most Common Industries - Educational services, and health care and social assistance (%)
Most Common Industries - Educational services (%)
Most Common Industries - Health care and social assistance (%)
Most Common Industries - Arts, entertainment, and recreation, and accommodation and food services (%)
Most Common Industries - Arts, entertainment, and recreation (%)
Most Common Industries - Accommodation and food services (%)
Most Common Industries - Other services, except public administration (%)
Most Common Industries - Public administration (%)
Occupation diversity
Most Common Occupations - Management, business, science, and arts occupations (%)
Most Common Occupations - Management, business, and financial occupations (%)
Most Common Occupations - Management occupations (%)
Most Common Occupations - Business and financial operations occupations (%)
Most Common Occupations - Computer, engineering, and science occupations (%)
Most Common Occupations - Computer and mathematical occupations (%)
Most Common Occupations - Architecture and engineering occupations (%)
Most Common Occupations - Life, physical, and social science occupations (%)
Most Common Occupations - Education, legal, community service, arts, and media occupations (%)
Most Common Occupations - Community and social service occupations (%)
Most Common Occupations - Legal occupations (%)
Most Common Occupations - Education, training, and library occupations (%)
Most Common Occupations - Arts, design, entertainment, sports, and media occupations (%)
Most Common Occupations - Healthcare practitioners and technical occupations (%)
Most Common Occupations - Health diagnosing and treating practitioners and other technical occupations (%)
Most Common Occupations - Health technologists and technicians (%)
Most Common Occupations - Service occupations (%)
Most Common Occupations - Healthcare support occupations (%)
Most Common Occupations - Protective service occupations (%)
Most Common Occupations - Fire fighting and prevention, and other protective service workers including supervisors (%)
Most Common Occupations - Law enforcement workers including supervisors (%)
Most Common Occupations - Food preparation and serving related occupations (%)
Most Common Occupations - Building and grounds cleaning and maintenance occupations (%)
Most Common Occupations - Personal care and service occupations (%)
Most Common Occupations - Sales and office occupations (%)
Most Common Occupations - Sales and related occupations (%)
Most Common Occupations - Office and administrative support occupations (%)
Most Common Occupations - Natural resources, construction, and maintenance occupations (%)
Most Common Occupations - Farming, fishing, and forestry occupations (%)
Most Common Occupations - Construction and extraction occupations (%)
Most Common Occupations - Installation, maintenance, and repair occupations (%)
Most Common Occupations - Production, transportation, and material moving occupations (%)
Most Common Occupations - Production occupations (%)
Most Common Occupations - Transportation occupations (%)
Most Common Occupations - Material moving occupations (%)
People in Group quarters - Institutionalized population (%)
People in Group quarters - Correctional institutions (%)
People in Group quarters - Federal prisons and detention centers (%)
People in Group quarters - Halfway houses (%)
People in Group quarters - Local jails and other confinement facilities (including police lockups) (%)
People in Group quarters - Military disciplinary barracks (%)
People in Group quarters - State prisons (%)
People in Group quarters - Other types of correctional institutions (%)
People in Group quarters - Nursing homes (%)
People in Group quarters - Hospitals/wards, hospices, and schools for the handicapped (%)
People in Group quarters - Hospitals/wards and hospices for chronically ill (%)
People in Group quarters - Hospices or homes for chronically ill (%)
People in Group quarters - Military hospitals or wards for chronically ill (%)
People in Group quarters - Other hospitals or wards for chronically ill (%)
People in Group quarters - Hospitals or wards for drug/alcohol abuse (%)
People in Group quarters - Mental (Psychiatric) hospitals or wards (%)
People in Group quarters - Schools, hospitals, or wards for the mentally retarded (%)
People in Group quarters - Schools, hospitals, or wards for the physically handicapped (%)
People in Group quarters - Institutions for the deaf (%)
People in Group quarters - Institutions for the blind (%)
People in Group quarters - Orthopedic wards and institutions for the physically handicapped (%)
People in Group quarters - Wards in general hospitals for patients who have no usual home elsewhere (%)
People in Group quarters - Wards in military hospitals for patients who have no usual home elsewhere (%)
People in Group quarters - Juvenile institutions (%)
People in Group quarters - Long-term care (%)
People in Group quarters - Homes for abused, dependent, and neglected children (%)
People in Group quarters - Residential treatment centers for emotionally disturbed children (%)
People in Group quarters - Training schools for juvenile delinquents (%)
People in Group quarters - Short-term care, detention or diagnostic centers for delinquent children (%)
People in Group quarters - Type of juvenile institution unknown (%)
People in Group quarters - Noninstitutionalized population (%)
People in Group quarters - College dormitories (includes college quarters off campus) (%)
People in Group quarters - Military quarters (%)
People in Group quarters - On base (%)
People in Group quarters - Barracks, unaccompanied personnel housing (UPH), (Enlisted/Officer), ;and similar group living quarters for military personnel (%)
People in Group quarters - Transient quarters for temporary residents (%)
People in Group quarters - Military ships (%)
People in Group quarters - Group homes (%)
People in Group quarters - Homes or halfway houses for drug/alcohol abuse (%)
People in Group quarters - Homes for the mentally ill (%)
People in Group quarters - Homes for the mentally retarded (%)
People in Group quarters - Homes for the physically handicapped (%)
People in Group quarters - Other group homes (%)
People in Group quarters - Religious group quarters (%)
People in Group quarters - Dormitories (%)
People in Group quarters - Agriculture workers' dormitories on farms (%)
People in Group quarters - Job Corps and vocational training facilities (%)
People in Group quarters - Other workers' dormitories (%)
People in Group quarters - Crews of maritime vessels (%)
People in Group quarters - Other nonhousehold living situations (%)
People in Group quarters - Other noninstitutional group quarters (%)
Residents speaking English at home (%)
Residents speaking English at home - Born in the United States (%)
Residents speaking English at home - Native, born elsewhere (%)
Residents speaking English at home - Foreign born (%)
Residents speaking Spanish at home (%)
Residents speaking Spanish at home - Born in the United States (%)
Residents speaking Spanish at home - Native, born elsewhere (%)
Residents speaking Spanish at home - Foreign born (%)
Residents speaking other language at home (%)
Residents speaking other language at home - Born in the United States (%)
Residents speaking other language at home - Native, born elsewhere (%)
Residents speaking other language at home - Foreign born (%)
Class of Workers - Employee of private company (%)
Class of Workers - Self-employed in own incorporated business (%)
Class of Workers - Private not-for-profit wage and salary workers (%)
Class of Workers - Local government workers (%)
Class of Workers - State government workers (%)
Class of Workers - Federal government workers (%)
Class of Workers - Self-employed workers in own not incorporated business and Unpaid family workers (%)
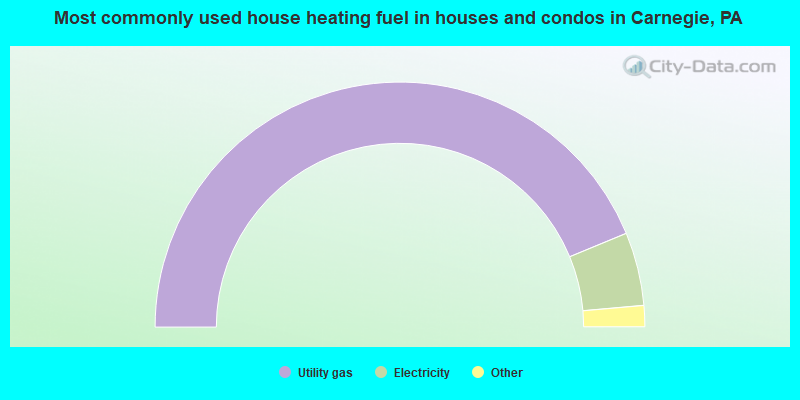
House heating fuel used in houses and condos - Utility gas (%)
House heating fuel used in houses and condos - Bottled, tank, or LP gas (%)
House heating fuel used in houses and condos - Electricity (%)
House heating fuel used in houses and condos - Fuel oil, kerosene, etc. (%)
House heating fuel used in houses and condos - Coal or coke (%)
House heating fuel used in houses and condos - Wood (%)
House heating fuel used in houses and condos - Solar energy (%)
House heating fuel used in houses and condos - Other fuel (%)
House heating fuel used in houses and condos - No fuel used (%)
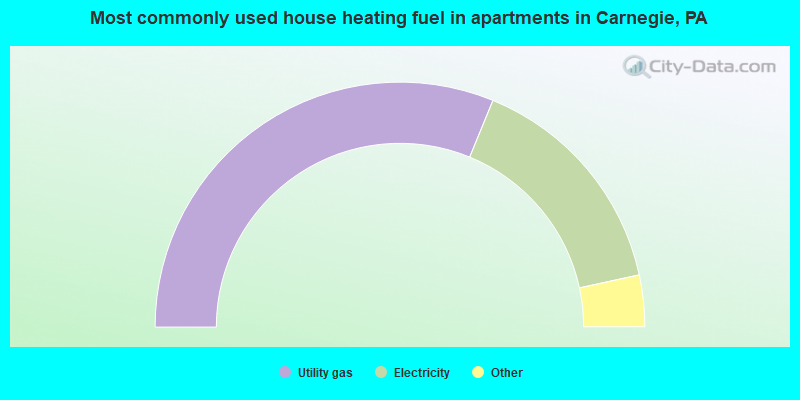
House heating fuel used in apartments - Utility gas (%)
House heating fuel used in apartments - Bottled, tank, or LP gas (%)
House heating fuel used in apartments - Electricity (%)
House heating fuel used in apartments - Fuel oil, kerosene, etc. (%)
House heating fuel used in apartments - Coal or coke (%)
House heating fuel used in apartments - Wood (%)
House heating fuel used in apartments - Solar energy (%)
House heating fuel used in apartments - Other fuel (%)
House heating fuel used in apartments - No fuel used (%)
Armed forces status - In Armed Forces (%)
Armed forces status - Civilian (%)
Armed forces status - Civilian - Veteran (%)
Armed forces status - Civilian - Nonveteran (%)
Fatal accidents locations in years 2005-2021
Fatal accidents locations in 2005
Fatal accidents locations in 2006
Fatal accidents locations in 2007
Fatal accidents locations in 2008
Fatal accidents locations in 2009
Fatal accidents locations in 2010
Fatal accidents locations in 2011
Fatal accidents locations in 2012
Fatal accidents locations in 2013
Fatal accidents locations in 2014
Fatal accidents locations in 2015
Fatal accidents locations in 2016
Fatal accidents locations in 2017
Fatal accidents locations in 2018
Fatal accidents locations in 2019
Fatal accidents locations in 2020
Fatal accidents locations in 2021
Alcohol use - People drinking some alcohol every month (%)
Alcohol use - People not drinking at all (%)
Alcohol use - Average days/month drinking alcohol
Alcohol use - Average drinks/week
Alcohol use - Average days/year people drink much
Audiometry - Average condition of hearing (%)
Audiometry - People that can hear a whisper from across a quiet room (%)
Audiometry - People that can hear normal voice from across a quiet room (%)
Audiometry - Ears ringing, roaring, buzzing (%)
Audiometry - Had a job exposure to loud noise (%)
Audiometry - Had off-work exposure to loud noise (%)
Blood Pressure & Cholesterol - Has high blood pressure (%)
Blood Pressure & Cholesterol - Checking blood pressure at home (%)
Blood Pressure & Cholesterol - Frequently checking blood cholesterol (%)
Blood Pressure & Cholesterol - Has high cholesterol level (%)
Consumer Behavior - Money monthly spent on food at supermarket/grocery store
Consumer Behavior - Money monthly spent on food at other stores
Consumer Behavior - Money monthly spent on eating out
Consumer Behavior - Money monthly spent on carryout/delivered foods
Consumer Behavior - Income spent on food at supermarket/grocery store (%)
Consumer Behavior - Income spent on food at other stores (%)
Consumer Behavior - Income spent on eating out (%)
Consumer Behavior - Income spent on carryout/delivered foods (%)
Current Health Status - General health condition (%)
Current Health Status - Blood donors (%)
Current Health Status - Has blood ever tested for HIV virus (%)
Current Health Status - Left-handed people (%)
Dermatology - People using sunscreen (%)
Diabetes - Diabetics (%)
Diabetes - Had a blood test for high blood sugar (%)
Diabetes - People taking insulin (%)
Diet Behavior & Nutrition - Diet health (%)
Diet Behavior & Nutrition - Milk product consumption (# of products/month)
Diet Behavior & Nutrition - Meals not home prepared (#/week)
Diet Behavior & Nutrition - Meals from fast food or pizza place (#/week)
Diet Behavior & Nutrition - Ready-to-eat foods (#/month)
Diet Behavior & Nutrition - Frozen meals/pizza (#/month)
Drug Use - People that ever used marijuana or hashish (%)
Drug Use - Ever used hard drugs (%)
Drug Use - Ever used any form of cocaine (%)
Drug Use - Ever used heroin (%)
Drug Use - Ever used methamphetamine (%)
Health Insurance - People covered by health insurance (%)
Kidney Conditions-Urology - Avg. # of times urinating at night
Medical Conditions - People with asthma (%)
Medical Conditions - People with anemia (%)
Medical Conditions - People with psoriasis (%)
Medical Conditions - People with overweight (%)
Medical Conditions - Elderly people having difficulties in thinking or remembering (%)
Medical Conditions - People who ever received blood transfusion (%)
Medical Conditions - People having trouble seeing even with glass/contacts (%)
Medical Conditions - People with arthritis (%)
Medical Conditions - People with gout (%)
Medical Conditions - People with congestive heart failure (%)
Medical Conditions - People with coronary heart disease (%)
Medical Conditions - People with angina pectoris (%)
Medical Conditions - People who ever had heart attack (%)
Medical Conditions - People who ever had stroke (%)
Medical Conditions - People with emphysema (%)
Medical Conditions - People with thyroid problem (%)
Medical Conditions - People with chronic bronchitis (%)
Medical Conditions - People with any liver condition (%)
Medical Conditions - People who ever had cancer or malignancy (%)
Mental Health - People who have little interest in doing things (%)
Mental Health - People feeling down, depressed, or hopeless (%)
Mental Health - People who have trouble sleeping or sleeping too much (%)
Mental Health - People feeling tired or having little energy (%)
Mental Health - People with poor appetite or overeating (%)
Mental Health - People feeling bad about themself (%)
Mental Health - People who have trouble concentrating on things (%)
Mental Health - People moving or speaking slowly or too fast (%)
Mental Health - People having thoughts they would be better off dead (%)
Oral Health - Average years since last visit a dentist
Oral Health - People embarrassed because of mouth (%)
Oral Health - People with gum disease (%)
Oral Health - General health of teeth and gums (%)
Oral Health - Average days a week using dental floss/device
Oral Health - Average days a week using mouthwash for dental problem
Oral Health - Average number of teeth
Pesticide Use - Households using pesticides to control insects (%)
Pesticide Use - Households using pesticides to kill weeds (%)
Physical Activity - People doing vigorous-intensity work activities (%)
Physical Activity - People doing moderate-intensity work activities (%)
Physical Activity - People walking or bicycling (%)
Physical Activity - People doing vigorous-intensity recreational activities (%)
Physical Activity - People doing moderate-intensity recreational activities (%)
Physical Activity - Average hours a day doing sedentary activities
Physical Activity - Average hours a day watching TV or videos
Physical Activity - Average hours a day using computer
Physical Functioning - People having limitations keeping them from working (%)
Physical Functioning - People limited in amount of work they can do (%)
Physical Functioning - People that need special equipment to walk (%)
Physical Functioning - People experiencing confusion/memory problems (%)
Physical Functioning - People requiring special healthcare equipment (%)
Prescription Medications - Average number of prescription medicines taking
Preventive Aspirin Use - Adults 40+ taking low-dose aspirin (%)
Reproductive Health - Vaginal deliveries (%)
Reproductive Health - Cesarean deliveries (%)
Reproductive Health - Deliveries resulted in a live birth (%)
Reproductive Health - Pregnancies resulted in a delivery (%)
Reproductive Health - Women breastfeeding newborns (%)
Reproductive Health - Women that had a hysterectomy (%)
Reproductive Health - Women that had both ovaries removed (%)
Reproductive Health - Women that have ever taken birth control pills (%)
Reproductive Health - Women taking birth control pills (%)
Reproductive Health - Women that have ever used Depo-Provera or injectables (%)
Reproductive Health - Women that have ever used female hormones (%)
Sexual Behavior - People 18+ that ever had sex (vaginal, anal, or oral) (%)
Sexual Behavior - Males 18+ that ever had vaginal sex with a woman (%)
Sexual Behavior - Males 18+ that ever performed oral sex on a woman (%)
Sexual Behavior - Males 18+ that ever had anal sex with a woman (%)
Sexual Behavior - Males 18+ that ever had any sex with a man (%)
Sexual Behavior - Females 18+ that ever had vaginal sex with a man (%)
Sexual Behavior - Females 18+ that ever performed oral sex on a man (%)
Sexual Behavior - Females 18+ that ever had anal sex with a man (%)
Sexual Behavior - Females 18+ that ever had any kind of sex with a woman (%)
Sexual Behavior - Average age people first had sex
Sexual Behavior - Average number of female sex partners in lifetime (males 18+)
Sexual Behavior - Average number of female vaginal sex partners in lifetime (males 18+)
Sexual Behavior - Average age people first performed oral sex on a woman (18+)
Sexual Behavior - Average number of woman performed oral sex on in lifetime (18+)
Sexual Behavior - Average number of male sex partners in lifetime (males 18+)
Sexual Behavior - Average number of male anal sex partners in lifetime (males 18+)
Sexual Behavior - Average age people first performed oral sex on a man (18+)
Sexual Behavior - Average number of male oral sex partners in lifetime (18+)
Sexual Behavior - People using protection when performing oral sex (%)
Sexual Behavior - Average number of times people have vaginal or anal sex a year
Sexual Behavior - People having sex without condom (%)
Sexual Behavior - Average number of male sex partners in lifetime (females 18+)
Sexual Behavior - Average number of male vaginal sex partners in lifetime (females 18+)
Sexual Behavior - Average number of female sex partners in lifetime (females 18+)
Sexual Behavior - Circumcised males 18+ (%)
Sleep Disorders - Average hours sleeping at night
Sleep Disorders - People that has trouble sleeping (%)
Smoking-Cigarette Use - People smoking cigarettes (%)
Taste & Smell - People 40+ having problems with smell (%)
Taste & Smell - People 40+ having problems with taste (%)
Taste & Smell - People 40+ that ever had wisdom teeth removed (%)
Taste & Smell - People 40+ that ever had tonsils teeth removed (%)
Taste & Smell - People 40+ that ever had a loss of consciousness because of a head injury (%)
Taste & Smell - People 40+ that ever had a broken nose or other serious injury to face or skull (%)
Taste & Smell - People 40+ that ever had two or more sinus infections (%)
Weight - Average height (inches)
Weight - Average weight (pounds)
Weight - Average BMI
Weight - People that are obese (%)
Weight - People that ever were obese (%)
Weight - People trying to lose weight (%)
Officers per 1,000 residents here:
1.68Pennsylvania average:
2.55
Latest news from Carnegie, PA collected exclusively by city-data.com from local newspapers, TV, and radio stations
Ancestries: Irish (17.1%), German (15.6%), Italian (10.3%), Polish (4.2%), Scotch-Irish (3.0%), American (2.9%).
Current Local Time:
Incorporated on 01/03/1894
Land area: 1.65 square miles.
Population density: 4,796 people per square mile (average).
351 residents are foreign born (2.5% Asia , 1.3% Europe ).
This borough:
4.4%Pennsylvania:
7.3%
Median real estate property taxes paid for housing units with mortgages in 2022: $2,985 (1.6%)Median real estate property taxes paid for housing units with no mortgage in 2022: $2,841 (2.1%)
Nearest city with pop. 50,000+: Pittsburgh, PA
Nearest city with pop. 1,000,000+: Philadelphia, PA
Nearest cities:
Latitude: 40.41 N, Longitude: 80.09 W
Daytime population change due to commuting: -784 (-9.8%)Workers who live and work in this borough: 1,279 (27.1%)
Property values in Carnegie, PA
Unemployment in December 2023: Here:
2.8%Pennsylvania:
2.9%
Most common occupations in Carnegie, PA (%)
Both Males Females
Secretaries and administrative assistants (4.7%)
Other office and administrative support workers, including supervisors (4.2%)
Other sales and related occupations, including supervisors (3.9%)
Sales representatives, services, wholesale and manufacturing (3.8%)
Building and grounds cleaning and maintenance occupations (3.8%)
Information and record clerks, except customer service representatives (3.3%)
Health technologists and technicians (3.1%)
Building and grounds cleaning and maintenance occupations (5.2%)
Electrical equipment mechanics and other installation, maintenance, and repair workers, including supervisors (4.4%)
Carpenters (4.3%)
Other management occupations, except farmers and farm managers (3.6%)
Sales representatives, services, wholesale and manufacturing (3.6%)
Engineers (3.5%)
Other sales and related occupations, including supervisors (3.5%)
Secretaries and administrative assistants (9.4%)
Other office and administrative support workers, including supervisors (6.7%)
Health technologists and technicians (5.5%)
Information and record clerks, except customer service representatives (5.4%)
Other sales and related occupations, including supervisors (4.3%)
Retail sales workers, except cashiers (4.3%)
Nursing, psychiatric, and home health aides (4.2%)
Tornado activity:
Carnegie-area historical tornado activity is near Pennsylvania state average. It is 21% smaller than the overall U.S. average.
On 6/3/1980, a category F4 (max. wind speeds 207-260 mph) tornado 25.2 miles away from the Carnegie borough center injured 140 people and caused between $50,000,000 and $500,000,000 in damages.
On 8/3/1963, a category F3 (max. wind speeds 158-206 mph) tornado 12.4 miles away from the borough center killed 2 people and injured 70 people and caused between $5,000,000 and $50,000,000 in damages.
Earthquake activity:
Carnegie-area historical earthquake activity is significantly above Pennsylvania state average. It is 55% smaller than the overall U.S. average. On 9/25/1998 at 19:52:52, a magnitude 5.2 (4.8 MB, 4.3 MS, 5.2 LG, 4.5 MW, Depth: 3.1 mi, Class: Moderate, Intensity: VI - VII) earthquake occurred 76.7 miles away from Carnegie center On 8/23/2011 at 17:51:04, a magnitude 5.8 (5.8 MW, Depth: 3.7 mi) earthquake occurred 207.7 miles away from Carnegie center On 1/31/1986 at 16:46:43, a magnitude 5.0 (5.0 MB) earthquake occurred 99.9 miles away from the city center On 7/27/1980 at 18:52:21, a magnitude 5.2 (5.1 MB, 4.7 MS, 5.0 UK, 5.2 UK) earthquake occurred 256.4 miles away from the city center On 12/31/2011 at 20:05:01, a magnitude 4.0 (4.0 ML, Depth: 3.1 mi, Class: Light, Intensity: IV - V) earthquake occurred 58.5 miles away from the city center On 8/9/2020 at 12:07:37, a magnitude 5.1 (5.1 MW, Depth: 4.7 mi) earthquake occurred 277.3 miles away from the city center Magnitude types: regional Lg-wave magnitude (LG), body-wave magnitude (MB), local magnitude (ML), surface-wave magnitude (MS), moment magnitude (MW) Natural disasters: The number of natural disasters in Allegheny County (15) is near the US average (15).Major Disasters (Presidential) Declared: 12Emergencies Declared: 3Floods: 6, Storms: 6, Winter Storms: 3, Hurricanes: 2, Tornadoes: 2, Blizzard: 1, Snowfall: 1, Snowstorm: 1, Tropical Depression: 1, Tropical Storm: 1, Other: 1 (Note: some incidents may be assigned to more than one category). Hospitals and medical centers in Carnegie: HARMONY HOSPICE (811 WASHINGTON AVENUE) STEP BY STEP INC (111 THIRD ST) WOODVILLE STATE HOSP (BOX 456) GALLAGHER HOME HEALTH SERVICES (1100 WASHINGTON ROAD SUITE206)
NURSEFINDERS OF WESTERN PA (510 EAST MAIN STREET)
OMNI HOME CARE (CARNEGIE OFFICE PARK BLDG 2)
WOODVILLE STATE HOSP HILLCREST EAST (41 THOMS RUN RD)
Amtrak station near Carnegie: 6 miles: PITTSBURGH (1100 LIBERTY AVE.) Services: ticket office, fully wheelchair accessible, enclosed waiting area, public restrooms, public payphones, vending machines, ATM, free short-term parking, paid long-term parking, call for car rental service, call for taxi service, intercity bus service, public transit connection.
Colleges/universities with over 2000 students nearest to Carnegie:
Community College of Allegheny County (about 5 miles; Pittsburgh, PA ; Full-time enrollment: 13,486)
Point Park University (about 5 miles; Pittsburgh, PA ; FT enrollment: 3,525)
Duquesne University (about 6 miles; Pittsburgh, PA ; FT enrollment: 8,211)
Pittsburgh Technical Institute (about 6 miles; Oakdale, PA ; FT enrollment: 2,805)
The Art Institute of Pittsburgh-Online Division (about 6 miles; Pittsburgh, PA ; FT enrollment: 11,040)
University of Pittsburgh-Pittsburgh Campus (about 8 miles; Pittsburgh, PA ; FT enrollment: 27,137)
Carnegie Mellon University (about 9 miles; Pittsburgh, PA ; FT enrollment: 14,186)
Public high school in Carnegie:
Public elementary/middle school in Carnegie:
See full list of schools located in Carnegie Library in Carnegie: ANDREW CARNEGIE FREE LIBRARY Operating income: $322,582; Location: 300 BEECHWOOD AVE; 17,752 books ; 15,627 e-books ; 1,383 audio materials ; 2,024 video materials ; 41 state licensed databases ; 16 other licensed databases ; 45 print serial subscriptions ; 1 electronic serial subscriptions )
Notable locations in Carnegie: (A) , Carnegie Borough Hall (B) , Carnegie Police Department (C) , Saint Elizabeth Ann Seton Parish Administratve Center (D) , Wee Care Childrens Center (E) , Carnegie Volunteer Fire Department and Rescue Station 255 (F) , Rosslyn Station (G) . Display/hide their locations on the map
Churches in Carnegie include: (A) , Holy Trinity Ukranian Catholic Church (B) , Holy Trinity Church (C) , Solid Rock Foundation Ministries (D) , Saint Peter and Paul Ukranian Orthodox Church (E) , Saint John Lutheran Church (F) , Primitive Methodist Church (G) , Atonement Episcopal Church (H) , All Saints Polish National Catholic Church (I) . Display/hide their locations on the map
Streams, rivers, and creeks: (A) . Display/hide its location on the map
Park in Carnegie: (1) . Display/hide its location on the map
Hotel:
Birthplace of: Honus Wagner - Major League Baseball player, Skip Prosser - Basketball player-coach, Bernie Faloney - Football player, Jack Joyce - Horse trainer, James H. Duff - Politician, James Michael Newell - Artist, George Haudenshield - Politician, Martin Kottler - Early professional football player, Steve Profeta - College basketball player (St. Francis (PA) Red Flash), Travis MacKenzie - Soccer player.
Allegheny County has a predicted average indoor radon screening level greater than 4 pCi/L (pico curies per liter) - Highest Potential Average household size: This borough:
2.0 peoplePennsylvania:
2.5 people
Percentage of family households: This borough:
50.6%Whole state:
65.0%
Percentage of households with unmarried partners: This borough:
8.0%Whole state:
6.6%
Likely homosexual households (counted as self-reported same-sex unmarried-partner households)
Lesbian couples: 0.4% of all households Gay men: 0.6% of all households
12 people in group homes intended for adults in 2010people in residential treatment centers for adults in 2010people in homes for the mentally retarded in 2000people in religious group quarters in 2000
Banks with branches in Carnegie (2011 data):
Northwest Savings Bank: First Carnegie Deposit Branch at 242 East Main Street, branch established on 1924/01/01. Info updated 2009/11/23: Bank assets: $7,975.9 mil, Deposits: $5,985.6 mil, headquarters in Warren, PA, positive income , Mortgage Lending Specialization, 172 total offices
Fidelity Savings Bank: Carnegie Branch at 100 Broadway Street, branch established on 1915/01/01. Info updated 2006/11/03: Bank assets: $656.4 mil, Deposits: $460.7 mil, headquarters in Pittsburgh, PA, positive income , 13 total offices , Holding Company: Fidelity Bancorp, Inc.
PNC Bank, National Association: Carnegie Branch at 2 West Main Street, branch established on 1899/01/01. Info updated 2012/03/20: Bank assets: $263,309.6 mil, Deposits: $197,343.0 mil, headquarters in Wilmington, DE, positive income , Commercial Lending Specialization, 3085 total offices , Holding Company: Pnc Financial Services Group, Inc., The
Citizens Bank of Pennsylvania: Carnegie Branch at West Mall Plaza, branch established on 1952/04/21. Info updated 2010/09/24: Bank assets: $32,316.9 mil, Deposits: $25,297.1 mil, headquarters in Philadelphia, PA, positive income , 396 total offices , Holding Company: Uk Financial Investments Limited
For population 15 years and over in Carnegie:
Never married: 38.4%Now married: 40.4%Separated: 0.8%Widowed: 8.0%Divorced: 12.4% For population 25 years and over in Carnegie:
High school or higher: 95.4%Bachelor's degree or higher: 33.6%Graduate or professional degree: 9.6%Unemployed: 6.7%Mean travel time to work (commute): 19.3 minutes
Education Gini index (Inequality in education) Here:
9.7Pennsylvania average:
11.4
Religion statistics for Carnegie, PA (based on Allegheny County data)
Religion Adherents Congregations Catholic 460,672 183 Mainline Protestant 139,551 414 Evangelical Protestant 78,101 349 Other 38,781 98 Black Protestant 14,268 75 Orthodox 9,606 29 None 482,369 -
Source: Clifford Grammich, Kirk Hadaway, Richard Houseal, Dale E.Jones, Alexei Krindatch, Richie Stanley and Richard H.Taylor. 2012. 2010 U.S.Religion Census: Religious Congregations & Membership Study. Association of Statisticians of American Religious Bodies. Jones, Dale E., et al. 2002. Congregations and Membership in the United States 2000. Nashville, TN: Glenmary Research Center. Graphs represent county-level data
Food Environment Statistics: Number of grocery stores : 209Allegheny County :
1.72 / 10,000 pop.Pennsylvania :
2.04 / 10,000 pop.
Number of supercenters and club stores : 11This county :
0.09 / 10,000 pop.State :
0.09 / 10,000 pop.
Number of convenience stores (no gas) : 133Allegheny County :
1.09 / 10,000 pop.Pennsylvania :
0.88 / 10,000 pop.
Number of convenience stores (with gas) : 297Here :
2.44 / 10,000 pop.Pennsylvania :
2.52 / 10,000 pop.
Number of full-service restaurants : 993Allegheny County :
8.15 / 10,000 pop.Pennsylvania :
7.12 / 10,000 pop.
Adult diabetes rate : Allegheny County :
8.7%State :
9.1%
Adult obesity rate : This county :
26.3%Pennsylvania :
27.2%
Low-income preschool obesity rate : This county :
12.9%Pennsylvania :
11.5%
Health and Nutrition: Healthy diet rate : Carnegie:
54.8%Pennsylvania:
50.2%
Average overall health of teeth and gums : This city:
53.9%Pennsylvania:
47.1%
Average BMI : Here:
28.3Pennsylvania:
28.7
People feeling badly about themselves : Carnegie:
17.9%Pennsylvania:
20.8%
People not drinking alcohol at all : Average hours sleeping at night : Carnegie:
6.9Pennsylvania:
6.8
Overweight people : Carnegie:
34.9%Pennsylvania:
34.3%
General health condition : This city:
60.5%Pennsylvania:
56.2%
Average condition of hearing : Carnegie:
79.6%Pennsylvania:
78.3%
More about Health and Nutrition of Carnegie, PA Residents
Local government employment and payroll (March 2022)
Function
Full-time employees
Monthly full-time payroll
Average yearly full-time wage
Part-time employees
Monthly part-time payroll
Police Protection - Officers
11 $102,231 $111,525 0 $0 Streets and Highways
8 $42,803 $64,205 0 $0 Police - Other
2 $8,037 $48,222 0 $0 Financial Administration
2 $6,723 $40,338 0 $0 Other Government Administration
1 $7,739 $92,868 14 $48,625
Totals for Government
24 $167,533 $83,767 14 $48,625
Carnegie government finances - Expenditure in 2021 (per resident):
Construction - Housing and Community Development: $78,000 ($9.84)
Current Operations - Sewerage: $2,326,000 ($293.50)
Police Protection: $1,372,000 ($173.12)Regular Highways: $1,267,000 ($159.87)General - Other: $973,000 ($122.78)Local Fire Protection: $261,000 ($32.93)Central Staff Services: $238,000 ($30.03)General Public Buildings: $95,000 ($11.99)Financial Administration: $88,000 ($11.10)Libraries: $88,000 ($11.10)Protective Inspection and Regulation - Other: $79,000 ($9.97)Housing and Community Development: $78,000 ($9.84)Parking Facilities: $76,000 ($9.59)Judicial and Legal Services: $72,000 ($9.09)Parks and Recreation: $21,000 ($2.65)Natural Resources - Other: $17,000 ($2.15)Health - Other: $4,000 ($0.50)General - Interest on Debt: $165,000 ($20.82)
Other Capital Outlay - Regular Highways: $73,000 ($9.21)
Police Protection: $53,000 ($6.69)Total Salaries and Wages: $2,292,000 ($289.21)
Carnegie government finances - Revenue in 2021 (per resident):
Charges - Sewerage: $2,507,000 ($316.34)
Parking Facilities: $140,000 ($17.67)Other: $104,000 ($13.12)Parks and Recreation: $9,000 ($1.14)Federal Intergovernmental - Other: $125,000 ($15.77)
Local Intergovernmental - Other: $190,000 ($23.97)
Miscellaneous - Rents: $68,000 ($8.58)
Fines and Forfeits: $29,000 ($3.66)Interest Earnings: $20,000 ($2.52)General Revenue - Other: $8,000 ($1.01)Donations From Private Sources: $4,000 ($0.50)State Intergovernmental - Other: $312,000 ($39.37)
Highways: $240,000 ($30.28)General Local Government Support: $7,000 ($0.88)Tax - Property: $2,543,000 ($320.88)
Individual Income: $1,091,000 ($137.67)Occupation and Business License - Other: $380,000 ($47.95)Documentary and Stock Transfer: $167,000 ($21.07)Public Utility License: $93,000 ($11.74)
Carnegie government finances - Debt in 2021 (per resident):
Long Term Debt - Beginning Outstanding - Unspecified Public Purpose: $4,546,000 ($573.63)
Outstanding Unspecified Public Purpose: $4,214,000 ($531.74)Retired Unspecified Public Purpose: $332,000 ($41.89)
Carnegie government finances - Cash and Securities in 2021 (per resident):
Other Funds - Cash and Securities: $3,115,000 ($393.06)
4.01% of this county's 2021 resident taxpayers lived in other counties in 2020 ($71,916 average adjusted gross income )
Here:
4.01%Pennsylvania average:
5.27%
0.01% of residents moved from foreign countries ($162 average AGI )Allegheny County:
0.01%Pennsylvania average:
0.01%
Top counties from which taxpayers relocated into this county between 2020 and 2021:
4.90% of this county's 2020 resident taxpayers moved to other counties in 2021 ($87,789 average adjusted gross income )
Here:
4.90%Pennsylvania average:
5.44%
0.01% of residents moved to foreign countries ($61 average AGI )Allegheny County:
0.01%Pennsylvania average:
0.01%
Top counties to which taxpayers relocated from this county between 2020 and 2021:
Businesses in Carnegie, PA
Name Count Name Count
Advance Auto Parts 1 RadioShack 1 CVS 1 Rite Aid 1 Curves 1 Subway 2 Dairy Queen 1 T-Mobile 1 Extended Stay America 1 U-Haul 2 FedEx 5 UPS 6 Little Caesars Pizza 1 Walgreens 1 Long John Silver's 1 Walmart 1 Lowe's 1
Strongest AM radio stations in Carnegie:
WZUM (1590 AM; 4 kW; CARNEGIE, PA; Owner: HORVATH BROADCASTING, L.L.C.)
KDKA (1020 AM; 50 kW; PITTSBURGH, PA; Owner: INFINITY BROADCASTING OPERATIONS, INC.)
WPIT (730 AM; 5 kW; PITTSBURGH, PA; Owner: PENNSYLVANIA MEDIA ASSOCIATES, INC.)
WEAE (1250 AM; 5 kW; PITTSBURGH, PA; Owner: ABC, INC.)
WWCS (540 AM; 5 kW; CANONSBURG, PA; Owner: BIRACH BROADCASTING CORPORATION)
WBGG (970 AM; 5 kW; PITTSBURGH, PA; Owner: AMFM RADIO LICENSES, L.L.C.)
WPTT (1360 AM; 5 kW; MCKEESPORT, PA; Owner: RENDA BROADCASTING CORPORATION OF NEVADA)
WJAS (1320 AM; 6 kW; PITTSBURGH, PA; Owner: RENDA BROADCASTING CORP. OF NEVADA)
KQV (1410 AM; 5 kW; PITTSBURGH, PA; Owner: CALVARY, INC.)
WWVA (1170 AM; 53 kW; WHEELING, WV; Owner: CAPSTAR TX LIMITED PARTNERSHIP)
WPGR (1510 AM; 5 kW; MONROEVILLE, PA; Owner: MCL/ MCM- INC.)
WAMO (860 AM; 1 kW; MILLVALE, PA; Owner: SHERIDAN BROADCASTING CORPORATION)
WKHB (620 AM; 6 kW; IRWIN, PA; Owner: BROADCAST COMMUNICATIONS, INC.)
Strongest FM radio stations in Carnegie:
WSHH (99.7 FM; PITTSBURGH, PA; Owner: RENDA B/CING CORP. OF NEVADA)
WBZZ (93.7 FM; PITTSBURGH, PA; Owner: INFINITY RADIO SUBSIDIARY OPERATIONS INC.)
WWSW-FM (94.5 FM; PITTSBURGH, PA; Owner: AMFM RADIO LICENSES, L.L.C.)
WLTJ (92.9 FM; PITTSBURGH, PA; Owner: WPNT, INC.)
WDSY-FM (107.9 FM; PITTSBURGH, PA; Owner: INFINITY RADIO SUBSIDIARY OPERATIONS INC.)
WDUQ (90.5 FM; PITTSBURGH, PA; Owner: DUQUESNE UNIVERSITY)
WDVE (102.5 FM; PITTSBURGH, PA; Owner: CAPSTAR TX LIMITED PARTNERSHIP)
WJJJ (104.7 FM; PITTSBURGH, PA; Owner: CAPSTAR TX LIMITED PARTNERSHIP)
WQED-FM (89.3 FM; PITTSBURGH, PA; Owner: WQED MULTIMEDIA)
WKST-FM (96.1 FM; PITTSBURGH, PA; Owner: CAPSTAR TX LIMITED PARTNERSHIP)
WORD-FM (101.5 FM; PITTSBURGH, PA; Owner: PENNSYLVANIA MEDIA ASSOCIATES, INC.)
WOGI (98.3 FM; DUQUESNE, PA; Owner: KEYMARKET LICENSES, LLC)
WRRK (96.9 FM; BRADDOCK, PA; Owner: WPNT INC)
WPTS-FM (92.1 FM; PITTSBURGH, PA; Owner: UNIV. OF PITTSBURGH COMMONWEALTH SYS)
WXDX-FM (105.9 FM; PITTSBURGH, PA; Owner: CAPSTAR TX LIMITED PARTNERSHIP)
WYEP-FM (91.3 FM; PITTSBURGH, PA; Owner: PITTSBURGH COMM. B/CING. CORP.)
WZPT (100.7 FM; NEW KENSINGTON, PA; Owner: INFINITY RADIO SUBSIDIARY OPERATIONS INC.)
WOGF (104.3 FM; EAST LIVERPOOL, OH; Owner: KEYMARKET LICENSES, LLC)
WOGH (103.5 FM; BURGETTSTOWN, PA; Owner: KEYMARKET LICENSES, LLC)
W249BD (97.7 FM; WEST VIEW, PA; Owner: FAMILY STATIONS, INC.)
TV broadcast stations around Carnegie:
WPXI (Channel 11; PITTSBURGH, PA; Owner: WPXI-TV HOLDINGS, INC.)
KDKA-TV (Channel 2; PITTSBURGH, PA; Owner: CBS BROADCASTING INC.)
WBGN-LP (Channel 59; PITTSBURGH, PA; Owner: BRUNO GOODWORTH NETWORK, INC.)
WPTG-LP (Channel 69; PITTSBURGH, PA; Owner: ABACUS TELEVISION)
WQEX (Channel 16; PITTSBURGH, PA; Owner: WQED MULTIMEDIA)
W63AU (Channel 63; PITTSBURGH, PA; Owner: THE BON-TELE NETWORK, INC.)
W65CG (Channel 65; PITTSBURGH, PA; Owner: TRINITY BROADCASTING NETWORK)
WPGH-TV (Channel 53; PITTSBURGH, PA; Owner: WPGH LICENSEE, LLC)
WBPA-LP (Channel 29; PITTSBURGH, PA; Owner: VENTURE TECHNOLOGIES GROUP, LLC)
WQED (Channel 13; PITTSBURGH, PA; Owner: WQED MULTIMEDIA)
W61CC (Channel 61; PITTSBURGH, PA; Owner: THE VIDEOHOUSE, INC.)
WIIC-LP (Channel 29; PITTSBURGH, PA; Owner: ABACUS TELEVISION)
WBYD-CA (Channel 35; JOHNSTOWN, PA; Owner: BENJAMIN PEREZ)
WTOV-TV (Channel 9; STEUBENVILLE, OH; Owner: WTOV-TV HOLDINGS, INC.)
WTAE-TV (Channel 4; PITTSBURGH, PA; Owner: WTAE HEARST-ARGYLE TV, INC. (CA CORP.))
WPCB-TV (Channel 40; GREENSBURG, PA; Owner: CORNERSTONE TELEVISION, INC.)
WCWB (Channel 22; PITTSBURGH, PA; Owner: WCWB LICENSEE, LLC)
W25CI (Channel 25; STEUBENVILLE, OH; Owner: ABACUS TELEVISION)
W57BH (Channel 57; WEIRTON, WV; Owner: TURNPIKE TELEVISION)
W66BQ (Channel 66; BEAVER, PA; Owner: BRUNO-GOODWORTH NETWORK, INC.)
W20AN (Channel 20; WASHINGTON, PA; Owner: TURNPIKE TELEVISION)
W26AV (Channel 26; CHARLEROI, PA; Owner: DEBRA GOODWORTH)
National Bridge Inventory (NBI) Statistics 25 Number of bridges367ft / 112m Total length $9,403,000 Total costs410,157 Total average daily traffic35,595 Total average daily truck traffic
New bridges - historical statistics
1 1900-1909 1 1920-1929 1 1930-1939 3 1950-1959 1 1960-1969 9 1970-1979 2 1980-1989 1 1990-1999 6 2000-2009
See full National Bridge Inventory statistics for Carnegie, PA
FCC Registered Antenna Towers: 52 (
See the full list of FCC Registered Antenna Towers in Carnegie )
FCC Registered Broadcast Land Mobile Towers: 11 (
See the full list of FCC Registered Broadcast Land Mobile Towers in Carnegie, PA )
FCC Registered Microwave Towers: 4
PIT0410, 208 Mcmichael Road (Lat: 40.425556 Lon: -80.142500), Type: Pole, Structure height: 33.5 m, Overall height: 35 m, Call Sign: WQFE593, Assigned Frequencies: 11285.0 MHz, 11405.0 MHz, Grant Date: 06/27/2006, Expiration Date: 06/27/2016, Cancellation Date: 09/20/2007, Certifier: Eric M Botto, Registrant: Fibertower Corporation, 1730 Rhode Island Avenue Nw Suite 317, Washington, DC 20036, Phone: (703) 873-4175, Fax: (202) 315-3415, Email:
PIT0406, Doolittle Ave (Lat: 40.410000 Lon: -80.097222), Type: Tower, Structure height: 91.4 m, Overall height: 95.7 m, Call Sign: WQFE611, Licensee ID: L01728370, Assigned Frequencies: 19460.0 MHz, Grant Date: 06/27/2006, Expiration Date: 06/27/2016, Cancellation Date: 08/16/2013, Certifier: Joseph M Sandri Jr., Registrant: Fibertower Network Services, Corp., Debtor-In-Possession, 1875 Eye Street, Nw, 5th Floor, Room 505, Washington, DC 20006, Phone: (202) 223-1028, Email:
PA-PIT024A, Doolittle Ave (Lat: 40.410000 Lon: -80.097222), Type: Tower, Structure height: 91.5 m, Overall height: 95.7 m, Call Sign: WQMA409, Assigned Frequencies: 11545.0 MHz, 11625.0 MHz, 21875.0 MHz, 21425.0 MHz, 22025.0 MHz, Grant Date: 06/10/2010, Expiration Date: 06/10/2020, Cancellation Date: 06/09/2020, Certifier: Nadja S Sodos-Wallace, Registrant: Sprint Corporation, 12502 Sunrise Valley Drive, M/S: Varesa0209, Reston, VA 20196, Phone: (800) 572-8256, Fax: (703) 433-4483, Email:
PA-PIT134A, 302 E. Main Street (Lat: 40.409333 Lon: -80.084083), Type: Bant, Structure height: 19.8 m, Call Sign: WQMA490, Assigned Frequencies: 22625.0 MHz, Grant Date: 06/11/2010, Expiration Date: 06/11/2020, Cancellation Date: 06/09/2020, Certifier: Nadja S Sodos-Wallace, Registrant: Sprint Corporation, 12502 Sunrise Valley Drive, M/S: Varesa0209, Reston, VA 20196, Phone: (800) 572-8256, Fax: (703) 433-4483, Email:
FCC Registered Amateur Radio Licenses: 58 (
See the full list of FCC Registered Amateur Radio Licenses in Carnegie )
FAA Registered Aircraft Manufacturers and Dealers: 1
WRIGHT AVIATION INC, 419 E Main St, Carnegie, PA 15106Certificate: 03-1966 (Corporation), Certificate Issue Date: 12/02/2003, Expiration Date: 12/01/2004 FAA Registered Aircraft: 6
Aircraft: MOONEY M20J (Category: Land, Seats: 4, Weight: Up to 12,499 Pounds, Speed: 126 mph), Engine: LYCOMING I0360 SER (180 HP) (Reciprocating)N-Number: 201LE, N201LE, N-201LE, Serial Number: 24-0480, Year manufactured: 1978, Airworthiness Date: 02/28/1978, Certificate Issue Date: 10/23/2015Registrant (LLC): Fun Fly Aviation LLC, 212 Overlook Dr, Carnegie, PA 15106Aircraft: CESSNA 550 (Category: Land, Engines: 2, Seats: 8, Weight: 12,500 - 19,999 Pounds), Engine: P&W CANADA JT15D-4 (2500 Pounds of Thrust) (Turbo-fan)N-Number: 37MH, N37MH, N-37MH, Serial Number: 550-0153, Year manufactured: 1980, Airworthiness Date: 07/02/1980, Certificate Issue Date: 08/25/2015Registrant (Corporation): Beech Air Inc, 801 W Main St, Carnegie, PA 15106Aircraft: CESSNA 172K (Category: Land, Seats: 4, Weight: Up to 12,499 Pounds, Speed: 105 mph), Engine: LYCOMING 0-320 SERIES (180 HP) (4 Cycle)N-Number: 84541, N84541, N-84541, Serial Number: 17258516, Year manufactured: 1969, Airworthiness Date: 08/23/1969, Certificate Issue Date: 09/22/2000Registrant (Individual): Kenneth J Stack, 602 Reamer Dr, Carnegie, PA 15106Aircraft: DJI PHANTOM 3 PROFESSION (Category: Land, Engines: 4), Engine: ElectricN-Number: 636HA, N636HA, N-636HA, Serial Number: P76DCD23012852, Certificate Issue Date: 12/10/2015Registrant (LLC): Apiary Productions LLC, 834 Washington Ave Apt 301, Carnegie, PA 15106Deregistered: Cancel Date: 05/02/2019Aircraft: CESSNA 310K (Category: Land, Engines: 2, Seats: 6, Weight: Up to 12,499 Pounds, Speed: 167 mph), Engine: CONT MOTOR I0-470 SERIES (260 HP) (Reciprocating)N-Number: 316G, N316G, N-316G, Serial Number: 310K0180, Year manufactured: 1966, Airworthiness Date: 03/30/1970, Certificate Issue Date: 05/07/2014Registrant (Corporation): Key Environmental Inc, 200 3rd Ave, Carnegie, PA 15106Aircraft: MOSER GEORG LANCAIR LEGACY FG (Category: Land, Seats: 2, Weight: Up to 12,499 Pounds), Engine: CONT MOTOR IO-550 SERIES (300 HP) (Reciprocating)N-Number: 515RB, N515RB, N-515RB, Serial Number: LS-205, Year manufactured: 2005, Airworthiness Date: 10/04/2005, Certificate Issue Date: 07/26/2007Registrant (Individual): Roger W Bock, 1 Scheffield Rd, Carnegie, PA 15106Deregistered: Cancel Date: 05/31/2017
Home Mortgage Disclosure Act Aggregated Statistics For Year 2009(Based on 3 full tracts) A) FHA, FSA/RHS & VA B) Conventional C) Refinancings D) Home Improvement Loans E) Loans on Dwellings For 5+ Families F) Non-occupant Loans on G) Loans On Manufactured Number Average Value Number Average Value Number Average Value Number Average Value Number Average Value Number Average Value Number Average Value
LOANS ORIGINATED 43 $95,163 36 $89,806 101 $97,198 13 $44,385 0 $0 13 $62,308 0 $0 APPLICATIONS APPROVED, NOT ACCEPTED 0 $0 1 $97,000 7 $89,571 0 $0 0 $0 0 $0 0 $0 APPLICATIONS DENIED 7 $89,286 7 $74,143 59 $90,542 20 $20,700 1 $75,000 9 $54,111 0 $0 APPLICATIONS WITHDRAWN 2 $77,500 4 $84,250 27 $104,593 3 $12,000 0 $0 1 $161,000 1 $92,000 FILES CLOSED FOR INCOMPLETENESS 0 $0 0 $0 6 $114,167 0 $0 0 $0 0 $0 0 $0
Aggregated Statistics For Year 2008(Based on 3 full tracts) A) FHA, FSA/RHS & VA B) Conventional C) Refinancings D) Home Improvement Loans E) Loans on Dwellings For 5+ Families F) Non-occupant Loans on G) Loans On Manufactured Number Average Value Number Average Value Number Average Value Number Average Value Number Average Value Number Average Value Number Average Value
LOANS ORIGINATED 31 $112,452 50 $106,120 40 $96,250 24 $31,833 3 $341,000 14 $105,857 0 $0 APPLICATIONS APPROVED, NOT ACCEPTED 3 $63,000 6 $125,500 9 $89,000 3 $17,000 0 $0 4 $114,000 1 $43,000 APPLICATIONS DENIED 6 $98,667 7 $80,000 59 $98,661 17 $30,471 0 $0 6 $95,500 1 $73,000 APPLICATIONS WITHDRAWN 4 $109,750 1 $132,000 23 $94,261 6 $15,333 0 $0 2 $99,500 0 $0 FILES CLOSED FOR INCOMPLETENESS 1 $64,000 2 $96,500 4 $113,750 2 $15,000 0 $0 0 $0 0 $0
Aggregated Statistics For Year 2007(Based on 3 full tracts) A) FHA, FSA/RHS & VA B) Conventional C) Refinancings D) Home Improvement Loans E) Loans on Dwellings For 5+ Families F) Non-occupant Loans on G) Loans On Manufactured Number Average Value Number Average Value Number Average Value Number Average Value Number Average Value Number Average Value Number Average Value
LOANS ORIGINATED 22 $115,955 105 $80,352 75 $71,253 24 $45,083 2 $136,500 23 $72,391 1 $28,000 APPLICATIONS APPROVED, NOT ACCEPTED 2 $119,000 12 $58,833 19 $81,474 7 $44,857 0 $0 10 $62,200 0 $0 APPLICATIONS DENIED 2 $102,000 14 $86,500 115 $91,287 39 $20,385 0 $0 17 $64,471 1 $64,000 APPLICATIONS WITHDRAWN 2 $75,000 16 $104,125 35 $99,029 2 $86,000 0 $0 2 $65,000 0 $0 FILES CLOSED FOR INCOMPLETENESS 0 $0 1 $93,000 14 $103,786 1 $25,000 0 $0 0 $0 0 $0
Aggregated Statistics For Year 2006(Based on 3 full tracts) A) FHA, FSA/RHS & VA B) Conventional C) Refinancings D) Home Improvement Loans F) Non-occupant Loans on Number Average Value Number Average Value Number Average Value Number Average Value Number Average Value
LOANS ORIGINATED 25 $107,480 119 $81,118 114 $75,895 37 $26,027 29 $62,448 APPLICATIONS APPROVED, NOT ACCEPTED 0 $0 18 $61,500 27 $75,704 2 $43,000 5 $31,600 APPLICATIONS DENIED 1 $74,000 25 $91,200 109 $80,138 29 $19,931 14 $48,286 APPLICATIONS WITHDRAWN 1 $112,000 14 $47,214 64 $83,656 3 $13,000 3 $46,000 FILES CLOSED FOR INCOMPLETENESS 0 $0 3 $106,667 18 $79,944 0 $0 1 $66,000
Aggregated Statistics For Year 2005(Based on 3 full tracts) A) FHA, FSA/RHS & VA B) Conventional C) Refinancings D) Home Improvement Loans E) Loans on Dwellings For 5+ Families F) Non-occupant Loans on G) Loans On Manufactured Number Average Value Number Average Value Number Average Value Number Average Value Number Average Value Number Average Value Number Average Value
LOANS ORIGINATED 15 $111,600 122 $74,918 133 $80,256 32 $39,312 1 $90,000 33 $56,970 0 $0 APPLICATIONS APPROVED, NOT ACCEPTED 0 $0 11 $107,000 27 $77,370 3 $46,000 0 $0 2 $70,000 1 $43,000 APPLICATIONS DENIED 1 $134,000 17 $82,412 121 $81,496 45 $35,844 0 $0 20 $43,000 1 $18,000 APPLICATIONS WITHDRAWN 1 $81,000 13 $73,231 67 $95,194 13 $115,308 1 $224,000 8 $93,625 0 $0 FILES CLOSED FOR INCOMPLETENESS 0 $0 3 $64,000 13 $123,615 2 $67,500 0 $0 1 $94,000 0 $0
Aggregated Statistics For Year 2004(Based on 3 full tracts) A) FHA, FSA/RHS & VA B) Conventional C) Refinancings D) Home Improvement Loans E) Loans on Dwellings For 5+ Families F) Non-occupant Loans on G) Loans On Manufactured Number Average Value Number Average Value Number Average Value Number Average Value Number Average Value Number Average Value Number Average Value
LOANS ORIGINATED 19 $83,158 100 $92,190 184 $77,245 47 $30,468 0 $0 40 $69,475 0 $0 APPLICATIONS APPROVED, NOT ACCEPTED 1 $73,000 11 $83,909 30 $68,767 17 $28,118 0 $0 10 $52,500 1 $38,000 APPLICATIONS DENIED 2 $92,500 25 $79,720 118 $76,322 54 $37,648 1 $352,000 36 $51,611 1 $7,000 APPLICATIONS WITHDRAWN 1 $106,000 11 $89,455 48 $84,062 5 $52,000 0 $0 2 $74,500 1 $25,000 FILES CLOSED FOR INCOMPLETENESS 0 $0 3 $113,667 52 $79,404 3 $58,000 0 $0 1 $33,000 0 $0
Aggregated Statistics For Year 2003(Based on 3 full tracts) A) FHA, FSA/RHS & VA B) Conventional C) Refinancings D) Home Improvement Loans E) Loans on Dwellings For 5+ Families F) Non-occupant Loans on Number Average Value Number Average Value Number Average Value Number Average Value Number Average Value Number Average Value
LOANS ORIGINATED 19 $81,316 82 $72,878 292 $71,014 28 $23,750 1 $104,000 46 $57,065 APPLICATIONS APPROVED, NOT ACCEPTED 2 $115,500 9 $58,667 74 $78,311 3 $18,667 1 $165,000 3 $54,667 APPLICATIONS DENIED 2 $86,500 18 $85,444 148 $76,912 29 $23,034 2 $231,500 17 $63,647 APPLICATIONS WITHDRAWN 1 $59,000 14 $66,429 41 $85,220 4 $12,750 0 $0 0 $0 FILES CLOSED FOR INCOMPLETENESS 1 $87,000 4 $65,250 17 $95,882 3 $19,333 0 $0 2 $62,500
Aggregated Statistics For Year 2002(Based on 3 full tracts) A) FHA, FSA/RHS & VA B) Conventional C) Refinancings D) Home Improvement Loans F) Non-occupant Loans on Number Average Value Number Average Value Number Average Value Number Average Value Number Average Value
LOANS ORIGINATED 19 $79,737 94 $78,617 191 $70,670 30 $30,800 31 $59,645 APPLICATIONS APPROVED, NOT ACCEPTED 2 $207,000 14 $79,000 49 $71,163 13 $19,308 3 $76,333 APPLICATIONS DENIED 4 $78,000 15 $58,400 114 $71,404 21 $20,857 12 $65,333 APPLICATIONS WITHDRAWN 1 $87,000 9 $85,111 58 $70,190 4 $18,500 2 $61,000 FILES CLOSED FOR INCOMPLETENESS 1 $49,000 3 $31,000 34 $69,353 0 $0 3 $50,333
Aggregated Statistics For Year 2001(Based on 3 full tracts) A) FHA, FSA/RHS & VA B) Conventional C) Refinancings D) Home Improvement Loans E) Loans on Dwellings For 5+ Families F) Non-occupant Loans on Number Average Value Number Average Value Number Average Value Number Average Value Number Average Value Number Average Value
LOANS ORIGINATED 29 $74,552 68 $77,265 155 $63,077 43 $27,209 1 $176,000 22 $52,818 APPLICATIONS APPROVED, NOT ACCEPTED 1 $48,000 14 $66,643 60 $56,383 11 $21,000 0 $0 7 $40,857 APPLICATIONS DENIED 0 $0 26 $69,346 140 $58,893 38 $18,132 0 $0 10 $45,400 APPLICATIONS WITHDRAWN 4 $98,000 6 $52,833 58 $70,103 12 $20,667 1 $150,000 7 $47,571 FILES CLOSED FOR INCOMPLETENESS 0 $0 1 $72,000 15 $65,333 0 $0 0 $0 1 $61,000
Aggregated Statistics For Year 2000(Based on 3 full tracts) A) FHA, FSA/RHS & VA B) Conventional C) Refinancings D) Home Improvement Loans F) Non-occupant Loans on Number Average Value Number Average Value Number Average Value Number Average Value Number Average Value
LOANS ORIGINATED 29 $69,621 53 $51,302 85 $58,200 32 $20,312 15 $61,867 APPLICATIONS APPROVED, NOT ACCEPTED 4 $76,000 7 $54,143 33 $54,727 23 $10,174 6 $47,167 APPLICATIONS DENIED 1 $67,000 16 $57,438 79 $57,861 33 $16,606 5 $46,200 APPLICATIONS WITHDRAWN 3 $83,667 10 $85,100 24 $47,958 6 $15,833 0 $0 FILES CLOSED FOR INCOMPLETENESS 0 $0 1 $53,000 17 $68,824 1 $22,000 0 $0
Aggregated Statistics For Year 1999(Based on 3 full tracts) A) FHA, FSA/RHS & VA B) Conventional C) Refinancings D) Home Improvement Loans E) Loans on Dwellings For 5+ Families F) Non-occupant Loans on Number Average Value Number Average Value Number Average Value Number Average Value Number Average Value Number Average Value
LOANS ORIGINATED 26 $70,665 53 $188,036 108 $51,491 35 $17,945 1 $146,600 16 $44,079 APPLICATIONS APPROVED, NOT ACCEPTED 0 $0 14 $56,298 47 $49,664 17 $17,956 0 $0 5 $32,300 APPLICATIONS DENIED 0 $0 13 $63,073 69 $53,372 34 $20,354 0 $0 4 $25,570 APPLICATIONS WITHDRAWN 1 $42,160 4 $33,870 48 $60,257 8 $24,789 0 $0 1 $44,550 FILES CLOSED FOR INCOMPLETENESS 0 $0 3 $106,763 14 $48,867 0 $0 0 $0 1 $19,880
Detailed HMDA statistics for the following Tracts:
4687.00
, 4688.00 , 4689.00
Private Mortgage Insurance Companies Aggregated Statistics For Year 2009(Based on 3 full tracts) A) Conventional B) Refinancings C) Non-occupant Loans on Number Average Value Number Average Value Number Average Value
LOANS ORIGINATED 12 $113,250 6 $111,167 0 $0 APPLICATIONS APPROVED, NOT ACCEPTED 3 $97,333 3 $89,333 1 $112,000 APPLICATIONS DENIED 0 $0 1 $105,000 0 $0 APPLICATIONS WITHDRAWN 0 $0 0 $0 0 $0 FILES CLOSED FOR INCOMPLETENESS 0 $0 0 $0 0 $0
Aggregated Statistics For Year 2008(Based on 3 full tracts) A) Conventional B) Refinancings C) Non-occupant Loans on Number Average Value Number Average Value Number Average Value
LOANS ORIGINATED 27 $98,037 9 $105,222 1 $92,000 APPLICATIONS APPROVED, NOT ACCEPTED 5 $104,000 5 $87,600 1 $97,000 APPLICATIONS DENIED 1 $105,000 1 $78,000 0 $0 APPLICATIONS WITHDRAWN 1 $112,000 0 $0 1 $112,000 FILES CLOSED FOR INCOMPLETENESS 0 $0 0 $0 0 $0
Aggregated Statistics For Year 2007(Based on 3 full tracts) A) Conventional B) Refinancings C) Non-occupant Loans on Number Average Value Number Average Value Number Average Value
LOANS ORIGINATED 37 $93,514 5 $97,600 1 $86,000 APPLICATIONS APPROVED, NOT ACCEPTED 4 $111,000 2 $122,500 0 $0 APPLICATIONS DENIED 0 $0 0 $0 0 $0 APPLICATIONS WITHDRAWN 2 $94,500 0 $0 0 $0 FILES CLOSED FOR INCOMPLETENESS 0 $0 0 $0 0 $0
Aggregated Statistics For Year 2006(Based on 3 full tracts) A) Conventional B) Refinancings C) Non-occupant Loans on Number Average Value Number Average Value Number Average Value
LOANS ORIGINATED 37 $90,027 7 $105,857 4 $75,750 APPLICATIONS APPROVED, NOT ACCEPTED 5 $131,800 2 $90,000 0 $0 APPLICATIONS DENIED 0 $0 0 $0 0 $0 APPLICATIONS WITHDRAWN 0 $0 0 $0 0 $0 FILES CLOSED FOR INCOMPLETENESS 1 $69,000 0 $0 0 $0
Aggregated Statistics For Year 2005(Based on 3 full tracts) A) Conventional B) Refinancings C) Non-occupant Loans on Number Average Value Number Average Value Number Average Value
LOANS ORIGINATED 15 $99,733 8 $94,125 2 $85,500 APPLICATIONS APPROVED, NOT ACCEPTED 3 $122,000 1 $116,000 2 $119,000 APPLICATIONS DENIED 0 $0 1 $40,000 0 $0 APPLICATIONS WITHDRAWN 1 $47,000 2 $120,500 1 $116,000 FILES CLOSED FOR INCOMPLETENESS 0 $0 0 $0 0 $0
Aggregated Statistics For Year 2004(Based on 3 full tracts) A) Conventional B) Refinancings C) Non-occupant Loans on Number Average Value Number Average Value Number Average Value
LOANS ORIGINATED 23 $96,391 14 $75,571 7 $62,571 APPLICATIONS APPROVED, NOT ACCEPTED 6 $114,667 9 $113,333 0 $0 APPLICATIONS DENIED 0 $0 3 $85,333 1 $116,000 APPLICATIONS WITHDRAWN 2 $93,500 1 $87,000 0 $0 FILES CLOSED FOR INCOMPLETENESS 1 $95,000 0 $0 0 $0
Aggregated Statistics For Year 2003(Based on 3 full tracts) A) Conventional B) Refinancings C) Non-occupant Loans on Number Average Value Number Average Value Number Average Value
LOANS ORIGINATED 28 $69,536 14 $98,000 5 $56,600 APPLICATIONS APPROVED, NOT ACCEPTED 9 $46,556 10 $83,300 1 $58,000 APPLICATIONS DENIED 1 $110,000 1 $93,000 1 $93,000 APPLICATIONS WITHDRAWN 3 $62,000 0 $0 0 $0 FILES CLOSED FOR INCOMPLETENESS 0 $0 0 $0 0 $0
Aggregated Statistics For Year 2002(Based on 3 full tracts) A) Conventional B) Refinancings C) Non-occupant Loans on Number Average Value Number Average Value Number Average Value
LOANS ORIGINATED 45 $88,600 19 $103,000 4 $80,000 APPLICATIONS APPROVED, NOT ACCEPTED 8 $97,750 5 $77,200 0 $0 APPLICATIONS DENIED 1 $107,000 0 $0 0 $0 APPLICATIONS WITHDRAWN 4 $93,500 3 $174,667 1 $126,000 FILES CLOSED FOR INCOMPLETENESS 1 $104,000 0 $0 0 $0
Aggregated Statistics For Year 2001(Based on 3 full tracts) A) Conventional B) Refinancings C) Non-occupant Loans on Number Average Value Number Average Value Number Average Value
LOANS ORIGINATED 28 $71,643 14 $83,214 4 $37,250 APPLICATIONS APPROVED, NOT ACCEPTED 3 $86,333 2 $73,500 0 $0 APPLICATIONS DENIED 0 $0 1 $54,000 0 $0 APPLICATIONS WITHDRAWN 0 $0 1 $87,000 0 $0 FILES CLOSED FOR INCOMPLETENESS 0 $0 0 $0 0 $0
Aggregated Statistics For Year 2000(Based on 3 full tracts) A) Conventional B) Refinancings C) Non-occupant Loans on Number Average Value Number Average Value Number Average Value
LOANS ORIGINATED 22 $65,273 3 $99,333 4 $57,750 APPLICATIONS APPROVED, NOT ACCEPTED 1 $66,000 2 $95,500 0 $0 APPLICATIONS DENIED 1 $126,000 0 $0 0 $0 APPLICATIONS WITHDRAWN 0 $0 0 $0 0 $0 FILES CLOSED FOR INCOMPLETENESS 0 $0 0 $0 0 $0
Aggregated Statistics For Year 1999(Based on 3 full tracts) A) Conventional B) Refinancings Number Average Value Number Average Value
LOANS ORIGINATED 11 $99,237 8 $68,791 APPLICATIONS APPROVED, NOT ACCEPTED 2 $84,800 0 $0 APPLICATIONS DENIED 2 $143,165 0 $0 APPLICATIONS WITHDRAWN 1 $112,330 0 $0 FILES CLOSED FOR INCOMPLETENESS 0 $0 0 $0
Detailed PMIC statistics for the following Tracts:
4687.00
, 4688.00 , 4689.00 Carnegie compared to Pennsylvania state average:
Unemployed percentage below state average. Hispanic race population percentage below state average. Foreign-born population percentage below state average. Renting percentage above state average. Length of stay since moving in above state average.
#34 on the list of "Top 101 cities with largest percentage of males in occupations: office and administrative support occupations (population 5,000+)"
#96 on the list of "Top 101 cities with the most residents born in Bosnia and Herzegovina (population 500+)"
#3 on the list of "Top 101 counties with the most Mainline Protestant congregations"
#3 on the list of "Top 101 counties with the most Catholic congregations"
#6 on the list of "Top 101 counties with the most Orthodox congregations"
#8 on the list of "Top 101 counties with the most Mainline Protestant adherents"
#15 on the list of "Top 101 counties with the most Catholic adherents (pop. 50,000+)"
Top Patent Applicants
Daniel W. Harrist (14)
Erik R. Bogdon (11)
James P. Mason (10)
Jay Scannell (5)
Gary L. Reinert (3)
Steven Fleck (3)
Jesse Schell (3)
Randy Jack Loeffler (3)
Peter Uthe (3)
Gregory K. Thomson (2)
Total of 99 patent applications in 2008-2024.
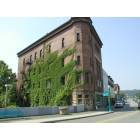
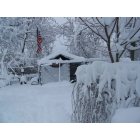
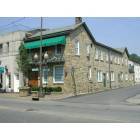
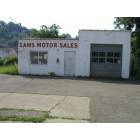
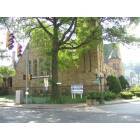
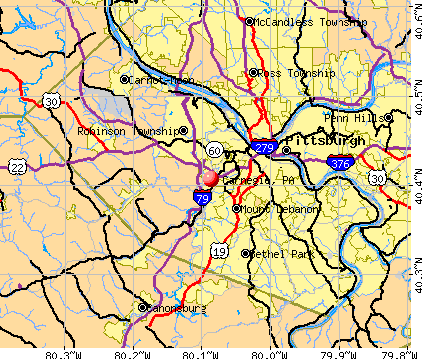


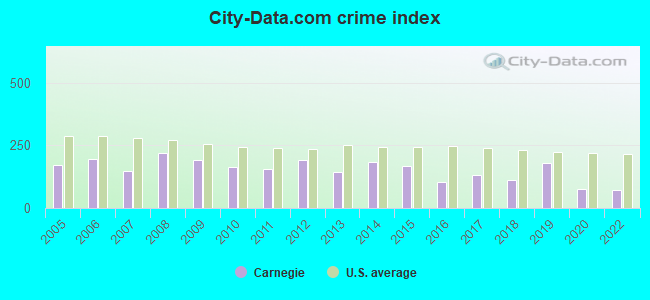
 Recent articles from our blog. Our writers, many of them Ph.D. graduates or candidates, create easy-to-read articles on a wide variety of topics.

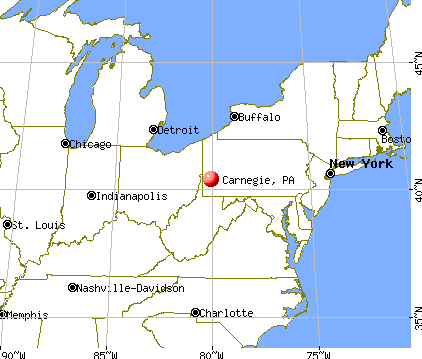
 (6.2 miles
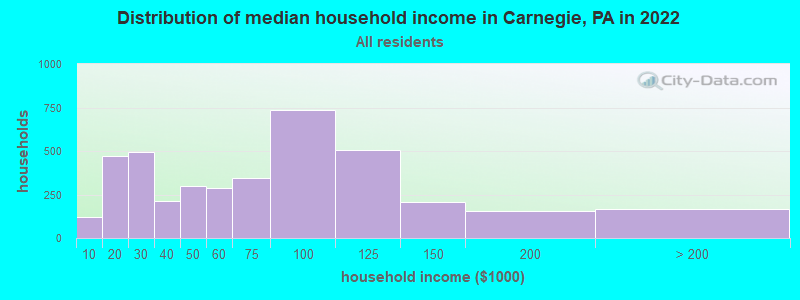
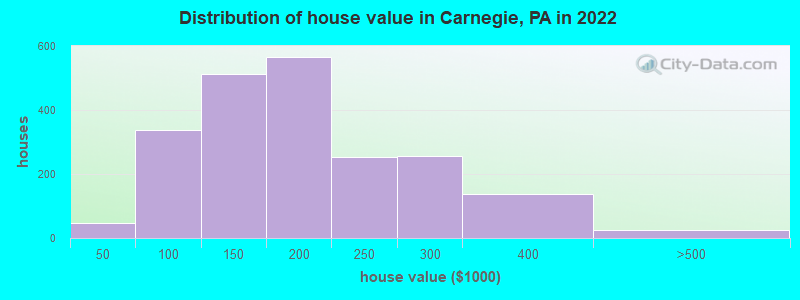

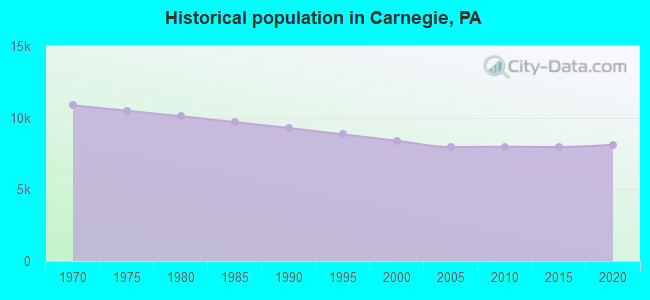
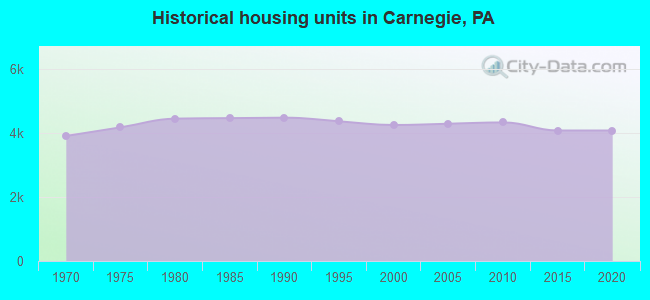
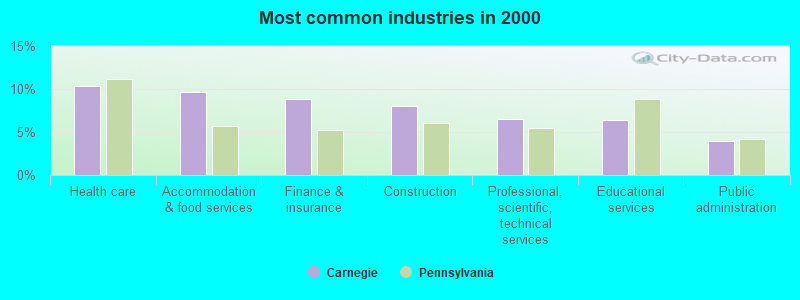
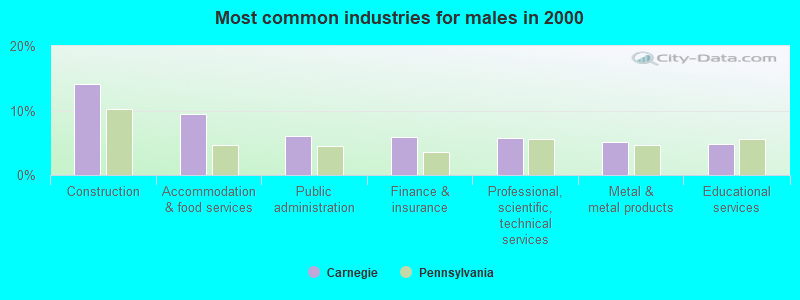
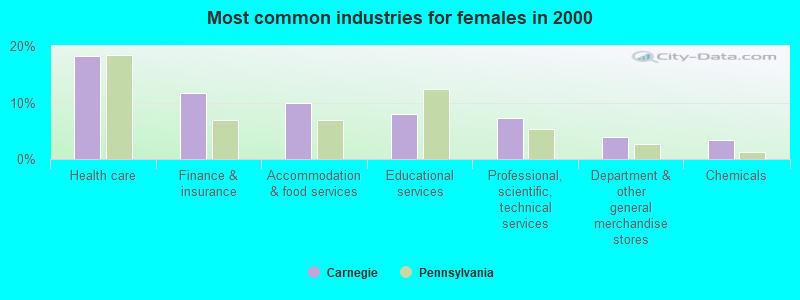
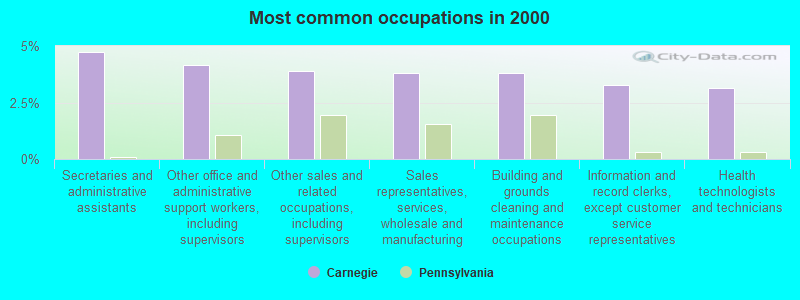
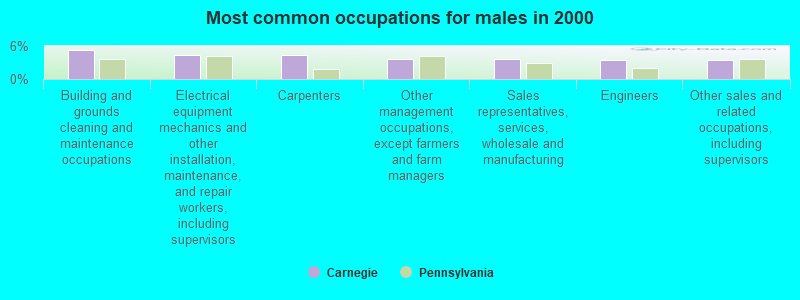
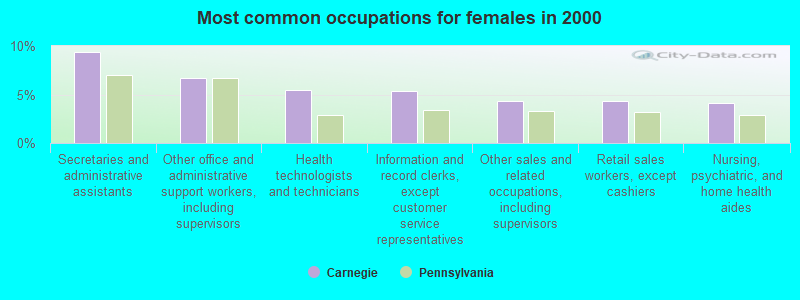
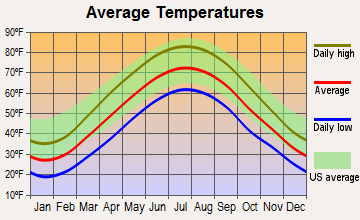
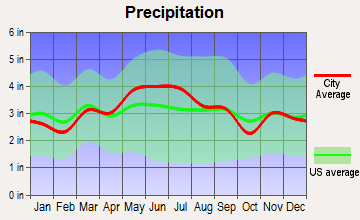
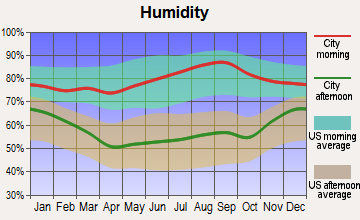
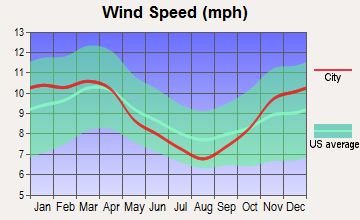
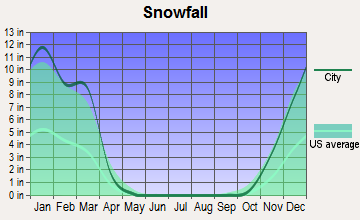
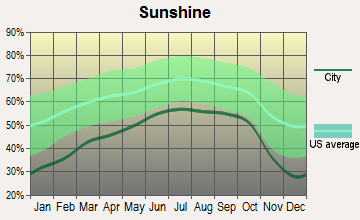
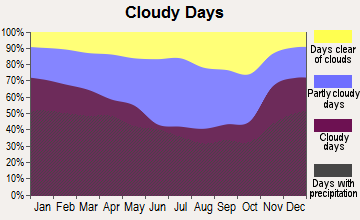
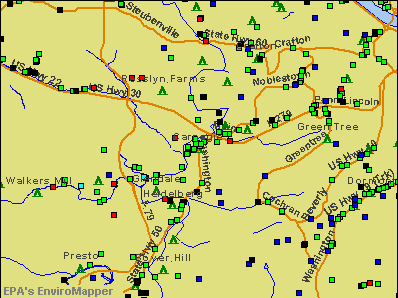

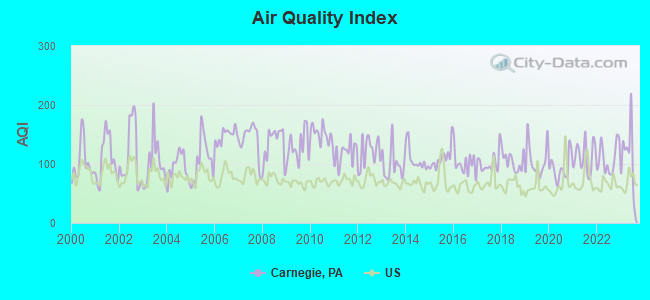
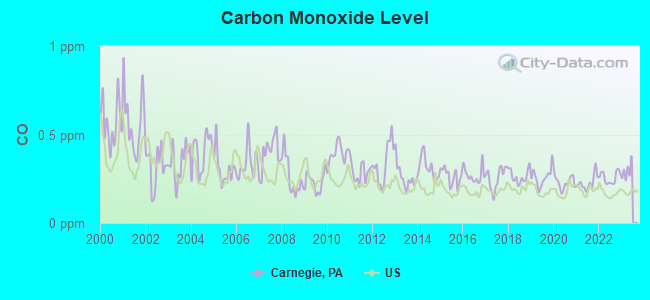
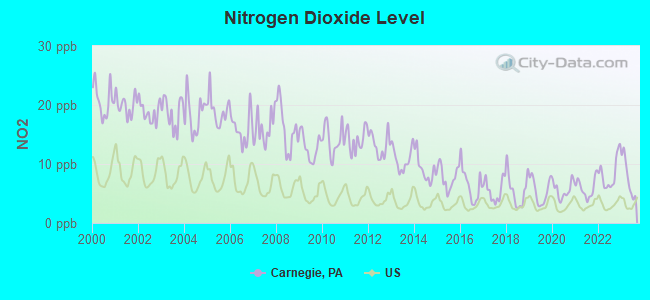
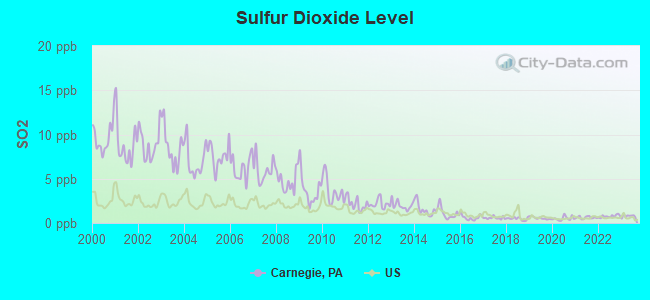
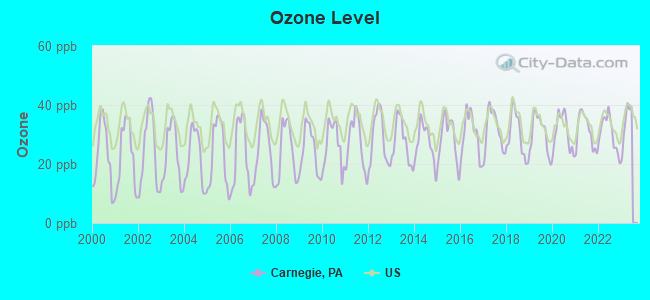
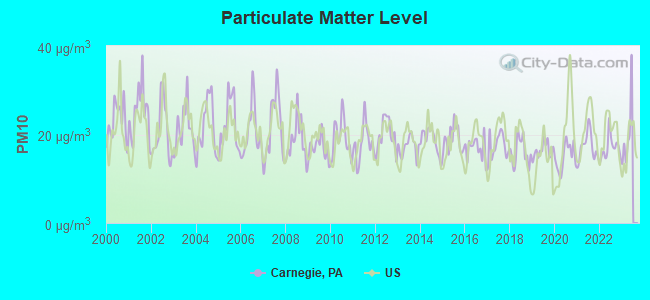
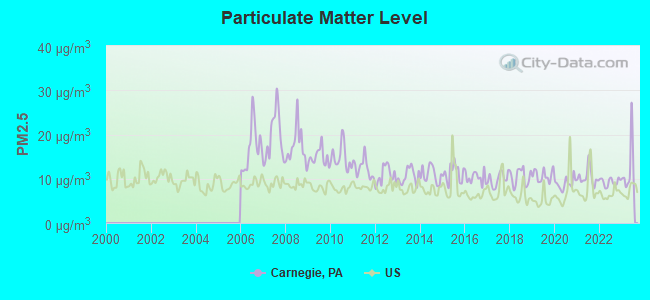
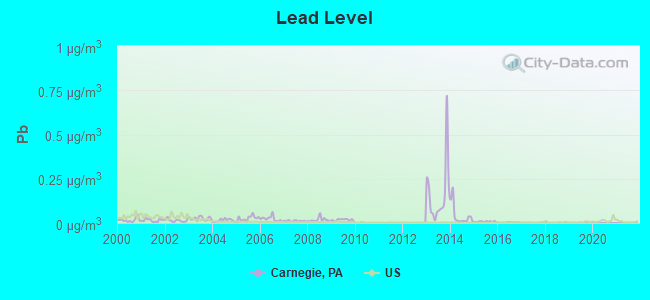

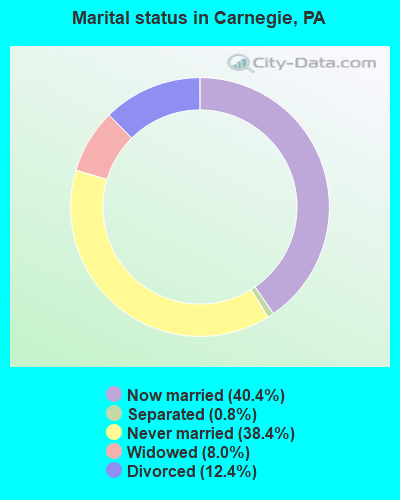
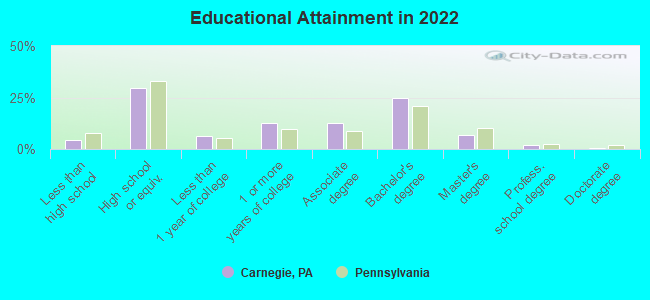
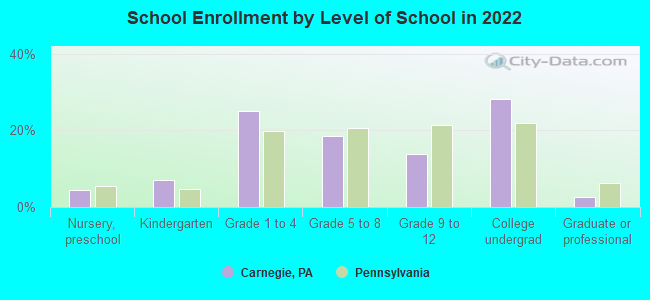
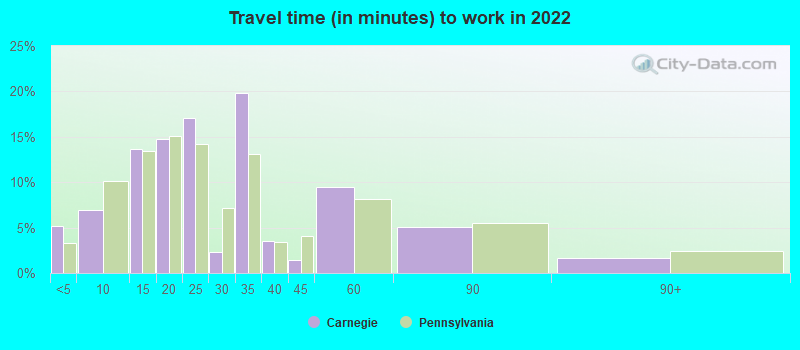
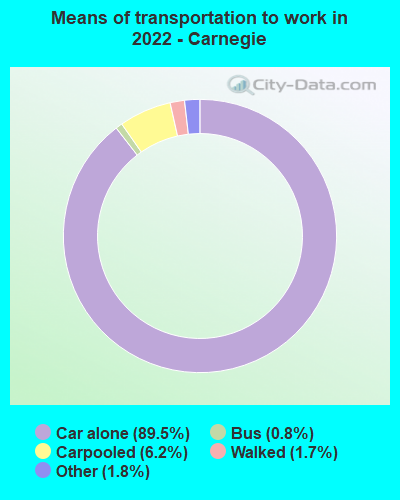
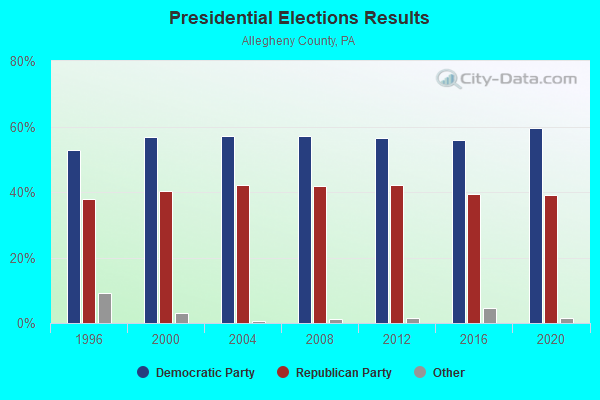
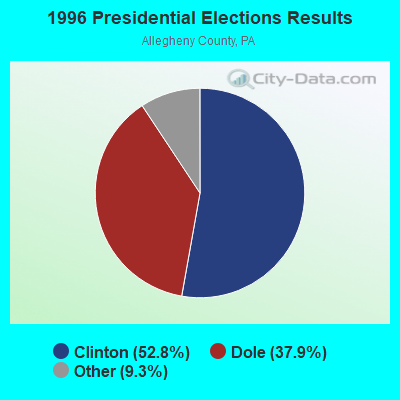
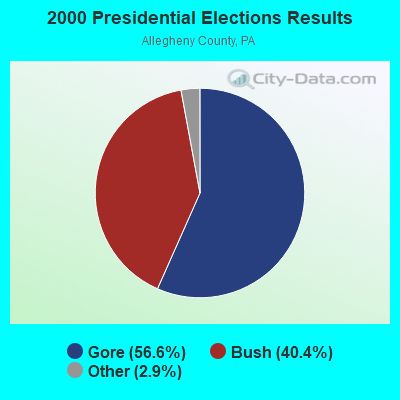
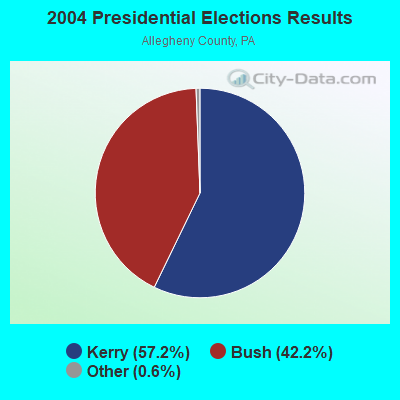

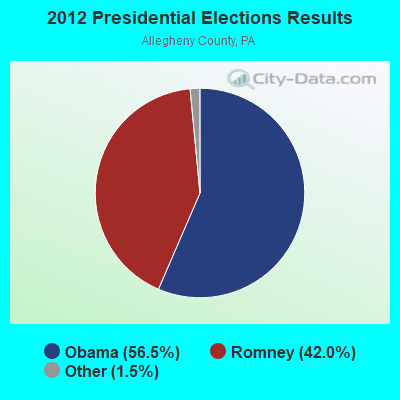
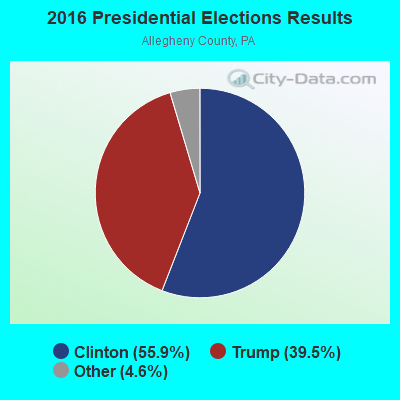
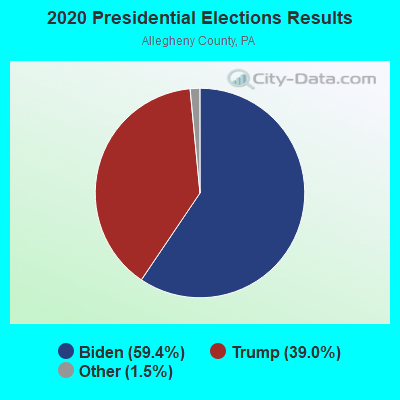
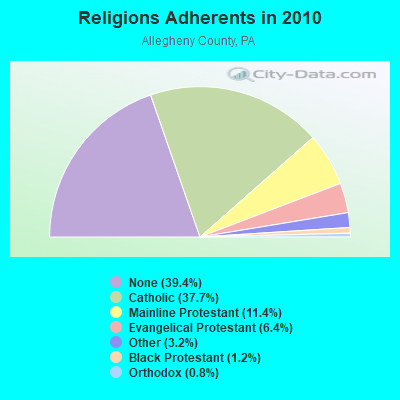
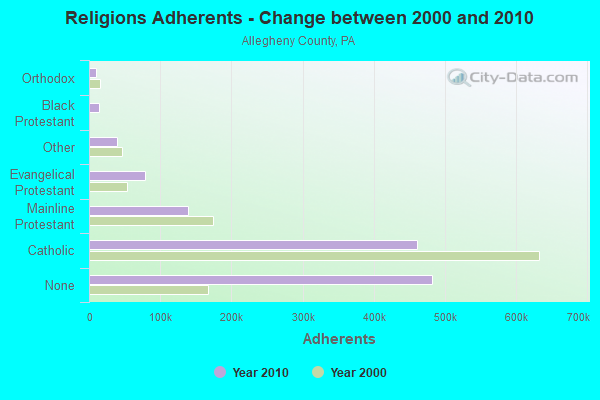
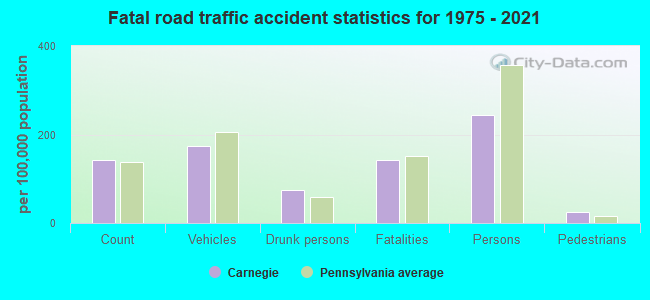
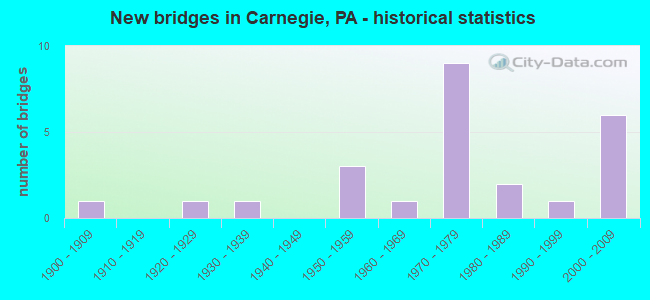
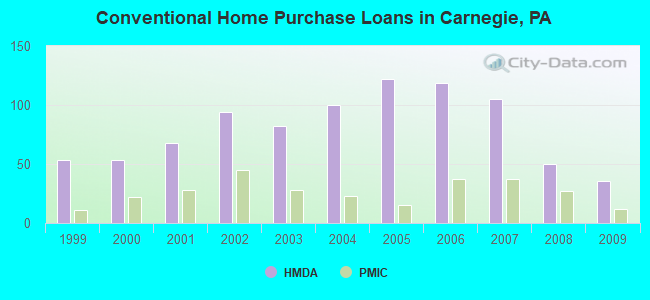
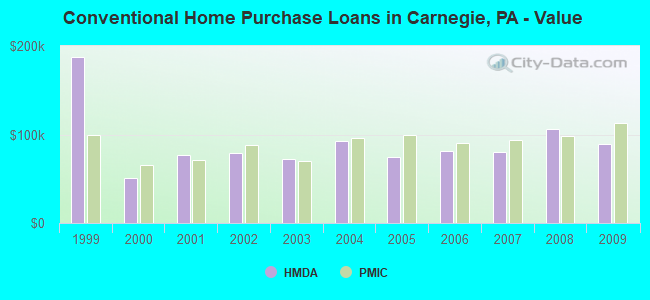
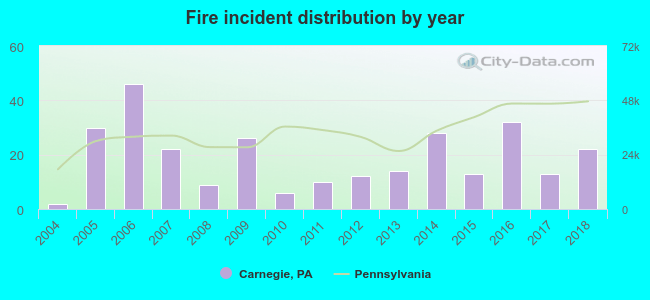 According to the data from the years 2004 - 2018 the average number of fires per year is 19. The highest number of reported fires - 46 took place in 2006, and the least - 2 in 2004. The data has a rising trend.
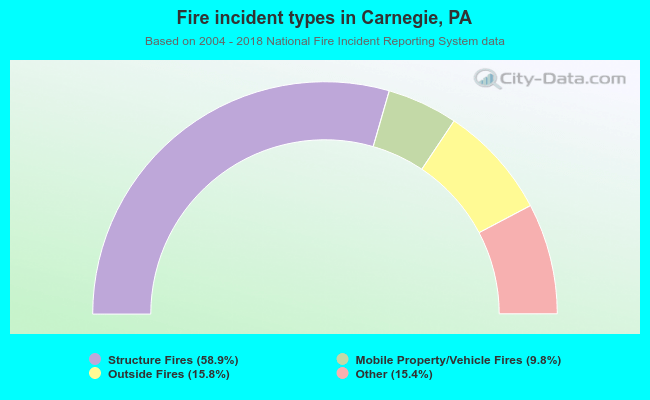 When looking into fire subcategories, the most reports belonged to: Structure Fires (58.9%), and Outside Fires (15.8%).