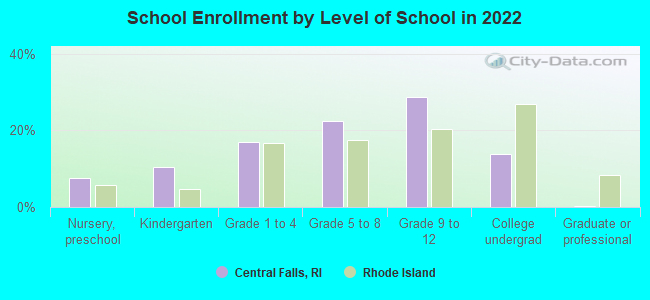
Central Falls, Rhode Island
Submit your own pictures of this city and show them to the world
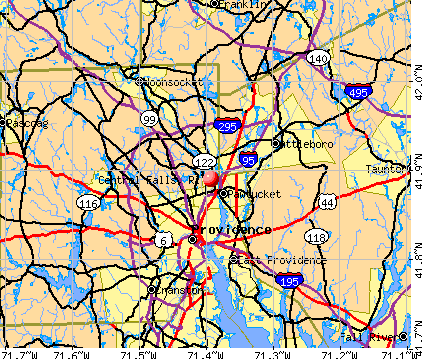
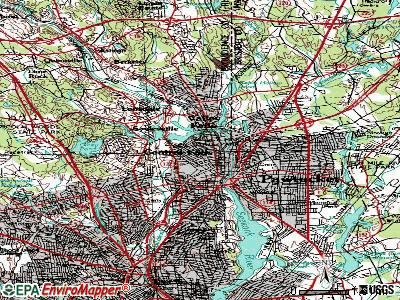
- OSM Map
- General Map
- Google Map
- MSN Map
Population change since 2000: +18.8%
 |
| Males: 11,898 | |
| Females: 10,592 |
| Median resident age: | 31.7 years |
| Rhode Island median age: | 40.7 years |
Zip codes: 02863.
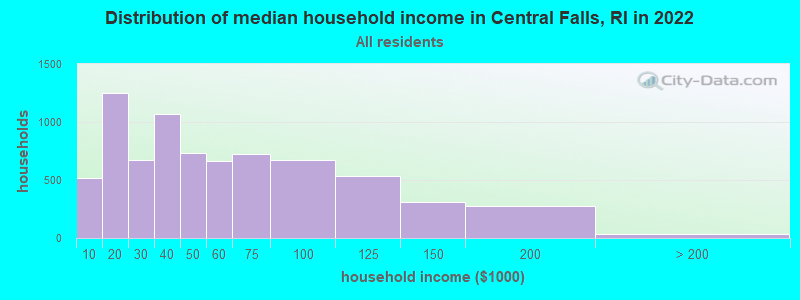
| Central Falls: | $44,703 |
| RI: | $81,854 |
Estimated per capita income in 2022: $20,240 (it was $10,825 in 2000)
Central Falls city income, earnings, and wages data
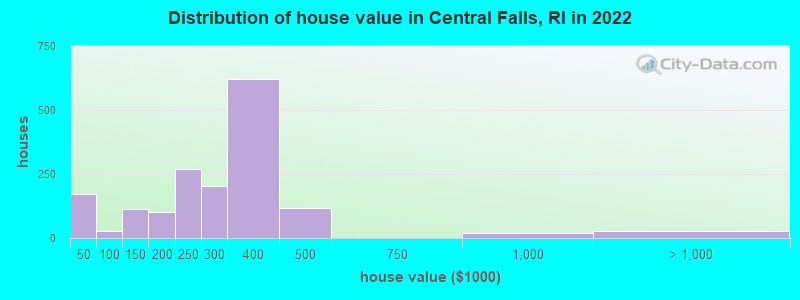
Estimated median house or condo value in 2022: $283,486 (it was $93,200 in 2000)
| Central Falls: | $283,486 |
| RI: | $383,900 |
Mean prices in 2022: all housing units: $259,165; detached houses: $265,757; townhouses or other attached units: $269,572; in 2-unit structures: $317,090; in 3-to-4-unit structures: $271,896; in 5-or-more-unit structures: $228,905
Median gross rent in 2022: $1,129.
(34.3% for White Non-Hispanic residents, 35.8% for Black residents, 22.0% for Hispanic or Latino residents, 22.6% for American Indian residents, 15.9% for other race residents, 26.2% for two or more races residents)
Detailed information about poverty and poor residents in Central Falls, RI


Compare current foreclosures near Central Falls, RI:
| Photo | Address | Area | Beds / Baths | Price | Details |
|---|---|---|---|---|---|

|
#1
Worth St
Central Falls, RI 02863
|
2,352 sq. feet
|
2 baths 6 beds |
show details | |

|
#2
Jenks St # 3
Central Falls, RI 02863
|
- sq. feet
|
- baths - beds |
show details | |

|
#3
Washington St
Central Falls, RI 02863
|
- sq. feet
|
- baths - beds |
show details | |

|
#4
Cook Rd
Cumberland, RI 02864
|
2,050 sq. feet
|
2 baths 4 beds |
$749,500
|
show details |

|
#5
Hebron Ave
Attleboro, MA 02703
|
2,939 sq. feet
|
4 baths 6 beds |
$559,900
|
show details |

|
#6
Horton St
North Dighton, MA 02764
|
816 sq. feet
|
1 baths 2 beds |
$259,900
|
show details |

|
#7
Loomis St
North Attleboro, MA 02760
|
2,294 sq. feet
|
2 baths 4 beds |
$700,000
|
show details |

|
#8
Somerset Ave
Taunton, MA 02780
|
3,196 sq. feet
|
3 baths 4 beds |
$754,900
|
show details |

|
#9
Mount Pleasant Rd
Harrisville, RI 02830
|
1,232 sq. feet
|
1 baths 3 beds |
$449,900
|
show details |

|
#10
Whittier Ave
Providence, RI 02909
|
3 sq. feet
|
3 baths 6 beds |
$109,900
|
show details |
| Photo | Address | Area | Beds / Baths | Price | Details |
|---|---|---|---|---|---|

|
#11
Guertin St
West Warwick, RI 02893
|
1,338 sq. feet
|
2 baths 4 beds |
show details | |

|
#12
Branch Ave
Providence, RI 02904
|
2,921 sq. feet
|
4 baths 6 beds |
show details | |

|
#13
Mount Hope St
North Attleboro, MA 02760
|
3,554 sq. feet
|
2 baths 4 beds |
show details | |

|
#14
Pinnery Ave
Warwick, RI 02886
|
1,299 sq. feet
|
1 baths 3 beds |
show details | |

|
#15
Follett St
East Providence, RI 02914
|
1,584 sq. feet
|
2 baths 4 beds |
show details | |

|
#16
Cynthia Dr Apt 13
North Providence, RI 02911
|
768 sq. feet
|
1 baths 2 beds |
show details | |

|
#17
Knotty Oak Rd
Coventry, RI 02816
|
1,080 sq. feet
|
1 baths 2 beds |
show details | |

|
#18
What Cheer Ave
Providence, RI 02909
|
2,280 sq. feet
|
2 baths 3 beds |
show details | |

|
#19
Van Zandt Ave
Warwick, RI 02889
|
800 sq. feet
|
1 baths 4 beds |
show details | |

|
#20
Verndale St
Warwick, RI 02889
|
1,206 sq. feet
|
1 baths 2 beds |
show details |
| Photo | Address | Area | Beds / Baths | Price | Details |
|---|---|---|---|---|---|

|
#21
Atwood Ave
Johnston, RI 02919
|
1,792 sq. feet
|
2 baths 4 beds |
show details | |

|
#22
Valley Green Court
Providence, RI 02904
|
1,440 sq. feet
|
3 baths 2 beds |
show details | |

|
#23
Atwood Ave
Johnston, RI 02919
|
1,792 sq. feet
|
1 baths 4 beds |
show details | |

|
#24
Depot St
North Attleboro, MA 02760
|
- sq. feet
|
2 baths 3 beds |
show details | |

|
#25
Chace Ave
Warren, RI 02885
|
1,224 sq. feet
|
1 baths 2 beds |
show details | |

|
#26
Blanding Ave
East Providence, RI 02914
|
1,165 sq. feet
|
1 baths 3 beds |
show details | |

|
#27
Maxwell St
Taunton, MA 02780
|
1,537 sq. feet
|
2 baths 5 beds |
show details | |

|
#28
Lisa Ln
Bristol, RI 02809
|
1,658 sq. feet
|
2 baths 3 beds |
show details | |

|
#29
Marion Avenue
Providence, RI 02905
|
1,252 sq. feet
|
1 baths 3 beds |
show details | |

|
#30
Woburn St
Cranston, RI 02910
|
1,212 sq. feet
|
1 baths 4 beds |
show details |
| Photo | Address | Area | Beds / Baths | Price | Details |
|---|---|---|---|---|---|

|
#31
N Main St
Pascoag, RI 02859
|
- sq. feet
|
- baths - beds |
$100,000
|
show details |

|
#32
Hazard Ave
Warwick, RI 02889
|
1,017 sq. feet
|
1 baths 3 beds |
show details | |

|
#33
Mill St
Foxboro, MA 02035
|
1,584 sq. feet
|
2 baths 3 beds |
show details | |

|
#34
Snake Hill Rd
North Scituate, RI 02857
|
864 sq. feet
|
2 baths 2 beds |
show details | |

|
#35
Grove St
Woonsocket, RI 02895
|
2,534 sq. feet
|
3 baths 6 beds |
show details | |

|
#36
Lewis St
Dighton, MA 02715
|
3,144 sq. feet
|
2 baths 3 beds |
show details | |

|
#37
Claremont Avenue A/k/a 5 Claremont Avenue
Bristol, RI 02809
|
1,852 sq. feet
|
2 baths 2 beds |
show details | |

|
#38
Spooner Ave
Warwick, RI 02886
|
1,777 sq. feet
|
2 baths 4 beds |
show details | |

|
#39
Tyndall Ave
Providence, RI 02908
|
1,523 sq. feet
|
1 baths 4 beds |
show details | |

|
#40
Thacher St
Attleboro, MA 02703
|
1,040 sq. feet
|
1 baths 3 beds |
show details |
| Photo | Address | Area | Beds / Baths | Price | Details |
|---|---|---|---|---|---|

|
#41
Putnam Pike
Greenville, RI 02828
|
1,114 sq. feet
|
1 baths 2 beds |
show details | |

|
#42
Williams St
Dighton, MA 02715
|
1,732 sq. feet
|
1 baths 3 beds |
show details | |

|
#43
Arbor Way
Taunton, MA 02780
|
2,614 sq. feet
|
2 baths 4 beds |
show details | |

|
#44
Indian Trl
Taunton, MA 02780
|
1,166 sq. feet
|
1 baths 3 beds |
show details | |

|
#45
Orchard St
Blackstone, MA 01504
|
1,764 sq. feet
|
2 baths 3 beds |
show details | |

|
#46
Lakeshore Dr
Bellingham, MA 02019
|
1,110 sq. feet
|
2 baths 3 beds |
show details | |

|
#47
Fiume St
West Warwick, RI 02893
|
1,342 sq. feet
|
1 baths 3 beds |
show details | |

|
#48
Grand Ave
Warwick, RI 02889
|
1,120 sq. feet
|
1 baths 3 beds |
show details | |

|
#49
Bryants Way
Swansea, MA 02777
|
3,357 sq. feet
|
2 baths 5 beds |
show details | |

|
Check over 1 million property listings on Foreclosure.com!
|
browse all offers | |||


- 16,07672.0%Hispanic
- 4,10418.4%White alone
- 1,3576.1%Black alone
- 9054.1%Two or more races
- 4542.0%Other race alone
- 440.2%Asian alone
- 90.04%American Indian alone
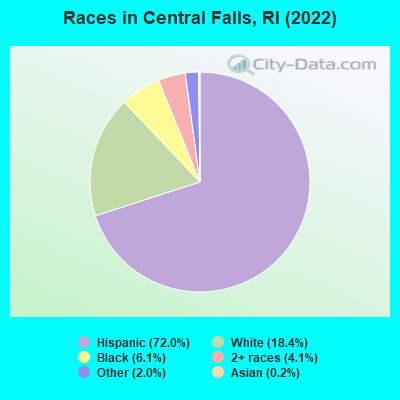
Races in Central Falls detailed stats: ancestries, foreign born residents, place of birth
According to our research of Rhode Island and other state lists, there were 31 registered sex offenders living in Central Falls, Rhode Island as of April 27, 2024.
The ratio of all residents to sex offenders in Central Falls is 627 to 1.
Type |
2009 |
2010 |
2011 |
2012 |
2013 |
2014 |
2015 |
2016 |
2017 |
2018 |
2019 |
2020 |
2021 |
2022 |
|---|---|---|---|---|---|---|---|---|---|---|---|---|---|---|
| Murders (per 100,000) | 0 (0.0) | 0 (0.0) | 0 (0.0) | 2 (10.3) | 2 (10.3) | 2 (10.3) | 0 (0.0) | 1 (5.2) | 0 (0.0) | 1 (5.2) | 1 (5.1) | 2 (10.2) | 1 (5.0) | 0 (0.0) |
| Rapes (per 100,000) | 9 (48.1) | 16 (82.6) | 16 (82.7) | 14 (72.3) | 9 (46.4) | 15 (76.9) | 12 (62.1) | 16 (83.0) | 12 (61.9) | 12 (62.2) | 11 (56.6) | 15 (76.8) | 15 (74.4) | 15 (67.1) |
| Robberies (per 100,000) | 30 (160.5) | 30 (154.8) | 29 (149.8) | 48 (247.9) | 34 (175.2) | 37 (189.8) | 53 (274.3) | 30 (155.6) | 13 (67.0) | 16 (82.9) | 14 (72.1) | 15 (76.8) | 8 (39.7) | 10 (44.8) |
| Assaults (per 100,000) | 63 (337.0) | 55 (283.9) | 74 (382.4) | 81 (418.4) | 86 (443.2) | 80 (410.3) | 86 (445.0) | 81 (420.2) | 73 (376.5) | 54 (279.9) | 58 (298.6) | 57 (291.9) | 42 (208.2) | 65 (291.0) |
| Burglaries (per 100,000) | 129 (690.0) | 153 (789.6) | 195 (1,008) | 115 (594.0) | 226 (1,165) | 216 (1,108) | 120 (621.0) | 121 (627.7) | 59 (304.3) | 46 (238.4) | 44 (226.5) | 33 (169.0) | 45 (223.1) | 22 (98.5) |
| Thefts (per 100,000) | 232 (1,241) | 289 (1,492) | 346 (1,788) | 337 (1,741) | 356 (1,835) | 338 (1,734) | 184 (952.1) | 283 (1,468) | 271 (1,398) | 191 (990.0) | 192 (988.5) | 169 (865.3) | 176 (872.4) | 192 (859.4) |
| Auto thefts (per 100,000) | 74 (395.8) | 70 (361.3) | 77 (397.9) | 120 (619.8) | 85 (438.1) | 52 (266.7) | 38 (196.6) | 49 (254.2) | 62 (319.8) | 56 (290.3) | 53 (272.9) | 43 (220.2) | 26 (128.9) | 52 (232.8) |
| Arson (per 100,000) | 6 (32.1) | 7 (36.1) | 8 (41.3) | 5 (25.8) | 12 (61.8) | 7 (35.9) | 6 (31.0) | 5 (25.9) | 8 (41.3) | 5 (25.9) | 2 (10.3) | 6 (30.7) | 2 (9.9) | 1 (4.5) |
| City-Data.com crime index | 283.6 | 313.1 | 361.4 | 397.4 | 388.9 | 389.3 | 318.2 | 330.5 | 247.7 | 220.5 | 214.2 | 227.4 | 183.8 | 185.2 |
The City-Data.com crime index weighs serious crimes and violent crimes more heavily. Higher means more crime, U.S. average is 246.1. It adjusts for the number of visitors and daily workers commuting into cities.
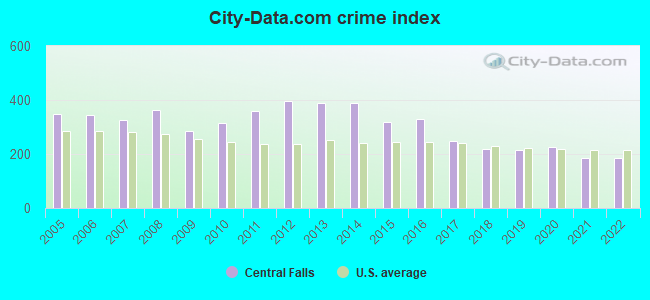
Crime rate in Central Falls detailed stats: murders, rapes, robberies, assaults, burglaries, thefts, arson
Full-time law enforcement employees in 2021, including police officers: 44 (37 officers - 30 male; 7 female).
| Officers per 1,000 residents here: | 1.83 |
| Rhode Island average: | 2.27 |
 Recent articles from our blog. Our writers, many of them Ph.D. graduates or candidates, create easy-to-read articles on a wide variety of topics.

 | Two people shot in Central Falls (1 dead) (52 replies) |
| Man shot to death in Central Falls (19 replies) |
| "Woonsocket Man" (Rocket Man parody) (318 replies) |
| Man shot in Central Falls (5 replies) |
| Shooting in Central Falls (1 reply) |
| Double shooting and standoff in Central Falls (1 reply) |
Latest news from Central Falls, RI collected exclusively by city-data.com from local newspapers, TV, and radio stations
Ancestries: Cape Verdean (6.3%), Portuguese (3.7%), African (3.4%), American (2.0%), French (1.9%), French Canadian (1.7%).
Current Local Time: EST time zone
Incorporated in 1895
Elevation: 100 feet
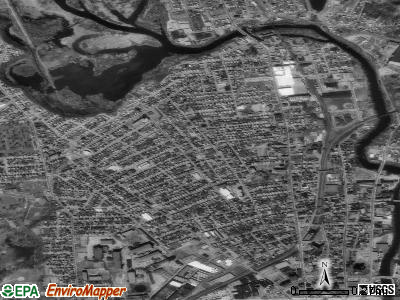
Land area: 1.21 square miles.
Population density: 18,598 people per square mile (very high).

8,994 residents are foreign born (32.6% Latin America, 4.7% Africa).
| This city: | 40.3% |
| Rhode Island: | 14.4% |
Median real estate property taxes paid for housing units with mortgages in 2022: $3,577 (1.3%)
Median real estate property taxes paid for housing units with no mortgage in 2022: $3,702 (1.3%)
Nearest city with pop. 50,000+: Pawtucket, RI  (1.3 miles , pop. 72,958).
Nearest city with pop. 200,000+: Boston, MA (33.7 miles , pop. 589,141).
Nearest city with pop. 1,000,000+: Bronx, NY (147.6 miles , pop. 1,332,650).
Nearest cities:
), ), ), Latitude: 41.89 N, Longitude: 71.39 W
Daytime population change due to commuting: -5,640 (-25.3%)
Workers who live and work in this city: 1,317 (14.0%)
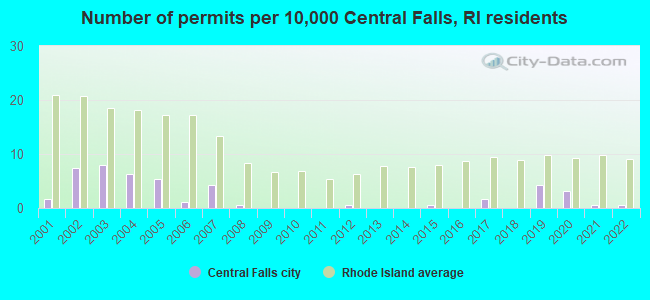
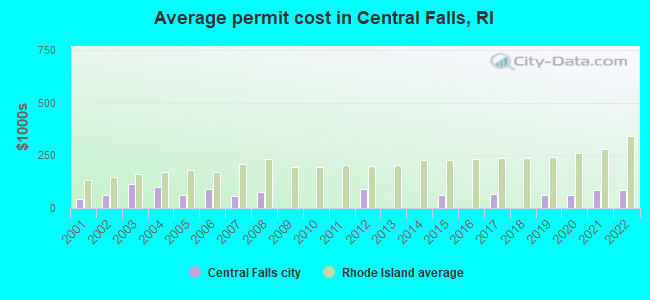
Single-family new house construction building permits:
- 2022: 1 building, cost: $83,500
- 2021: 1 building, cost: $83,500
- 2020: 6 buildings, average cost: $60,000
- 2019: 8 buildings, average cost: $60,000
- 2017: 3 buildings, average cost: $66,700
- 2015: 1 building, cost: $60,000
- 2012: 1 building, cost: $89,800
- 2008: 1 building, cost: $74,800
- 2007: 8 buildings, average cost: $54,600
- 2006: 2 buildings, average cost: $89,800
- 2005: 10 buildings, average cost: $62,000
- 2004: 12 buildings, average cost: $101,300
- 2003: 15 buildings, average cost: $116,000
- 2002: 14 buildings, average cost: $64,100
- 2001: 3 buildings, average cost: $43,100
| Here: | 4.1% |
| Rhode Island: | 3.3% |

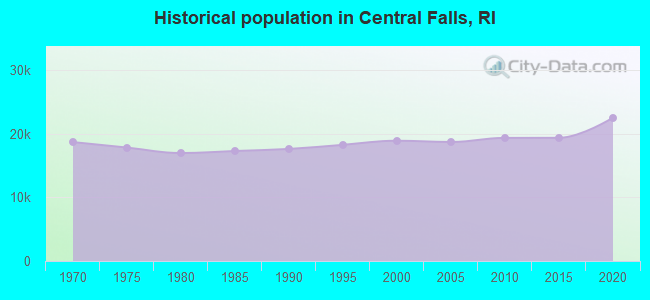
Population change in the 1990s: +1,173 (+6.6%).
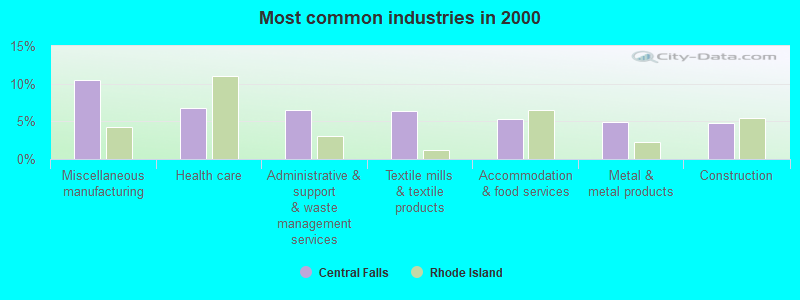
- Miscellaneous manufacturing (10.5%)
- Health care (6.8%)
- Administrative & support & waste management services (6.6%)
- Textile mills & textile products (6.4%)
- Accommodation & food services (5.3%)
- Metal & metal products (5.0%)
- Construction (4.8%)
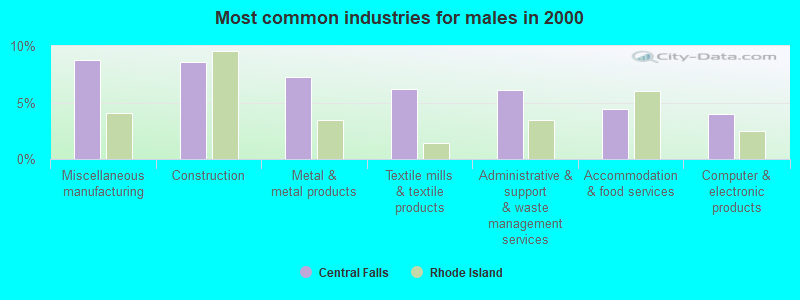
- Miscellaneous manufacturing (8.7%)
- Construction (8.6%)
- Metal & metal products (7.3%)
- Textile mills & textile products (6.2%)
- Administrative & support & waste management services (6.1%)
- Accommodation & food services (4.5%)
- Computer & electronic products (4.0%)
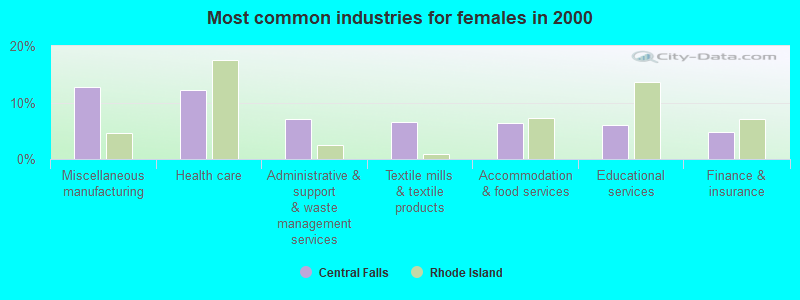
- Miscellaneous manufacturing (12.7%)
- Health care (12.3%)
- Administrative & support & waste management services (7.1%)
- Textile mills & textile products (6.6%)
- Accommodation & food services (6.3%)
- Educational services (6.0%)
- Finance & insurance (4.8%)
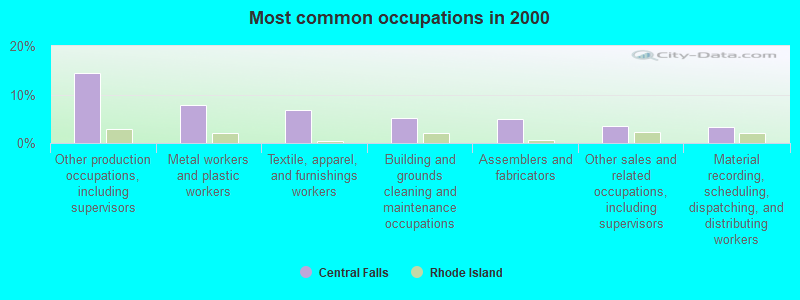
- Other production occupations, including supervisors (14.5%)
- Metal workers and plastic workers (7.8%)
- Textile, apparel, and furnishings workers (6.9%)
- Building and grounds cleaning and maintenance occupations (5.2%)
- Assemblers and fabricators (5.0%)
- Other sales and related occupations, including supervisors (3.6%)
- Material recording, scheduling, dispatching, and distributing workers (3.3%)
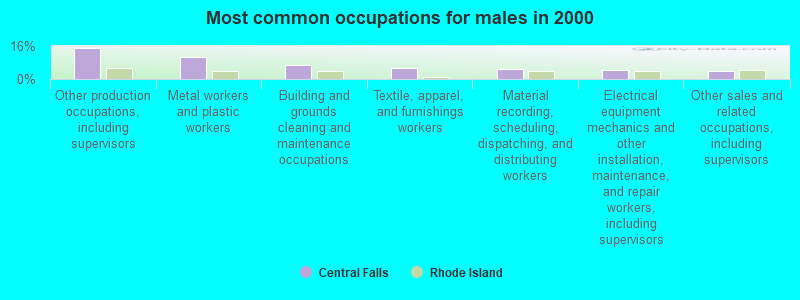
- Other production occupations, including supervisors (15.0%)
- Metal workers and plastic workers (10.5%)
- Building and grounds cleaning and maintenance occupations (6.6%)
- Textile, apparel, and furnishings workers (5.4%)
- Material recording, scheduling, dispatching, and distributing workers (4.9%)
- Electrical equipment mechanics and other installation, maintenance, and repair workers, including supervisors (4.2%)
- Other sales and related occupations, including supervisors (3.8%)
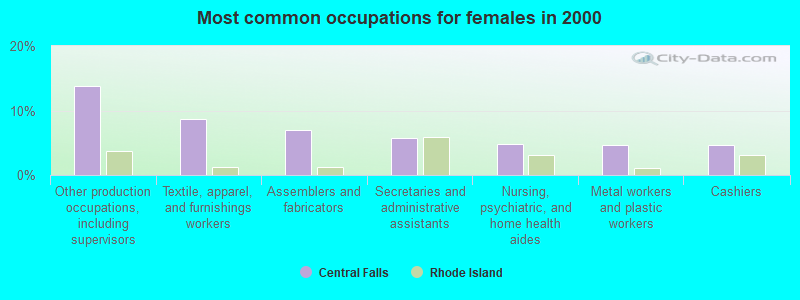
- Other production occupations, including supervisors (13.8%)
- Textile, apparel, and furnishings workers (8.7%)
- Assemblers and fabricators (7.0%)
- Secretaries and administrative assistants (5.8%)
- Nursing, psychiatric, and home health aides (4.8%)
- Metal workers and plastic workers (4.7%)
- Cashiers (4.6%)
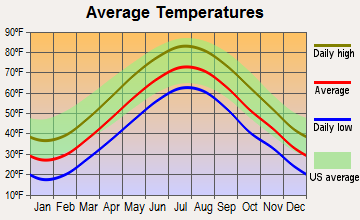
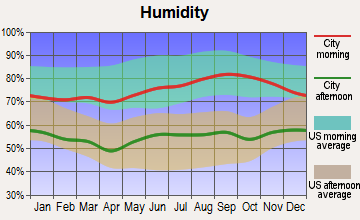
Average climate in Central Falls, Rhode Island
Based on data reported by over 4,000 weather stations


(lower is better)
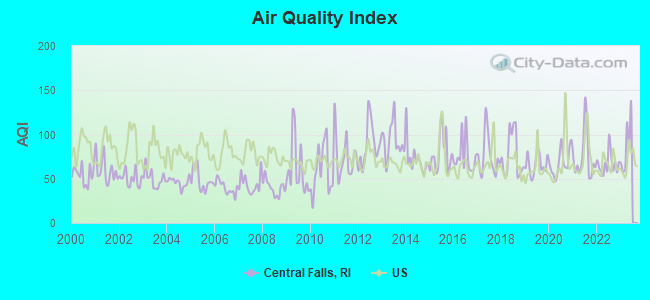
Air Quality Index (AQI) level in 2022 was 66.7. This is about average.
| City: | 66.7 |
| U.S.: | 72.6 |
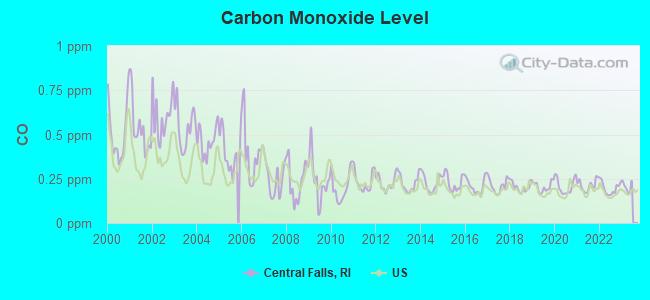
Carbon Monoxide (CO) [ppm] level in 2022 was 0.196. This is better than average. Closest monitor was 0.9 miles away from the city center.
| City: | 0.196 |
| U.S.: | 0.251 |
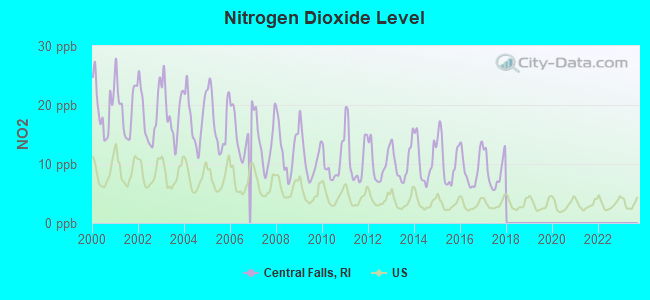
Nitrogen Dioxide (NO2) [ppb] level in 2017 was 8.78. This is significantly worse than average. Closest monitor was 0.9 miles away from the city center.
| City: | 8.78 |
| U.S.: | 5.11 |
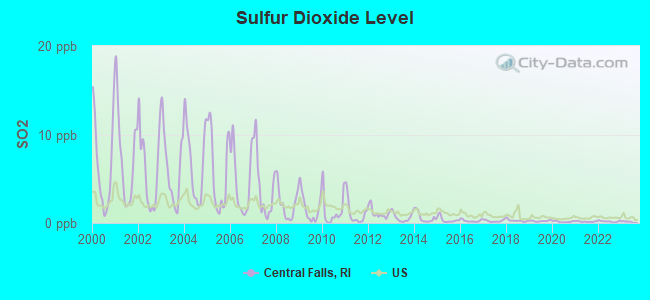
Sulfur Dioxide (SO2) [ppb] level in 2022 was 0.179. This is significantly better than average. Closest monitor was 0.9 miles away from the city center.
| City: | 0.179 |
| U.S.: | 1.515 |
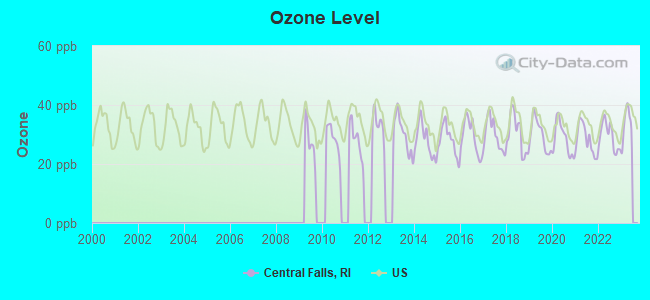
Ozone [ppb] level in 2022 was 29.5. This is about average. Closest monitor was 3.2 miles away from the city center.
| City: | 29.5 |
| U.S.: | 33.3 |
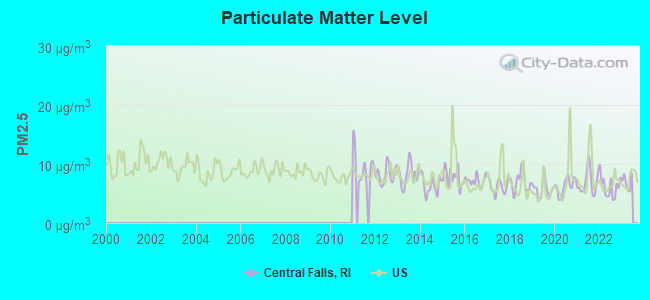
Particulate Matter (PM2.5) [µg/m3] level in 2022 was 6.15. This is better than average. Closest monitor was 1.1 miles away from the city center.
| City: | 6.15 |
| U.S.: | 8.11 |
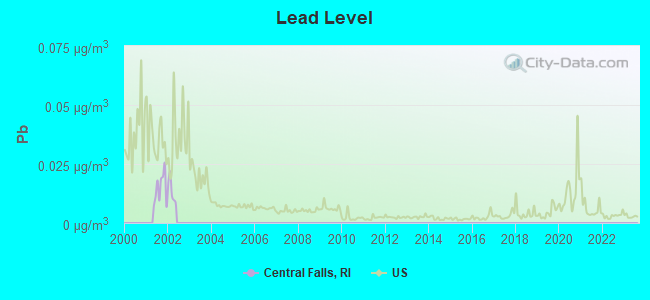
Lead (Pb) [µg/m3] level in 2001 was 0.0146. This is significantly worse than average. Closest monitor was 1.2 miles away from the city center.
| City: | 0.0146 |
| U.S.: | 0.0093 |
Tornado activity:
Central Falls-area historical tornado activity is slightly above Rhode Island state average. It is 46% smaller than the overall U.S. average.
On 6/9/1953, a category F4 (max. wind speeds 207-260 mph) tornado 29.1 miles away from the Central Falls city center killed 90 people and injured 1228 people and caused between $50,000,000 and $500,000,000 in damages.
On 6/9/1953, a category F3 (max. wind speeds 158-206 mph) tornado 14.9 miles away from the city center injured 17 people and caused between $500,000 and $5,000,000 in damages.
Earthquake activity:
Central Falls-area historical earthquake activity is significantly above Rhode Island state average. It is 73% smaller than the overall U.S. average.On 10/7/1983 at 10:18:46, a magnitude 5.3 (5.1 MB, 5.3 LG, 5.1 ML, Class: Moderate, Intensity: VI - VII) earthquake occurred 206.6 miles away from the city center
On 4/20/2002 at 10:50:47, a magnitude 5.3 (5.3 ML, Depth: 3.0 mi) earthquake occurred 215.4 miles away from Central Falls center
On 1/19/1982 at 00:14:42, a magnitude 4.7 (4.5 MB, 4.7 MD, 4.5 LG, Class: Light, Intensity: IV - V) earthquake occurred 111.9 miles away from the city center
On 4/20/2002 at 10:50:47, a magnitude 5.2 (5.2 MB, 4.2 MS, 5.2 MW, 5.0 MW) earthquake occurred 214.5 miles away from the city center
On 10/16/2012 at 23:12:25, a magnitude 4.7 (4.7 ML, Depth: 10.0 mi) earthquake occurred 123.9 miles away from Central Falls center
On 8/22/1992 at 12:20:32, a magnitude 4.8 (4.8 MB, 3.8 MS, 4.7 LG, Depth: 6.2 mi) earthquake occurred 200.7 miles away from the city center
Magnitude types: regional Lg-wave magnitude (LG), body-wave magnitude (MB), duration magnitude (MD), local magnitude (ML), surface-wave magnitude (MS), moment magnitude (MW)
Natural disasters:
The number of natural disasters in Providence County (17) is near the US average (15).Major Disasters (Presidential) Declared: 7
Emergencies Declared: 10
Causes of natural disasters: Hurricanes: 5, Snowstorms: 4, Blizzards: 3, Floods: 2, Storms: 2, Winter Storms: 2, Snow: 1, Snowfall: 1, Tropical Storm: 1, Water Main Break: 1, Wind: 1, Other: 1 (Note: some incidents may be assigned to more than one category).
Hospitals and medical centers in Central Falls:
- NOTRE DAME HOSPITAL (1000 BROAD ST)
- CARTIES HEALTH CENTER (21 LINCOLN AVENUE)
- FRIGON NURSING HOME (60 EBEN BROWN LA)
- HARRIS HEALTH CARE CENTER-NORTH (60 EBEN BROWN LANE)
- MANSION NURSING AND REHABILITATION CENTER (104 CLAY STREET)
- PAQUETTE NURSING HOME (649 BROAD ST)
- ROSE COTTAGE HEALTH CARE CENTE (151 HUNT STREET)
Amtrak station near Central Falls:
Colleges/universities with over 2000 students nearest to Central Falls:
- Providence College (about 4 miles; Providence, RI; Full-time enrollment: 4,312)
- Brown University (about 5 miles; Providence, RI; FT enrollment: 8,458)
- Rhode Island School of Design (about 5 miles; Providence, RI; FT enrollment: 2,714)
- Johnson & Wales University-Providence (about 5 miles; Providence, RI; FT enrollment: 10,898)
- Rhode Island College (about 6 miles; Providence, RI; FT enrollment: 7,189)
- Bryant University (about 8 miles; Smithfield, RI; FT enrollment: 3,440)
- Community College of Rhode Island (about 14 miles; Warwick, RI; FT enrollment: 10,500)
Public high schools in Central Falls:
- SHEILA SKIP NOWELL LEADERSHIP (Location: 43 HAWES STREET, Grades: 9-12, Charter school)
- CENTRAL FALLS SR HIGH (Location: 24 SUMMER STREET, Grades: 9-12)
Public elementary/middle schools in Central Falls:
- VETERANS MEMORIAL ELEMENTARY (Students: 523, Location: 150 FULLER AVENUE, Grades: 1-4)
- ELLA RISK SCHOOL (Students: 453, Location: 949 DEXTER STREET, Grades: 1-4)
- THE LEARNING COMMUNITY (Location: 21 LINCOLN AVENUE, Grades: KG-8, Charter school)
- SEGUE INST FOR LEARNING (Location: 325 COWDEN STREET, Grades: 6-8, Charter school)
- CALCUTT MIDDLE SCHOOL (Location: 112 WASHINGTON STREET, Grades: 5-8)
Private elementary/middle school in Central Falls:
Points of interest:
Notable locations in Central Falls: Bridge Mill Power Plant (A), Harris Warehouse (B), Deborah Cook Sayles Memorial Library Pawtucket Public Library (C), Central Falls City Hall (D), Adams Memorial Library (E), Central Falls Police Department (F), Central Falls Fire Department (G), Blackstone Valley Community Center (H). Display/hide their locations on the map
Churches in Central Falls include: Saint Ephraims Church (A), Assembly of God Church (B), Central Falls Congregational Church (C), Holy Trinity Church Complex (D), Bible Baptist Church (E), Casade Oracion Gethsemane Church (F), Saint Matthews Church (G). Display/hide their locations on the map
Cemetery: Moshassuck Cemetery (1). Display/hide its location on the map
Reservoir: Valley Falls Pond (A). Display/hide its location on the map
Parks in Central Falls include: South Central Falls Historic District (1), Jenks Park (2), Central Falls Mill Historic District (3), Central Street School Historic District (4). Display/hide their locations on the map
Birthplace of: Michael Breault - Game designer and writer, Max Surkont - Baseball player, Jack McGee (aviator) - Aviator.
| This city: | 2.9 people |
| Rhode Island: | 2.4 people |
| This city: | 66.8% |
| Whole state: | 62.8% |
| This city: | 10.7% |
| Whole state: | 7.6% |
Likely homosexual households (counted as self-reported same-sex unmarried-partner households)
- Lesbian couples: 0.4% of all households
- Gay men: 0.4% of all households
People in group quarters in Central Falls in 2010:
- 350 people in federal detention centers
- 112 people in nursing facilities/skilled-nursing facilities
- 28 people in residential treatment centers for adults
- 13 people in correctional facilities intended for juveniles
- 6 people in group homes intended for adults
People in group quarters in Central Falls in 2000:
- 324 people in other types of correctional institutions
- 231 people in nursing homes
- 19 people in other noninstitutional group quarters
- 7 people in homes for the mentally ill
- 7 people in religious group quarters
Banks with branches in Central Falls (2011 data):
- Bank of America, National Association: Broad Street Branch at 375 Broad Street, branch established on 1950/06/19. Info updated 2009/11/18: Bank assets: $1,451,969.3 mil, Deposits: $1,077,176.8 mil, headquarters in Charlotte, NC, positive income, 5782 total offices, Holding Company: Bank Of America Corporation
For population 15 years and over in Central Falls:
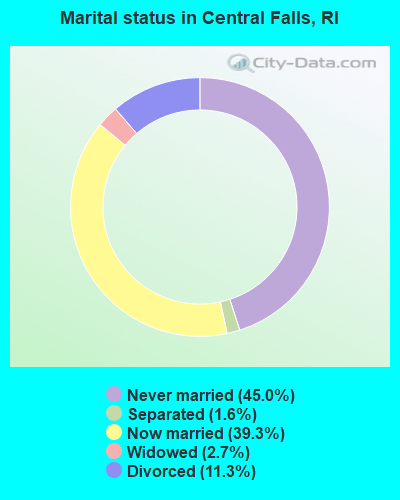
- Never married: 45.0%
- Now married: 39.3%
- Separated: 1.6%
- Widowed: 2.7%
- Divorced: 11.3%
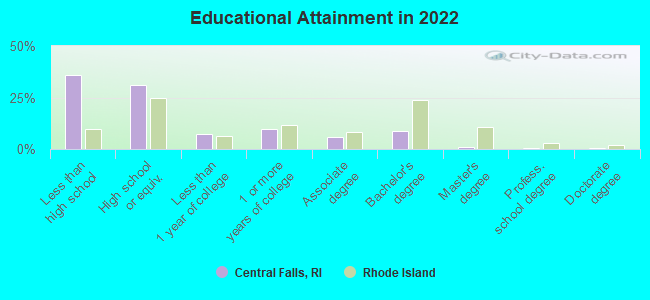
For population 25 years and over in Central Falls:
- High school or higher: 63.2%
- Bachelor's degree or higher: 9.1%
- Graduate or professional degree: 1.4%
- Unemployed: 8.2%
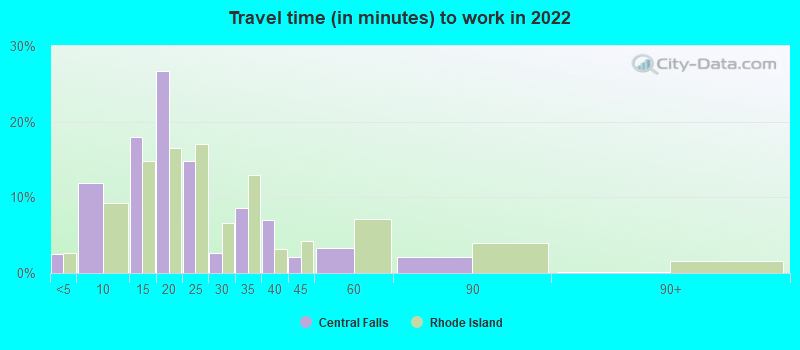
- Mean travel time to work (commute): 22.6 minutes
| Here: | 22.7 |
| Rhode Island average: | 12.8 |
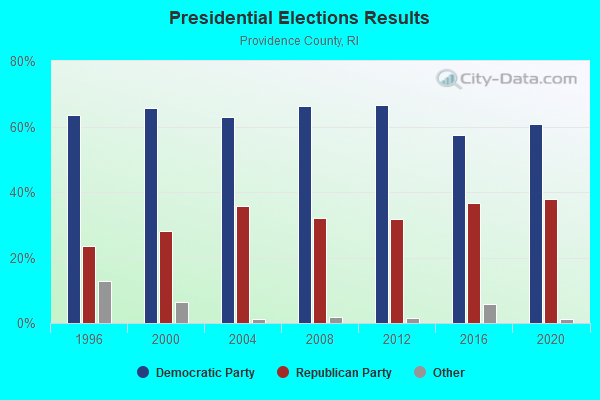
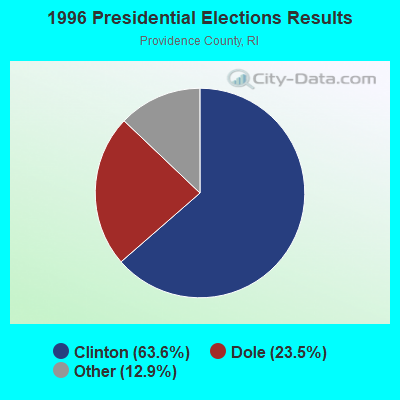
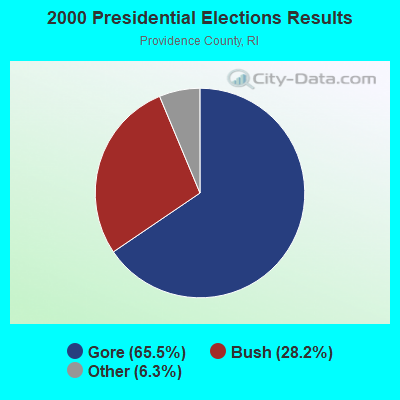
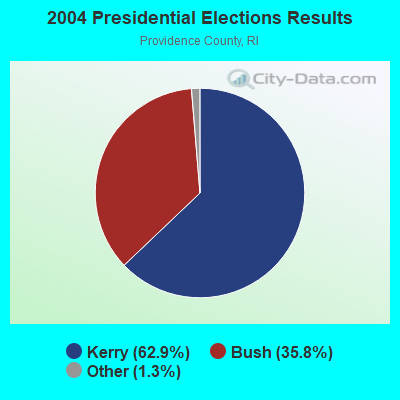
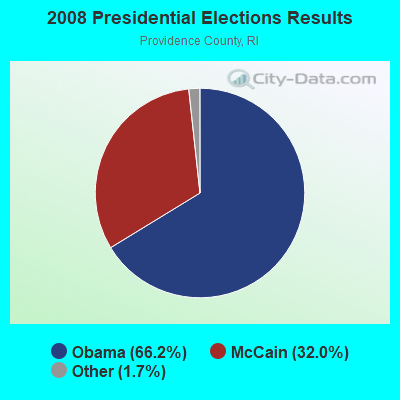
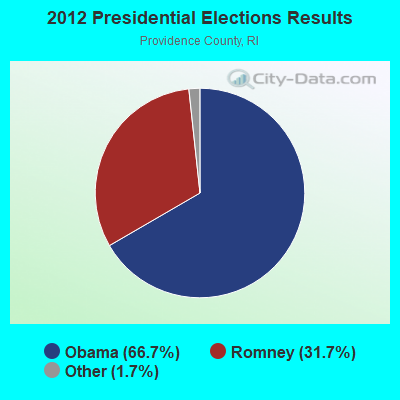
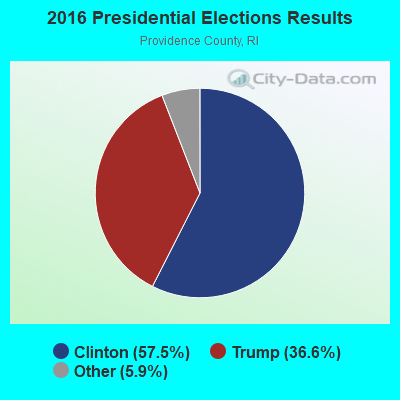
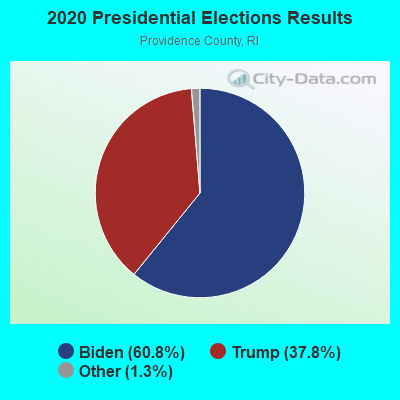
Graphs represent county-level data. Detailed 2008 Election Results
Religion statistics for Central Falls, RI (based on Providence County data)
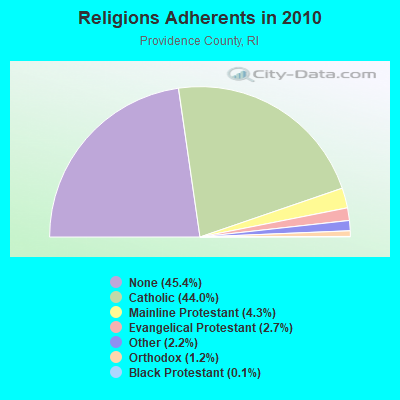
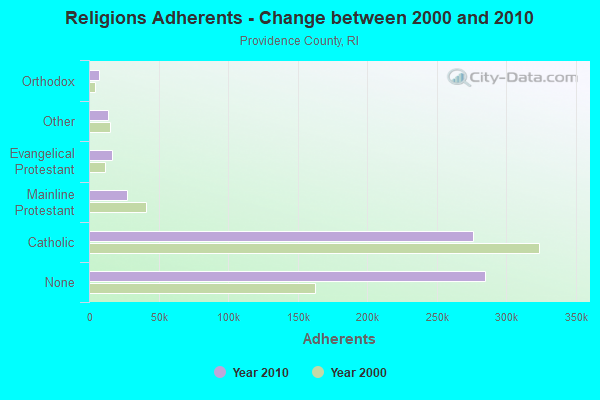
| Religion | Adherents | Congregations |
|---|---|---|
| Catholic | 276,011 | 98 |
| Mainline Protestant | 27,143 | 111 |
| Evangelical Protestant | 16,895 | 134 |
| Other | 13,896 | 48 |
| Orthodox | 7,325 | 10 |
| Black Protestant | 712 | 9 |
| None | 284,685 | - |
Food Environment Statistics:
| Providence County: | 2.06 / 10,000 pop. |
| Rhode Island: | 1.92 / 10,000 pop. |
| This county: | 0.02 / 10,000 pop. |
| State: | 0.05 / 10,000 pop. |
| Providence County: | 1.50 / 10,000 pop. |
| Rhode Island: | 1.42 / 10,000 pop. |
| Providence County: | 2.10 / 10,000 pop. |
| State: | 2.24 / 10,000 pop. |
| Here: | 7.96 / 10,000 pop. |
| State: | 9.75 / 10,000 pop. |
| This county: | 8.1% |
| Rhode Island: | 7.9% |
| Providence County: | 24.0% |
| Rhode Island: | 22.6% |
| This county: | 16.9% |
| State: | 16.3% |
Health and Nutrition:
| Here: | 45.6% |
| Rhode Island: | 49.4% |
| This city: | 43.3% |
| State: | 46.7% |
| Here: | 28.7 |
| Rhode Island: | 28.6 |
| Central Falls: | 23.7% |
| Rhode Island: | 21.3% |
| Central Falls: | 11.9% |
| Rhode Island: | 10.8% |
| Here: | 6.8 |
| Rhode Island: | 6.8 |
| Here: | 31.3% |
| Rhode Island: | 33.8% |
| Here: | 52.3% |
| Rhode Island: | 56.0% |
| Here: | 79.8% |
| Rhode Island: | 78.5% |
More about Health and Nutrition of Central Falls, RI Residents
| Local government employment and payroll (March 2022) | |||||
| Function | Full-time employees | Monthly full-time payroll | Average yearly full-time wage | Part-time employees | Monthly part-time payroll |
|---|---|---|---|---|---|
| Firefighters | 39 | $255,999 | $78,769 | 0 | $0 |
| Police Protection - Officers | 39 | $297,024 | $91,392 | 0 | $0 |
| Other Government Administration | 11 | $55,709 | $60,773 | 24 | $22,593 |
| Financial Administration | 9 | $41,293 | $55,057 | 7 | $134 |
| Streets and Highways | 7 | $35,034 | $60,058 | 0 | $0 |
| Police - Other | 7 | $28,982 | $49,683 | 0 | $0 |
| Other and Unallocable | 4 | $19,206 | $57,618 | 5 | $8,683 |
| Judicial and Legal | 3 | $15,671 | $62,684 | 7 | $6,593 |
| Parks and Recreation | 2 | $8,432 | $50,592 | 5 | $11,632 |
| Health | 1 | $4,365 | $52,380 | 0 | $0 |
| Housing and Community Development (Local) | 1 | $5,338 | $64,056 | 0 | $0 |
| Fire - Other | 1 | $6,307 | $75,684 | 11 | $10,451 |
| Totals for Government | 124 | $773,360 | $74,841 | 59 | $60,085 |
Central Falls government finances - Expenditure in 2021 (per resident):
- Construction - Elementary and Secondary Education: $2,233,000 ($99.29)
General - Other: $380,000 ($16.90)
- Current Operations - Police Protection: $4,338,000 ($192.89)
Local Fire Protection: $3,912,000 ($173.94)
General - Other: $3,851,000 ($171.23)
Financial Administration: $1,427,000 ($63.45)
Central Staff Services: $1,347,000 ($59.89)
Regular Highways: $1,117,000 ($49.67)
General Public Buildings: $1,089,000 ($48.42)
Solid Waste Management: $999,000 ($44.42)
Health - Other: $738,000 ($32.81)
Judicial and Legal Services: $468,000 ($20.81)
Parks and Recreation: $307,000 ($13.65)
Libraries: $150,000 ($6.67)
Housing and Community Development: $100,000 ($4.45)
Protective Inspection and Regulation - Other: $10,000 ($0.44)
- General - Interest on Debt: $223,000 ($9.92)
- Other Capital Outlay - Parks and Recreation: $759,000 ($33.75)
General - Other: $657,000 ($29.21)
Housing and Community Development: $569,000 ($25.30)
Police Protection: $45,000 ($2.00)
Central Falls government finances - Revenue in 2021 (per resident):
- Charges - Other: $1,496,000 ($66.52)
Solid Waste Management: $20,000 ($0.89)
- Federal Intergovernmental - Health and Hospitals: $1,323,000 ($58.83)
Other: $29,000 ($1.29)
- Miscellaneous - Fines and Forfeits: $104,000 ($4.62)
General Revenue - Other: $74,000 ($3.29)
Interest Earnings: $9,000 ($0.40)
- State Intergovernmental - Other: $3,414,000 ($151.80)
General Local Government Support: $1,367,000 ($60.78)
Housing and Community Development: $689,000 ($30.64)
Health and Hospitals: $253,000 ($11.25)
- Tax - Property: $15,419,000 ($685.59)
Other License: $171,000 ($7.60)
Other Selective Sales: $146,000 ($6.49)
Central Falls government finances - Debt in 2021 (per resident):
- Long Term Debt - Beginning Outstanding - Unspecified Public Purpose: $7,615,000 ($338.59)
Outstanding Unspecified Public Purpose: $6,836,000 ($303.96)
Retired Unspecified Public Purpose: $779,000 ($34.64)
Central Falls government finances - Cash and Securities in 2021 (per resident):
- Other Funds - Cash and Securities: $3,659,000 ($162.69)
5.01% of this county's 2021 resident taxpayers lived in other counties in 2020 ($66,379 average adjusted gross income)
| Here: | 5.01% |
| Rhode Island average: | 5.99% |
0.03% of residents moved from foreign countries ($121 average AGI)
Providence County: 0.03% Rhode Island average: 0.03%
Top counties from which taxpayers relocated into this county between 2020 and 2021:
| from Kent County, RI | |
| from Bristol County, MA | |
| from Suffolk County, MA |
5.35% of this county's 2020 resident taxpayers moved to other counties in 2021 ($68,172 average adjusted gross income)
| Here: | 5.35% |
| Rhode Island average: | 5.97% |
0.01% of residents moved to foreign countries ($59 average AGI)
Providence County: 0.01% Rhode Island average: 0.02%
Top counties to which taxpayers relocated from this county between 2020 and 2021:
| to Kent County, RI | |
| to Bristol County, MA | |
| to Washington County, RI |
| Businesses in Central Falls, RI | ||||
| Name | Count | Name | Count | |
|---|---|---|---|---|
| Advance Auto Parts | 1 | H&R Block | 1 | |
| Burger King | 1 | Penske | 1 | |
| CVS | 1 | Rite Aid | 1 | |
| Dunkin Donuts | 1 | Subway | 1 | |
| FedEx | 1 | UPS | 1 | |
Strongest AM radio stations in Central Falls:
- WDDZ (550 AM; 5 kW; PAWTUCKET, RI; Owner: ABC, INC.)
- WRNI (1290 AM; 10 kW; PROVIDENCE, RI; Owner: WRNI FOUNDATION)
- WALE (990 AM; 50 kW; GREENVILLE, RI; Owner: NORTH AMERICAN BROADCASTING CO., INC.)
- WSKO (790 AM; 5 kW; PROVIDENCE, RI; Owner: CITADEL BROADCASTING COMPANY)
- WPMZ (1110 AM; daytime; 5 kW; EAST PROVIDENCE, RI; Owner: VIDEO MUNDO B/CASTING CO., LLC)
- WARL (1320 AM; 5 kW; ATTLEBORO, MA; Owner: THE ADD RADIO GROUP, INC.)
- WPRO (630 AM; 5 kW; PROVIDENCE, RI; Owner: CITADEL BROADCASTING COMPANY)
- WHJJ (920 AM; 5 kW; PROVIDENCE, RI)
- WEEI (850 AM; 50 kW; BOSTON, MA; Owner: ENTERCOM BOSTON LICENSE, LLC)
- WKOX (1200 AM; 50 kW; FRAMINGHAM, MA; Owner: CAPSTAR TX LIMITED PARTNERSHIP)
- WBIX (1060 AM; 40 kW; NATICK, MA; Owner: LANGER BROADCASTING CORPORATION)
- WAMG (890 AM; 25 kW; DEDHAM, MA; Owner: MEGA COMMUNICATIONS OF DEDHAM LICENSEE, LLC)
- WCRN (830 AM; 50 kW; WORCESTER, MA; Owner: CARTER BROADCASTING CORPORATION)
Strongest FM radio stations in Central Falls:
- WWBB (101.5 FM; PROVIDENCE, RI; Owner: CLEAR CHANNEL BROADCASTING LICENSES, INC.)
- WBRU (95.5 FM; PROVIDENCE, RI; Owner: BROWN BROADCASTING SERVICE, INC.)
- WSNE-FM (93.3 FM; TAUNTON, MA; Owner: CAPSTAR TX LIMITED PARTNERSHIP)
- WHJY (94.1 FM; PROVIDENCE, RI; Owner: CAPSTAR TX LIMITED PARTNERSHIP)
- WPRO-FM (92.3 FM; PROVIDENCE, RI; Owner: CITADEL BROADCASTING COMPANY)
- WWLI (105.1 FM; PROVIDENCE, RI; Owner: CITADEL BROADCASTING COMPANY)
- WWKX (106.3 FM; WOONSOCKET, RI; Owner: AAA ENTERTAINMENT LICENSING LLC)
- WDOM (91.3 FM; PROVIDENCE, RI; Owner: PROVIDENCE COLLEGE)
- WELH (88.1 FM; PROVIDENCE, RI; Owner: THE WHEELER SCHOOL)
- WBMX (98.5 FM; BOSTON, MA; Owner: INFINITY RADIO OPERATIONS INC.)
- WBOS (92.9 FM; BROOKLINE, MA; Owner: GREATER BOSTON RADIO, INC.)
- WJMN (94.5 FM; BOSTON, MA; Owner: AMFM RADIO LICENSES, L.L.C.)
- WCRB (102.5 FM; WALTHAM, MA; Owner: CHARLES RIVER BROADCASTING WCRB LICE)
- WTKK (96.9 FM; BOSTON, MA; Owner: GREATER BOSTON RADIO, INC.)
- WROR-FM (105.7 FM; FRAMINGHAM, MA; Owner: GREATER BOSTON RADIO, INC.)
- WGBH (89.7 FM; BOSTON, MA; Owner: WGBH EDUCATIONAL FOUNDATION)
- WBUR-FM (90.9 FM; BOSTON, MA; Owner: TRUSTEES OF BOSTON UNIVERSITY)
- WXKS-FM (107.9 FM; MEDFORD, MA; Owner: AMFM RADIO LICENSES, L.L.C.)
- WKKB (100.3 FM; MIDDLETOWN, RI; Owner: CITADEL BROADCASTING COMPANY)
- WMJX (106.7 FM; BOSTON, MA; Owner: GREATER BOSTON RADIO, INC.)
TV broadcast stations around Central Falls:
- WNAC-TV (Channel 64; PROVIDENCE, RI; Owner: WNAC, LLC)
- WPRI-TV (Channel 12; PROVIDENCE, RI; Owner: TVL BROADCASTING OF RHODE ISLAND, LLC)
- WJAR (Channel 10; PROVIDENCE, RI; Owner: OUTLET BROADCASTING, INC.)
- WSBE-TV (Channel 36; PROVIDENCE, RI; Owner: RHODE ISLAND PUBLIC TELECOM. AUTHORITY)
- WLNE-TV (Channel 6; NEW BEDFORD, MA; Owner: FREEDOM BROADCASTING OF SOUTHERN NEW ENGLAND, INC.)
- WPXQ (Channel 69; BLOCK ISLAND, RI; Owner: OCEAN STATE TELEVISION, L.L.C.)
- WRIW-LP (Channel 50; PROVIDENCE, RI; Owner: ZGS PROVIDENCE, INC.)
- WWDP (Channel 46; NORWELL, MA; Owner: NORWELL TELEVISION, LLC)
- WCVB-TV (Channel 5; BOSTON, MA; Owner: WCVB HEARST-ARGYLE TV, INC.)
- WGBH-TV (Channel 2; BOSTON, MA; Owner: WGBH EDUCATIONAL FOUNDATION)
- WHDH-TV (Channel 7; BOSTON, MA; Owner: WHDH-TV)
- WMFP (Channel 62; LAWRENCE, MA; Owner: WSAH LICENSE, INC.)
- WSBK-TV (Channel 38; BOSTON, MA; Owner: VIACOM INC.)
- WLVI-TV (Channel 56; CAMBRIDGE, MA; Owner: WLVI, INC.)
- WBZ-TV (Channel 4; BOSTON, MA; Owner: VIACOM INC.)
- WGBX-TV (Channel 44; BOSTON, MA; Owner: WGBH EDUCATIONAL FOUNDATION)
- WFXT (Channel 25; BOSTON, MA; Owner: FOX TELEVISION STATIONS INC.)
- WUNI (Channel 27; WORCESTER, MA; Owner: ENTRAVISION HOLDINGS, LLC)
- WUTF (Channel 66; MARLBOROUGH, MA; Owner: TELEFUTURA BOSTON LLC)
- WLWC (Channel 28; NEW BEDFORD, MA; Owner: C-28 FCC LICENSEE SUBSIDIARY, LLC)
- W40BO (Channel 40; BOSTON, MA; Owner: PAXSON COMMUNICATIONS LPTV, INC.)
- WBPX (Channel 68; BOSTON, MA; Owner: PAXSON BOSTON-68 LICENSE, INC.)
- WYDN (Channel 48; WORCESTER, MA; Owner: EDUCATIONAL PUBLIC TV CORPORATION)
- WTMU-LP (Channel 32; BOSTON, MA; Owner: ZGS BOSTON, INC.)
- WCEA-LP (Channel 58; BOSTON, MA; Owner: CHANNEL 19 TV CORPORATION)
- National Bridge Inventory (NBI) Statistics
- 7Number of bridges
- 89ft / 26.6mTotal length
- $12,130,000Total costs
- 54,729Total average daily traffic
- 3,447Total average daily truck traffic
- 64,683Total future (year 2036) average daily traffic
FCC Registered Broadcast Land Mobile Towers:
8 (See the full list of FCC Registered Broadcast Land Mobile Towers in Central Falls, RI)FCC Registered Microwave Towers:
3- BOS2429, 30 Washington St. (Lat: 41.886667 Lon: -71.390278), Type: Bant, Structure height: 34.1 m, Call Sign: WQFP964, Licensee ID: L01728370,
Assigned Frequencies: 21925.0 MHz, 17845.0 MHz, 17900.0 MHz, 18060.0 MHz, Grant Date: 09/06/2006, Expiration Date: 09/06/2016, Cancellation Date: 11/12/2016, Certifier: Joseph M Sandri Jr., Registrant: Fibertower Network Services, Corp., Debtor-In-Possession, 1875 Eye Street, Nw, 5th Floor, Room 505, Washington, DC 20006, Phone: (202) 223-1028, Email:
- BOS2501, 280 Rand Street (Lat: 41.882500 Lon: -71.397028), Type: Tower, Structure height: 31.1 m, Call Sign: WQIB732, Licensee ID: L01728370,
Assigned Frequencies: 11245.0 MHz, Grant Date: 12/27/2007, Expiration Date: 12/27/2017, Cancellation Date: 01/06/2017, Certifier: Joseph M Sandri Jr., Registrant: Fibertower Network Services, Corp., Debtor-In-Possession, 1875 Eye Street, Nw, 5th Floor, Room 505, Washington, DC 20006, Phone: (202) 223-1028, Email:
- RI-PVD2088A, 30 Washington St (Lat: 41.886611 Lon: -71.390056), Type: Bant, Structure height: 31.8 m, Overall height: 34.8 m, Call Sign: WQMB540,
Assigned Frequencies: 11465.0 MHz, 11585.0 MHz, 22225.0 MHz, 22325.0 MHz, Grant Date: 08/04/2020, Expiration Date: 06/18/2030, Cancellation Date: 09/13/2021, Certifier: Nadja S Sodos-Wallace, Registrant: T-Mobile Usa, Inc., 12920 Se 38th Street, Bellevue, WA 98006, Phone: (425) 383-8402, Fax: (425) 383-4840, Email:
FCC Registered Amateur Radio Licenses:
15 (See the full list of FCC Registered Amateur Radio Licenses in Central Falls)FAA Registered Aircraft:
1- Aircraft: AERONCA 65-TC (Category: Land, Seats: 2, Weight: Up to 12,499 Pounds, Speed: 75 mph), Engine: CONT MOTOR A&C65 SERIES (65 HP) (Reciprocating)
N-Number: 31722, N31722, N-31722, Serial Number: 5970T, Year manufactured: 1940
Registrant (Individual): James Chambers, 230 Washington St, Central Falls, RI 02863
Deregistered: Cancel Date: 10/28/2017
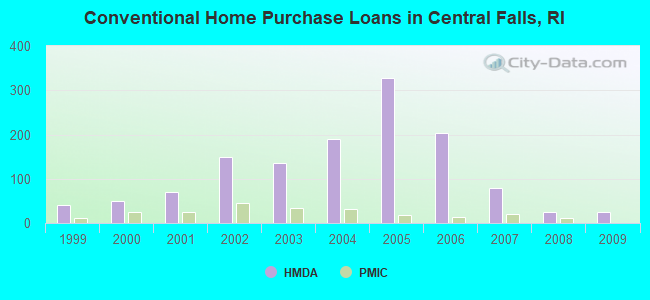
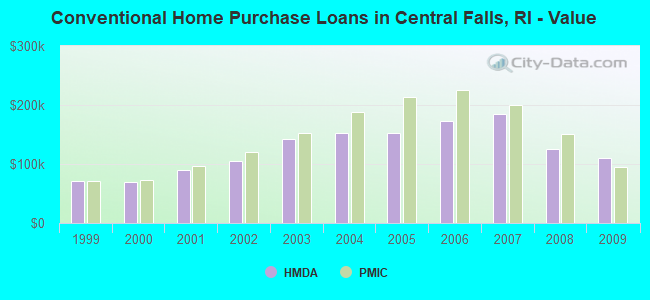
| Home Mortgage Disclosure Act Aggregated Statistics For Year 2009 (Based on 4 full tracts) | ||||||||||||
| A) FHA, FSA/RHS & VA Home Purchase Loans | B) Conventional Home Purchase Loans | C) Refinancings | D) Home Improvement Loans | E) Loans on Dwellings For 5+ Families | F) Non-occupant Loans on < 5 Family Dwellings (A B C & D) | |||||||
|---|---|---|---|---|---|---|---|---|---|---|---|---|
| Number | Average Value | Number | Average Value | Number | Average Value | Number | Average Value | Number | Average Value | Number | Average Value | |
| LOANS ORIGINATED | 43 | $123,326 | 24 | $110,000 | 48 | $147,583 | 16 | $30,438 | 2 | $1,580,000 | 17 | $104,765 |
| APPLICATIONS APPROVED, NOT ACCEPTED | 9 | $137,667 | 3 | $97,667 | 1 | $245,000 | 2 | $68,500 | 0 | $0 | 1 | $90,000 |
| APPLICATIONS DENIED | 27 | $138,222 | 11 | $114,818 | 45 | $156,756 | 6 | $55,333 | 1 | $250,000 | 6 | $78,500 |
| APPLICATIONS WITHDRAWN | 9 | $106,111 | 7 | $123,429 | 15 | $186,067 | 2 | $25,000 | 1 | $214,000 | 4 | $140,000 |
| FILES CLOSED FOR INCOMPLETENESS | 6 | $97,167 | 3 | $81,667 | 2 | $138,000 | 0 | $0 | 0 | $0 | 1 | $97,000 |
Detailed HMDA statistics for the following Tracts: 0108.00 , 0109.00, 0110.00, 0111.00
| Private Mortgage Insurance Companies Aggregated Statistics For Year 2009 (Based on 3 full tracts) | ||||
| A) Conventional Home Purchase Loans | B) Refinancings | |||
|---|---|---|---|---|
| Number | Average Value | Number | Average Value | |
| LOANS ORIGINATED | 1 | $95,000 | 1 | $120,000 |
| APPLICATIONS APPROVED, NOT ACCEPTED | 0 | $0 | 0 | $0 |
| APPLICATIONS DENIED | 1 | $86,000 | 0 | $0 |
| APPLICATIONS WITHDRAWN | 0 | $0 | 0 | $0 |
| FILES CLOSED FOR INCOMPLETENESS | 0 | $0 | 0 | $0 |
Detailed PMIC statistics for the following Tracts: 0108.00 , 0109.00, 0110.00, 0111.00
2003 - 2018 National Fire Incident Reporting System (NFIRS) incidents
- Fire incident types reported to NFIRS in Central Falls, RI
- 1,41587.6%Structure Fires
- 1076.6%Outside Fires
- 613.8%Mobile Property/Vehicle Fires
- 322.0%Other
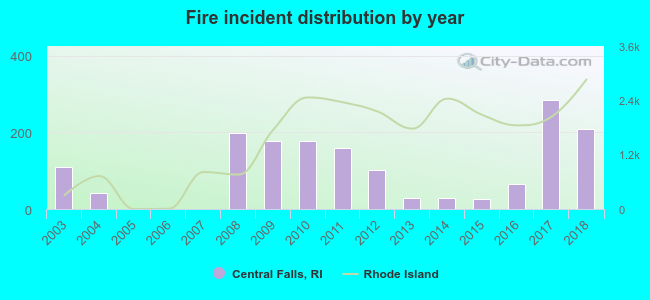 Based on the data from the years 2003 - 2018 the average number of fires per year is 101. The highest number of reported fire incidents - 284 took place in 2017, and the least - 0 in 2005. The data has a growing trend.
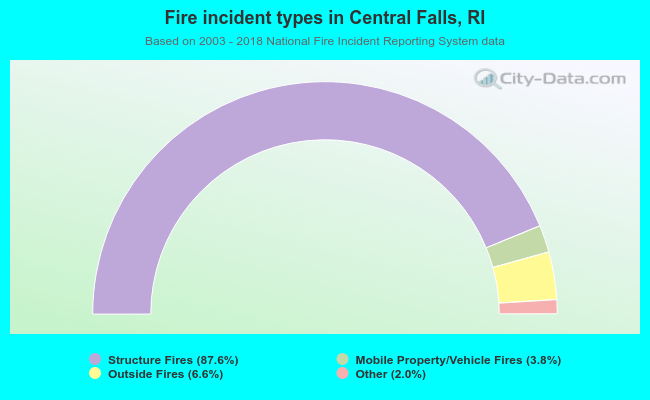 When looking into fire subcategories, the most reports belonged to: Structure Fires (87.6%), and Outside Fires (6.6%).
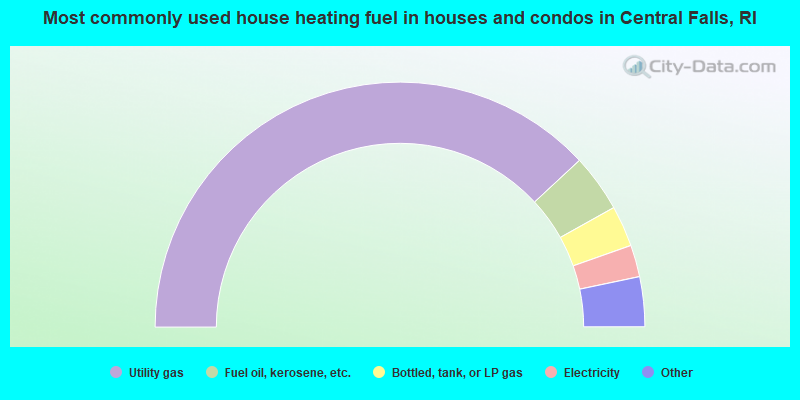
- 76.2%Utility gas
- 7.6%Fuel oil, kerosene, etc.
- 5.4%Bottled, tank, or LP gas
- 4.2%Electricity
- 3.0%Wood
- 2.7%Other fuel
- 0.8%No fuel used
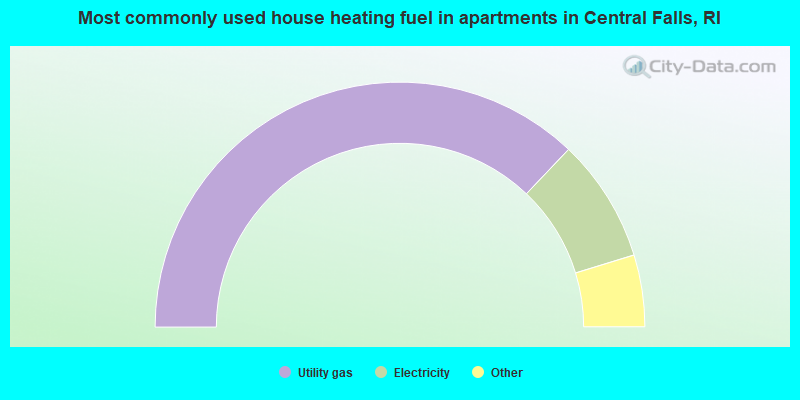
- 74.2%Utility gas
- 16.3%Electricity
- 3.3%Bottled, tank, or LP gas
- 3.1%Fuel oil, kerosene, etc.
- 1.9%No fuel used
- 1.2%Other fuel
Central Falls compared to Rhode Island state average:
- Median household income below state average.
- Unemployed percentage below state average.
- Hispanic race population percentage significantly above state average.
- Median age significantly below state average.
- Foreign-born population percentage significantly above state average.
- Renting percentage above state average.
- Length of stay since moving in above state average.
- Percentage of population with a bachelor's degree or higher significantly below state average.
Central Falls on our top lists:
- #5 on the list of "Top 101 cities with largest percentage of males in industries: administrative and support and waste management services (population 5,000+)"
- #5 on the list of "Top 101 cities with largest percentage of females in industries: administrative and support and waste management services (population 5,000+)"
- #16 on the list of "Top 101 cities with largest percentage of females in occupations: production occupations (population 5,000+)"
- #18 on the list of "Top 101 cities with the most residents born in Guatemala (population 500+)"
- #20 on the list of "Top 100 cities with oldest houses (pop. 5,000+)"
- #22 on the list of "Top 101 cities with the most residents born in Dominican Republic (population 500+)"
- #33 on the list of "Top 101 cities with largest percentage of males in occupations: building and grounds cleaning and maintenance occupations (population 5,000+)"
- #42 on the list of "Top 101 cities with the largest percentage of people in other types of correctional institutions (population 1,000+)"
- #43 on the list of "Top 101 cities with the highest housing density (population 2,000+)"
- #47 on the list of "Top 101 cities with the smallest percentage of one, detached housing units in structures (2,000+ housing units)"
- #53 on the list of "Top 101 cities with the most residents born in Portugal (population 500+)"
- #56 on the list of "Top 101 cities with the most residents born in Western Africa (population 500+)"
- #57 on the list of "Top 100 cities with highest percentage of renters (pop. 5,000+)"
- #66 on the list of "Top 100 cities with old houses but young residents"
- #68 on the list of "Top 101 cities with the most people below 50% of the poverty level, excluding cities with 15% or more of residents in college and with the median age below 28 (population 5,000+)"
- #73 on the list of "Top 101 cities with the most residents born in Colombia (population 500+)"
- #95 on the list of "Top 101 cities with the lowest percentage of workers working at home, population 5,000+"
- #95 on the list of "Top 100 least-educated cities (pop. 5,000+)"
- #97 on the list of "Top 101 cities with the most people below the poverty level, excluding cities with 15% or more of residents in college and with the median age below 28 (population 5,000+)"
- #17 on the list of "Top 101 counties with highest percentage of residents voting for Obama (Democrat) in the 2012 Presidential Election"
- #18 on the list of "Top 101 counties with the lowest percentage of residents that keep firearms around their homes"
- #20 on the list of "Top 101 counties with the most Catholic congregations"
- #38 on the list of "Top 101 counties with the most Orthodox adherents"
- #46 on the list of "Top 101 counties with the most Catholic adherents"

|
Total of 5 patent applications in 2008-2024.