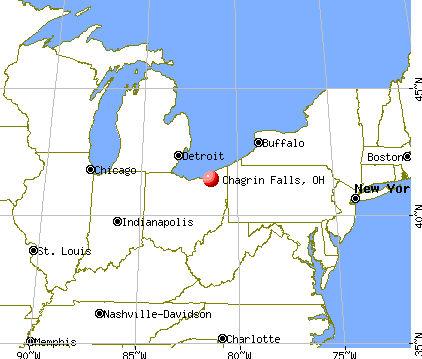
Chagrin Falls, Ohio
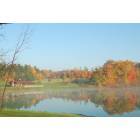
Chagrin Falls: lake on bainbridge border
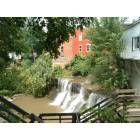
Chagrin Falls: Waterfall in Chagrin Falls
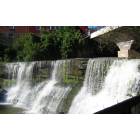
Chagrin Falls: Closeup of the Falls
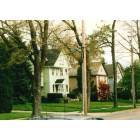
Chagrin Falls: A Chagrin Falls street
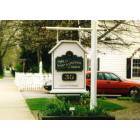
Chagrin Falls: Chagrin Falls nanny school
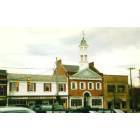
Chagrin Falls: Chagrin Falls downtown
- add
your
Submit your own pictures of this village and show them to the world
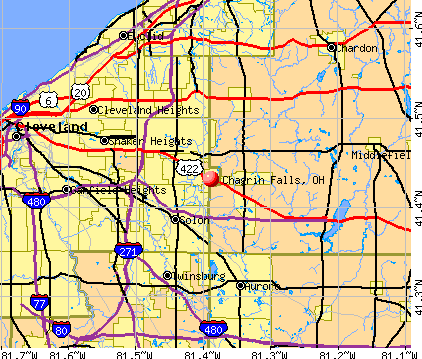
- OSM Map
- General Map
- Google Map
- MSN Map
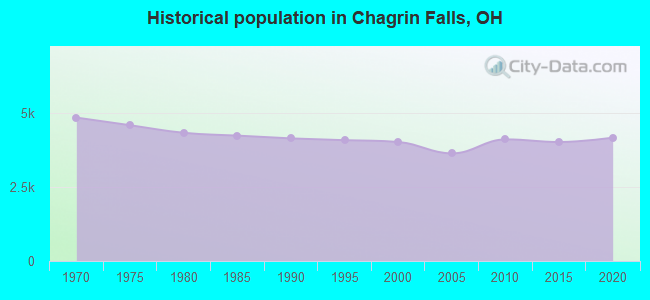
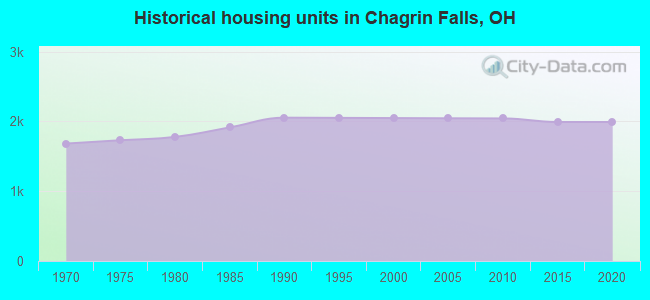
Population change since 2000: +2.2%
 |
| Males: 1,821 | |
| Females: 2,293 |
| Median resident age: | 49.7 years |
| Ohio median age: | 39.9 years |
Zip codes: 44022.
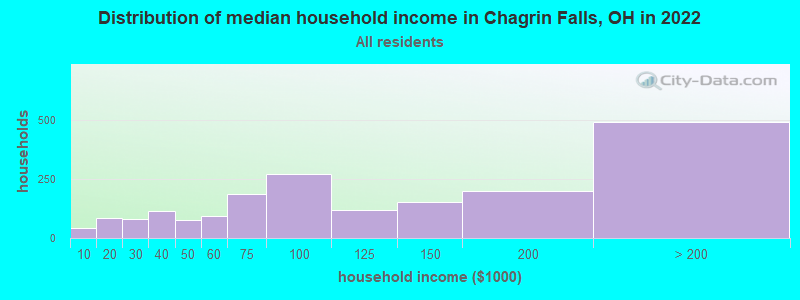
| Chagrin Falls: | $100,921 |
| OH: | $65,720 |
Estimated per capita income in 2022: $78,701 (it was $42,885 in 2000)
Chagrin Falls village income, earnings, and wages data
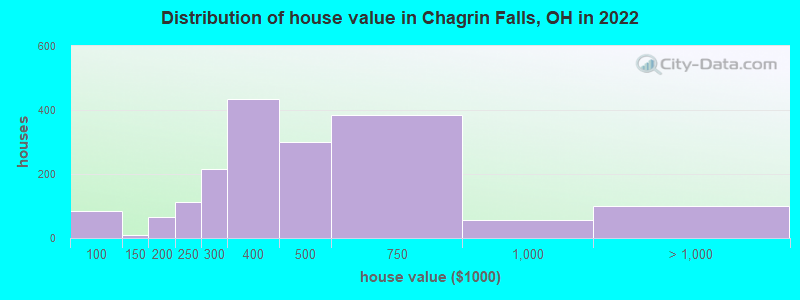
Estimated median house or condo value in 2022: $427,494 (it was $221,300 in 2000)
| Chagrin Falls: | $427,494 |
| OH: | $204,100 |
Mean prices in 2022: all housing units: $235,815; detached houses: $243,339; townhouses or other attached units: $214,792; in 2-unit structures: $118,975; in 3-to-4-unit structures: $232,984; in 5-or-more-unit structures: $177,601; mobile homes: $87,444
Median gross rent in 2022: $1,103.
(3.0% for White Non-Hispanic residents, 8.6% for two or more races residents)
Detailed information about poverty and poor residents in Chagrin Falls, OH
Compare current foreclosures near Chagrin Falls, OH:
| Photo | Address | Area | Beds / Baths | Price | Details |
|---|---|---|---|---|---|

|
#1
Akron St
Chagrin Falls, OH 44023
|
1,228 sq. feet
|
1 baths 3 beds |
show details | |

|
#2
Cleveland Dr
Chagrin Falls, OH 44023
|
1,154 sq. feet
|
1 baths 2 beds |
show details | |

|
#3
Country Ln
Chagrin Falls, OH 44023
|
1,790 sq. feet
|
1 baths 4 beds |
show details | |

|
#4
Snyder Rd
Chagrin Falls, OH 44023
|
1,344 sq. feet
|
1 baths 3 beds |
show details | |

|
#5
Lander Rd
Chagrin Falls, OH 44022
|
1,950 sq. feet
|
2 baths 3 beds |
show details | |

|
#6
Maple Hill Dr
Chagrin Falls, OH 44022
|
2,423 sq. feet
|
3 baths 4 beds |
show details | |

|
#7
Ascot Ln
Chagrin Falls, OH 44023
|
3,346 sq. feet
|
3 baths 4 beds |
show details | |

|
#8
Snyder Rd
Chagrin Falls, OH 44023
|
2,596 sq. feet
|
2 baths 3 beds |
show details | |

|
#9
Dayton St
Chagrin Falls, OH 44023
|
- sq. feet
|
- baths - beds |
show details | |

|
#10
Bell Rd
Chagrin Falls, OH 44022
|
- sq. feet
|
- baths - beds |
show details |
| Photo | Address | Area | Beds / Baths | Price | Details |
|---|---|---|---|---|---|

|
#11
Kent St
Chagrin Falls, OH 44023
|
- sq. feet
|
- baths - beds |
show details | |

|
#12
Bramley Ct
Chagrin Falls, OH 44022
|
- sq. feet
|
- baths - beds |
show details | |

|
#13
E 194th St
Cleveland, OH 44119
|
2,342 sq. feet
|
2 baths 4 beds |
$99,900
|
show details |

|
#14
Hastings Rd
Cleveland, OH 44125
|
1,578 sq. feet
|
1 baths 4 beds |
$164,900
|
show details |

|
#15
Oak St
Willoughby, OH 44094
|
958 sq. feet
|
1 baths 3 beds |
$115,000
|
show details |

|
#16
Wellner Rd
Eastlake, OH 44095
|
1,030 sq. feet
|
2 baths 3 beds |
$194,900
|
show details |

|
#17
Miller Ave
Cleveland, OH 44119
|
830 sq. feet
|
1 baths 2 beds |
$149,900
|
show details |

|
#18
E 262nd St
Euclid, OH 44132
|
1,245 sq. feet
|
3 baths 4 beds |
$209,900
|
show details |

|
#19
Lee Rd
Cleveland, OH 44128
|
912 sq. feet
|
1 baths 3 beds |
$44,100
|
show details |

|
#20
Creekwood Ln
Cleveland, OH 44143
|
4,154 sq. feet
|
3 baths 5 beds |
$425,900
|
show details |
| Photo | Address | Area | Beds / Baths | Price | Details |
|---|---|---|---|---|---|

|
#21
Alton Rd
Wickliffe, OH 44092
|
936 sq. feet
|
1 baths 3 beds |
$159,900
|
show details |

|
#22
Wilmington Rd
Cleveland, OH 44121
|
1,278 sq. feet
|
1 baths 3 beds |
$134,900
|
show details |

|
#23
E 137th St
Cleveland, OH 44120
|
1,637 sq. feet
|
1 baths 3 beds |
$59,900
|
show details |

|
#24
E 128th St
Cleveland, OH 44120
|
1,894 sq. feet
|
1 baths 4 beds |
$44,900
|
show details |

|
#25
Hale Dr
Streetsboro, OH 44241
|
1,874 sq. feet
|
2 baths 3 beds |
$314,500
|
show details |

|
#26
65 Noble Rd
Cleveland, OH 44112
|
- sq. feet
|
2 baths 4 beds |
$29,900
|
show details |

|
#27
Maryland Ave
Cleveland, OH 44105
|
1,908 sq. feet
|
2 baths 4 beds |
$29,900
|
show details |

|
#28
Worley Ave
Cleveland, OH 44105
|
1,956 sq. feet
|
2 baths 6 beds |
show details | |

|
#29
Stevenson Rd
Cleveland, OH 44110
|
2,502 sq. feet
|
2 baths 7 beds |
show details | |

|
#30
Cleveland Rd
Cleveland, OH 44108
|
2,088 sq. feet
|
2 baths 4 beds |
show details |
| Photo | Address | Area | Beds / Baths | Price | Details |
|---|---|---|---|---|---|

|
#31
Daleford Rd
Cleveland, OH 44120
|
3,164 sq. feet
|
3 baths 6 beds |
show details | |

|
#32
Taylor Rd
Cleveland, OH 44112
|
1,344 sq. feet
|
2 baths 4 beds |
show details | |

|
#33
E 175th St
Cleveland, OH 44128
|
1,026 sq. feet
|
1 baths 3 beds |
show details | |

|
#34
Robinson Ave
Cleveland, OH 44125
|
1,020 sq. feet
|
1 baths 3 beds |
show details | |

|
#35
E Miner Rd
Cleveland, OH 44124
|
1,296 sq. feet
|
1 baths 3 beds |
show details | |

|
#36
E 86th St
Cleveland, OH 44125
|
1,111 sq. feet
|
2 baths 3 beds |
show details | |

|
#37
Somerton Rd
Cleveland, OH 44118
|
1,260 sq. feet
|
2 baths 6 beds |
show details | |

|
#38
Trafalgar Ave
Cleveland, OH 44110
|
1,152 sq. feet
|
1 baths 3 beds |
show details | |

|
#39
Chatworth Dr
Euclid, OH 44117
|
1,433 sq. feet
|
2 baths 3 beds |
show details | |

|
#40
Monticello Blvd
Cleveland, OH 44121
|
1,784 sq. feet
|
1 baths 4 beds |
show details |
| Photo | Address | Area | Beds / Baths | Price | Details |
|---|---|---|---|---|---|

|
#41
Lucknow Ave
Cleveland, OH 44110
|
1,970 sq. feet
|
2 baths 4 beds |
show details | |

|
#42
Opal Ct
Streetsboro, OH 44241
|
3,028 sq. feet
|
3 baths 4 beds |
show details | |

|
#43
Orchardview Rd
Independence, OH 44131
|
1,680 sq. feet
|
1 baths 3 beds |
show details | |

|
#44
Otis Ct
Cleveland, OH 44104
|
936 sq. feet
|
1 baths 2 beds |
show details | |

|
#45
Fern Dr
Eastlake, OH 44095
|
897 sq. feet
|
1 baths 3 beds |
show details | |

|
#46
Noble Beach Dr
Euclid, OH 44123
|
1,991 sq. feet
|
2 baths 4 beds |
show details | |

|
#47
Oxford Rd
Cleveland, OH 44121
|
1,708 sq. feet
|
1 baths 3 beds |
show details | |

|
#48
E 143rd St
Cleveland, OH 44128
|
1,161 sq. feet
|
1 baths 4 beds |
show details | |

|
#49
Euclid Ave
Cleveland, OH 44112
|
3,311 sq. feet
|
3 baths 4 beds |
show details | |

|
Check over 1 million property listings on Foreclosure.com!
|
browse all offers | |||


- 3,58788.6%White alone
- 1393.4%Two or more races
- 1313.2%Black alone
- 832.1%Asian alone
- 611.5%Hispanic
- 150.4%Other race alone
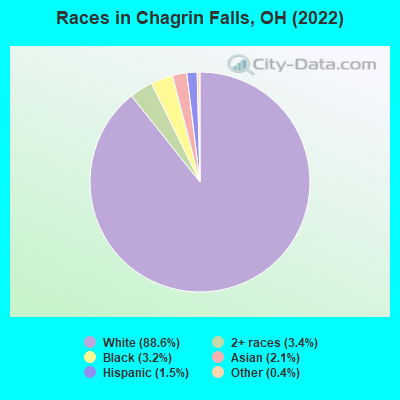
Races in Chagrin Falls detailed stats: ancestries, foreign born residents, place of birth
According to our research of Ohio and other state lists, there were 14 registered sex offenders living in Chagrin Falls, Ohio as of April 27, 2024.
The ratio of all residents to sex offenders in Chagrin Falls is 288 to 1.
Type |
2009 |
2010 |
2011 |
2012 |
2013 |
2014 |
2015 |
2016 |
2017 |
2018 |
2019 |
2020 |
2021 |
2022 |
|---|---|---|---|---|---|---|---|---|---|---|---|---|---|---|
| Murders (per 100,000) | 0 (0.0) | 0 (0.0) | 0 (0.0) | 0 (0.0) | 0 (0.0) | 0 (0.0) | 0 (0.0) | 2 (50.0) | 0 (0.0) | 0 (0.0) | 0 (0.0) | 0 (0.0) | 0 (0.0) | 0 (0.0) |
| Rapes (per 100,000) | 0 (0.0) | 0 (0.0) | 0 (0.0) | 0 (0.0) | 0 (0.0) | 0 (0.0) | 0 (0.0) | 1 (25.0) | 1 (25.1) | 0 (0.0) | 0 (0.0) | 0 (0.0) | 0 (0.0) | 1 (24.5) |
| Robberies (per 100,000) | 0 (0.0) | 0 (0.0) | 0 (0.0) | 2 (49.0) | 1 (24.6) | 0 (0.0) | 0 (0.0) | 0 (0.0) | 0 (0.0) | 0 (0.0) | 1 (25.4) | 0 (0.0) | 0 (0.0) | 0 (0.0) |
| Assaults (per 100,000) | 0 (0.0) | 0 (0.0) | 0 (0.0) | 1 (24.5) | 0 (0.0) | 0 (0.0) | 2 (49.7) | 1 (25.0) | 1 (25.1) | 3 (75.5) | 0 (0.0) | 0 (0.0) | 3 (76.5) | 1 (24.5) |
| Burglaries (per 100,000) | 0 (0.0) | 0 (0.0) | 6 (145.8) | 7 (171.5) | 9 (221.2) | 6 (148.3) | 9 (223.7) | 3 (74.9) | 3 (75.2) | 2 (50.3) | 16 (406.0) | 3 (76.5) | 2 (51.0) | 2 (49.0) |
| Thefts (per 100,000) | 0 (0.0) | 0 (0.0) | 31 (753.2) | 23 (563.6) | 42 (1,032) | 25 (618.0) | 29 (720.7) | 24 (599.6) | 36 (902.0) | 13 (327.2) | 25 (634.4) | 26 (663.1) | 27 (688.6) | 32 (783.5) |
| Auto thefts (per 100,000) | 0 (0.0) | 0 (0.0) | 2 (48.6) | 1 (24.5) | 2 (49.2) | 3 (74.2) | 2 (49.7) | 0 (0.0) | 0 (0.0) | 0 (0.0) | 0 (0.0) | 9 (229.5) | 5 (127.5) | 6 (146.9) |
| Arson (per 100,000) | 0 (0.0) | 0 (0.0) | 0 (0.0) | 1 (24.5) | 0 (0.0) | 0 (0.0) | 0 (0.0) | 0 (0.0) | 0 (0.0) | 0 (0.0) | 0 (0.0) | 0 (0.0) | 0 (0.0) | 0 (0.0) |
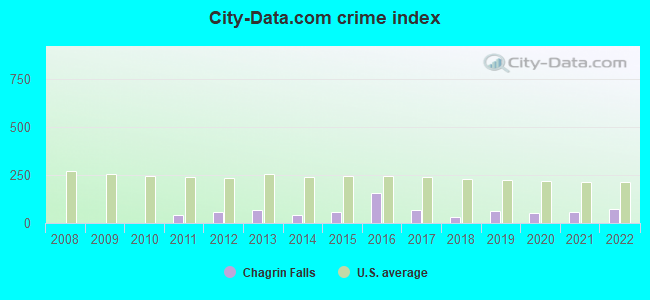
| City-Data.com crime index | 0.0 | 0.0 | 44.2 | 56.1 | 68.1 | 41.0 | 58.4 | 154.1 | 66.4 | 31.7 | 61.4 | 50.2 | 56.6 | 71.0 |
The City-Data.com crime index weighs serious crimes and violent crimes more heavily. Higher means more crime, U.S. average is 246.1. It adjusts for the number of visitors and daily workers commuting into cities.
Crime rate in Chagrin Falls detailed stats: murders, rapes, robberies, assaults, burglaries, thefts, arson
Full-time law enforcement employees in 2020, including police officers: 14 (13 officers - 11 male; 2 female).
| Officers per 1,000 residents here: | 3.32 |
| Ohio average: | 2.24 |
 Recent articles from our blog. Our writers, many of them Ph.D. graduates or candidates, create easy-to-read articles on a wide variety of topics.

 | Housing Prices - Chagrin Falls vs. CH / SH (29 replies) |
| Cleveland Restaurant News (158 replies) |
| Ohio's most Hallmark-like small town (20 replies) |
| Charming “Main Street” Places in or near Cleveland (133 replies) |
| Looking for New England town b/t Cleveland and Akron (18 replies) |
| Compendium of threads & posts on Univ. Circle, Cleveland Hts., Shaker Ht., Univ. Hts., Beachwood area (105 replies) |
Latest news from Chagrin Falls, OH collected exclusively by city-data.com from local newspapers, TV, and radio stations
Ancestries: German (15.7%), American (11.4%), European (7.3%), Italian (7.1%), English (6.6%), Polish (4.7%).
Current Local Time: EST time zone
Incorporated in 1962
Elevation: 927 feet
Land area: 2.07 square miles.
Population density: 1,987 people per square mile (low).
307 residents are foreign born (5.1% Europe, 1.3% Africa).
| This village: | 7.6% |
| Ohio: | 4.9% |
Median real estate property taxes paid for housing units with mortgages in 2022: $8,348 (1.9%)
Median real estate property taxes paid for housing units with no mortgage in 2022: $8,643 (2.0%)
Nearest city with pop. 50,000+: Euclid, OH  (13.2 miles , pop. 52,717).
Nearest city with pop. 200,000+: Cleveland, OH (15.0 miles , pop. 478,403).
Nearest city with pop. 1,000,000+: Chicago, IL (326.3 miles , pop. 2,896,016).
Nearest cities:
), ), ), ), )Latitude: 41.43 N, Longitude: 81.39 W
Daytime population change due to commuting: +773 (+19.1%)
Workers who live and work in this village: 1,061 (52.2%)
Area code: 440
Property values in Chagrin Falls, OH
Chagrin Falls, Ohio accommodation & food services, waste management - Economy and Business Data
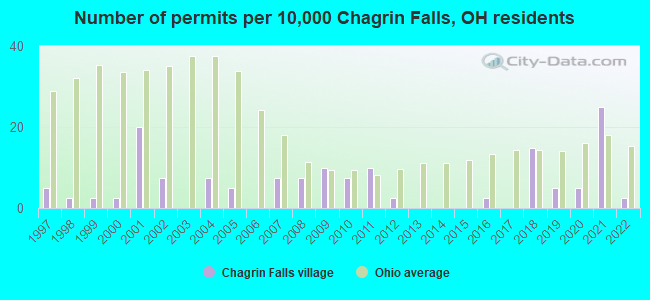
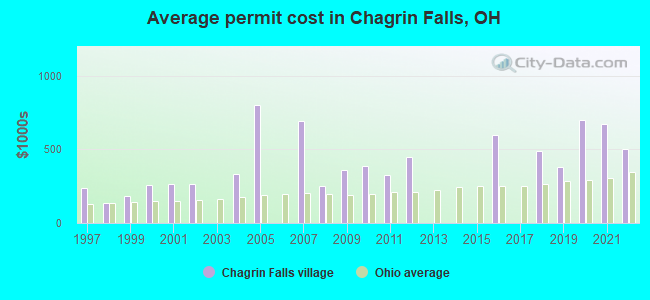
Single-family new house construction building permits:
- 2022: 1 building, cost: $500,000
- 2021: 10 buildings, average cost: $672,700
- 2020: 2 buildings, average cost: $700,000
- 2019: 2 buildings, average cost: $383,000
- 2018: 6 buildings, average cost: $490,000
- 2016: 1 building, cost: $600,000
- 2012: 1 building, cost: $450,000
- 2011: 4 buildings, average cost: $326,300
- 2010: 3 buildings, average cost: $388,700
- 2009: 4 buildings, average cost: $361,300
- 2008: 3 buildings, average cost: $250,000
- 2007: 3 buildings, average cost: $691,700
- 2005: 2 buildings, average cost: $800,000
- 2004: 3 buildings, average cost: $333,300
- 2002: 3 buildings, average cost: $266,700
- 2001: 8 buildings, average cost: $264,300
- 2000: 1 building, cost: $260,000
- 1999: 1 building, cost: $185,000
- 1998: 1 building, cost: $135,000
- 1997: 2 buildings, average cost: $240,000
| Here: | 3.2% |
| Ohio: | 3.1% |

- Professional, scientific, technical services (11.7%)
- Educational services (9.6%)
- Health care (8.9%)
- Finance & insurance (8.2%)
- Accommodation & food services (5.0%)
- Arts, entertainment, recreation (3.3%)
- Real estate & rental & leasing (3.0%)
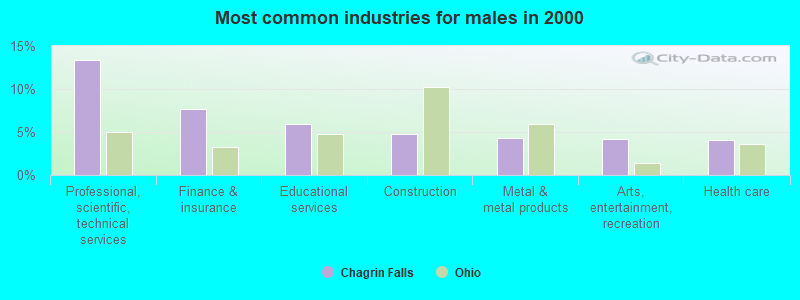
- Professional, scientific, technical services (13.4%)
- Finance & insurance (7.7%)
- Educational services (6.0%)
- Construction (4.8%)
- Metal & metal products (4.3%)
- Arts, entertainment, recreation (4.2%)
- Health care (4.1%)
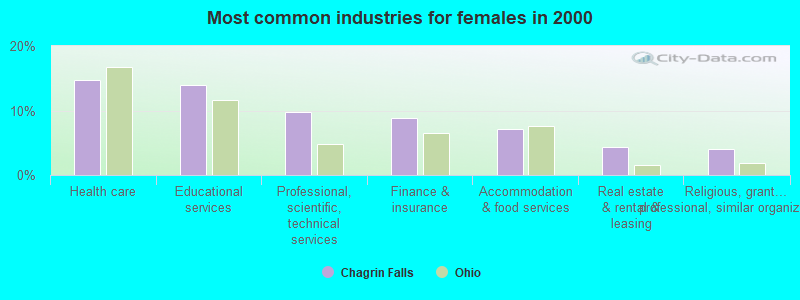
- Health care (14.7%)
- Educational services (13.9%)
- Professional, scientific, technical services (9.7%)
- Finance & insurance (8.8%)
- Accommodation & food services (7.1%)
- Real estate & rental & leasing (4.4%)
- Religious, grantmaking, civic, professional, similar organizations (4.0%)

- Top executives (7.9%)
- Sales representatives, services, wholesale and manufacturing (7.2%)
- Other management occupations, except farmers and farm managers (6.0%)
- Retail sales workers, except cashiers (5.7%)
- Other sales and related occupations, including supervisors (5.0%)
- Preschool, kindergarten, elementary, and middle school teachers (3.1%)
- Media and communications workers (2.9%)
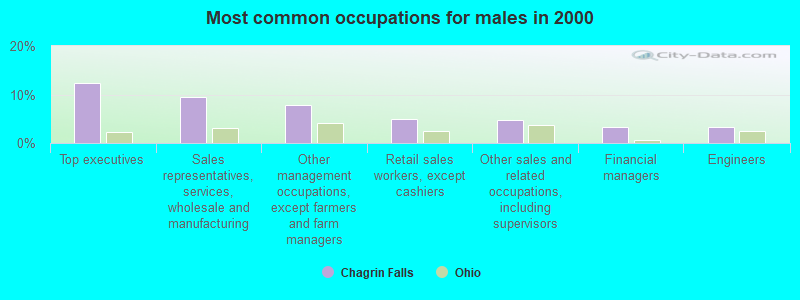
- Top executives (12.4%)
- Sales representatives, services, wholesale and manufacturing (9.5%)
- Other management occupations, except farmers and farm managers (7.9%)
- Retail sales workers, except cashiers (4.9%)
- Other sales and related occupations, including supervisors (4.8%)
- Financial managers (3.4%)
- Engineers (3.4%)

- Retail sales workers, except cashiers (6.7%)
- Preschool, kindergarten, elementary, and middle school teachers (6.0%)
- Other sales and related occupations, including supervisors (5.1%)
- Sales representatives, services, wholesale and manufacturing (4.5%)
- Advertising, marketing, promotions, public relations, and sales managers (4.3%)
- Registered nurses (4.0%)
- Art and design workers (3.9%)
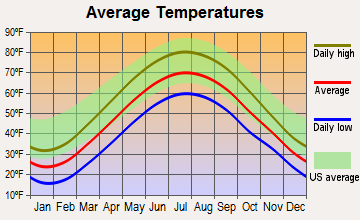
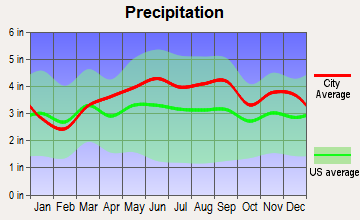
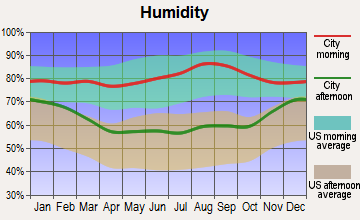
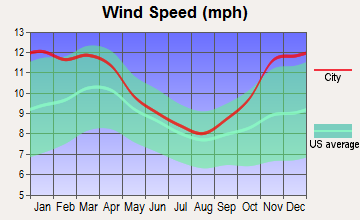
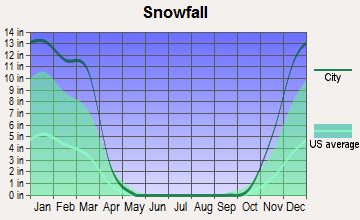
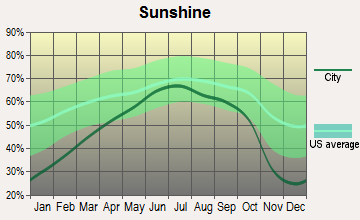
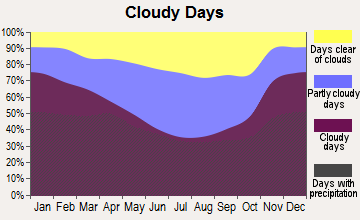
Average climate in Chagrin Falls, Ohio
Based on data reported by over 4,000 weather stations
(lower is better)
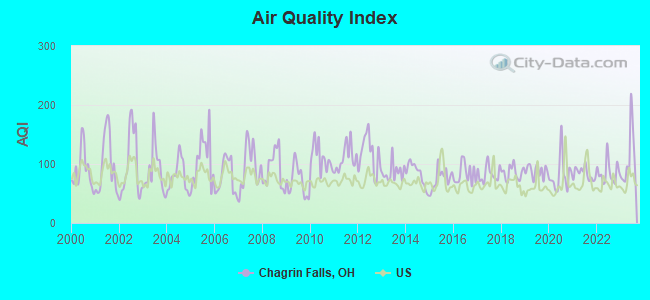
Air Quality Index (AQI) level in 2023 was 109. This is significantly worse than average.
| City: | 109 |
| U.S.: | 73 |
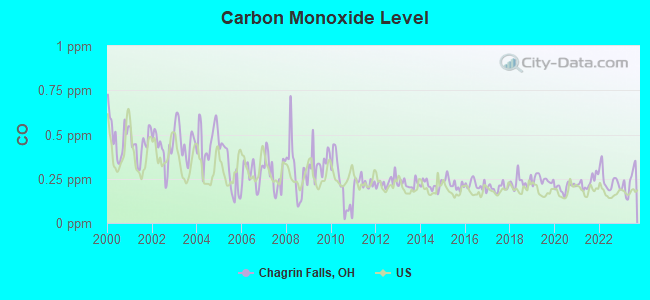
Carbon Monoxide (CO) [ppm] level in 2023 was 0.235. This is about average. Closest monitor was 10.1 miles away from the city center.
| City: | 0.235 |
| U.S.: | 0.251 |
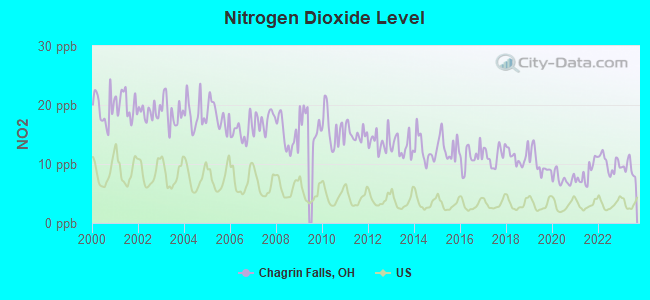
Nitrogen Dioxide (NO2) [ppb] level in 2023 was 9.32. This is significantly worse than average. Closest monitor was 3.9 miles away from the city center.
| City: | 9.32 |
| U.S.: | 5.11 |
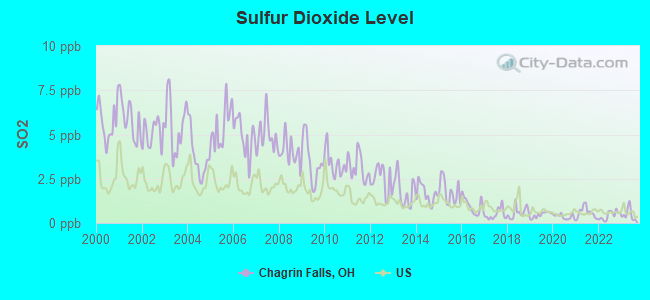
Sulfur Dioxide (SO2) [ppb] level in 2023 was 0.491. This is significantly better than average. Closest monitor was 3.9 miles away from the city center.
| City: | 0.491 |
| U.S.: | 1.515 |
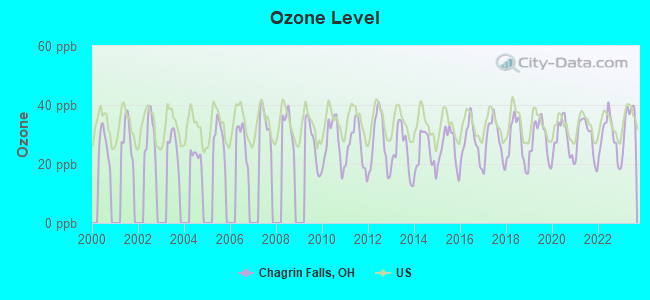
Ozone [ppb] level in 2023 was 34.2. This is about average. Closest monitor was 12.9 miles away from the city center.
| City: | 34.2 |
| U.S.: | 33.3 |
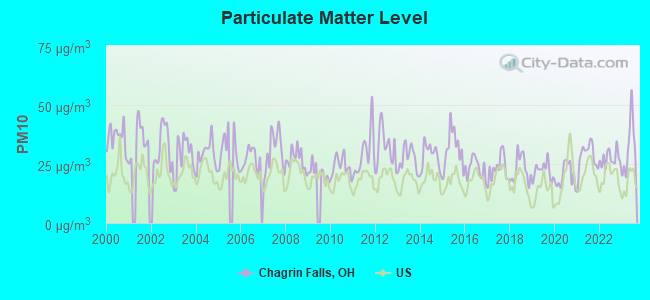
Particulate Matter (PM10) [µg/m3] level in 2023 was 32.2. This is significantly worse than average. Closest monitor was 14.2 miles away from the city center.
| City: | 32.2 |
| U.S.: | 19.2 |
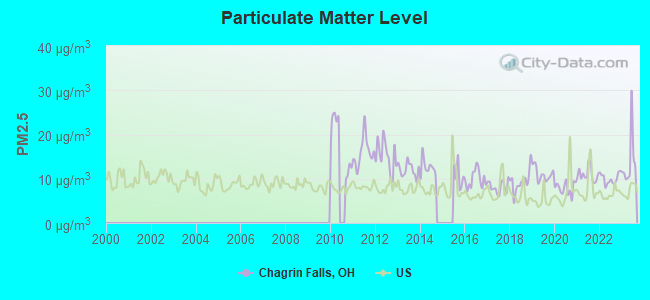
Particulate Matter (PM2.5) [µg/m3] level in 2023 was 13.9. This is significantly worse than average. Closest monitor was 10.2 miles away from the city center.
| City: | 13.9 |
| U.S.: | 8.1 |
Tornado activity:
Chagrin Falls-area historical tornado activity is slightly below Ohio state average. It is 4% smaller than the overall U.S. average.
On 5/31/1985, a category F5 (max. wind speeds 261-318 mph) tornado 20.2 miles away from the Chagrin Falls village center killed 18 people and injured 310 people and caused between $50,000,000 and $500,000,000 in damages.
On 6/8/1953, a category F4 (max. wind speeds 207-260 mph) tornado 17.8 miles away from the village center killed 17 people and injured 379 people.
Earthquake activity:
Chagrin Falls-area historical earthquake activity is significantly above Ohio state average. It is 52% smaller than the overall U.S. average.On 9/25/1998 at 19:52:52, a magnitude 5.2 (4.8 MB, 4.3 MS, 5.2 LG, 4.5 MW, Depth: 3.1 mi, Class: Moderate, Intensity: VI - VII) earthquake occurred 51.6 miles away from the city center
On 1/31/1986 at 16:46:43, a magnitude 5.0 (5.0 MB) earthquake occurred 16.7 miles away from the city center
On 8/23/2011 at 17:51:04, a magnitude 5.8 (5.8 MW, Depth: 3.7 mi) earthquake occurred 305.1 miles away from the city center
On 6/10/2019 at 14:50:45, a magnitude 4.0 (4.0 MB, Depth: 1.2 mi, Class: Light, Intensity: IV - V) earthquake occurred 17.5 miles away from the city center
On 7/27/1980 at 18:52:21, a magnitude 5.2 (5.1 MB, 4.7 MS, 5.0 UK, 5.2 UK) earthquake occurred 261.1 miles away from the city center
On 12/31/2011 at 20:05:01, a magnitude 4.0 (4.0 ML, Depth: 3.1 mi) earthquake occurred 42.4 miles away from the city center
Magnitude types: regional Lg-wave magnitude (LG), body-wave magnitude (MB), local magnitude (ML), surface-wave magnitude (MS), moment magnitude (MW)
Natural disasters:
The number of natural disasters in Cuyahoga County (16) is near the US average (15).Major Disasters (Presidential) Declared: 12
Emergencies Declared: 3
Causes of natural disasters: Storms: 9, Floods: 8, Tornadoes: 7, Winds: 3, Hurricanes: 2, Blizzard: 1, Heavy Rain: 1, Power Outage: 1, Snowstorm: 1, Tropical Storm: 1, Other: 1 (Note: some incidents may be assigned to more than one category).

Hospitals and medical centers in Chagrin Falls:
Airports and heliports located in Chagrin Falls:
See details about Airports and heliports located in Chagrin Falls, OHAmtrak station near Chagrin Falls:
Colleges/universities with over 2000 students nearest to Chagrin Falls:
- John Carroll University (about 9 miles; University Heights, OH; Full-time enrollment: 3,546)
- Case Western Reserve University (about 13 miles; Cleveland, OH; FT enrollment: 7,034)
- Lakeland Community College (about 15 miles; Kirtland, OH; FT enrollment: 6,170)
- Cuyahoga Community College District (about 16 miles; Cleveland, OH; FT enrollment: 20,271)
- Cleveland State University (about 16 miles; Cleveland, OH; FT enrollment: 14,161)
- Kent State University at Kent (about 20 miles; Kent, OH; FT enrollment: 25,431)
- Baldwin Wallace University (about 25 miles; Berea, OH; FT enrollment: 3,699)
Public high schools in Chagrin Falls:
- KENSTON HIGH SCHOOL (Students: 1,027, Location: 9500 BAINBRIDGE RD, Grades: 9-12)
- CHAGRIN FALLS HIGH SCHOOL (Students: 638, Location: 400 E WASHINGTON ST, Grades: 9-12)
Private high school in Chagrin Falls:
Public elementary/middle schools in Chagrin Falls:
- KENSTON MIDDLE SCHOOL (Students: 747, Location: 17425 SNYDER RD, Grades: 6-8)
- TIMMONS ELEMENTARY SCHOOL (Students: 657, Location: 9595 E WASHINGTON ST, Grades: KG-3)
- GURNEY ELEMENTARY SCHOOL (Students: 529, Location: 1155 BELL RD, Grades: PK-3)
- KENSTON INTERMEDIATE SCHOOL (Students: 490, Location: 17419 SNYDER RD, Grades: 3-5)
- CHAGRIN FALLS INTERMEDIATE ELEMENTARY SCHOOL (Students: 470, Location: 77 E WASHINGTON ST, Grades: 4-6)
- CHAGRIN FALLS MIDDLE SCHOOL (Students: 278, Location: 342 E WASHINGTON ST, Grades: 7-8)
Private elementary/middle school in Chagrin Falls:
Points of interest:
Notable locations in Chagrin Falls: Chagrin Falls Wastewater Treatment Facility (A), Chagrin Falls Fire Department (B). Display/hide their locations on the map
Shopping Centers: Chagrin Falls Shopping Center (1), Stepnorth Retail Cluster Mall Shopping Center (2). Display/hide their locations on the map
Churches in Chagrin Falls include: First Church of Christ Scientist (A), United Methodist Church of Chagrin Falls (B). Display/hide their locations on the map
Cemeteries: Evergreen Cemetery (1), Grove Hill Cemetery (2). Display/hide their locations on the map
Lakes and reservoirs: Millpond (A), Chase Bag Company Lower Lake (B), Chase Bag Company Upper Lake (C). Display/hide their locations on the map
Parks in Chagrin Falls include: Chagrin Falls West Side Historic District (1), Chagrin Falls Triangle Park Commercial Historic District (2), Riverside Park (3). Display/hide their locations on the map
Tourist attractions: Chagrin Falls Historical Society (Historical Places & Services; 21 Walnut Street), Amish Country Balloon Tours (7780 Bainbridge Road), Arctic Freeze Arena LLC (Arcades & Amusements; 9999 E Washington St).
Birthplace of: Wendy Diamond - Magazine editor, Addie L. Ballou - Suffragist, Bryan Malessa - Novelist, Lisa Banes - Stage, Logan White - College basketball player (Dayton Flyers), Oliver Simmons (Canadian politician) - Politician.
Drinking water stations with addresses in Chagrin Falls and their reported violations in the past:
CHAGRIN FALLS VILLAGE PWS (Population served: 4,400, Purch surface water):Past monitoring violations:THE POND ICE RINK PWS (Address: 9999 East Washington Street , Population served: 300, Groundwater):
- Lead Consumer Notice - In DEC-31-2009, Contaminant: Lead and Copper Rule. Follow-up actions: St Violation/Reminder Notice (JUN-30-2010), St Compliance achieved (SEP-22-2010)
- One minor monitoring violation
Past health violations:THE WEMBLEY CLUB (Population served: 230, Groundwater):Past monitoring violations:
- MCL, Monthly (TCR) - Between JUL-2011 and SEP-2011, Contaminant: Coliform. Follow-up actions: St Violation/Reminder Notice (AUG-22-2011), St Public Notif requested (AUG-22-2011)
- 5 routine major monitoring violations
- 2 regular monitoring violations
Past health violations:SUN VALLEY BANQUET AND PARTY CENTER PWS (Address: 10000 EDWARDS LANE , Population served: 150, Groundwater):Past monitoring violations:
- MCL, Monthly (TCR) - In OCT-2008, Contaminant: Coliform. Follow-up actions: St Violation/Reminder Notice (NOV-17-2008), St Public Notif requested (NOV-17-2008), St Compliance achieved (AUG-09-2011)
- MCL, Monthly (TCR) - Between JUL-2008 and SEP-2008, Contaminant: Coliform. Follow-up actions: St Violation/Reminder Notice (SEP-23-2008), St Public Notif requested (SEP-23-2008), St Compliance achieved (AUG-05-2009)
- Monitoring, Repeat Major (TCR) - In OCT-2008, Contaminant: Coliform (TCR). Follow-up actions: St Violation/Reminder Notice (NOV-12-2008), St Public Notif requested (NOV-12-2008), St Compliance achieved (AUG-09-2011)
- One routine major monitoring violation
Past monitoring violations:PINE LAKE TROUT CLUB (Address: 17021 CHILLICOTHE ROAD , Population served: 115, Groundwater):
- 3 routine major monitoring violations
Past health violations:VALLEY HOLDING COMPANY (Population served: 85, Groundwater):Past monitoring violations:
- MCL, Monthly (TCR) - In SEP-2010, Contaminant: Coliform. Follow-up actions: St Public Notif requested (SEP-30-2010), St Violation/Reminder Notice (SEP-30-2010), St Public Notif received (DEC-02-2010)
- One routine major monitoring violation
Past monitoring violations:GREENTREE WATER COMPANY (Population served: 52, Groundwater):
- 9 routine major monitoring violations
- 4 regular monitoring violations
Past monitoring violations:PILGRIM LAKE COLONY INC (Population served: 50, Groundwater):
- Lead Consumer Notice - In DEC-31-2010, Contaminant: Lead and Copper Rule. Follow-up actions: St Violation/Reminder Notice (FEB-23-2011), St Compliance achieved (SEP-19-2011)
Past health violations:Past monitoring violations:
- MCL, Monthly (TCR) - In JUN-2011, Contaminant: Coliform. Follow-up actions: St Public Notif requested (JUL-19-2011), St Violation/Reminder Notice (JUL-19-2011), St Compliance achieved (MAY-07-2012), St Public Notif received (JUN-06-2012)
- MCL, Monthly (TCR) - Between APR-2009 and JUN-2009, Contaminant: Coliform. Follow-up actions: St Public Notif requested (JUN-09-2009), St Violation/Reminder Notice (JUN-09-2009), St Public Notif received (JUN-06-2012)
- MCL, Monthly (TCR) - In MAY-2008, Contaminant: Coliform. Follow-up actions: St Public Notif requested (JUN-04-2008), St Violation/Reminder Notice (JUN-04-2008), St Public Notif received (JUN-06-2012)
- MCL, Monthly (TCR) - Between JUL-2007 and SEP-2007, Contaminant: Coliform. Follow-up actions: St Public Notif requested (SEP-11-2007), St Violation/Reminder Notice (SEP-11-2007), St Compliance achieved (APR-24-2008), St Public Notif received (JUN-06-2012)
- MCL, Monthly (TCR) - Between JUL-2005 and SEP-2005, Contaminant: Coliform. Follow-up actions: St Public Notif requested (JUL-08-2005), St Violation/Reminder Notice (JUL-08-2005), St Compliance achieved (JUN-27-2007)
- Monitoring, Source Water (GWR) - In JUN-01-2011, Contaminant: E. COLI. Follow-up actions: St Public Notif requested (JUL-14-2011), St Violation/Reminder Notice (JUL-14-2011), St Compliance achieved (JUL-18-2011), St Public Notif received (JUN-06-2012)
- Monitoring, Repeat Major (TCR) - In JUN-2011, Contaminant: Coliform (TCR). Follow-up actions: St Public Notif requested (JUL-14-2011), St Violation/Reminder Notice (JUL-14-2011), St Public Notif received (JUN-06-2012)
- 2 routine major monitoring violations
| This village: | 2.2 people |
| Ohio: | 2.4 people |
| This village: | 56.0% |
| Whole state: | 65.0% |
| This village: | 4.2% |
| Whole state: | 6.8% |
Likely homosexual households (counted as self-reported same-sex unmarried-partner households)
- Lesbian couples: 0.2% of all households
- Gay men: 0.1% of all households
People in group quarters in Chagrin Falls in 2000:
- 42 people in nursing homes
- 4 people in religious group quarters
- 2 people in other nonhousehold living situations
Banks with most branches in Chagrin Falls (2011 data):
- The Huntington National Bank: 7 branches. Info updated 2012/04/02: Bank assets: $54,183.4 mil, Deposits: $44,300.3 mil, headquarters in Columbus, OH, positive income, Commercial Lending Specialization, 878 total offices, Holding Company: Huntington Bancshares Incorporated
- KeyBank National Association: Chagrin Falls Branch, East Washington Branch, Bainbridge Branch. Info updated 2008/03/03: Bank assets: $86,198.8 mil, Deposits: $64,214.8 mil, headquarters in Cleveland, OH, positive income, Commercial Lending Specialization, 1067 total offices, Holding Company: Keycorp
- RBS Citizens, National Association: Chagrin Falls at 4 East Washington Street, branch established on 1893/01/01; Tanglewood Square Branch at 8575 Tanglewood Mall, branch established on 1916/01/01. Info updated 2007/09/19: Bank assets: $106,940.6 mil, Deposits: $75,690.2 mil, headquarters in Providence, RI, positive income, 1135 total offices, Holding Company: Uk Financial Investments Limited
- PNC Bank, National Association: Chagrin Valley Branch at 8391 East Washington Street, branch established on 1996/11/18; Chagrin Falls Branch at 34 North Main Street, branch established on 1984/08/09. Info updated 2012/03/20: Bank assets: $263,309.6 mil, Deposits: $197,343.0 mil, headquarters in Wilmington, DE, positive income, Commercial Lending Specialization, 3085 total offices, Holding Company: Pnc Financial Services Group, Inc., The
- Citizens Bank: Bainbridge Township Branch at 8555 Tanglewood Square, branch established on 1920/01/01. Info updated 2011/08/01: Bank assets: $9,212.3 mil, Deposits: $7,452.0 mil, headquarters in Flint, MI, positive income, Commercial Lending Specialization, 220 total offices, Holding Company: Citizens Republic Bancorp, Inc.
- Fifth Third Bank: Bainbridge Branch at 8355 East Washington Street, branch established on 2002/11/25. Info updated 2009/10/05: Bank assets: $114,540.4 mil, Deposits: $89,689.1 mil, headquarters in Cincinnati, OH, positive income, Commercial Lending Specialization, 1378 total offices, Holding Company: Fifth Third Bancorp
- First Federal Savings and Loan Association: Chagrin Falls Branch at 2 East Washington Street, branch established on 2010/05/24. Info updated 2011/07/21: Bank assets: $1,362.1 mil, Deposits: $1,167.2 mil, headquarters in Lakewood, OH, positive income, Mortgage Lending Specialization, 18 total offices
- JPMorgan Chase Bank, National Association: Tanglewood Branch at 8501 Tanglewood Square, branch established on 1970/12/28. Info updated 2011/11/10: Bank assets: $1,811,678.0 mil, Deposits: $1,190,738.0 mil, headquarters in Columbus, OH, positive income, International Specialization, 5577 total offices, Holding Company: Jpmorgan Chase & Co.
- Park View Federal Savings Bank: Bainbrridge Branch at 8500 Washington Street, branch established on 1995/02/06. Info updated 2011/07/21: Bank assets: $803.3 mil, Deposits: $696.8 mil, headquarters in Solon, OH, negative income in the last year, Commercial Lending Specialization, 17 total offices
For population 15 years and over in Chagrin Falls:
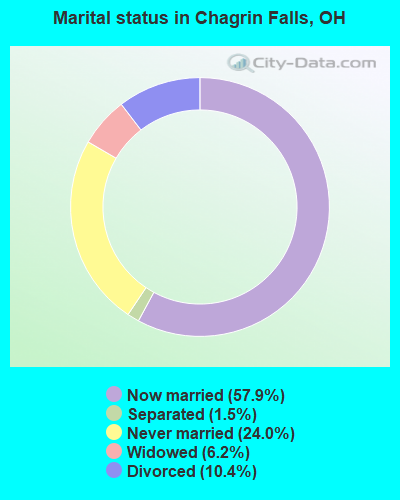
- Never married: 24.0%
- Now married: 57.9%
- Separated: 1.5%
- Widowed: 6.2%
- Divorced: 10.4%
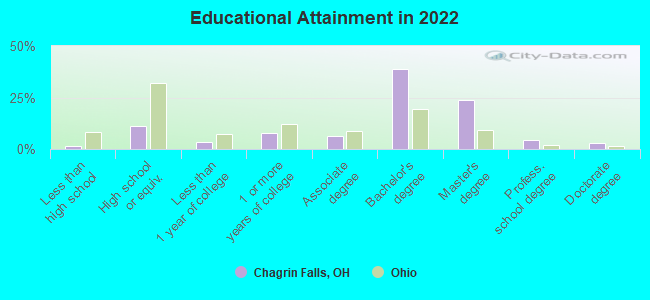
For population 25 years and over in Chagrin Falls:
- High school or higher: 98.5%
- Bachelor's degree or higher: 67.8%
- Graduate or professional degree: 29.6%
- Unemployed: 2.7%
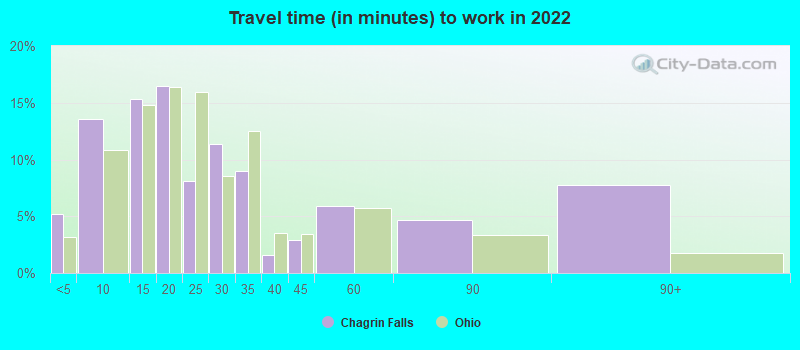
- Mean travel time to work (commute): 15.2 minutes
| Here: | 8.3 |
| Ohio average: | 11.0 |
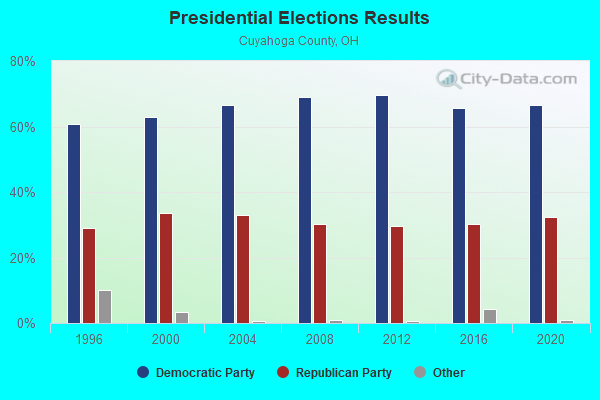
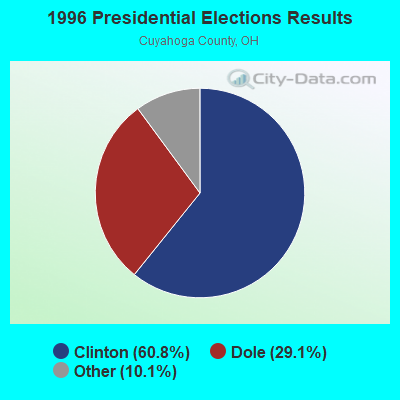
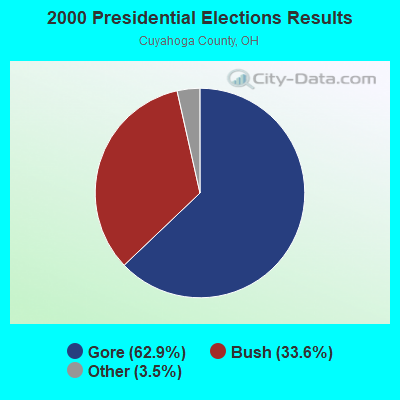
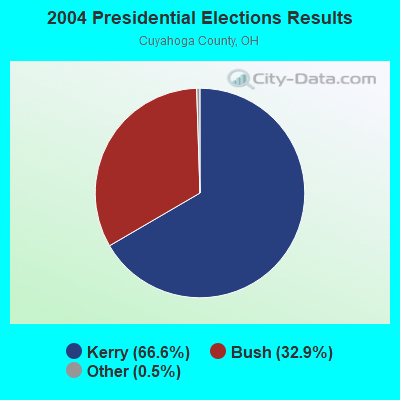
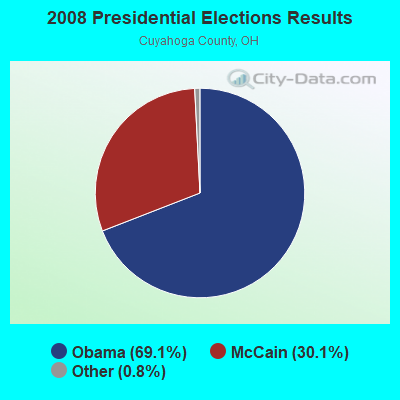
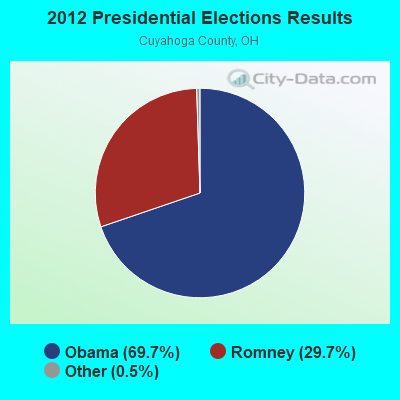
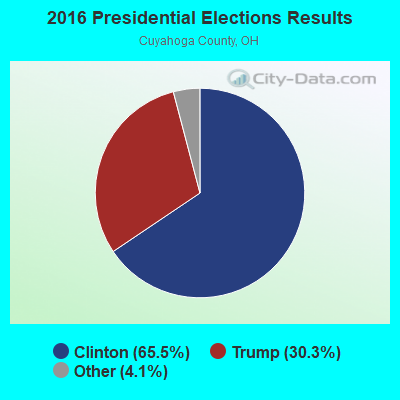
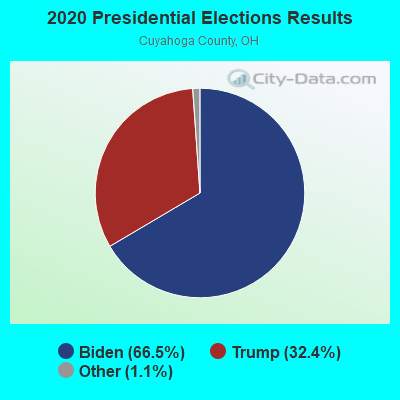
Graphs represent county-level data. Detailed 2008 Election Results
Religion statistics for Chagrin Falls, OH (based on Cuyahoga County data)
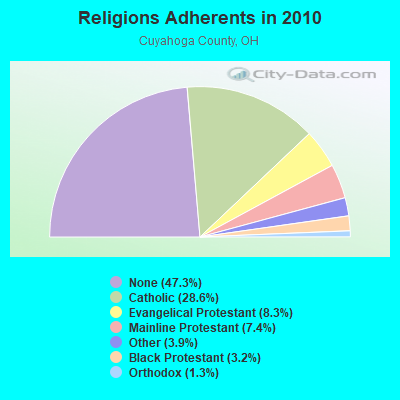
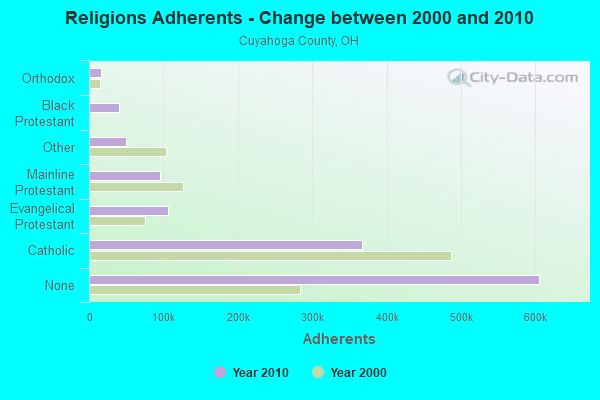
| Religion | Adherents | Congregations |
|---|---|---|
| Catholic | 366,464 | 110 |
| Evangelical Protestant | 106,477 | 326 |
| Mainline Protestant | 94,977 | 233 |
| Other | 49,641 | 126 |
| Black Protestant | 40,776 | 129 |
| Orthodox | 16,456 | 31 |
| None | 605,331 | - |
Food Environment Statistics:
| Cuyahoga County: | 2.33 / 10,000 pop. |
| Ohio: | 1.89 / 10,000 pop. |
| Cuyahoga County: | 0.05 / 10,000 pop. |
| State: | 0.13 / 10,000 pop. |
| Cuyahoga County: | 1.68 / 10,000 pop. |
| State: | 1.25 / 10,000 pop. |
| Cuyahoga County: | 2.26 / 10,000 pop. |
| Ohio: | 2.93 / 10,000 pop. |
| This county: | 6.88 / 10,000 pop. |
| Ohio: | 6.25 / 10,000 pop. |
| Here: | 10.8% |
| State: | 10.3% |
| Cuyahoga County: | 28.3% |
| Ohio: | 29.1% |
| Cuyahoga County: | 10.4% |
| Ohio: | 11.9% |
Health and Nutrition:
| This city: | 63.9% |
| Ohio: | 50.4% |
| This city: | 66.4% |
| Ohio: | 47.8% |
| Here: | 27.1 |
| Ohio: | 28.7 |
| This city: | 15.4% |
| Ohio: | 20.6% |
| This city: | 5.5% |
| Ohio: | 10.4% |
| Chagrin Falls: | 7.2 |
| Ohio: | 6.8 |
| Chagrin Falls: | 33.6% |
| Ohio: | 34.3% |
| Here: | 68.8% |
| Ohio: | 57.0% |
| Chagrin Falls: | 82.6% |
| Ohio: | 79.1% |
More about Health and Nutrition of Chagrin Falls, OH Residents
| Local government employment and payroll (March 2022) | |||||
| Function | Full-time employees | Monthly full-time payroll | Average yearly full-time wage | Part-time employees | Monthly part-time payroll |
|---|---|---|---|---|---|
| Local Libraries | 38 | $133,285 | $42,090 | 24 | $23,556 |
| Judicial and Legal | 15 | $56,184 | $44,947 | 9 | $10,663 |
| Sewerage | 10 | $64,976 | $77,971 | 0 | $0 |
| Streets and Highways | 7 | $46,996 | $80,565 | 1 | $1,557 |
| Financial Administration | 3 | $19,209 | $76,836 | 1 | $2,046 |
| Other Government Administration | 3 | $23,021 | $92,084 | 14 | $1,867 |
| Totals for Government | 76 | $343,672 | $54,264 | 49 | $39,688 |
Chagrin Falls government finances - Expenditure in 2017 (per resident):
- Current Operations - Police Protection: $2,360,000 ($573.65)
Water Utilities: $1,851,000 ($449.93)
Sewerage: $1,548,000 ($376.28)
Regular Highways: $1,006,000 ($244.53)
Financial Administration: $528,000 ($128.34)
Local Fire Protection: $518,000 ($125.91)
Health - Other: $484,000 ($117.65)
Solid Waste Management: $423,000 ($102.82)
General Public Buildings: $352,000 ($85.56)
Judicial and Legal Services: $261,000 ($63.44)
Central Staff Services: $248,000 ($60.28)
General - Other: $228,000 ($55.42)
Parks and Recreation: $81,000 ($19.69)
- General - Interest on Debt: $109,000 ($26.49)
- Intergovernmental to State - General - Other: $37,000 ($8.99)
- Other Capital Outlay - General - Other: $408,000 ($99.17)
Regular Highways: $7,000 ($1.70)
- Total Salaries and Wages: $4,469,000 ($1086.29)
- Water Utilities - Interest on Debt: $3,000 ($0.73)
Chagrin Falls government finances - Revenue in 2017 (per resident):
- Charges - Sewerage: $1,238,000 ($300.92)
Other: $842,000 ($204.67)
- Miscellaneous - General Revenue - Other: $141,000 ($34.27)
Special Assessments: $32,000 ($7.78)
Interest Earnings: $5,000 ($1.22)
- Revenue - Water Utilities: $1,467,000 ($356.59)
- State Intergovernmental - General Local Government Support: $304,000 ($73.89)
Highways: $113,000 ($27.47)
Other: $56,000 ($13.61)
Water Utilities: $35,000 ($8.51)
- Tax - Individual Income: $3,882,000 ($943.61)
Property: $2,343,000 ($569.52)
Other License: $129,000 ($31.36)
Chagrin Falls government finances - Debt in 2017 (per resident):
- Long Term Debt - Beginning Outstanding - Unspecified Public Purpose: $1,615,000 ($392.56)
Outstanding Unspecified Public Purpose: $1,130,000 ($274.67)
Retired Unspecified Public Purpose: $485,000 ($117.89)
Chagrin Falls government finances - Cash and Securities in 2017 (per resident):
- Other Funds - Cash and Securities: $6,338,000 ($1540.59)
4.02% of this county's 2021 resident taxpayers lived in other counties in 2020 ($66,006 average adjusted gross income)
| Here: | 4.02% |
| Ohio average: | 5.68% |
0.02% of residents moved from foreign countries ($135 average AGI)
Cuyahoga County: 0.02% Ohio average: 0.01%
Top counties from which taxpayers relocated into this county between 2020 and 2021:
| from Lorain County, OH | |
| from Summit County, OH | |
| from Lake County, OH |
5.02% of this county's 2020 resident taxpayers moved to other counties in 2021 ($88,842 average adjusted gross income)
| Here: | 5.02% |
| Ohio average: | 5.79% |
0.01% of residents moved to foreign countries ($120 average AGI)
Cuyahoga County: 0.01% Ohio average: 0.01%
Top counties to which taxpayers relocated from this county between 2020 and 2021:
| to Lorain County, OH | |
| to Summit County, OH | |
| to Lake County, OH |
| Businesses in Chagrin Falls, OH | ||||
| Name | Count | Name | Count | |
|---|---|---|---|---|
| CVS | 2 | Sears | 1 | |
| Chico's | 1 | Subway | 2 | |
| FedEx | 8 | U-Haul | 1 | |
| Kmart | 1 | UPS | 9 | |
| MasterBrand Cabinets | 2 | Vans | 1 | |
| Quiznos | 1 | |||
Strongest AM radio stations in Chagrin Falls:
- WTAM (1100 AM; 50 kW; CLEVELAND, OH; Owner: JACOR BROADCASTING CORPORATION)
- WKNR (850 AM; 50 kW; CLEVELAND, OH; Owner: CARON BROADCASTING, INC.)
- WHK (1220 AM; 50 kW; CLEVELAND, OH; Owner: CARON BROADCASTING, INC.)
- WWMK (1260 AM; 10 kW; CLEVELAND, OH; Owner: ABC, INC.)
- WRMR (1420 AM; 5 kW; CLEVELAND, OH; Owner: CLEVELAND CLASSICAL RADIO, LLC)
- WCUE (1150 AM; 5 kW; CUYAHOGA FALLS, OH; Owner: FAMILY STATIONS, INC.)
- WERE (1300 AM; 5 kW; CLEVELAND, OH)
- WTOU (1350 AM; 5 kW; AKRON, OH)
- WHLO (640 AM; 5 kW; AKRON, OH; Owner: CLEAR CHANNEL BROADCASTING LICENSES, INC.)
- WHBC (1480 AM; 15 kW; CANTON, OH; Owner: NM LICENSING, LLC)
- WJR (760 AM; 50 kW; DETROIT, MI; Owner: ABC, INC.)
- KDKA (1020 AM; 50 kW; PITTSBURGH, PA; Owner: INFINITY BROADCASTING OPERATIONS, INC.)
- WWVA (1170 AM; 53 kW; WHEELING, WV; Owner: CAPSTAR TX LIMITED PARTNERSHIP)
Strongest FM radio stations in Chagrin Falls:
- WENZ (107.9 FM; CLEVELAND, OH; Owner: RADIO ONE LICENSES, LLC)
- WFHM-FM (95.5 FM; CLEVELAND, OH; Owner: SCA LICENSE CORPORATION)
- WXTM (92.3 FM; CLEVELAND HEIGHTS, OH; Owner: INFINITY RADIO OPERATIONS INC.)
- WKHR (91.5 FM; BAINBRIDGE, OH; Owner: KENSTON LOCAL SCHOOL DISTRICT)
- WMJI (105.7 FM; CLEVELAND, OH; Owner: CITICASTERS LICENSES, L.P.)
- WDOK (102.1 FM; CLEVELAND, OH; Owner: INFINITY RADIO OPERATIONS INC.)
- WQAL (104.1 FM; CLEVELAND, OH; Owner: INFINITY RADIO OPERATIONS INC.)
- WMVX (106.5 FM; CLEVELAND, OH; Owner: JACOR BROADCASTING CORPORATION)
- WJCU (88.7 FM; UNIVERSITY HEIGHTS, OH; Owner: JOHN CARROLL UNIVERSITY)
- WNCX (98.5 FM; CLEVELAND, OH; Owner: INFINITY RADIO OF CLEVELAND INC.)
- WMMS (100.7 FM; CLEVELAND, OH; Owner: CITICASTERS LICENSES, L.P.)
- WZAK (93.1 FM; CLEVELAND, OH; Owner: RADIO ONE LICENSES, LLC)
- WCRF-FM (103.3 FM; CLEVELAND, OH; Owner: THE MOODY BIBLE INSTITUTE OF CHICAGO)
- WAKS (96.5 FM; AKRON, OH; Owner: CAPSTAR TX LIMITED PARTNERSHIP)
- WCPN (90.3 FM; CLEVELAND, OH; Owner: IDEASTREAM)
- WKSU-FM (89.7 FM; KENT, OH; Owner: KENT STATE UNIVERSITY)
- WSTB (88.9 FM; STREETSBORO, OH; Owner: STREETSBORO CITY SCHOOL DISTRICT)
- WGAR-FM (99.5 FM; CLEVELAND, OH; Owner: CITICASTERS LICENSES, L.P.)
- WONE-FM (97.5 FM; AKRON, OH; Owner: RUBBER CITY RADIO GROUP, INC.)
- WRUW-FM (91.1 FM; CLEVELAND, OH; Owner: CASE WESTERN RESERVE UNIVERSITY)
TV broadcast stations around Chagrin Falls:
- WXOX-LP (Channel 65; CLEVELAND, OH; Owner: VENTURE TECHNOLOGIES GROUP, LLC)
- W53AX (Channel 53; CLEVELAND, OH; Owner: WORD OF GOD FELLOWSHIP, INC.)
- W51BI (Channel 51; KIRTLAND, OH; Owner: TRINITY BROADCASTING NETWORK)
- WKYC-TV (Channel 3; CLEVELAND, OH; Owner: WKYC-TV, INC.)
- WOIO (Channel 19; SHAKER HEIGHTS, OH; Owner: RAYCOM NATIONAL, INC.)
- WBNX-TV (Channel 55; AKRON, OH; Owner: WINSTON BROADCASTING NETWORK, INC.)
- W35AX (Channel 35; CLEVELAND, OH; Owner: MEDIA-COM TELEVISION, INC.)
- WQHS-TV (Channel 61; CLEVELAND, OH; Owner: UNIVISION CLEVELAND LLC)
- WEWS-TV (Channel 5; CLEVELAND, OH; Owner: SCRIPPS HOWARD BROADCASTING COMPANY)
- WUAB (Channel 43; LORAIN, OH; Owner: RAYCOM NATIONAL, INC.)
- WRAP-CA (Channel 32; CLEVELAND, OH; Owner: COMMERCIAL BROADCASTING CORP.)
- WJW (Channel 8; CLEVELAND, OH; Owner: WJW LICENSE, INC.)
- WVIZ (Channel 25; CLEVELAND, OH; Owner: IDEASTREAM)
- WVPX (Channel 23; AKRON, OH; Owner: PAXSON AKRON LICENSE, INC.)
- WEAO (Channel 49; AKRON, OH; Owner: NORTHEASTERN EDUCATIONAL TELEVISION OF OHIO, INC.)
- WAKN-LP (Channel 11; AKRON, OH; Owner: AKRON TELEVISION, INC.)
- WKBN-TV (Channel 27; YOUNGSTOWN, OH; Owner: PIEDMONT TELEVISION OF YOUNGSTOWN LICENSE LLC)
- WOAC (Channel 67; CANTON, OH; Owner: WRAY, INC.)
- WDLI (Channel 17; CANTON, OH; Owner: TRINITY BROADCASTING NETWORK, INC.)
- WAOH-LP (Channel 29; AKRON, OH; Owner: MEDIA-COM TELEVISION, INC.)
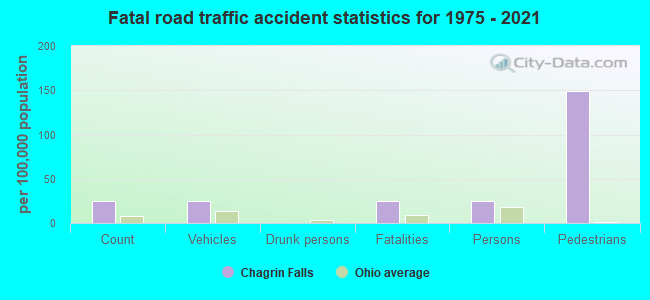
Chagrin Falls fatal accident list:
- National Bridge Inventory (NBI) Statistics
- 3Number of bridges
- 39ft / 11.7mTotal length
- 11,976Total average daily traffic
- 791Total average daily truck traffic
- 16,623Total future (year 2012) average daily traffic
FCC Registered Antenna Towers: 31 (See the full list of FCC Registered Antenna Towers)
FCC Registered Broadcast Land Mobile Towers: 9 (See the full list of FCC Registered Broadcast Land Mobile Towers in Chagrin Falls, OH)
FCC Registered Microwave Towers: 8 (See the full list of FCC Registered Microwave Towers in this town)
FCC Registered Paging Towers: 1 (See the full list of FCC Registered Paging Towers)
FCC Registered Amateur Radio Licenses: 173 (See the full list of FCC Registered Amateur Radio Licenses in Chagrin Falls)
FAA Registered Aircraft: 32 (See the full list of FAA Registered Aircraft in Chagrin Falls)
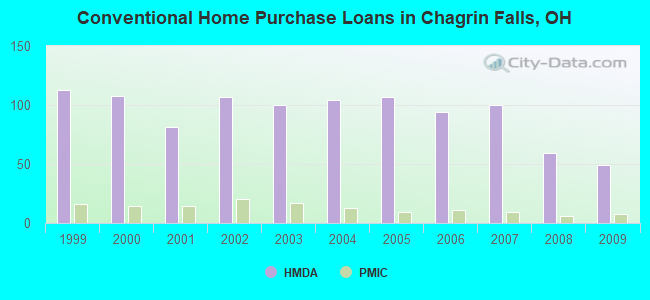
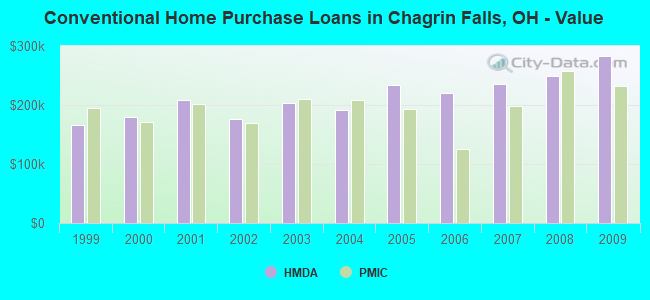
| Home Mortgage Disclosure Act Aggregated Statistics For Year 2009 (Based on 1 full tract) | ||||||||||
| A) FHA, FSA/RHS & VA Home Purchase Loans | B) Conventional Home Purchase Loans | C) Refinancings | D) Home Improvement Loans | F) Non-occupant Loans on < 5 Family Dwellings (A B C & D) | ||||||
|---|---|---|---|---|---|---|---|---|---|---|
| Number | Average Value | Number | Average Value | Number | Average Value | Number | Average Value | Number | Average Value | |
| LOANS ORIGINATED | 11 | $217,364 | 49 | $283,653 | 160 | $230,156 | 6 | $219,500 | 4 | $115,750 |
| APPLICATIONS APPROVED, NOT ACCEPTED | 0 | $0 | 4 | $399,500 | 15 | $337,200 | 1 | $10,000 | 2 | $99,500 |
| APPLICATIONS DENIED | 0 | $0 | 4 | $415,750 | 26 | $281,615 | 3 | $25,667 | 1 | $280,000 |
| APPLICATIONS WITHDRAWN | 2 | $141,500 | 4 | $247,000 | 20 | $213,050 | 0 | $0 | 1 | $242,000 |
| FILES CLOSED FOR INCOMPLETENESS | 1 | $60,000 | 1 | $69,000 | 5 | $257,400 | 1 | $25,000 | 1 | $69,000 |
Detailed HMDA statistics for the following Tracts: 1955.00
| Private Mortgage Insurance Companies Aggregated Statistics For Year 2009 (Based on 1 full tract) | ||||
| A) Conventional Home Purchase Loans | B) Refinancings | |||
|---|---|---|---|---|
| Number | Average Value | Number | Average Value | |
| LOANS ORIGINATED | 8 | $233,000 | 4 | $212,500 |
| APPLICATIONS APPROVED, NOT ACCEPTED | 2 | $298,000 | 4 | $213,750 |
| APPLICATIONS DENIED | 1 | $156,000 | 2 | $191,000 |
| APPLICATIONS WITHDRAWN | 1 | $138,000 | 0 | $0 |
| FILES CLOSED FOR INCOMPLETENESS | 0 | $0 | 0 | $0 |
Detailed PMIC statistics for the following Tracts: 1955.00
2002 - 2018 National Fire Incident Reporting System (NFIRS) incidents
- Fire incident types reported to NFIRS in Chagrin Falls, OH
- 32970.9%Structure Fires
- 10021.6%Outside Fires
- 326.9%Mobile Property/Vehicle Fires
- 30.6%Other
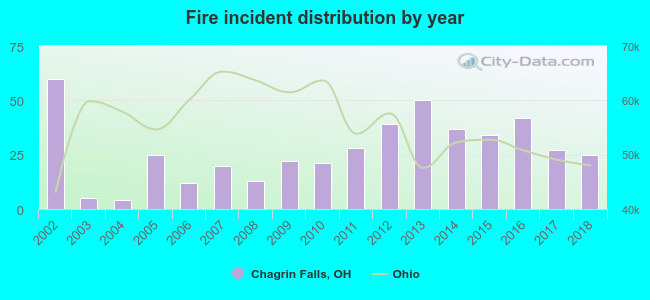 Based on the data from the years 2002 - 2018 the average number of fire incidents per year is 27. The highest number of fires - 60 took place in 2002, and the least - 4 in 2004. The data has a dropping trend.
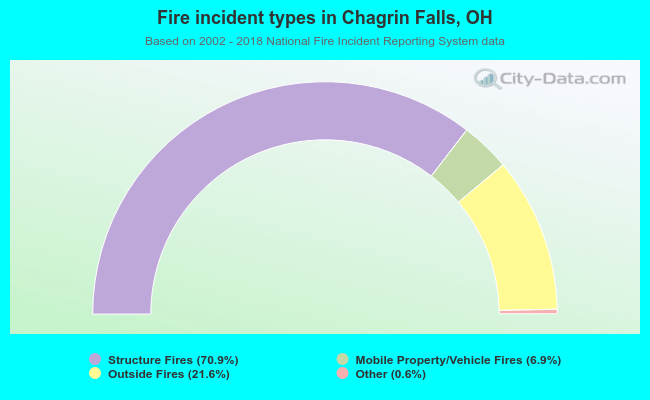 When looking into fire subcategories, the most incidents belonged to: Structure Fires (70.9%), and Outside Fires (21.6%).
| Most common first names in Chagrin Falls, OH among deceased individuals | ||
| Name | Count | Lived (average) |
|---|---|---|
| John | 207 | 74.1 years |
| Mary | 195 | 80.7 years |
| Robert | 165 | 74.1 years |
| William | 160 | 76.0 years |
| Helen | 132 | 83.7 years |
| George | 107 | 77.9 years |
| James | 103 | 76.9 years |
| Ruth | 99 | 84.1 years |
| Joseph | 99 | 76.3 years |
| Margaret | 98 | 80.4 years |
| Most common last names in Chagrin Falls, OH among deceased individuals | ||
| Last name | Count | Lived (average) |
|---|---|---|
| Smith | 53 | 80.4 years |
| Brown | 34 | 80.1 years |
| Miller | 31 | 79.2 years |
| Davis | 30 | 78.0 years |
| Johnson | 26 | 78.3 years |
| Thomas | 25 | 77.4 years |
| Wilson | 24 | 78.1 years |
| Williams | 22 | 77.4 years |
| Jones | 22 | 76.2 years |
| Taylor | 20 | 78.5 years |

- 89.0%Utility gas
- 8.2%Electricity
- 1.4%Bottled, tank, or LP gas
- 0.9%Other fuel
- 0.6%Fuel oil, kerosene, etc.
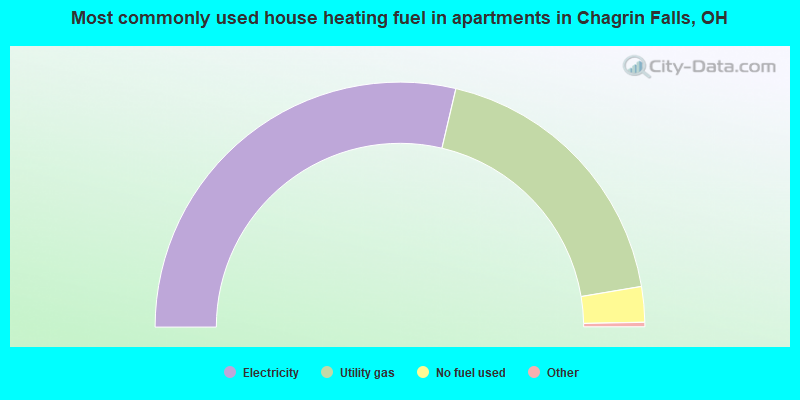
- 57.7%Electricity
- 37.6%Utility gas
- 4.7%No fuel used
Chagrin Falls compared to Ohio state average:
- Median household income above state average.
- Median house value above state average.
- Unemployed percentage significantly below state average.
- Black race population percentage significantly below state average.
- Hispanic race population percentage significantly below state average.
- Median age above state average.
- Foreign-born population percentage above state average.
- Length of stay since moving in significantly below state average.
- House age above state average.
- Percentage of population with a bachelor's degree or higher significantly above state average.
Chagrin Falls on our top lists:
- #86 on the list of "Top 101 cities with the most residents born in Syria (population 500+)"
- #97 (44022) on the list of "Top 101 zip codes with the largest percentage of Hungarian first ancestries (pop 5,000+)"
- #5 on the list of "Top 101 counties with the most Orthodox congregations"
- #9 on the list of "Top 101 counties with the most Catholic congregations"
- #9 on the list of "Top 101 counties with the most Orthodox adherents"
- #10 on the list of "Top 101 counties with the most Black Protestant congregations"
- #11 on the list of "Top 101 counties with the most Mainline Protestant congregations (pop. 50,000+)"

|
|
Total of 923 patent applications in 2008-2024.