Percentage of residents living in poverty in 2022: 11.8%
(4.4% for White Non-Hispanic residents, 100.0% for Black residents, 45.1% for Hispanic or Latino residents, 11.4% for American Indian residents, 100.0% for Native Hawaiian and other Pacific Islander residents, 9.0% for other race residents, 5.3% for two or more races residents)
120.10%Native Hawaiian and Other Pacific Islander alone
30.02%Black alone
According to our research of California and other state lists, there were 12 registered sex offenders living in Diamond Springs, California as of April 27, 2024. The ratio of all residents to sex offenders in Diamond Springs is 1,015 to 1. The ratio of registered sex offenders to all residents in this city is lower than the state average.
Recent articles from our blog. Our writers, many of them Ph.D. graduates or candidates, create easy-to-read articles on a wide variety of topics.
Latest news from Diamond Springs, CA collected exclusively by city-data.com from local newspapers, TV, and radio stations
Ancestries: English (11.6%), German (7.3%), American (6.6%), Irish (6.5%), British (5.6%), Italian (4.2%).
Current Local Time: PST time zone
Elevation: 1778 feet
Land area: 5.94 square miles.
Population density: 1,858 people per square mile (low).
795 residents are foreign born (1.9% Europe, 1.6% Asia, 1.3% Latin America, 0.8% North America, 0.7% Oceania).
This place:
6.5%
California:
26.5%
Median real estate property taxes paid for housing units with mortgages in 2022: $2,813 (0.6%) Median real estate property taxes paid for housing units with no mortgage in 2022: $1,306 (0.4%)
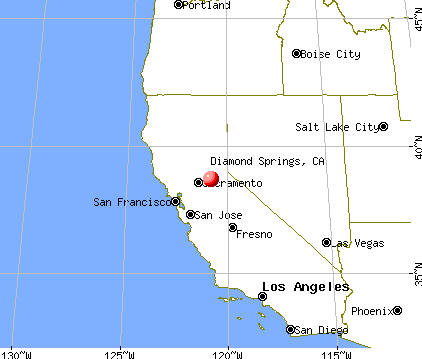
Nearest city with pop. 50,000+: South El Dorado, CA (5.2 miles , pop. 78,296).
Nearest city with pop. 200,000+: Sacramento, CA (36.0 miles , pop. 407,018).
Nearest city with pop. 1,000,000+: Los Angeles, CA (346.0 miles , pop. 3,694,820).
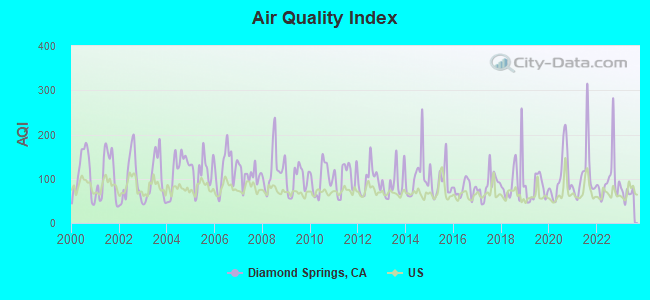
Air Quality Index (AQI) level in 2023 was 67.8. This is about average.
City:
67.8
U.S.:
72.6
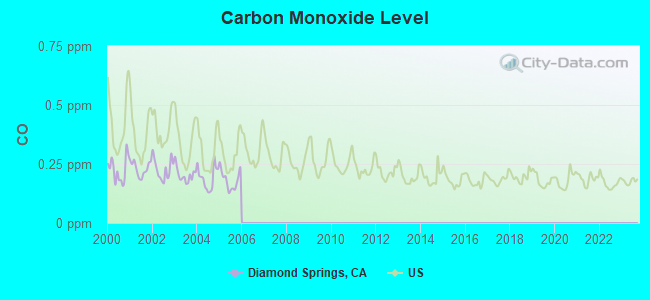
Carbon Monoxide (CO) [ppm] level in 2005 was 0.182. This is better than average.Closest monitor was 2.8 miles away from the city center.
City:
0.182
U.S.:
0.251
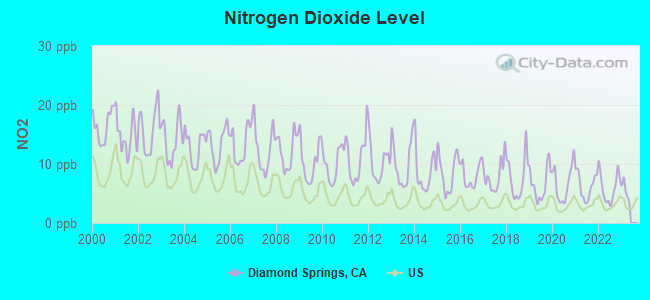
Nitrogen Dioxide (NO2) [ppb] level in 2022 was 5.99. This is about average.Closest monitor was 19.6 miles away from the city center.
City:
5.99
U.S.:
5.11
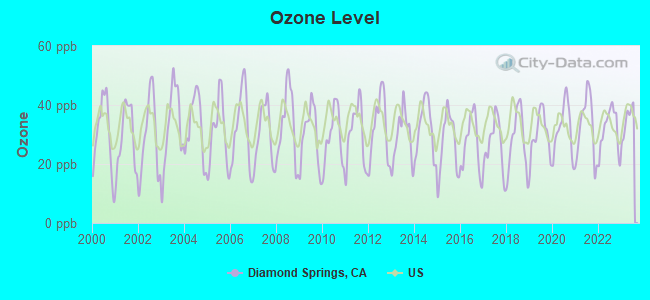
Ozone [ppb] level in 2023 was 34.9. This is about average.Closest monitor was 3.3 miles away from the city center.
City:
34.9
U.S.:
33.3
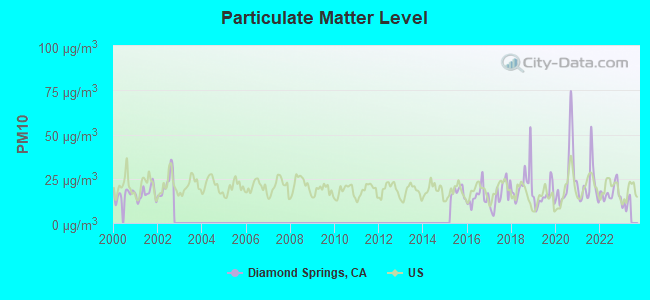
Particulate Matter (PM10) [µg/m3] level in 2022 was 17.3. This is about average.Closest monitor was 2.8 miles away from the city center.
City:
17.3
U.S.:
19.2
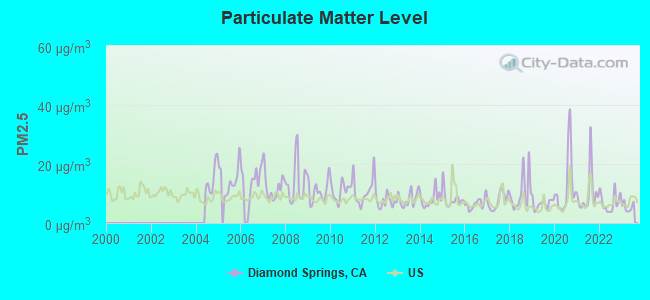
Particulate Matter (PM2.5) [µg/m3] level in 2023 was 5.42. This is significantly better than average.Closest monitor was 18.4 miles away from the city center.
City:
5.42
U.S.:
8.11
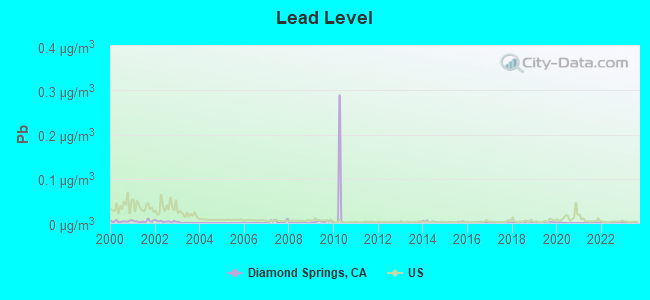
Lead (Pb) [µg/m3] level in 2023 was 0.00140. This is significantly better than average.Closest monitor was 23.1 miles away from the city center.
City:
0.00140
U.S.:
0.00931
Earthquake activity:
Diamond Springs-area historical earthquake activity is significantly above California state average. It is 7663% greater than the overall U.S. average.
On 4/18/1906 at 13:12:21, a magnitude 7.9 (7.9 UK, Class: Major, Intensity: VIII - XII) earthquake occurred 127.2 miles away from Diamond Springs center, causing $524,000,000 total damage On 10/3/1915 at 06:52:48, a magnitude 7.6 (7.6 UK) earthquake occurred 217.1 miles away from the city center On 10/18/1989 at 00:04:15, a magnitude 7.1 (6.5 MB, 7.1 MS, 6.9 MW, 7.0 ML) earthquake occurred 120.6 miles away from Diamond Springs center, causing 62 deaths (62 shaking deaths) and 3757 injuries, causing $1,305,032,704 total damage On 12/21/1932 at 06:10:09, a magnitude 7.2 (7.2 UK) earthquake occurred 148.6 miles away from Diamond Springs center On 7/21/1952 at 11:52:14, a magnitude 7.7 (7.7 UK) earthquake occurred 274.1 miles away from Diamond Springs center, causing $50,000,000 total damage On 11/4/1927 at 13:51:53, a magnitude 7.5 (7.5 UK) earthquake occurred 261.0 miles away from the city center Magnitude types: body-wave magnitude (MB), local magnitude (ML), surface-wave magnitude (MS), moment magnitude (MW)
Natural disasters:
The number of natural disasters in El Dorado County (17) is near the US average (15). Major Disasters (Presidential) Declared: 8 Emergencies Declared: 2
Causes of natural disasters: Floods: 12, Mudslides: 6, Winter Storms: 6, Landslides: 5, Storms: 5, Fires: 2, Drought: 1, Heavy Rain: 1, Hurricane: 1, Other: 1 (Note: some incidents may be assigned to more than one category).
Hospitals and medical centers in Diamond Springs:
SNOWLINE HOSPICE OF EL DORADO, INC (6520 PLEASANT VALLEY ROAD)
Other hospitals and medical centers near Diamond Springs:
GOLD COUNTRY HEALTH CENTER (Nursing Home, about 2 miles away; PLACERVILLE, CA)
WESTERN SLOPE HEALTH CENTER (Nursing Home, about 4 miles away; PLACERVILLE, CA)
THE PINES AT PLACERVILLE HEALTHCARE CENTER (Nursing Home, about 4 miles away; PLACERVILLE, CA)
MARSHALL MEDICAL CENTER (1-RH) Acute Care Hospitals (about 4 miles away; PLACERVILLE, CA)
MARSHALL HOME CARE (Home Health Center, about 4 miles away; PLACERVILLE, CA)
CAMERON PARK DIALYSIS (Dialysis Facility, about 9 miles away; CAMERON PARK, CA)
ACTION HOME NRSG SRVS (Home Health Center, about 15 miles away; EL DORADO HILLS, CA)
4 miles: PLACERVILLE (222 MAIN ST.) - Bus Station . Services: fully wheelchair accessible, public payphones, full-service food facilities, free short-term parking, call for taxi service.
8 miles: CAMERON PARK (US HWY. 50 & CAMERON PARK DR.) - Bus Station . Services: fully wheelchair accessible, enclosed waiting area, public restrooms, public payphones, full-service food facilities, free short-term parking.
Colleges/universities with over 2000 students nearest to Diamond Springs:
Folsom Lake College (about 17 miles; Folsom, CA; Full-time enrollment: 5,308)
Sierra College (about 23 miles; Rocklin, CA; FT enrollment: 11,488)
American River College (about 29 miles; Sacramento, CA; FT enrollment: 20,452)
California State University-Sacramento (about 34 miles; Sacramento, CA; FT enrollment: 22,234)
Cosumnes River College (about 37 miles; Sacramento, CA; FT enrollment: 9,327)
Sacramento City College (about 38 miles; Sacramento, CA; FT enrollment: 15,963)
University of Phoenix-Sacramento Valley Campus (about 39 miles; Sacramento, CA; FT enrollment: 2,855)
Public high schools in Diamond Springs:
INDEPENDENCE CONTINUATION (Location: 385 PLEASANT VALLEY RD., Grades: 9-12)
EDUSHD COMMUNITY DAY (Location: 385 PLEASANT VALLEY RD., Grades: 9-12)
User-submitted facts and corrections:
In the "Colleges/universities with over 2000 students nearest to Diamond Springs:" section, please include Folsom Lake College's El Dorado Center (Placerville) and Folsom Lake College's main campus (Folsom). Note that the El Dorado Center enrolls nearly 3000 students and FLC's main campus enrolls nearly 6000 students. FLC is the state's 109th community college. These requested additions apply to all City-data city/town pages in the general sacramento region. Thanks. - Chris Olson, FLC Research Analyst, 608-6525
El Dorado County has a predicted average indoor radon screening level between 2 and 4 pCi/L (pico curies per liter) - Moderate Potential
Average household size:
This place:
2.4 people
California:
2.9 people
Percentage of family households:
This place:
64.1%
Whole state:
68.7%
Percentage of households with unmarried partners:
This place:
5.7%
Whole state:
7.2%
Likely homosexual households (counted as self-reported same-sex unmarried-partner households)
Lesbian couples: 0.4% of all households
Gay men: 0.2% of all households
People in group quarters in Diamond Springs in 2010:
99 people in nursing facilities/skilled-nursing facilities
11 people in residential treatment centers for juveniles (non-correctional)
8 people in emergency and transitional shelters (with sleeping facilities) for people experiencing homelessness
8 people in other noninstitutional facilities
7 people in group homes intended for adults
People in group quarters in Diamond Springs in 2000:
11 people in other noninstitutional group quarters
7 people in homes or halfway houses for drug/alcohol abuse
6 people in unknown juvenile institutions
Banks with branches in Diamond Springs (2011 data):
El Dorado Savings Bank, F.S.B.: Diamond Springs Branch at 694 Pleasant Valley Rd Ste 3, branch established on 1956/01/01. Info updated 2011/07/21: Bank assets: $1,706.7 mil, Deposits: $1,536.5 mil, headquarters in Placerville, CA, positive income, Mortgage Lending Specialization, 35 total offices
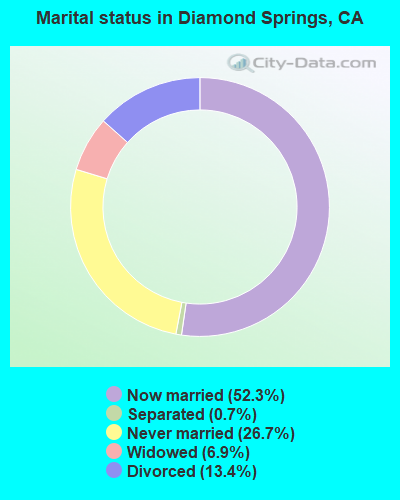
For population 15 years and over in Diamond Springs:
Never married: 26.7%
Now married: 52.3%
Separated: 0.7%
Widowed: 6.9%
Divorced: 13.4%
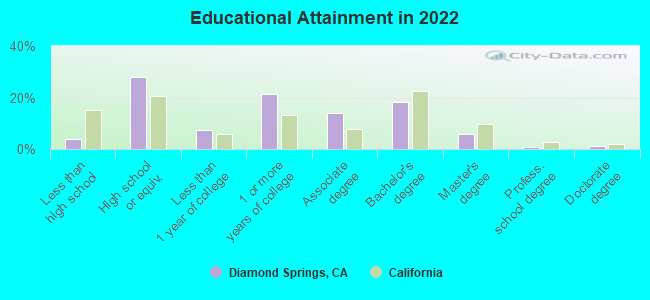
For population 25 years and over in Diamond Springs:
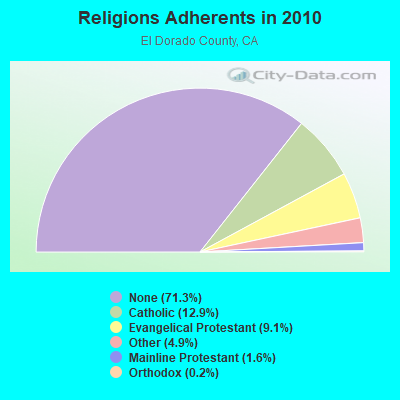
Religion statistics for Diamond Springs, CA (based on El Dorado County data)
Religion
Adherents
Congregations
Catholic
23,298
6
Evangelical Protestant
16,538
69
Other
8,928
30
Mainline Protestant
2,937
11
Orthodox
315
2
None
129,042
-
Source: Clifford Grammich, Kirk Hadaway, Richard Houseal, Dale E.Jones, Alexei Krindatch, Richie Stanley and Richard H.Taylor. 2012. 2010 U.S.Religion Census: Religious Congregations & Membership Study. Association of Statisticians of American Religious Bodies. Jones, Dale E., et al. 2002. Congregations and Membership in the United States 2000. Nashville, TN: Glenmary Research Center. Graphs represent county-level data
Aircraft: CESSNA 182J (Category: Land, Seats: 4, Weight: Up to 12,499 Pounds, Speed: 119 mph), Engine: CONT MOTOR O-470 SERIES (230 HP) (Reciprocating) N-Number: 182FT, N182FT, N-182FT, Serial Number: 18256715, Year manufactured: 1965, Airworthiness Date: 11/11/1965, Certificate Issue Date: 02/04/2008 Registrant (Corporation): Steves Christmas Trees Inc, Po Box 1774, Diamond Springs, CA 95619
Aircraft: CESSNA 172E (Category: Land, Seats: 4, Weight: Up to 12,499 Pounds, Speed: 105 mph), Engine: CONT MOTOR 0-300 SER (145 HP) (Reciprocating) N-Number: 7712U, N7712U, N-7712U, Serial Number: 17251712, Year manufactured: 1964, Airworthiness Date: 06/23/1964, Certificate Issue Date: 07/26/2017 Registrant (Co-Owned): James M Golding, 4632 Ringold Rd, Diamond Springs, CA 95619, Other Owners: James M Sidebottom
Aircraft: CESSNA 182N (Category: Land, Seats: 4, Weight: Up to 12,499 Pounds, Speed: 119 mph), Engine: CONT MOTOR O-470 SERIES (230 HP) (Reciprocating) N-Number: 8966G, N8966G, N-8966G, Serial Number: 18260506, Year manufactured: 1970, Airworthiness Date: 11/23/1970, Certificate Issue Date: 12/21/1984 Registrant (Corporation): California Construction Control Inc, Po Box 1767, Diamond Springs, CA 95619
Aircraft: AERONCA 65-C (Category: Land, Seats: 2, Weight: Up to 12,499 Pounds, Speed: 75 mph), Engine: Reciprocating N-Number: 56144, N56144, N-56144, Serial Number: C-1298, Certificate Issue Date: 10/16/2007 Registrant (Individual): John L Trustee Wetsel, Po Box 8, Diamond Springs, CA 95619 Deregistered:Cancel Date: 02/15/2018
Home Mortgage Disclosure Act Aggregated Statistics For Year 2009 (Based on 2 partial tracts)
A) FHA, FSA/RHS & VA Home Purchase Loans
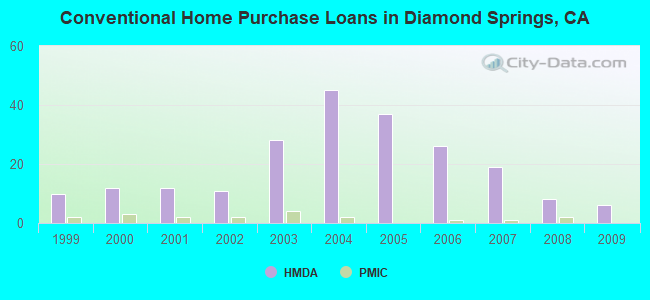
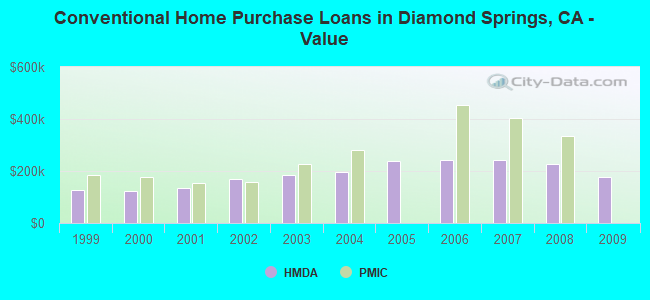
B) Conventional Home Purchase Loans
C) Refinancings
D) Home Improvement Loans
F) Non-occupant Loans on < 5 Family Dwellings (A B C & D)
G) Loans On Manufactured Home Dwelling (A B C & D)
Number
Average Value
Number
Average Value
Number
Average Value
Number
Average Value
Number
Average Value
Number
Average Value
LOANS ORIGINATED
6
$230,773
6
$176,102
36
$215,137
2
$164,710
4
$169,898
3
$138,687
APPLICATIONS APPROVED, NOT ACCEPTED
1
$187,700
1
$192,630
5
$232,722
1
$49,080
1
$104,960
1
$129,960
APPLICATIONS DENIED
1
$202,360
1
$269,220
20
$240,416
3
$110,157
2
$241,520
2
$172,120
APPLICATIONS WITHDRAWN
1
$213,460
1
$150,230
11
$232,464
0
$0
0
$0
1
$141,150
FILES CLOSED FOR INCOMPLETENESS
0
$0
0
$0
2
$208,345
0
$0
0
$0
0
$0
Aggregated Statistics For Year 2008 (Based on 2 partial tracts)
A) FHA, FSA/RHS & VA Home Purchase Loans
B) Conventional Home Purchase Loans
C) Refinancings
D) Home Improvement Loans
F) Non-occupant Loans on < 5 Family Dwellings (A B C & D)
G) Loans On Manufactured Home Dwelling (A B C & D)
Number
Average Value
Number
Average Value
Number
Average Value
Number
Average Value
Number
Average Value
Number
Average Value
LOANS ORIGINATED
3
$252,800
8
$225,785
20
$248,891
3
$131,513
3
$251,380
2
$174,370
APPLICATIONS APPROVED, NOT ACCEPTED
1
$201,350
2
$151,810
4
$320,608
1
$67,000
0
$0
1
$81,770
APPLICATIONS DENIED
1
$168,790
3
$177,547
19
$301,088
3
$222,440
2
$282,420
2
$134,280
APPLICATIONS WITHDRAWN
1
$274,530
1
$177,920
8
$360,382
1
$150,500
1
$283,320
1
$107,090
FILES CLOSED FOR INCOMPLETENESS
1
$163,250
1
$163,830
2
$364,585
0
$0
0
$0
0
$0
Aggregated Statistics For Year 2007 (Based on 2 partial tracts)
B) Conventional Home Purchase Loans
C) Refinancings
D) Home Improvement Loans
F) Non-occupant Loans on < 5 Family Dwellings (A B C & D)
G) Loans On Manufactured Home Dwelling (A B C & D)
Number
Average Value
Number
Average Value
Number
Average Value
Number
Average Value
Number
Average Value
LOANS ORIGINATED
19
$242,111
44
$252,934
10
$139,119
7
$262,497
3
$161,420
APPLICATIONS APPROVED, NOT ACCEPTED
2
$191,055
11
$260,006
2
$209,730
1
$177,390
2
$85,380
APPLICATIONS DENIED
7
$237,006
35
$267,273
7
$158,496
3
$206,983
4
$127,845
APPLICATIONS WITHDRAWN
2
$359,125
15
$230,672
2
$202,085
1
$383,310
1
$60,600
FILES CLOSED FOR INCOMPLETENESS
0
$0
7
$288,244
0
$0
0
$0
0
$0
Aggregated Statistics For Year 2006 (Based on 2 partial tracts)
B) Conventional Home Purchase Loans
C) Refinancings
D) Home Improvement Loans
F) Non-occupant Loans on < 5 Family Dwellings (A B C & D)
G) Loans On Manufactured Home Dwelling (A B C & D)
Number
Average Value
Number
Average Value
Number
Average Value
Number
Average Value
Number
Average Value
LOANS ORIGINATED
26
$243,362
62
$250,471
14
$138,581
8
$208,608
3
$141,873
APPLICATIONS APPROVED, NOT ACCEPTED
4
$239,200
14
$241,793
2
$85,120
2
$248,140
1
$172,620
APPLICATIONS DENIED
9
$299,324
30
$276,038
5
$107,954
3
$214,433
4
$148,028
APPLICATIONS WITHDRAWN
2
$346,125
23
$278,314
2
$221,265
1
$177,060
0
$0
FILES CLOSED FOR INCOMPLETENESS
2
$205,730
4
$338,445
0
$0
0
$0
0
$0
Aggregated Statistics For Year 2005 (Based on 2 partial tracts)
B) Conventional Home Purchase Loans
C) Refinancings
D) Home Improvement Loans
F) Non-occupant Loans on < 5 Family Dwellings (A B C & D)
G) Loans On Manufactured Home Dwelling (A B C & D)
Number
Average Value
Number
Average Value
Number
Average Value
Number
Average Value
Number
Average Value
LOANS ORIGINATED
37
$237,680
88
$242,554
21
$133,356
12
$235,548
4
$175,942
APPLICATIONS APPROVED, NOT ACCEPTED
6
$172,915
10
$230,507
2
$145,635
2
$184,100
2
$63,160
APPLICATIONS DENIED
10
$233,332
33
$262,273
6
$127,475
2
$236,905
4
$196,140
APPLICATIONS WITHDRAWN
4
$254,785
27
$239,916
5
$164,642
1
$303,610
1
$239,900
FILES CLOSED FOR INCOMPLETENESS
1
$306,690
8
$213,804
1
$116,220
0
$0
1
$146,870
Aggregated Statistics For Year 2004 (Based on 2 partial tracts)
A) FHA, FSA/RHS & VA Home Purchase Loans
B) Conventional Home Purchase Loans
C) Refinancings
D) Home Improvement Loans
F) Non-occupant Loans on < 5 Family Dwellings (A B C & D)
G) Loans On Manufactured Home Dwelling (A B C & D)
Number
Average Value
Number
Average Value
Number
Average Value
Number
Average Value
Number
Average Value
Number
Average Value
LOANS ORIGINATED
1
$180,240
45
$197,166
86
$204,302
15
$120,877
12
$219,441
5
$148,276
APPLICATIONS APPROVED, NOT ACCEPTED
0
$0
6
$224,295
16
$197,758
2
$127,890
1
$295,090
2
$124,285
APPLICATIONS DENIED
0
$0
10
$203,825
34
$203,767
5
$92,242
3
$203,807
3
$97,517
APPLICATIONS WITHDRAWN
0
$0
4
$212,330
26
$211,245
3
$82,950
1
$284,320
1
$141,710
FILES CLOSED FOR INCOMPLETENESS
0
$0
1
$206,870
7
$207,934
1
$63,850
0
$0
0
$0
Aggregated Statistics For Year 2003 (Based on 2 partial tracts)
A) FHA, FSA/RHS & VA Home Purchase Loans
B) Conventional Home Purchase Loans
C) Refinancings
D) Home Improvement Loans
F) Non-occupant Loans on < 5 Family Dwellings (A B C & D)
Number
Average Value
Number
Average Value
Number
Average Value
Number
Average Value
Number
Average Value
LOANS ORIGINATED
3
$196,207
28
$183,507
163
$165,902
6
$61,322
13
$189,570
APPLICATIONS APPROVED, NOT ACCEPTED
0
$0
3
$173,083
19
$176,976
1
$42,310
2
$160,205
APPLICATIONS DENIED
1
$92,580
6
$157,243
44
$179,431
4
$38,845
3
$204,977
APPLICATIONS WITHDRAWN
0
$0
5
$163,234
33
$195,438
2
$54,455
2
$211,805
FILES CLOSED FOR INCOMPLETENESS
1
$121,330
1
$124,560
6
$177,023
0
$0
1
$119,770
Aggregated Statistics For Year 2002 (Based on 1 partial tract)
A) FHA, FSA/RHS & VA Home Purchase Loans
B) Conventional Home Purchase Loans
C) Refinancings
D) Home Improvement Loans
F) Non-occupant Loans on < 5 Family Dwellings (A B C & D)
Number
Average Value
Number
Average Value
Number
Average Value
Number
Average Value
Number
Average Value
LOANS ORIGINATED
1
$77,400
11
$170,255
44
$157,173
2
$45,590
3
$150,197
APPLICATIONS APPROVED, NOT ACCEPTED
0
$0
2
$98,555
5
$153,844
1
$22,130
1
$75,170
APPLICATIONS DENIED
0
$0
1
$143,930
9
$147,351
2
$34,175
1
$107,040
APPLICATIONS WITHDRAWN
0
$0
1
$211,030
7
$168,154
1
$53,730
1
$108,580
FILES CLOSED FOR INCOMPLETENESS
0
$0
0
$0
2
$167,595
0
$0
0
$0
Aggregated Statistics For Year 2001 (Based on 1 partial tract)
A) FHA, FSA/RHS & VA Home Purchase Loans
B) Conventional Home Purchase Loans
C) Refinancings
D) Home Improvement Loans
F) Non-occupant Loans on < 5 Family Dwellings (A B C & D)
Number
Average Value
Number
Average Value
Number
Average Value
Number
Average Value
Number
Average Value
LOANS ORIGINATED
1
$228,290
12
$135,326
33
$151,213
3
$42,597
3
$157,017
APPLICATIONS APPROVED, NOT ACCEPTED
0
$0
1
$72,660
3
$132,380
0
$0
0
$0
APPLICATIONS DENIED
0
$0
1
$131,270
6
$159,802
1
$19,490
0
$0
APPLICATIONS WITHDRAWN
0
$0
1
$195,990
5
$151,450
1
$58,880
1
$120,550
FILES CLOSED FOR INCOMPLETENESS
0
$0
0
$0
1
$148,110
0
$0
0
$0
Aggregated Statistics For Year 2000 (Based on 1 partial tract)
A) FHA, FSA/RHS & VA Home Purchase Loans
B) Conventional Home Purchase Loans
C) Refinancings
D) Home Improvement Loans
F) Non-occupant Loans on < 5 Family Dwellings (A B C & D)
Number
Average Value
Number
Average Value
Number
Average Value
Number
Average Value
Number
Average Value
LOANS ORIGINATED
2
$118,040
12
$123,772
7
$80,816
3
$22,457
1
$101,760
APPLICATIONS APPROVED, NOT ACCEPTED
0
$0
2
$91,245
2
$92,220
1
$51,090
0
$0
APPLICATIONS DENIED
0
$0
3
$93,497
3
$120,827
2
$34,590
0
$0
APPLICATIONS WITHDRAWN
0
$0
1
$82,680
1
$63,890
0
$0
0
$0
FILES CLOSED FOR INCOMPLETENESS
0
$0
0
$0
1
$83,520
0
$0
0
$0
Aggregated Statistics For Year 1999 (Based on 1 partial tract)
A) FHA, FSA/RHS & VA Home Purchase Loans
B) Conventional Home Purchase Loans
C) Refinancings
D) Home Improvement Loans
F) Non-occupant Loans on < 5 Family Dwellings (A B C & D)
Detailed PMIC statistics for the following Tracts:0315.02
, 0315.04
2005 - 2018 National Fire Incident Reporting System (NFIRS) incidents
Based on the data from the years 2005 - 2018 the average number of fires per year is 10. The highest number of fire incidents - 25 took place in 2005, and the least - 1 in 2009. The data has a declining trend.
When looking into fire subcategories, the most reports belonged to: Outside Fires (47.1%), and Structure Fires (39.0%).
Fire incident types reported to NFIRS in Diamond Springs, CA
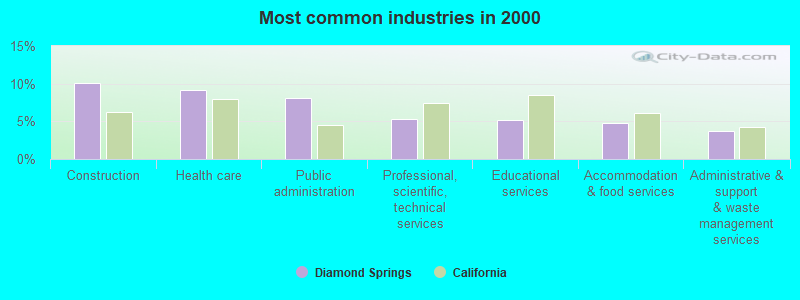
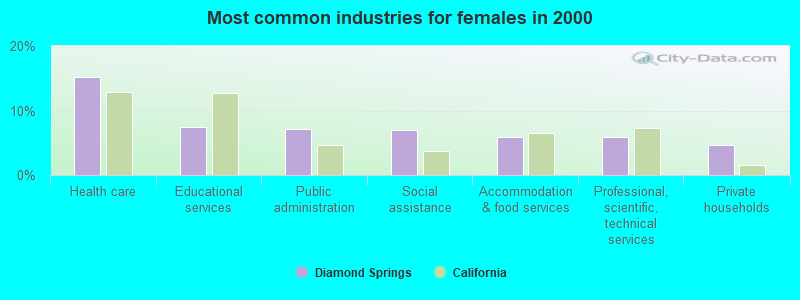
#82 on the list of "Top 101 cities with largest percentage of females in industries: administrative and support and waste management services (population 5,000+)"
#19 on the list of "Top 101 counties with the lowest number of births per 1000 residents 2007-2013"
#54 on the list of "Top 101 counties with the largest decrease in the number of births per 1000 residents 2000-2006 to 2007-2013 (pop 50,000+)"
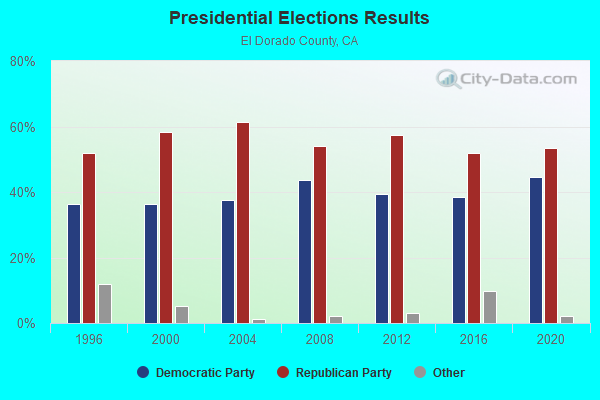
#84 on the list of "Top 101 counties with highest percentage of residents voting for 3rd party candidates in the 2012 Presidential Election (pop. 50,000+)"


 Recent articles from our blog. Our writers, many of them Ph.D. graduates or candidates, create easy-to-read articles on a wide variety of topics.

 , pop. 78,296).


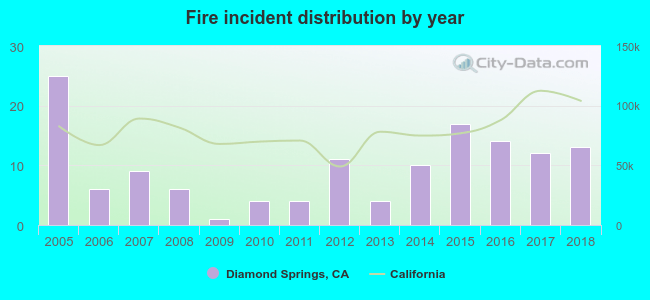 Based on the data from the years 2005 - 2018 the average number of fires per year is 10. The highest number of fire incidents - 25 took place in 2005, and the least - 1 in 2009. The data has a declining trend.
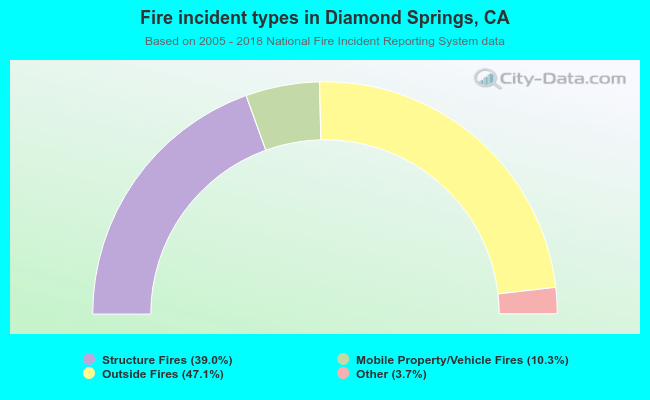 When looking into fire subcategories, the most reports belonged to: Outside Fires (47.1%), and Structure Fires (39.0%).