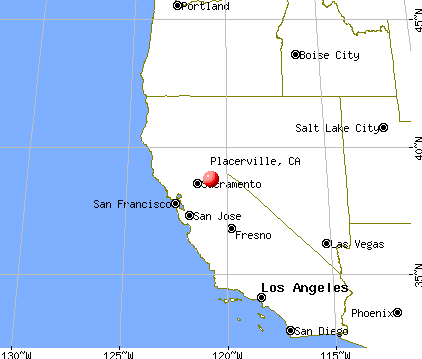
Placerville, California
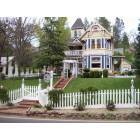
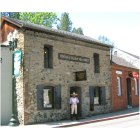
Placerville: Combellack-Blair House B & B
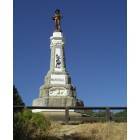
Placerville: Monument at Gold Discovery Site State Park
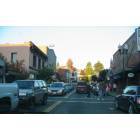
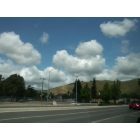
Placerville: Placerville
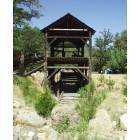
Placerville: Reproduction of Sutter's Mill at Gold Discovery Site State Park
Placerville: Museum about Placerville and gold discovery
Placerville
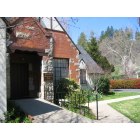
Placerville: The facility is perfect for reunions and receptions
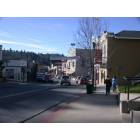
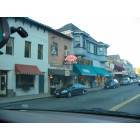
Placerville: Downtown Placerville January 2003
Placerville: Placerville
- add
your
Submit your own pictures of this city and show them to the world
- OSM Map
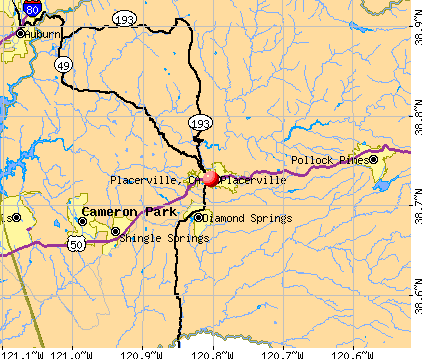
- General Map
- Google Map
- MSN Map
Population change since 2000: +11.0%
 |
| Males: 4,850 | |
| Females: 5,814 |
| Median resident age: | 43.3 years |
| California median age: | 37.9 years |
Zip codes: 95667.
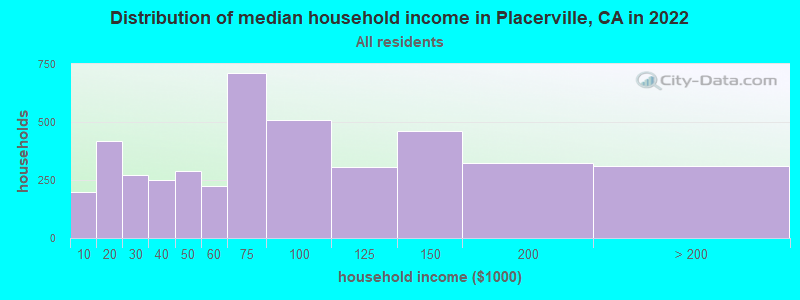
| Placerville: | $73,299 |
| CA: | $91,551 |
Estimated per capita income in 2022: $37,493 (it was $19,151 in 2000)
Placerville city income, earnings, and wages data
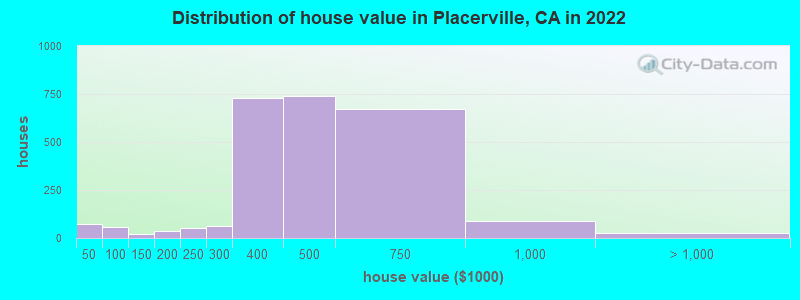
Estimated median house or condo value in 2022: $466,424 (it was $153,800 in 2000)
| Placerville: | $466,424 |
| CA: | $715,900 |
Mean prices in 2022: all housing units: $720,516; detached houses: $764,681; townhouses or other attached units: $549,812; in 2-unit structures: $512,382; in 3-to-4-unit structures: $311,556; in 5-or-more-unit structures: $365,271; mobile homes: $185,601; occupied boats, rvs, vans, etc.: over $1,000,000
Median gross rent in 2022: $1,298.
(13.8% for White Non-Hispanic residents, 80.8% for Black residents, 19.7% for Hispanic or Latino residents, 40.9% for American Indian residents, 16.4% for two or more races residents)
Detailed information about poverty and poor residents in Placerville, CA


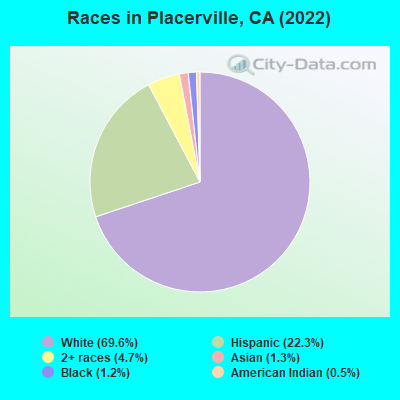
- 7,51369.6%White alone
- 2,40922.3%Hispanic
- 5084.7%Two or more races
- 1351.3%Asian alone
- 1301.2%Black alone
- 520.5%American Indian alone
According to our research of California and other state lists, there were 75 registered sex offenders living in Placerville, California as of April 27, 2024.
The ratio of all residents to sex offenders in Placerville is 143 to 1.
Type |
2009 |
2010 |
2011 |
2012 |
2013 |
2014 |
2015 |
2016 |
2017 |
2018 |
2019 |
2020 |
2021 |
2022 |
|---|---|---|---|---|---|---|---|---|---|---|---|---|---|---|
| Murders (per 100,000) | 0 (0.0) | 0 (0.0) | 1 (9.5) | 0 (0.0) | 0 (0.0) | 0 (0.0) | 0 (0.0) | 0 (0.0) | 0 (0.0) | 0 (0.0) | 0 (0.0) | 0 (0.0) | 0 (0.0) | 1 (9.1) |
| Rapes (per 100,000) | 4 (39.9) | 5 (48.1) | 4 (38.1) | 2 (19.1) | 3 (29.0) | 4 (38.1) | 3 (28.3) | 6 (56.0) | 6 (55.9) | 17 (154.3) | 2 (18.0) | 3 (26.7) | 11 (98.7) | 4 (36.5) |
| Robberies (per 100,000) | 7 (69.8) | 6 (57.8) | 10 (95.1) | 8 (76.3) | 7 (67.7) | 7 (66.8) | 2 (18.9) | 9 (84.1) | 9 (83.9) | 9 (81.7) | 6 (53.9) | 6 (53.3) | 5 (44.9) | 9 (82.2) |
| Assaults (per 100,000) | 54 (538.7) | 54 (519.8) | 53 (504.2) | 45 (429.4) | 53 (512.6) | 46 (438.7) | 16 (150.9) | 12 (112.1) | 14 (130.5) | 28 (254.1) | 31 (278.7) | 32 (284.3) | 57 (511.7) | 47 (429.2) |
| Burglaries (per 100,000) | 48 (478.8) | 77 (741.2) | 61 (580.3) | 65 (620.3) | 92 (889.8) | 58 (553.1) | 53 (500.0) | 76 (709.9) | 57 (531.1) | 47 (426.6) | 67 (602.4) | 58 (515.3) | 23 (206.5) | 31 (283.1) |
| Thefts (per 100,000) | 143 (1,426) | 156 (1,502) | 135 (1,284) | 109 (1,040) | 172 (1,664) | 187 (1,783) | 219 (2,066) | 262 (2,447) | 176 (1,640) | 189 (1,715) | 164 (1,474) | 161 (1,430) | 144 (1,293) | 161 (1,470) |
| Auto thefts (per 100,000) | 21 (209.5) | 14 (134.8) | 22 (209.3) | 20 (190.9) | 30 (290.2) | 28 (267.0) | 50 (471.7) | 32 (298.9) | 46 (428.6) | 42 (381.2) | 50 (449.5) | 41 (364.3) | 31 (278.3) | 20 (182.6) |
| Arson (per 100,000) | 4 (39.9) | 0 (0.0) | 2 (19.0) | 3 (28.6) | 0 (0.0) | 1 (9.5) | 0 (0.0) | 3 (28.0) | 1 (9.3) | 2 (18.2) | 0 (0.0) | 1 (8.9) | 5 (44.9) | 6 (54.8) |
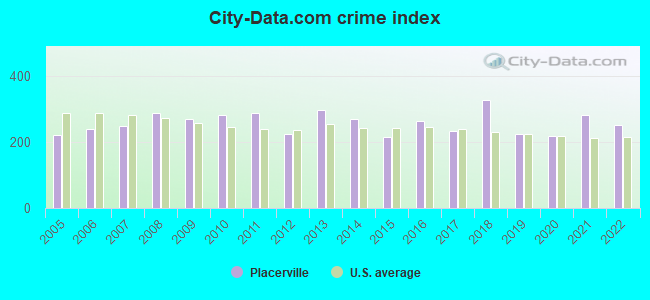
| City-Data.com crime index | 267.9 | 282.5 | 287.6 | 224.4 | 298.1 | 269.7 | 213.8 | 264.0 | 233.0 | 327.7 | 223.4 | 216.6 | 283.2 | 251.2 |
The City-Data.com crime index weighs serious crimes and violent crimes more heavily. Higher means more crime, U.S. average is 246.1. It adjusts for the number of visitors and daily workers commuting into cities.
Crime rate in Placerville detailed stats: murders, rapes, robberies, assaults, burglaries, thefts, arson
Full-time law enforcement employees in 2021, including police officers: 26 (18 officers - 15 male; 3 female).
| Officers per 1,000 residents here: | 1.62 |
| California average: | 2.30 |
 Recent articles from our blog. Our writers, many of them Ph.D. graduates or candidates, create easy-to-read articles on a wide variety of topics.

 | Looking for Thoughts on the Area from El Dorado Hills to Placerville (20 replies) |
| Downtown Folsom to Placerville commute? (1 reply) |
| The positives and negatives of Placerville (16 replies) |
| Montessori Preschool Recommendations (El Dorado Hills, Cameron Park, Shingle Springs, Placerville, Camino) (0 replies) |
| Folsom? Placerville? (42 replies) |
| Coronavirus (12544 replies) |
Latest news from Placerville, CA collected exclusively by city-data.com from local newspapers, TV, and radio stations
Ancestries: European (14.1%), German (12.4%), American (11.3%), English (6.3%), Irish (4.8%), Northern European (3.3%).
Current Local Time: PST time zone
Elevation: 1866 feet
Land area: 5.80 square miles.
Population density: 1,838 people per square mile (low).
676 residents are foreign born (4.2% Latin America, 1.6% Asia).
| This city: | 6.3% |
| California: | 26.5% |
Median real estate property taxes paid for housing units with mortgages in 2022: $3,749 (0.8%)
Median real estate property taxes paid for housing units with no mortgage in 2022: $2,796 (0.6%)
Nearest city with pop. 50,000+: South El Dorado, CA (6.1 miles  , pop. 78,296).
Nearest city with pop. 200,000+: Sacramento, CA (37.9 miles , pop. 407,018).
Nearest city with pop. 1,000,000+: Los Angeles, CA (348.4 miles , pop. 3,694,820).
Nearest cities:
), ), ), ), ), Latitude: 38.73 N, Longitude: 120.80 W
Daytime population change due to commuting: +4,445 (+41.2%)
Workers who live and work in this city: 2,120 (43.2%)
Area code commonly used in this area: 530
Placerville, California accommodation & food services, waste management - Economy and Business Data
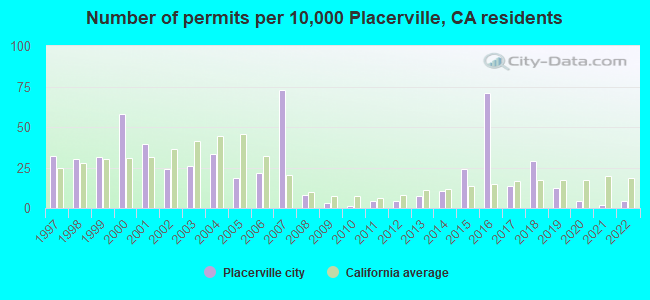
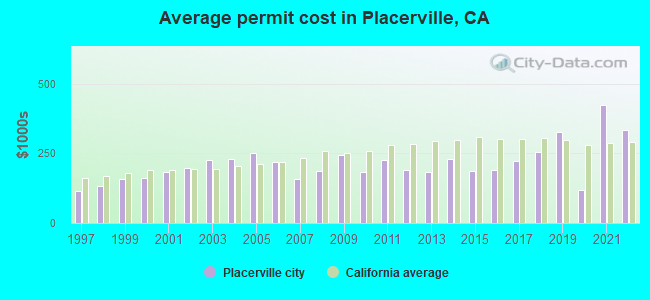
Single-family new house construction building permits:
- 2022: 4 buildings, average cost: $333,600
- 2021: 2 buildings, average cost: $423,000
- 2020: 4 buildings, average cost: $116,500
- 2019: 12 buildings, average cost: $324,600
- 2018: 28 buildings, average cost: $253,700
- 2017: 13 buildings, average cost: $223,300
- 2016: 68 buildings, average cost: $191,100
- 2015: 23 buildings, average cost: $186,500
- 2014: 10 buildings, average cost: $230,800
- 2013: 7 buildings, average cost: $183,600
- 2012: 4 buildings, average cost: $189,200
- 2011: 4 buildings, average cost: $226,800
- 2010: 1 building, cost: $184,300
- 2009: 3 buildings, average cost: $242,000
- 2008: 8 buildings, average cost: $187,700
- 2007: 70 buildings, average cost: $158,600
- 2006: 21 buildings, average cost: $218,500
- 2005: 18 buildings, average cost: $252,100
- 2004: 32 buildings, average cost: $231,200
- 2003: 25 buildings, average cost: $226,000
- 2002: 23 buildings, average cost: $198,000
- 2001: 38 buildings, average cost: $183,700
- 2000: 56 buildings, average cost: $163,100
- 1999: 30 buildings, average cost: $159,300
- 1998: 29 buildings, average cost: $131,300
- 1997: 31 buildings, average cost: $116,100
| Here: | 4.4% |
| California: | 5.1% |
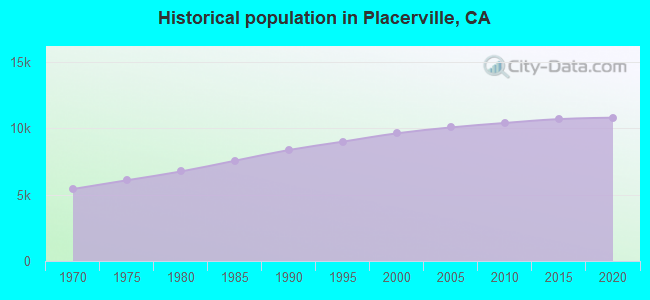
Population change in the 1990s: +1,027 (+12.0%).
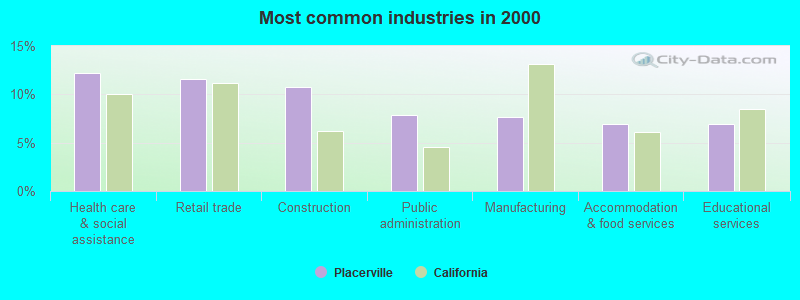
- Construction (10.8%)
- Health care (8.8%)
- Public administration (7.8%)
- Accommodation & food services (7.0%)
- Educational services (6.9%)
- Administrative & support & waste management services (5.8%)
- Professional, scientific, technical services (5.6%)
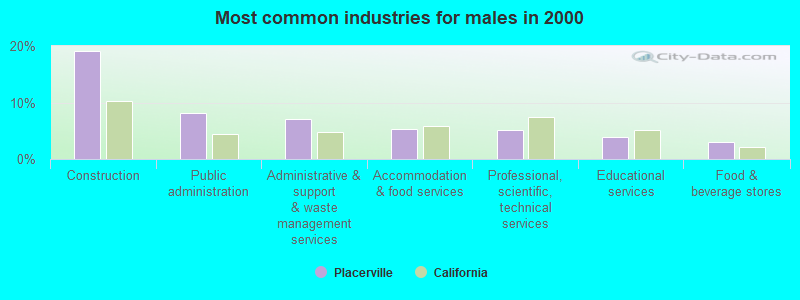
- Construction (19.2%)
- Public administration (8.1%)
- Administrative & support & waste management services (7.1%)
- Accommodation & food services (5.3%)
- Professional, scientific, technical services (5.1%)
- Educational services (3.9%)
- Food & beverage stores (3.0%)
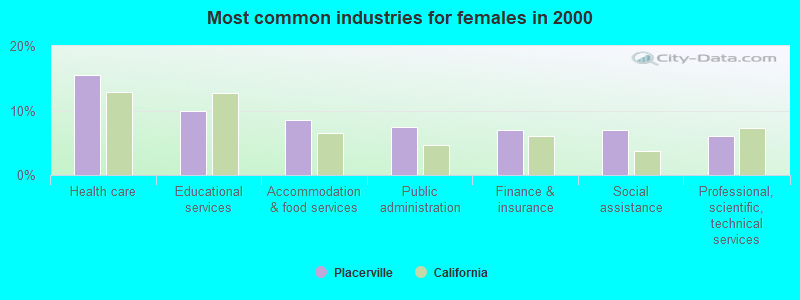
- Health care (15.4%)
- Educational services (9.9%)
- Accommodation & food services (8.6%)
- Public administration (7.5%)
- Finance & insurance (7.0%)
- Social assistance (6.9%)
- Professional, scientific, technical services (6.0%)
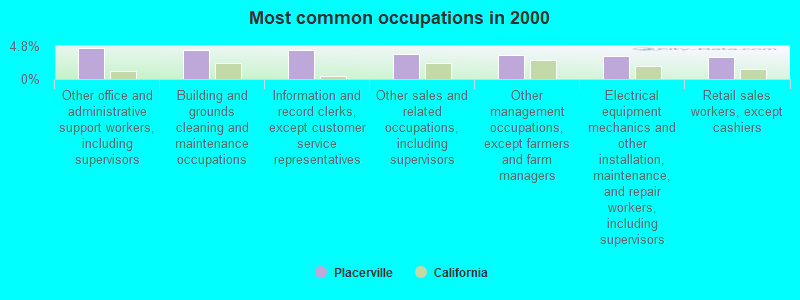
- Other office and administrative support workers, including supervisors (4.5%)
- Building and grounds cleaning and maintenance occupations (4.3%)
- Information and record clerks, except customer service representatives (4.1%)
- Other sales and related occupations, including supervisors (3.7%)
- Other management occupations, except farmers and farm managers (3.5%)
- Electrical equipment mechanics and other installation, maintenance, and repair workers, including supervisors (3.3%)
- Retail sales workers, except cashiers (3.2%)
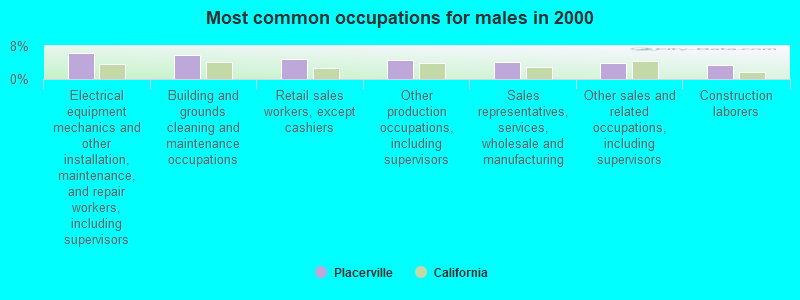
- Electrical equipment mechanics and other installation, maintenance, and repair workers, including supervisors (6.2%)
- Building and grounds cleaning and maintenance occupations (5.9%)
- Retail sales workers, except cashiers (4.8%)
- Other production occupations, including supervisors (4.6%)
- Sales representatives, services, wholesale and manufacturing (4.2%)
- Other sales and related occupations, including supervisors (3.9%)
- Construction laborers (3.4%)
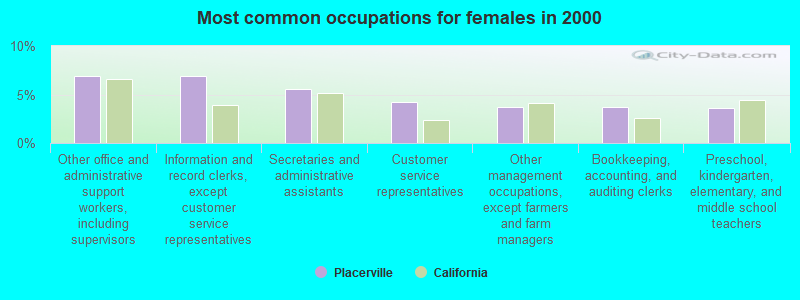
- Other office and administrative support workers, including supervisors (6.9%)
- Information and record clerks, except customer service representatives (6.9%)
- Secretaries and administrative assistants (5.6%)
- Customer service representatives (4.2%)
- Other management occupations, except farmers and farm managers (3.7%)
- Bookkeeping, accounting, and auditing clerks (3.7%)
- Preschool, kindergarten, elementary, and middle school teachers (3.6%)
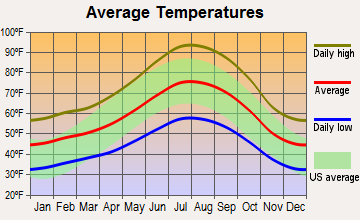
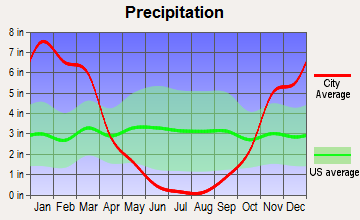
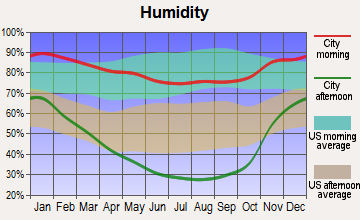
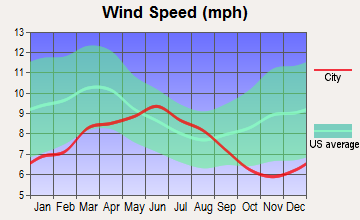
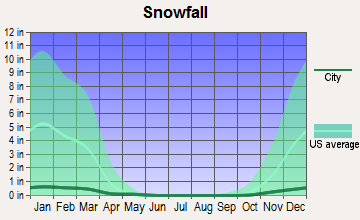
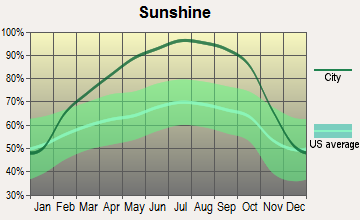
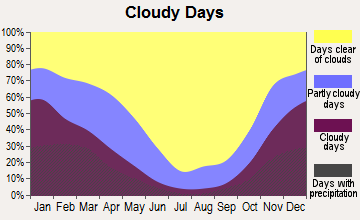
Average climate in Placerville, California
Based on data reported by over 4,000 weather stations
|
|

(lower is better)
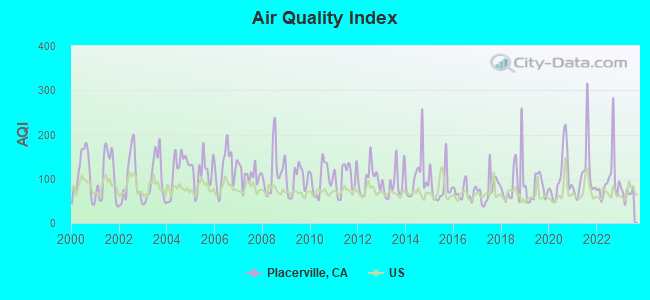
Air Quality Index (AQI) level in 2023 was 67.8. This is about average.
| City: | 67.8 |
| U.S.: | 72.6 |
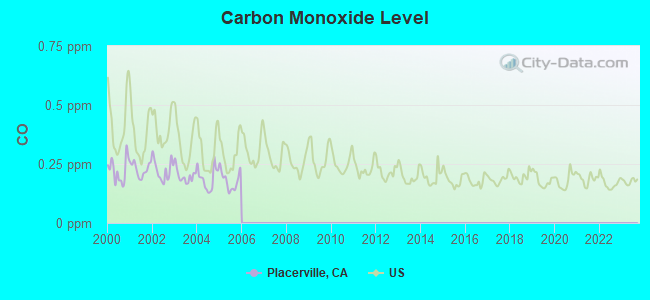
Carbon Monoxide (CO) [ppm] level in 2005 was 0.180. This is better than average. Closest monitor was 1.1 miles away from the city center.
| City: | 0.180 |
| U.S.: | 0.251 |
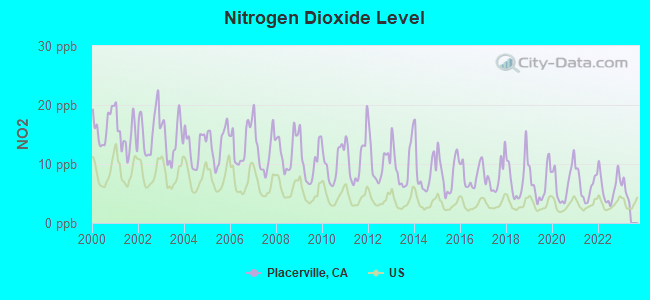
Nitrogen Dioxide (NO2) [ppb] level in 2022 was 5.99. This is about average. Closest monitor was 21.1 miles away from the city center.
| City: | 5.99 |
| U.S.: | 5.11 |
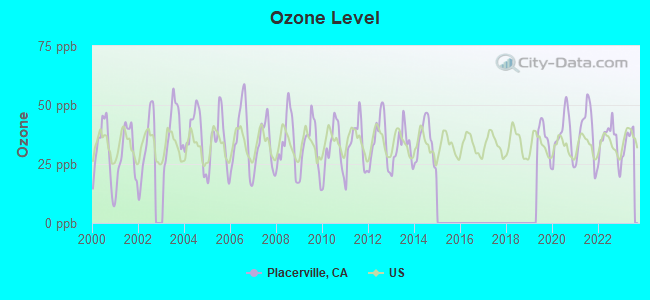
Ozone [ppb] level in 2023 was 35.0. This is about average. Closest monitor was 0.5 miles away from the city center.
| City: | 35.0 |
| U.S.: | 33.3 |
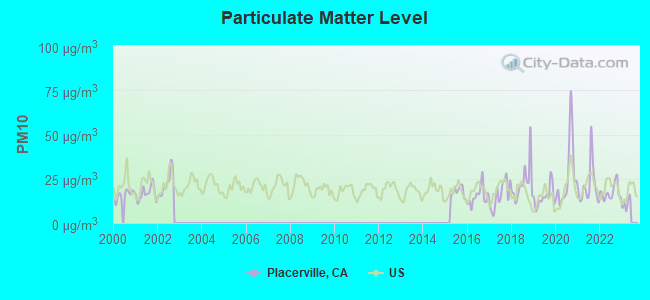
Particulate Matter (PM10) [µg/m3] level in 2022 was 17.3. This is about average. Closest monitor was 1.1 miles away from the city center.
| City: | 17.3 |
| U.S.: | 19.2 |
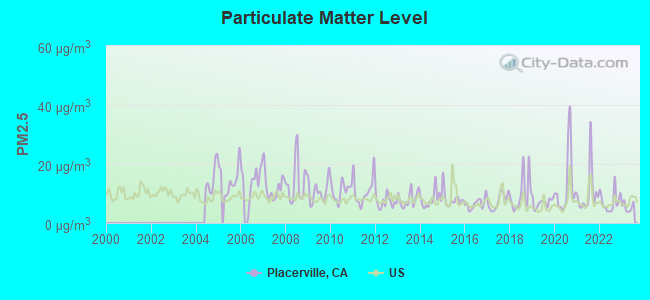
Particulate Matter (PM2.5) [µg/m3] level in 2023 was 5.39. This is significantly better than average. Closest monitor was 19.8 miles away from the city center.
| City: | 5.39 |
| U.S.: | 8.11 |
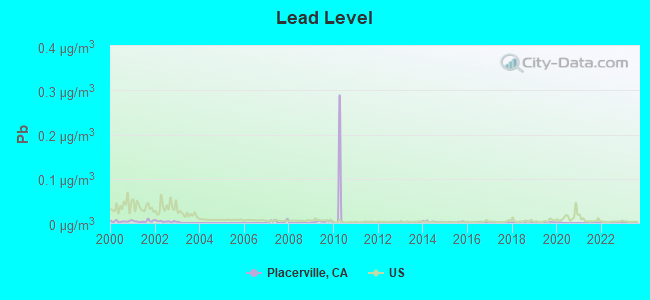
Lead (Pb) [µg/m3] level in 2023 was 0.00140. This is significantly better than average. Closest monitor was 24.6 miles away from the city center.
| City: | 0.00140 |
| U.S.: | 0.00931 |
Earthquake activity:
Placerville-area historical earthquake activity is significantly above California state average. It is 7630% greater than the overall U.S. average.On 4/18/1906 at 13:12:21, a magnitude 7.9 (7.9 UK, Class: Major, Intensity: VIII - XII) earthquake occurred 129.4 miles away from the city center, causing $524,000,000 total damage
On 10/3/1915 at 06:52:48, a magnitude 7.6 (7.6 UK) earthquake occurred 214.4 miles away from the city center
On 12/21/1932 at 06:10:09, a magnitude 7.2 (7.2 UK) earthquake occurred 147.7 miles away from Placerville center
On 10/18/1989 at 00:04:15, a magnitude 7.1 (6.5 MB, 7.1 MS, 6.9 MW, 7.0 ML) earthquake occurred 123.8 miles away from Placerville center, causing 62 deaths (62 shaking deaths) and 3757 injuries, causing $1,305,032,704 total damage
On 7/21/1952 at 11:52:14, a magnitude 7.7 (7.7 UK) earthquake occurred 276.6 miles away from Placerville center, causing $50,000,000 total damage
On 11/4/1927 at 13:51:53, a magnitude 7.5 (7.5 UK) earthquake occurred 264.1 miles away from Placerville center
Magnitude types: body-wave magnitude (MB), local magnitude (ML), surface-wave magnitude (MS), moment magnitude (MW)
Natural disasters:
The number of natural disasters in El Dorado County (17) is near the US average (15).Major Disasters (Presidential) Declared: 8
Emergencies Declared: 2
Causes of natural disasters: Floods: 12, Mudslides: 6, Winter Storms: 6, Landslides: 5, Storms: 5, Fires: 2, Drought: 1, Heavy Rain: 1, Hurricane: 1, Other: 1 (Note: some incidents may be assigned to more than one category).

Hospitals and medical centers in Placerville:
- MARSHALL MEDICAL CENTER (1-RH) (Voluntary non-profit - Other, provides emergency services, 1100 MARSHALL WAY)
- MARSHALL HOME CARE (681 MAIN STREET, SUITE 206)
- GOLD COUNTRY HEALTH CENTER (4301 GOLDEN CENTER DRIVE)
- THE PINES AT PLACERVILLE HEALTHCARE CENTER (1040 MARSHALL WAY)
- WESTERN SLOPE HEALTH CENTER (3280 WASHINGTON STREET)
Airports and heliports located in Placerville:
- Placerville Airport (PVF) (Runways: 2, Air Taxi Ops: 900, Itinerant Ops: 30,600, Local Ops: 27,000, Military Ops: 900)
- Akin Airport (54CN) (Runways: 1)
- Perryman Airport (7CL9) (Runways: 1)
- Swansboro Country Airport (01CL) (Runways: 1)
- El Dorado Irrigation District Heliport (67CN)
Colleges/universities with over 2000 students nearest to Placerville:
- Folsom Lake College (about 19 miles; Folsom, CA; Full-time enrollment: 5,308)
- Sierra College (about 23 miles; Rocklin, CA; FT enrollment: 11,488)
- American River College (about 30 miles; Sacramento, CA; FT enrollment: 20,452)
- California State University-Sacramento (about 36 miles; Sacramento, CA; FT enrollment: 22,234)
- Cosumnes River College (about 39 miles; Sacramento, CA; FT enrollment: 9,327)
- Sacramento City College (about 40 miles; Sacramento, CA; FT enrollment: 15,963)
- University of Phoenix-Sacramento Valley Campus (about 40 miles; Sacramento, CA; FT enrollment: 2,855)
Public high schools in Placerville:
- EL DORADO HIGH (Students: 1,007, Location: 561 CANAL ST., Grades: 9-12)
- SKY MOUNTAIN CHARTER (Students: 628, Location: 4535 MISSOURI FLAT RD., Grades: KG-12, Charter school)
- CHARTER COMMUNITY SCHOOL HOME STUDY ACADEMY (Students: 461, Location: 6767 GREEN VALLEY RD., Grades: KG-12, Charter school)
- SPECIAL EDUCATION (Students: 81, Location: 6767 GREEN VALLEY RD., Grades: KG-12)
- GOLDEN RIDGE (Students: 16, Location: 299 FAIR LN., Grades: KG-12)
- CENTRAL SIERRA ROP (Location: 6767 GREEN VALLEY RD., Grades: 10-12)
- VISTA HIGH (Location: 561 CANAL ST., Grades: 9-12)
- WORKFORCE INVESTMENT ACT CHARTER (Location: 6767 GREEN VALLEY RD., Grades: 9-12)
Private high schools in Placerville:
Public elementary/middle schools in Placerville:
- HERBERT C. GREEN MIDDLE (Students: 407, Location: 3781 FORNI RD., Grades: 5-8)
- GOLD TRAIL (Students: 309, Location: 889 COLD SPRINGS RD., Grades: 4-8)
- INDIAN CREEK ELEMENTARY (Students: 307, Location: 6701 GREEN VALLEY RD., Grades: KG-4)
- EDWIN MARKHAM MIDDLE (Students: 303, Location: 2800 MOULTON DR., Grades: 6-8)
- GOLD OAK ELEMENTARY (Students: 264, Location: 3171 PLEASANT VALLEY RD., Grades: KG-5)
- LOUISIANA SCHNELL ELEMENTARY (Students: 242, Location: 2871 SCHNELL SCH RD., Grades: KG-5)
- SIERRA ELEMENTARY (Students: 242, Location: 1100 THOMPSON WAY, Grades: KG-5)
- PLEASANT VALLEY MIDDLE (Students: 153, Location: 4120 PLEASANT VALLEY RD., Grades: 6-8)
- SUTTERS MILL (Students: 94, Location: 4801 LUNEMAN RD., Grades: KG-3)
Private elementary/middle school in Placerville:
Library in Placerville:
Points of interest:
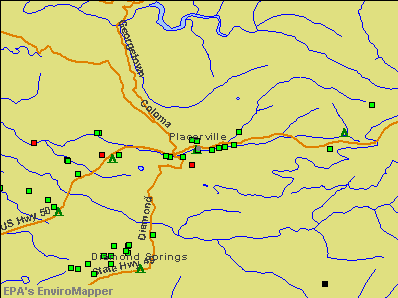
Notable locations in Placerville: El Dorado County Fairgrounds (A), Sierra Golf and Country Club (B), Old Stamp Mill (C), Eldorado National Forest Headquarters (D), Veterans Memorial Building (E), Sigwarts Opera House (F), Placerville City Hall (G), Fountain and Tallman Soda Factory Museum (H), El Dorado Historical Museum (I), El Dorado County Library (J), El Dorado County Law Library (K), El Dorado County Jail (L), El Dorado County Courthouse (M), Confidence Hall (N), The Gates Recovery Foundation (O), El Dorado County Fire Protection District Station 25 Placerville (P), El Dorado County Fire Protection District Station 26 Placerville (Q). Display/hide their locations on the map
Shopping Centers: The Carriage Trade Shopping Center (1), Discovery Plaza Shopping Center (2), County Fair Shopping Center (3). Display/hide their locations on the map
Churches in Placerville include: El Dorado County Federated Church (A), Episcopal Church of Our Saviour (B), First Church of Christ Scientist (C), Full Gospel Church (D). Display/hide their locations on the map
Cemeteries: Catholic Cemetery (1), Middletown Cemetery (2), Union Cemetery (3), Bennett Memorial Park (4). Display/hide their locations on the map
Parks in Placerville include: Hangtown Gold Bug Park (1), Lions Park (2), Lumsden Park (3), Placerville City Park (4), Rotary Park (5). Display/hide their locations on the map
Tourist attraction: Act Event Management (Tours & Charters; 2621 Baker Road) (1). Display/hide its approximate location on the map
Hotels: Apple Country Inn (2920 Paul Bunyon Road) (1), Best Western Placerville Inn (6850 Green Leaf Drive) (2), Broadway Motel (1332 Broadway) (3). Display/hide their approximate locations on the map
Court: El Dorado County - Board of Supervisors (330 Fair Lane) (1). Display/hide its approximate location on the map
Birthplace of: Douglas M. Stone - Marine Corps general, George Hernandez - Actor, Mark Giambruno - Animator, Jerry Freeman - Major League Baseball first baseman, Wolfgang Rafferty - College basketball player (Pacific Tigers).
Drinking water stations with addresses in Placerville and their reported violations in the past:
LOTUS PARK WATER SYSTEM (Population served: 1,000, Groundwater):Past health violations:PENINSULA RECREATION AREA (Population served: 350, Groundwater):Past monitoring violations:
- MCL, Acute (TCR) - Between APR-2005 and JUN-2005, Contaminant: Coliform. Follow-up actions: St Violation/Reminder Notice (APR-01-2005), St Public Notif requested (APR-01-2005)
- 2 regular monitoring violations
Past health violations:YELLOW JACKET CAMPGROUND (Population served: 350, Groundwater):
- MCL, Acute (TCR) - In SEP-2009, Contaminant: Coliform. Follow-up actions: St Public Notif requested (SEP-01-2009), St Boil Water Order (SEP-01-2009), St Violation/Reminder Notice (SEP-01-2009)
- MCL, Monthly (TCR) - In AUG-2009, Contaminant: Coliform. Follow-up actions: St Violation/Reminder Notice (AUG-01-2009), St Public Notif requested (AUG-01-2009)
- MCL, Monthly (TCR) - In JUL-2008, Contaminant: Coliform. Follow-up actions: St Violation/Reminder Notice (JUL-01-2008), St Public Notif requested (JUL-01-2008)
- MCL, Monthly (TCR) - In JUL-2007, Contaminant: Coliform. Follow-up actions: St Violation/Reminder Notice (JUL-01-2007), St Public Notif requested (JUL-01-2007)
- MCL, Monthly (TCR) - In SEP-2006, Contaminant: Coliform. Follow-up actions: St Violation/Reminder Notice (SEP-01-2006)
Past health violations:WENCH CREEK CAMPGROUND (Population served: 250, Groundwater):
- MCL, Monthly (TCR) - In AUG-2007, Contaminant: Coliform. Follow-up actions: St Violation/Reminder Notice (AUG-01-2007), St Public Notif requested (AUG-01-2007)
Past health violations:ICE HOUSE CAMPGROUND (Population served: 200, Groundwater):
- MCL, Monthly (TCR) - In AUG-2007, Contaminant: Coliform. Follow-up actions: St Violation/Reminder Notice (AUG-01-2007), St Public Notif requested (AUG-01-2007)
- MCL, Monthly (TCR) - In SEP-2005, Contaminant: Coliform. Follow-up actions: St Public Notif requested (SEP-01-2005), St Violation/Reminder Notice (SEP-01-2005)
Past health violations:WOLF CREEK CAMPGROUND (Population served: 150, Groundwater):
- MCL, Monthly (TCR) - In AUG-2010, Contaminant: Coliform. Follow-up actions: St Violation/Reminder Notice (AUG-01-2010), St Public Notif requested (AUG-01-2010)
Past health violations:PIPI CAMPGROUND WATER SYSTEM (Population served: 150, Groundwater):
- MCL, Monthly (TCR) - In JUL-2006, Contaminant: Coliform. Follow-up actions: St Violation/Reminder Notice (JUL-01-2006)
Past health violations:GERLE CREEK CAMPGROUND (Population served: 125, Groundwater):Past monitoring violations:
- MCL, Acute (TCR) - In JUN-2008, Contaminant: Coliform. Follow-up actions: St Violation/Reminder Notice (JUN-01-2008), St Public Notif requested (JUN-01-2008)
- 4 regular monitoring violations
Past health violations:Past monitoring violations:
- MCL, Monthly (TCR) - In AUG-2010, Contaminant: Coliform. Follow-up actions: St Violation/Reminder Notice (AUG-01-2010), St Public Notif requested (AUG-01-2010)
- MCL, Monthly (TCR) - In AUG-2007, Contaminant: Coliform. Follow-up actions: St Violation/Reminder Notice (AUG-01-2007), St Public Notif requested (AUG-01-2007)
- MCL, Monthly (TCR) - In JUL-2006, Contaminant: Coliform. Follow-up actions: St Violation/Reminder Notice (JUL-01-2006)
- 2 regular monitoring violations
Drinking water stations with addresses in Placerville that have no violations reported:
- CRYSTAL BASIN MOUNTAIN RESORT (Population served: 100, Primary Water Source Type: Groundwater)
- MT AUKUM SQUARE (Address: 2850 Fairlane Ct. , Population served: 100, Primary Water Source Type: Groundwater)
- CLEVELAND CORRAL REST AREA (Population served: 75, Primary Water Source Type: Groundwater)
- WOODS LAKE REC. AREA (Population served: 25, Primary Water Source Type: Groundwater)
- RED FIR GROUP CAMPGROUND WATER SYST (Population served: 25, Primary Water Source Type: Groundwater)
| This city: | 2.4 people |
| California: | 2.9 people |
| This city: | 59.6% |
| Whole state: | 68.7% |
| This city: | 8.7% |
| Whole state: | 7.2% |
Likely homosexual households (counted as self-reported same-sex unmarried-partner households)
- Lesbian couples: 0.6% of all households
- Gay men: 0.1% of all households
People in group quarters in Placerville in 2010:
- 222 people in local jails and other municipal confinement facilities
- 145 people in nursing facilities/skilled-nursing facilities
- 103 people in hospitals with patients who have no usual home elsewhere
- 66 people in other noninstitutional facilities
- 31 people in residential treatment centers for adults
- 26 people in workers' group living quarters and job corps centers
- 6 people in group homes intended for adults
- 2 people in emergency and transitional shelters (with sleeping facilities) for people experiencing homelessness
People in group quarters in Placerville in 2000:
- 154 people in nursing homes
- 61 people in other noninstitutional group quarters
- 40 people in short-term care, detention or diagnostic centers for delinquent children
- 5 people in mental (psychiatric) hospitals or wards
- 2 people in other group homes
Banks with branches in Placerville (2011 data):
- El Dorado Savings Bank, F.S.B.: Downtown Placerville Branch, El Dorado Savings Bank, F.S.b., West Placerville Branch. Info updated 2011/07/21: Bank assets: $1,706.7 mil, Deposits: $1,536.5 mil, local headquarters, positive income, Mortgage Lending Specialization, 35 total offices
- U.S. Bank National Association: Placerville Branch at 3075 Sacramento Street, branch established on 1934/12/23; Missouri Flat Road Safeway Branch at 3955 Missouri Flat Road, branch established on 2004/12/10. Info updated 2012/01/30: Bank assets: $330,470.8 mil, Deposits: $236,091.5 mil, headquarters in Cincinnati, OH, positive income, 3121 total offices, Holding Company: U.S. Bancorp
- Umpqua Bank: East Placerville Branch at 1224a Broadway, branch established on 2011/03/07; West Placerville Branch at 3970 Missouri Flat Rd, branch established on 1995/07/09. Info updated 2011/09/02: Bank assets: $11,556.7 mil, Deposits: $9,325.3 mil, headquarters in Roseburg, OR, positive income, Commercial Lending Specialization, 193 total offices, Holding Company: Umpqua Holdings Corporation
- Wells Fargo Bank, National Association: Broadway And Placerville at 1244 Broadway, branch established on 1912/01/01; Placerville Branch at 186 Placerville Drive, branch established on 1964/11/30. Info updated 2011/04/05: Bank assets: $1,161,490.0 mil, Deposits: $905,653.0 mil, headquarters in Sioux Falls, SD, positive income, 6395 total offices, Holding Company: Wells Fargo & Company
- Bank of America, National Association: West Placerville Branch at 3964 K Missouri Flat Road, branch established on 1981/01/12; Placerville Branch at 3044 Sacramento Street, branch established on 1975/05/05. Info updated 2009/11/18: Bank assets: $1,451,969.3 mil, Deposits: $1,077,176.8 mil, headquarters in Charlotte, NC, positive income, 5782 total offices, Holding Company: Bank Of America Corporation
- JPMorgan Chase Bank, National Association: Placerville Branch at 3980 Missouri Flat Road, branch established on 1924/01/01. Info updated 2011/11/10: Bank assets: $1,811,678.0 mil, Deposits: $1,190,738.0 mil, headquarters in Columbus, OH, positive income, International Specialization, 5577 total offices, Holding Company: Jpmorgan Chase & Co.
- Union Bank, National Association: Placerville Branch at 3970-L Missouri Flat Road, branch established on 1981/12/14. Info updated 2011/09/01: Bank assets: $88,967.5 mil, Deposits: $65,286.4 mil, headquarters in San Francisco, CA, positive income, Commercial Lending Specialization, 403 total offices, Holding Company: Mitsubishi Ufj Financial Group, Inc.
- River City Bank: Placerville Branch at 348 Main Street, branch established on 1975/11/22. Info updated 2006/11/03: Bank assets: $1,119.8 mil, Deposits: $900.1 mil, headquarters in Sacramento, CA, positive income, Commercial Lending Specialization, 15 total offices
For population 15 years and over in Placerville:
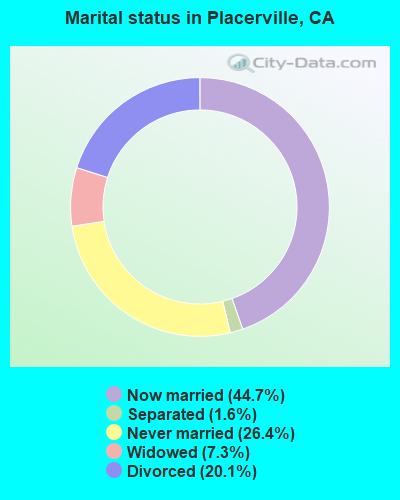
- Never married: 26.4%
- Now married: 44.7%
- Separated: 1.6%
- Widowed: 7.3%
- Divorced: 20.1%
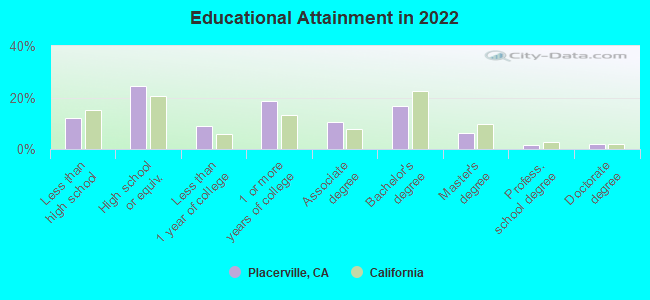
For population 25 years and over in Placerville:
- High school or higher: 88.2%
- Bachelor's degree or higher: 25.3%
- Graduate or professional degree: 7.9%
- Unemployed: 8.2%
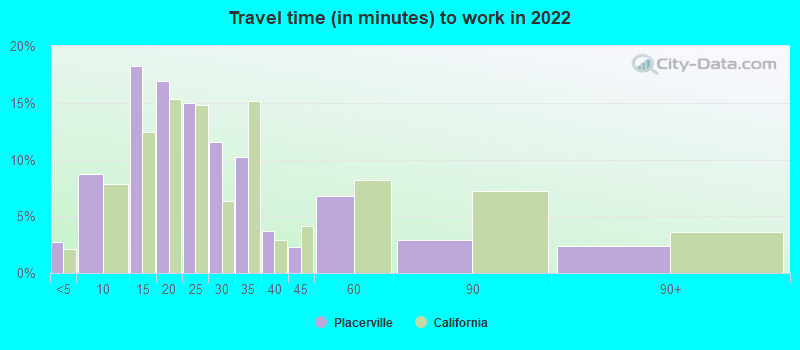
- Mean travel time to work (commute): 23.8 minutes
| Here: | 13.1 |
| California average: | 15.5 |
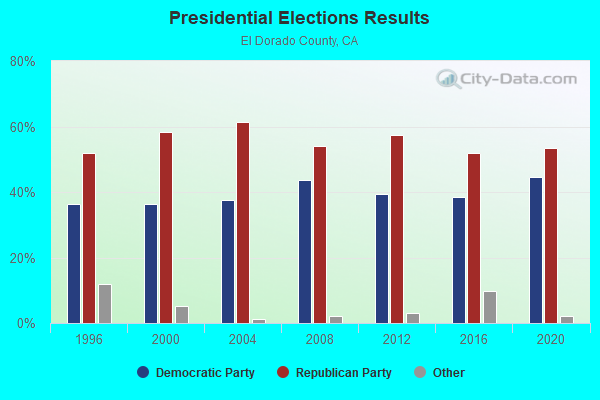
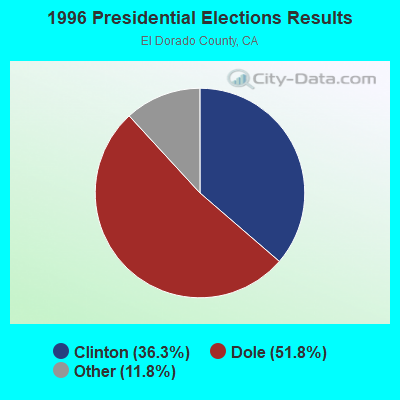
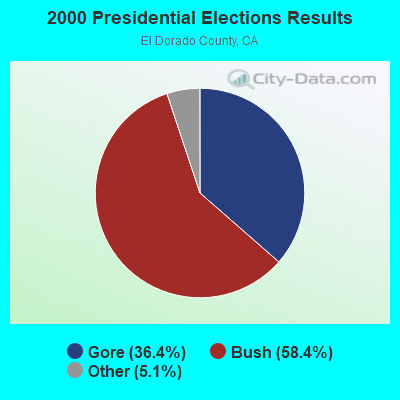
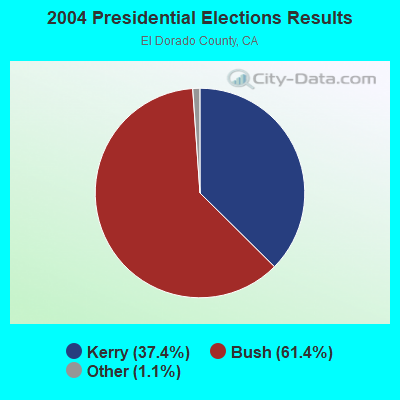
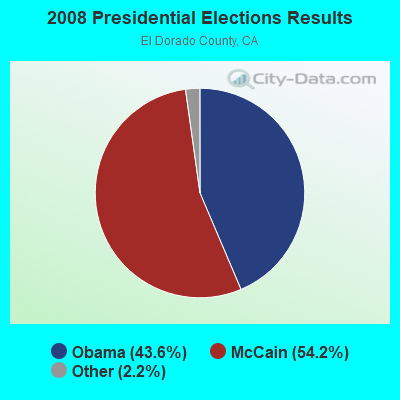
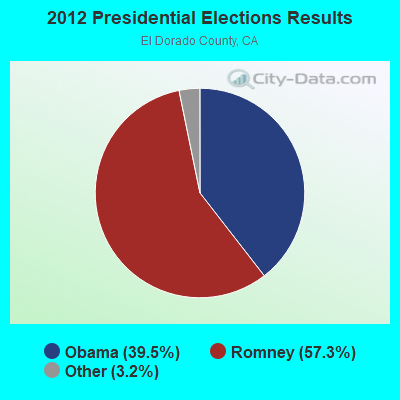
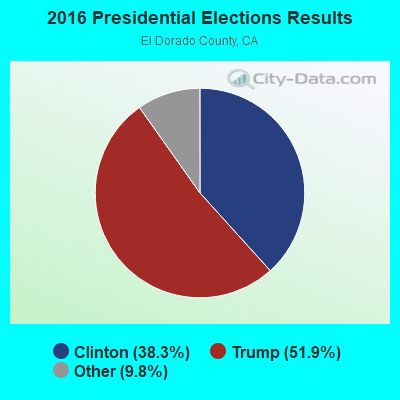
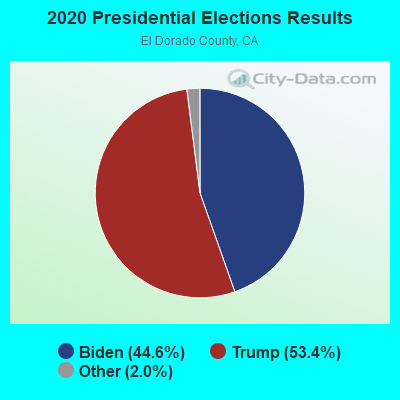
Graphs represent county-level data. Detailed 2008 Election Results
Neighborhoods in Placerville:
(Placerville, California Neighborhood Map)- Anna's Oak Mobile Home Park neighborhood
- Arrowbee Hills neighborhood
- Arrowbee Woods neighborhood
- Bar K Estates neighborhood
- Bedford Woods neighborhood
- Blanchard Homes neighborhood
- Bluebell neighborhood
- Bucks Bar neighborhood
- Bungalow Terrace neighborhood
- Campbell Village neighborhood
- Capell Vista neighborhood
- Carson Rd Park neighborhood
- Cedar Bluffs Phase neighborhood
- Cedar Vista neighborhood
- Chili Bar Mobile Home Park neighborhood
- Cloverleaf Estates neighborhood
- Cold Sprgs Mobile Home Park neighborhood
- Cold Springs neighborhood
- Coloma neighborhood
- Coloma Heights neighborhood
- Cottonwood Park neighborhood
- Crestview Mobile Home Park neighborhood
- Crystal Heights neighborhood
- Darlington neighborhood
- Deer Crossing neighborhood
- Deerfield Estates neighborhood
- Diablo Sierra neighborhood
- Diamond Manor Mobile Home Park neighborhood
- Diamond Springs Mobile Home Park neighborhood
- E Pino Heights neighborhood
- El Dorado Knolls neighborhood
- Eskaton Placerville neighborhood
- Eskaton Village neighborhood
- Estey Estates neighborhood
- Five Mile Terrace neighborhood
- Glenview neighborhood
- Gold Hill Estates neighborhood
- Gold Trail Acres neighborhood
- Gold Trail Park neighborhood
- Gold West Mobile Home Park neighborhood
- Golden Eagle neighborhood
- Golf Course Terrace neighborhood
- Goyan Heights neighborhood
- Grand View Heights neighborhood
- Green Acres neighborhood
- Green Valley Oaks neighborhood
- Greenstone Country neighborhood
- Hangtown Mobile Home Park neighborhood
- Hawk's Landing neighborhood
- Hidden Springs Mobile Home Park neighborhood
- Highway View Terrace neighborhood
- Hillcrest Homes neighborhood
- Hines Ranch Estates neighborhood
- Hollyway Homes neighborhood
- Jensen Lots neighborhood
- Long View Estates neighborhood
- Madden Ranch neighborhood
- Madrone Heights neighborhood
- Meadow Creek neighborhood
- Meadow Oaks neighborhood
- Mel Mar neighborhood
- Middletwn Oaks neighborhood
- Moulton Manor neighborhood
- Mountian View Mobile Home Park neighborhood
- Newtown Acres neighborhood
- North Ridge neighborhood
- Oak Knoll Estates neighborhood
- Oak Knoll Manor neighborhood
- Orchard Hill neighborhood
- Pacific Heights neighborhood
- Panorama Mobile Home Park neighborhood
- Park View neighborhood
- Park View Estates neighborhood
- Pheasant Run neighborhood
- Pine Trail Ranch neighborhood
- Pinewood neighborhood
- Pino Vista neighborhood
- Pleasant Valley Estates neighborhood
- Prospect Plaza neighborhood
- Quail Ridge neighborhood
- Quartz Mountain neighborhood
- Ridge Orchard Hill neighborhood
- Ridgecrest Estates neighborhood
- Riverwood neighborhood
- Springwood neighborhood
- Sundown Estates neighborhood
- Sunnyvale neighborhood
- Swans Country neighborhood
- The Woods neighborhood
- Vogelsang Estates neighborhood
- Washington Heights neighborhood
- Weber Fork neighborhood
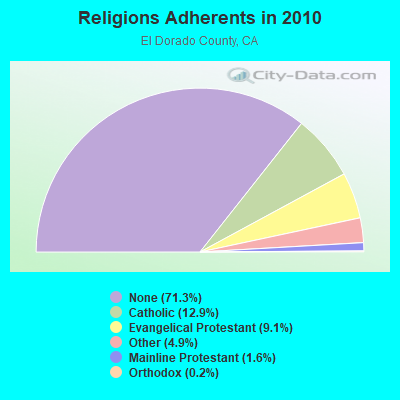
Religion statistics for Placerville, CA (based on El Dorado County data)

| Religion | Adherents | Congregations |
|---|---|---|
| Catholic | 23,298 | 6 |
| Evangelical Protestant | 16,538 | 69 |
| Other | 8,928 | 30 |
| Mainline Protestant | 2,937 | 11 |
| Orthodox | 315 | 2 |
| None | 129,042 | - |
Food Environment Statistics:
| This county: | 1.88 / 10,000 pop. |
| California: | 2.14 / 10,000 pop. |
| El Dorado County: | 0.06 / 10,000 pop. |
| State: | 0.04 / 10,000 pop. |
| El Dorado County: | 0.97 / 10,000 pop. |
| California: | 0.62 / 10,000 pop. |
| El Dorado County: | 2.28 / 10,000 pop. |
| California: | 1.49 / 10,000 pop. |
| El Dorado County: | 9.87 / 10,000 pop. |
| California: | 7.42 / 10,000 pop. |
| This county: | 6.7% |
| State: | 7.3% |
| El Dorado County: | 19.9% |
| California: | 21.3% |
| El Dorado County: | 13.1% |
| California: | 17.9% |
Health and Nutrition:
| Here: | 49.8% |
| California: | 49.4% |
| Placerville: | 47.0% |
| California: | 48.0% |
| Here: | 28.7 |
| California: | 28.1 |
| Placerville: | 19.8% |
| California: | 20.2% |
| This city: | 11.1% |
| California: | 11.2% |
| Here: | 6.8 |
| State: | 6.8 |
| Placerville: | 33.9% |
| California: | 31.5% |
| Placerville: | 56.0% |
| California: | 56.4% |
| Placerville: | 77.6% |
| California: | 80.9% |
More about Health and Nutrition of Placerville, CA Residents
| Local government employment and payroll (March 2022) | |||||
| Function | Full-time employees | Monthly full-time payroll | Average yearly full-time wage | Part-time employees | Monthly part-time payroll |
|---|---|---|---|---|---|
| Police Protection - Officers | 17 | $168,651 | $119,048 | 2 | $6,938 |
| Sewerage | 13 | $83,645 | $77,211 | 1 | $2,257 |
| Parks and Recreation | 10 | $54,688 | $65,626 | 8 | $3,995 |
| Police - Other | 7 | $32,101 | $55,030 | 2 | $6,259 |
| Financial Administration | 6 | $35,506 | $71,012 | 1 | $890 |
| Other Government Administration | 5 | $37,164 | $89,194 | 5 | $4,129 |
| Streets and Highways | 5 | $43,041 | $103,298 | 0 | $0 |
| Water Supply | 5 | $26,267 | $63,041 | 0 | $0 |
| Housing and Community Development (Local) | 3 | $21,604 | $86,416 | 7 | $5,106 |
| Totals for Government | 71 | $502,668 | $84,958 | 26 | $29,573 |
Placerville government finances - Expenditure in 2017 (per resident):
- Construction - Regular Highways: $2,334,000 ($218.87)
Protective Inspection and Regulation - Other: $81,000 ($7.60)
- Current Operations - Regular Highways: $4,509,000 ($422.82)
Police Protection: $4,048,000 ($379.59)
Sewerage: $3,113,000 ($291.92)
Central Staff Services: $2,547,000 ($238.84)
Parks and Recreation: $1,712,000 ($160.54)
Water Utilities: $1,440,000 ($135.03)
Protective Inspection and Regulation - Other: $800,000 ($75.02)
Parking Facilities: $146,000 ($13.69)
- General - Interest on Debt: $2,226,000 ($208.74)
- Other Capital Outlay - General - Other: $945,000 ($88.62)
Central Staff Services: $72,000 ($6.75)
General Public Building: $72,000 ($6.75)
Housing and Community Development: $63,000 ($5.91)
Parks and Recreation: $51,000 ($4.78)
Police Protection: $45,000 ($4.22)
- Water Utilities - Interest on Debt: $20,000 ($1.88)
Placerville government finances - Revenue in 2017 (per resident):
- Charges - Sewerage: $5,409,000 ($507.22)
Other: $2,227,000 ($208.83)
Parks and Recreation: $593,000 ($55.61)
Parking Facilities: $174,000 ($16.32)
- Federal Intergovernmental - Other: $3,579,000 ($335.62)
Water Utilities: $1,724,000 ($161.67)
- Miscellaneous - Interest Earnings: $183,000 ($17.16)
General Revenue - Other: $110,000 ($10.32)
Fines and Forfeits: $107,000 ($10.03)
Rents: $59,000 ($5.53)
- Revenue - Water Utilities: $2,035,000 ($190.83)
- State Intergovernmental - Other: $352,000 ($33.01)
Highways: $228,000 ($21.38)
General Local Government Support: $1,000 ($0.09)
- Tax - General Sales and Gross Receipts: $6,429,000 ($602.87)
Property: $1,096,000 ($102.78)
Public Utilities Sales: $311,000 ($29.16)
Other License: $227,000 ($21.29)
Other Selective Sales: $210,000 ($19.69)
Occupation and Business License - Other: $156,000 ($14.63)
Documentary and Stock Transfer: $62,000 ($5.81)
Placerville government finances - Debt in 2017 (per resident):
- Long Term Debt - Beginning Outstanding - Unspecified Public Purpose: $56,129,000 ($5263.41)
Outstanding Unspecified Public Purpose: $54,159,000 ($5078.68)
Retired Unspecified Public Purpose: $2,594,000 ($243.25)
Issue, Unspecified Public Purpose: $623,000 ($58.42)
Placerville government finances - Cash and Securities in 2017 (per resident):
- Bond Funds - Cash and Securities: $103,000 ($9.66)
- Other Funds - Cash and Securities: $7,719,000 ($723.84)
| Businesses in Placerville, CA | ||||
| Name | Count | Name | Count | |
|---|---|---|---|---|
| AT&T | 2 | McDonald's | 2 | |
| Ace Hardware | 2 | Nike | 2 | |
| AutoZone | 1 | OfficeMax | 1 | |
| Baskin-Robbins | 1 | Panda Express | 1 | |
| Best Western | 1 | Payless | 1 | |
| Big O Tires | 1 | Penske | 1 | |
| CVS | 1 | Quiznos | 1 | |
| Carl\s Jr. | 1 | RadioShack | 1 | |
| Curves | 1 | Rite Aid | 2 | |
| DHL | 1 | Sears | 1 | |
| Dennys | 1 | Starbucks | 3 | |
| FedEx | 7 | Subway | 3 | |
| GNC | 2 | T.J.Maxx | 1 | |
| GameStop | 1 | Taco Bell | 1 | |
| H&R Block | 1 | Toyota | 1 | |
| Home Depot | 1 | True Value | 2 | |
| Jack In The Box | 1 | U-Haul | 3 | |
| Jamba Juice | 1 | UPS | 4 | |
| Jones New York | 2 | Verizon Wireless | 1 | |
| KFC | 1 | Vons | 1 | |
| Kmart | 1 | Walgreens | 1 | |
| Lane Furniture | 2 | Walmart | 1 | |
| Little Caesars Pizza | 1 | |||
Strongest AM radio stations in Placerville:
- KAHI (950 AM; 10 kW; AUBURN, CA; Owner: IHR EDUCATIONAL BROADCASTING)
- KHTK (1140 AM; 50 kW; SACRAMENTO, CA; Owner: INFINITY RADIO SUBSIDIARY OPERATIONS INC.)
- KFIA (710 AM; 25 kW; CARMICHAEL, CA; Owner: VISTA BROADCASTING INC.)
- KSTE (650 AM; 25 kW; RANCHO CORDOVA, CA; Owner: AMFM RADIO LICENSES, L.L.C.)
- KFBK (1530 AM; 50 kW; SACRAMENTO, CA; Owner: AMFM RADIO LICENSES, L.L.C.)
- KLIB (1110 AM; 10 kW; ROSEVILLE, CA; Owner: WAY BROADCASTING, INC.)
- KCBC (770 AM; 50 kW; RIVERBANK, CA; Owner: KIERTRON, INC.)
- KFSG (1690 AM; 10 kW; ROSEVILLE, CA; Owner: WAY BROADCASTING, INC.)
- KKOH (780 AM; 50 kW; RENO, NV; Owner: CITADEL BROADCASTING COMPANY)
- KTKZ (1380 AM; 5 kW; SACRAMENTO, CA; Owner: VISTA BROADCASTING, INC.)
- KEBR (1210 AM; 5 kW; ROCKLIN, CA; Owner: FAMILY STATIONS, INC.)
- KCBS (740 AM; 50 kW; SAN FRANCISCO, CA; Owner: INFINITY BROADCASTING OPERATIONS, INC.)
- KNBR (680 AM; 50 kW; SAN FRANCISCO, CA; Owner: KNBR LICO, INC.)
Strongest FM radio stations in Placerville:
- KZSA (92.1 FM; PLACERVILLE, CA; Owner: FIRST BROADCASTING INVESTMENTS, L.P.)
- KCCL-FM (101.9 FM; SHINGLE SPRINGS, CA; Owner: ENTRAVISION HOLDINGS, LLC)
- KWYL (102.9 FM; SOUTH LAKE TAHOE, CA; Owner: CITADEL BROADCASTING COMPANY)
- KXCL (103.9 FM; YUBA CITY, CA; Owner: HARLAN COMMUNICATIONS, INC.)
- KOSL (94.3 FM; JACKSON, CA; Owner: HBC LICENSE CORPORATION)
- KHYL (101.1 FM; AUBURN, CA; Owner: AMFM RADIO LICENSES, L.L.C.)
- KEDR (88.1 FM; SACRAMENTO, CA; Owner: FAMILY STATIONS, INC.)
- KTHX-FM (100.1 FM; DAYTON, NV; Owner: NM LICENSING, LLC)
- KRNO (106.9 FM; INCLINE VILLAGE, NV; Owner: AMERICOM LAS VEGAS LIMITED PARTNERSHIP)
- KODS (103.7 FM; CARNELIAN BAY, CA; Owner: AMERICOM, A CALIFORNIA LIMITED PARTNERSHIP)
- KNCI (105.1 FM; SACRAMENTO, CA; Owner: INFINITY RADIO SUBSIDIARY OPERATIONS INC.)
- KLCA (96.5 FM; TAHOE CITY, CA; Owner: AMERICOM LAS VEGAS LIMITED PARTNERSHIP)
- KKTO (90.5 FM; TAHOE CITY, CA; Owner: CALIFORNIA STATE UNIVERSITY)
- KDOT (104.5 FM; RENO, NV; Owner: LOTUS RADIO CORP.)
- KOZZ-FM (105.7 FM; RENO, NV; Owner: LOTUS RADIO CORP.)
- KRXQ (98.5 FM; SACRAMENTO, CA; Owner: ENTERCOM SACRAMENTO LICENSE, LLC)
- KTKE (101.5 FM; TRUCKEE, CA; Owner: TRUCKSTER BROADCASTING, INC.)
- K256AG (99.1 FM; CLARKSVILLE, CA; Owner: EDUCATIONAL MEDIA FOUNDATION)
- KWOD (106.5 FM; SACRAMENTO, CA; Owner: ENTERCOM SACRAMENTO LICENSE, LLC)
- KSRN (107.7 FM; KINGS BEACH, CA; Owner: NM LICENSING, LLC)
TV broadcast stations around Placerville:
- KMMK-LP (Channel 14; SACRAMENTO, CA; Owner: CABALLERO TELEVISION TEXAS, L.L.C.)
- KGTN-LP (Channel 62; PLACERVILLE, CA; Owner: PRAISE THE LORD STUDIO CHAPEL)
- KEZT-CA (Channel 23; SACRAMENTO, CA; Owner: TELEFUTURA SACRAMENTO LLC)
- KSPX (Channel 29; SACRAMENTO, CA; Owner: PAXSON SACRAMENTO LICENSE, INC.)
- KTXL (Channel 40; SACRAMENTO, CA; Owner: CHANNEL 40, INC.)
- KQCA (Channel 58; STOCKTON, CA; Owner: KCRA HEARST-ARGYLE TELEVISION, INC.)
- KOVR (Channel 13; STOCKTON, CA; Owner: SCI - SACRAMENTO LICENSEE, LLC)
- KXTV (Channel 10; SACRAMENTO, CA; Owner: KXTV, INC.)
- KCRA-TV (Channel 3; SACRAMENTO, CA; Owner: KCRA HEARST-ARGYLE TELEVISION, INC.)
- KUVS (Channel 19; MODESTO, CA; Owner: KUVS LICENSE PARTNERSHIP, G.P.)
- KVIE (Channel 6; SACRAMENTO, CA; Owner: KVIE, INC.)
- KMAX-TV (Channel 31; SACRAMENTO, CA; Owner: UPN STATIONS GROUP INC.)
- National Bridge Inventory (NBI) Statistics
- 42Number of bridges
- 341ft / 104mTotal length
- 619,318Total average daily traffic
- 40,794Total average daily truck traffic
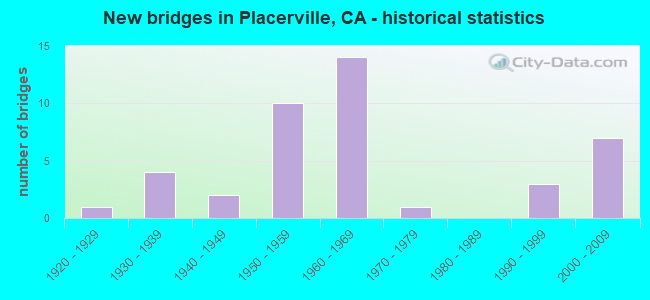
- New bridges - historical statistics
- 11920-1929
- 41930-1939
- 21940-1949
- 101950-1959
- 141960-1969
- 11970-1979
- 31990-1999
- 72000-2009
FCC Registered Private Land Mobile Towers: 4 (See the full list of FCC Registered Private Land Mobile Towers in Placerville, CA)
FCC Registered Broadcast Land Mobile Towers: 51 (See the full list of FCC Registered Broadcast Land Mobile Towers)
FCC Registered Microwave Towers: 42 (See the full list of FCC Registered Microwave Towers in this town)
FCC Registered Paging Towers: 3 (See the full list of FCC Registered Paging Towers)
FCC Registered Maritime Coast & Aviation Ground Towers: 3 (See the full list of FCC Registered Maritime Coast & Aviation Ground Towers)
FCC Registered Amateur Radio Licenses: 625 (See the full list of FCC Registered Amateur Radio Licenses in Placerville)
FAA Registered Aircraft Manufacturers and Dealers: 10 (See the full list of FAA Registered Manufacturers and Dealers in Placerville)
FAA Registered Aircraft: 97 (See the full list of FAA Registered Aircraft)
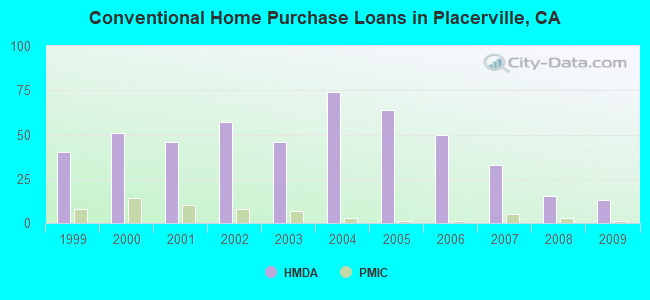
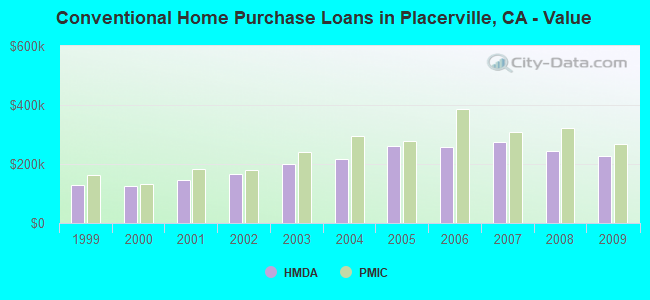
| Home Mortgage Disclosure Act Aggregated Statistics For Year 2009 (Based on 3 partial tracts) | ||||||||||||
| A) FHA, FSA/RHS & VA Home Purchase Loans | B) Conventional Home Purchase Loans | C) Refinancings | D) Home Improvement Loans | F) Non-occupant Loans on < 5 Family Dwellings (A B C & D) | G) Loans On Manufactured Home Dwelling (A B C & D) | |||||||
|---|---|---|---|---|---|---|---|---|---|---|---|---|
| Number | Average Value | Number | Average Value | Number | Average Value | Number | Average Value | Number | Average Value | Number | Average Value | |
| LOANS ORIGINATED | 11 | $251,535 | 13 | $228,749 | 68 | $234,795 | 5 | $145,730 | 10 | $170,601 | 1 | $235,160 |
| APPLICATIONS APPROVED, NOT ACCEPTED | 1 | $347,240 | 2 | $222,665 | 8 | $268,768 | 0 | $0 | 1 | $143,320 | 1 | $138,850 |
| APPLICATIONS DENIED | 2 | $219,400 | 3 | $235,600 | 27 | $275,856 | 1 | $222,920 | 2 | $170,220 | 0 | $0 |
| APPLICATIONS WITHDRAWN | 1 | $384,160 | 3 | $331,573 | 14 | $256,840 | 1 | $87,700 | 2 | $208,930 | 0 | $0 |
| FILES CLOSED FOR INCOMPLETENESS | 1 | $114,420 | 1 | $100,200 | 3 | $275,030 | 0 | $0 | 0 | $0 | 0 | $0 |
Detailed HMDA statistics for the following Tracts: 0310.00 , 0311.00, 0312.00
| Private Mortgage Insurance Companies Aggregated Statistics For Year 2009 (Based on 3 partial tracts) | ||||
| A) Conventional Home Purchase Loans | B) Refinancings | |||
|---|---|---|---|---|
| Number | Average Value | Number | Average Value | |
| LOANS ORIGINATED | 1 | $267,230 | 1 | $159,520 |
| APPLICATIONS APPROVED, NOT ACCEPTED | 0 | $0 | 0 | $0 |
| APPLICATIONS DENIED | 0 | $0 | 0 | $0 |
| APPLICATIONS WITHDRAWN | 0 | $0 | 0 | $0 |
| FILES CLOSED FOR INCOMPLETENESS | 0 | $0 | 0 | $0 |
Detailed PMIC statistics for the following Tracts: 0310.00 , 0311.00, 0312.00
2005 - 2018 National Fire Incident Reporting System (NFIRS) incidents
- Fire incident types reported to NFIRS in Placerville, CA
- 65659.6%Outside Fires
- 28325.7%Structure Fires
- 11210.2%Mobile Property/Vehicle Fires
- 494.5%Other
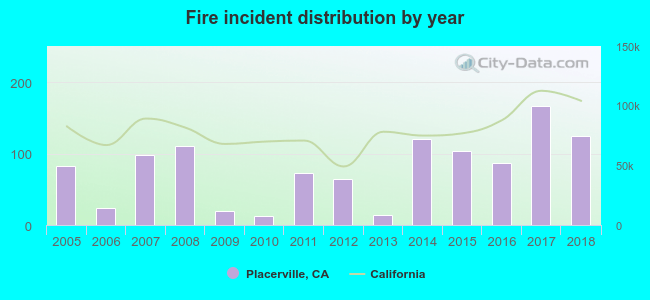 According to the data from the years 2005 - 2018 the average number of fire incidents per year is 79. The highest number of reported fires - 167 took place in 2017, and the least - 12 in 2010. The data has an increasing trend.
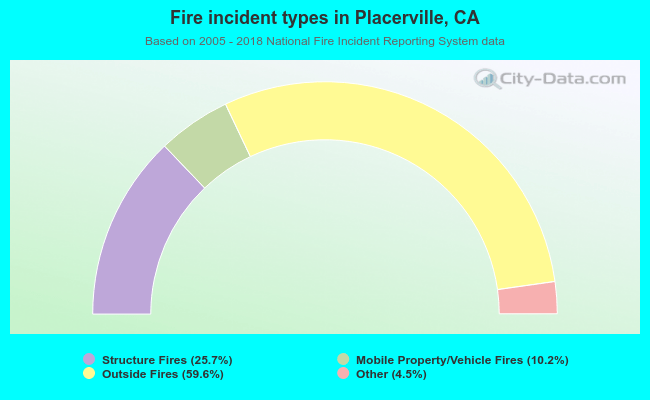 When looking into fire subcategories, the most reports belonged to: Outside Fires (59.6%), and Structure Fires (25.7%).
Fire-safe hotels and motels in Placerville, California:
- Best Western Plus Placerville Inn, 6850 Greenleaf Dr, Placerville, California 95667 , Phone: (530) 622-9100, Fax: (530) 622-9376
- Lexington Historic Cary House Hotel, 300 Main St, Placerville, California 95667 , Phone: (530) 622-4271, Fax: (530) 622-0696
- Gold country inn, 1332 Broadway, Placerville, California 95667 , Phone: (530) 622-3124
- Gold Trail Motor Lodge, 1970 Broadway, Placerville, California 95667 , Phone: (530) 622-2906
- Mother Lode Motel, 1940 Broadway, Placerville, California 95667 , Phone: (530) 622-0895
| Most common first names in Placerville, CA among deceased individuals | ||
| Name | Count | Lived (average) |
|---|---|---|
| John | 208 | 75.2 years |
| Robert | 207 | 73.8 years |
| William | 201 | 76.7 years |
| Mary | 179 | 80.6 years |
| George | 149 | 77.8 years |
| James | 139 | 75.5 years |
| Dorothy | 109 | 81.3 years |
| Charles | 108 | 76.6 years |
| Helen | 99 | 79.5 years |
| Margaret | 95 | 80.9 years |
| Most common last names in Placerville, CA among deceased individuals | ||
| Last name | Count | Lived (average) |
|---|---|---|
| Smith | 104 | 78.0 years |
| Johnson | 81 | 76.3 years |
| Jones | 50 | 76.4 years |
| Anderson | 45 | 78.5 years |
| Williams | 44 | 75.7 years |
| Brown | 43 | 75.2 years |
| Davis | 42 | 81.0 years |
| Wilson | 40 | 78.5 years |
| Miller | 37 | 78.8 years |
| Moore | 31 | 74.4 years |
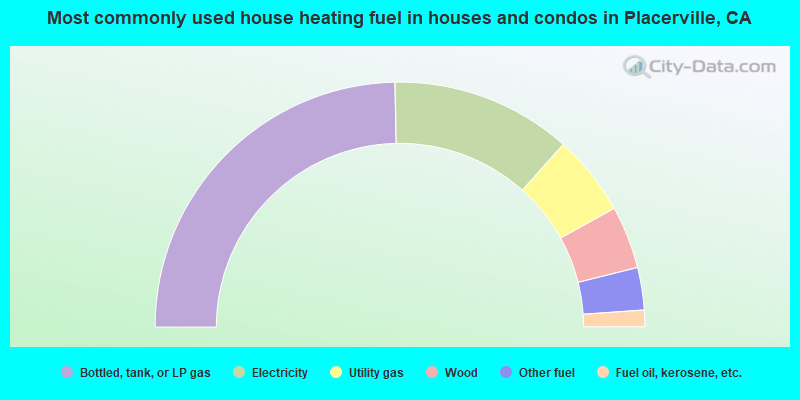
- 49.4%Bottled, tank, or LP gas
- 23.9%Electricity
- 10.7%Utility gas
- 8.3%Wood
- 5.6%Other fuel
- 2.2%Fuel oil, kerosene, etc.
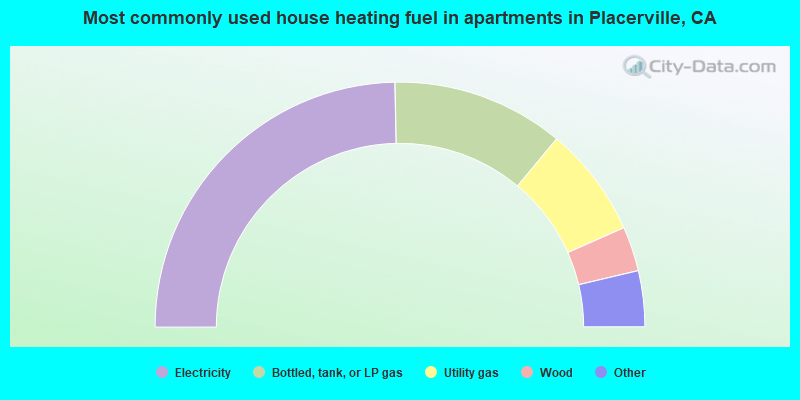
- 49.4%Electricity
- 22.8%Bottled, tank, or LP gas
- 14.6%Utility gas
- 5.9%Wood
- 3.5%Fuel oil, kerosene, etc.
- 2.4%No fuel used
- 1.5%Other fuel
Placerville compared to California state average:
- Median house value below state average.
- Unemployed percentage below state average.
- Black race population percentage significantly below state average.
- Median age significantly above state average.
- Foreign-born population percentage significantly below state average.
- Length of stay since moving in below state average.
- Institutionalized population percentage significantly above state average.
Placerville on our top lists:
- #65 on the list of "Top 101 cities with the largest percentage of people in short-term care, detention or diagnostic centers for delinquent children (population 1,000+)"
- #19 on the list of "Top 101 counties with the lowest number of births per 1000 residents 2007-2013"
- #54 on the list of "Top 101 counties with the largest decrease in the number of births per 1000 residents 2000-2006 to 2007-2013 (pop 50,000+)"
- #84 on the list of "Top 101 counties with highest percentage of residents voting for 3rd party candidates in the 2012 Presidential Election (pop. 50,000+)"

|
|
Total of 194 patent applications in 2008-2024.