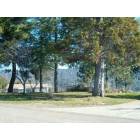
Shingle Springs, California Submit your own pictures of this place and show them to the world
OSM Map
General Map
Google Map
MSN Map
OSM Map
General Map
Google Map
MSN Map
OSM Map
General Map
Google Map
MSN Map
OSM Map
General Map
Google Map
MSN Map
Please wait while loading the map...
Population in 2010: 4,432. Population change since 2000: +67.7%Males: 2,198 Females: 2,234
March 2022 cost of living index in Shingle Springs: 102.0 (near average, U.S. average is 100) Percentage of residents living in poverty in 2022: 7.6%for White Non-Hispanic residents , 9.0% for Hispanic or Latino residents , 17.0% for other race residents )
Profiles of local businesses
Business Search - 14 Million verified businesses
Data:
Median household income ($)
Median household income (% change since 2000)
Household income diversity
Ratio of average income to average house value (%)
Ratio of average income to average rent
Median household income ($) - White
Median household income ($) - Black or African American
Median household income ($) - Asian
Median household income ($) - Hispanic or Latino
Median household income ($) - American Indian and Alaska Native
Median household income ($) - Multirace
Median household income ($) - Other Race
Median household income for houses/condos with a mortgage ($)
Median household income for apartments without a mortgage ($)
Races - White alone (%)
Races - White alone (% change since 2000)
Races - Black alone (%)
Races - Black alone (% change since 2000)
Races - American Indian alone (%)
Races - American Indian alone (% change since 2000)
Races - Asian alone (%)
Races - Asian alone (% change since 2000)
Races - Hispanic (%)
Races - Hispanic (% change since 2000)
Races - Native Hawaiian and Other Pacific Islander alone (%)
Races - Native Hawaiian and Other Pacific Islander alone (% change since 2000)
Races - Two or more races (%)
Races - Two or more races (% change since 2000)
Races - Other race alone (%)
Races - Other race alone (% change since 2000)
Racial diversity
Unemployment (%)
Unemployment (% change since 2000)
Unemployment (%) - White
Unemployment (%) - Black or African American
Unemployment (%) - Asian
Unemployment (%) - Hispanic or Latino
Unemployment (%) - American Indian and Alaska Native
Unemployment (%) - Multirace
Unemployment (%) - Other Race
Population density (people per square mile)
Population - Males (%)
Population - Females (%)
Population - Males (%) - White
Population - Males (%) - Black or African American
Population - Males (%) - Asian
Population - Males (%) - Hispanic or Latino
Population - Males (%) - American Indian and Alaska Native
Population - Males (%) - Multirace
Population - Males (%) - Other Race
Population - Females (%) - White
Population - Females (%) - Black or African American
Population - Females (%) - Asian
Population - Females (%) - Hispanic or Latino
Population - Females (%) - American Indian and Alaska Native
Population - Females (%) - Multirace
Population - Females (%) - Other Race
Coronavirus confirmed cases (Apr 27, 2024)
Deaths caused by coronavirus (Apr 27, 2024)
Coronavirus confirmed cases (per 100k population) (Apr 27, 2024)
Deaths caused by coronavirus (per 100k population) (Apr 27, 2024)
Daily increase in number of cases (Apr 27, 2024)
Weekly increase in number of cases (Apr 27, 2024)
Cases doubled (in days) (Apr 27, 2024)
Hospitalized patients (Apr 18, 2022)
Negative test results (Apr 18, 2022)
Total test results (Apr 18, 2022)
COVID Vaccine doses distributed (per 100k population) (Sep 19, 2023)
COVID Vaccine doses administered (per 100k population) (Sep 19, 2023)
COVID Vaccine doses distributed (Sep 19, 2023)
COVID Vaccine doses administered (Sep 19, 2023)
Likely homosexual households (%)
Likely homosexual households (% change since 2000)
Likely homosexual households - Lesbian couples (%)
Likely homosexual households - Lesbian couples (% change since 2000)
Likely homosexual households - Gay men (%)
Likely homosexual households - Gay men (% change since 2000)
Cost of living index
Median gross rent ($)
Median contract rent ($)
Median monthly housing costs ($)
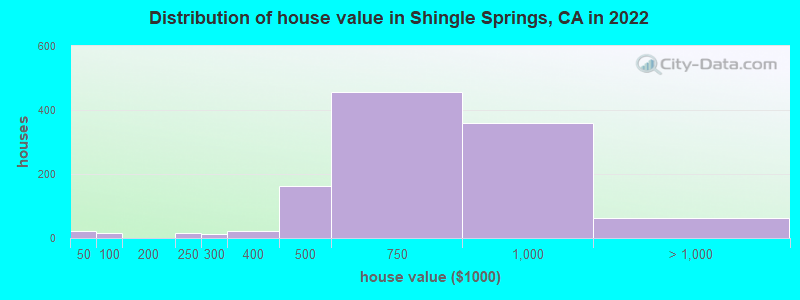
Median house or condo value ($)
Median house or condo value ($ change since 2000)
Mean house or condo value by units in structure - 1, detached ($)
Mean house or condo value by units in structure - 1, attached ($)
Mean house or condo value by units in structure - 2 ($)
Mean house or condo value by units in structure by units in structure - 3 or 4 ($)
Mean house or condo value by units in structure - 5 or more ($)
Mean house or condo value by units in structure - Boat, RV, van, etc. ($)
Mean house or condo value by units in structure - Mobile home ($)
Median house or condo value ($) - White
Median house or condo value ($) - Black or African American
Median house or condo value ($) - Asian
Median house or condo value ($) - Hispanic or Latino
Median house or condo value ($) - American Indian and Alaska Native
Median house or condo value ($) - Multirace
Median house or condo value ($) - Other Race
Median resident age
Resident age diversity
Median resident age - Males
Median resident age - Females
Median resident age - White
Median resident age - Black or African American
Median resident age - Asian
Median resident age - Hispanic or Latino
Median resident age - American Indian and Alaska Native
Median resident age - Multirace
Median resident age - Other Race
Median resident age - Males - White
Median resident age - Males - Black or African American
Median resident age - Males - Asian
Median resident age - Males - Hispanic or Latino
Median resident age - Males - American Indian and Alaska Native
Median resident age - Males - Multirace
Median resident age - Males - Other Race
Median resident age - Females - White
Median resident age - Females - Black or African American
Median resident age - Females - Asian
Median resident age - Females - Hispanic or Latino
Median resident age - Females - American Indian and Alaska Native
Median resident age - Females - Multirace
Median resident age - Females - Other Race
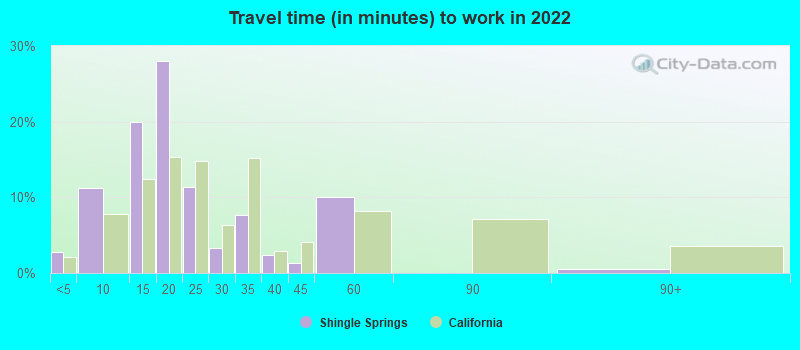
Commute - mean travel time to work (minutes)
Travel time to work - Less than 5 minutes (%)
Travel time to work - Less than 5 minutes (% change since 2000)
Travel time to work - 5 to 9 minutes (%)
Travel time to work - 5 to 9 minutes (% change since 2000)
Travel time to work - 10 to 19 minutes (%)
Travel time to work - 10 to 19 minutes (% change since 2000)
Travel time to work - 20 to 29 minutes (%)
Travel time to work - 20 to 29 minutes (% change since 2000)
Travel time to work - 30 to 39 minutes (%)
Travel time to work - 30 to 39 minutes (% change since 2000)
Travel time to work - 40 to 59 minutes (%)
Travel time to work - 40 to 59 minutes (% change since 2000)
Travel time to work - 60 to 89 minutes (%)
Travel time to work - 60 to 89 minutes (% change since 2000)
Travel time to work - 90 or more minutes (%)
Travel time to work - 90 or more minutes (% change since 2000)
Marital status - Never married (%)
Marital status - Now married (%)
Marital status - Separated (%)
Marital status - Widowed (%)
Marital status - Divorced (%)
Median family income ($)
Median family income (% change since 2000)
Median non-family income ($)
Median non-family income (% change since 2000)
Median per capita income ($)
Median per capita income (% change since 2000)
Median family income ($) - White
Median family income ($) - Black or African American
Median family income ($) - Asian
Median family income ($) - Hispanic or Latino
Median family income ($) - American Indian and Alaska Native
Median family income ($) - Multirace
Median family income ($) - Other Race
Median year house/condo built
Median year apartment built
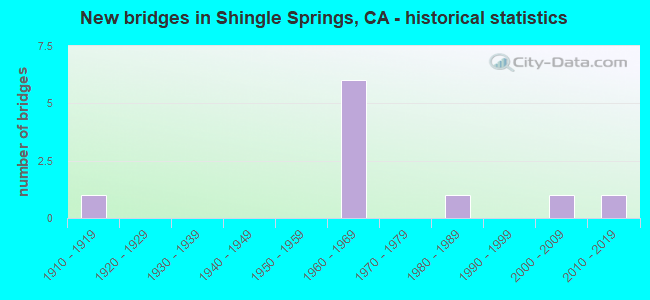
Year house built - Built 2005 or later (%)
Year house built - Built 2000 to 2004 (%)
Year house built - Built 1990 to 1999 (%)
Year house built - Built 1980 to 1989 (%)
Year house built - Built 1970 to 1979 (%)
Year house built - Built 1960 to 1969 (%)
Year house built - Built 1950 to 1959 (%)
Year house built - Built 1940 to 1949 (%)
Year house built - Built 1939 or earlier (%)
Average household size
Household density (households per square mile)
Average household size - White
Average household size - Black or African American
Average household size - Asian
Average household size - Hispanic or Latino
Average household size - American Indian and Alaska Native
Average household size - Multirace
Average household size - Other Race
Occupied housing units (%)
Vacant housing units (%)
Owner occupied housing units (%)
Renter occupied housing units (%)
Vacancy status - For rent (%)
Vacancy status - For sale only (%)
Vacancy status - Rented or sold, not occupied (%)
Vacancy status - For seasonal, recreational, or occasional use (%)
Vacancy status - For migrant workers (%)
Vacancy status - Other vacant (%)
Residents with income below the poverty level (%)
Residents with income below 50% of the poverty level (%)
Children below poverty level (%)
Poor families by family type - Married-couple family (%)
Poor families by family type - Male, no wife present (%)
Poor families by family type - Female, no husband present (%)
Poverty status for native-born residents (%)
Poverty status for foreign-born residents (%)
Poverty among high school graduates not in families (%)
Poverty among people who did not graduate high school not in families (%)
Residents with income below the poverty level (%) - White
Residents with income below the poverty level (%) - Black or African American
Residents with income below the poverty level (%) - Asian
Residents with income below the poverty level (%) - Hispanic or Latino
Residents with income below the poverty level (%) - American Indian and Alaska Native
Residents with income below the poverty level (%) - Multirace
Residents with income below the poverty level (%) - Other Race
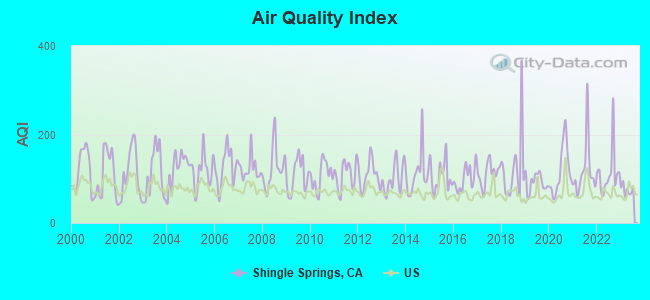
Air pollution - Air Quality Index (AQI)
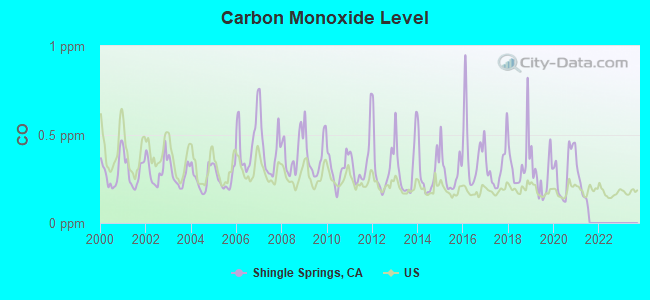
Air pollution - CO
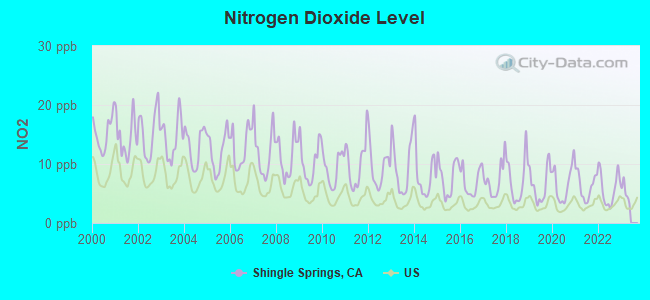
Air pollution - NO2
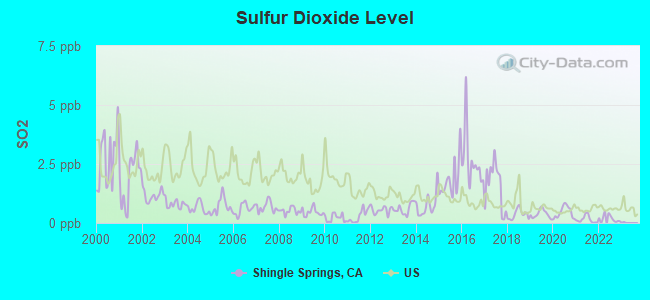
Air pollution - SO2
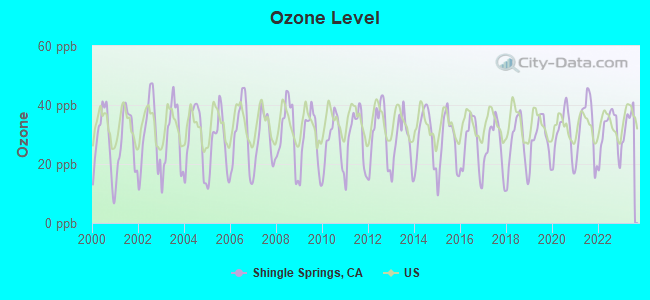
Air pollution - Ozone
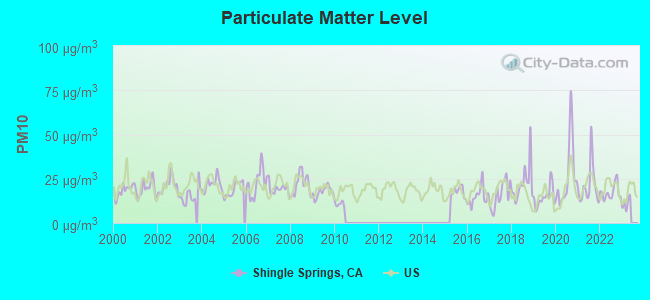
Air pollution - PM10
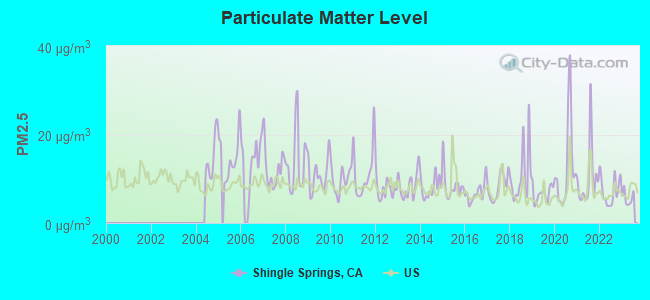
Air pollution - PM25
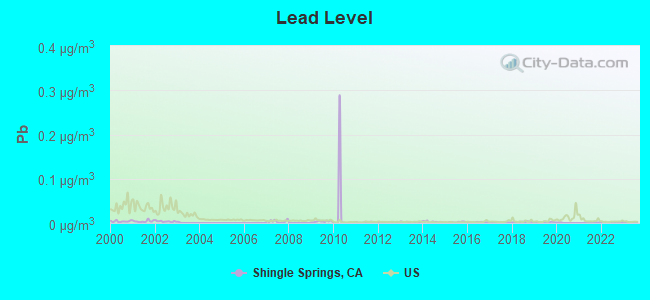
Air pollution - Pb
Crime - Murders per 100,000 population
Crime - Rapes per 100,000 population
Crime - Robberies per 100,000 population
Crime - Assaults per 100,000 population
Crime - Burglaries per 100,000 population
Crime - Thefts per 100,000 population
Crime - Auto thefts per 100,000 population
Crime - Arson per 100,000 population
Crime - City-data.com crime index
Crime - Violent crime index
Crime - Property crime index
Crime - Murders per 100,000 population (5 year average)
Crime - Rapes per 100,000 population (5 year average)
Crime - Robberies per 100,000 population (5 year average)
Crime - Assaults per 100,000 population (5 year average)
Crime - Burglaries per 100,000 population (5 year average)
Crime - Thefts per 100,000 population (5 year average)
Crime - Auto thefts per 100,000 population (5 year average)
Crime - Arson per 100,000 population (5 year average)
Crime - City-data.com crime index (5 year average)
Crime - Violent crime index (5 year average)
Crime - Property crime index (5 year average)
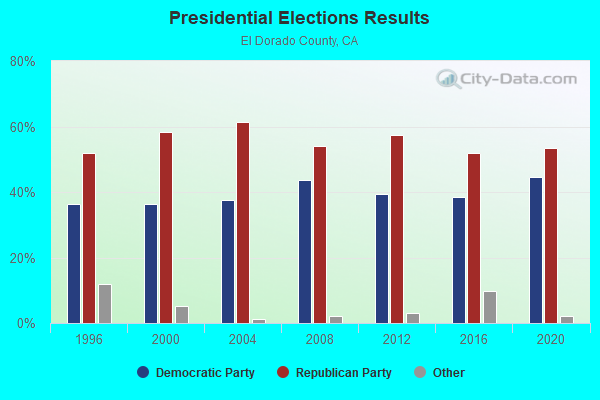
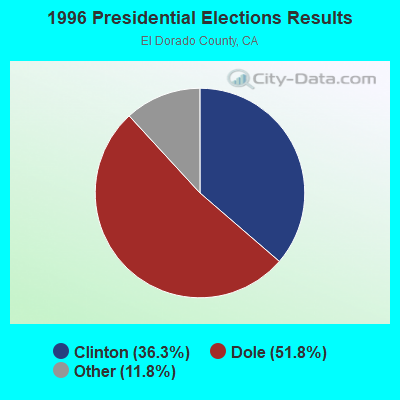
1996 Presidential Elections Results (%) - Democratic Party (Clinton)
1996 Presidential Elections Results (%) - Republican Party (Dole)
1996 Presidential Elections Results (%) - Other
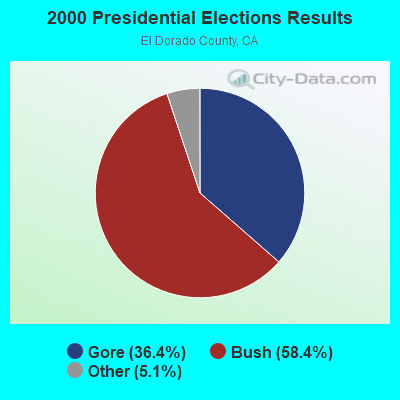
2000 Presidential Elections Results (%) - Democratic Party (Gore)
2000 Presidential Elections Results (%) - Republican Party (Bush)
2000 Presidential Elections Results (%) - Other
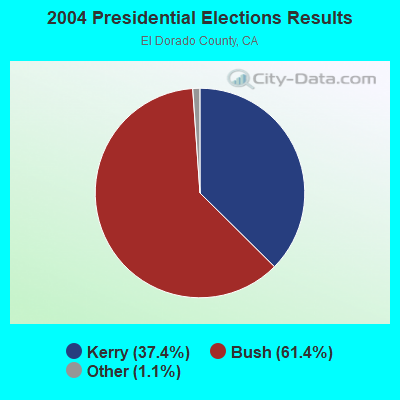
2004 Presidential Elections Results (%) - Democratic Party (Kerry)
2004 Presidential Elections Results (%) - Republican Party (Bush)
2004 Presidential Elections Results (%) - Other
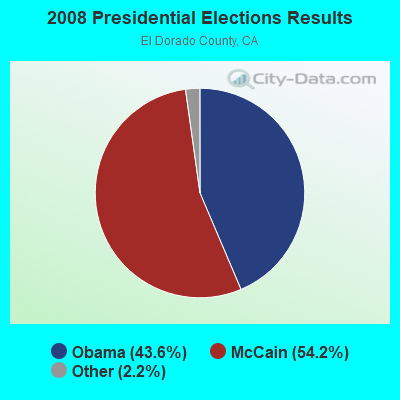
2008 Presidential Elections Results (%) - Democratic Party (Obama)
2008 Presidential Elections Results (%) - Republican Party (McCain)
2008 Presidential Elections Results (%) - Other
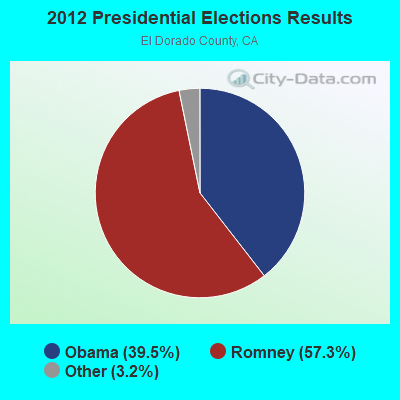
2012 Presidential Elections Results (%) - Democratic Party (Obama)
2012 Presidential Elections Results (%) - Republican Party (Romney)
2012 Presidential Elections Results (%) - Other
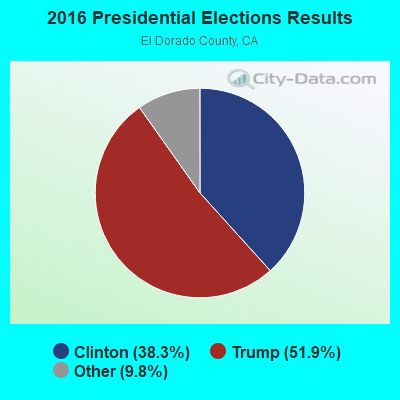
2016 Presidential Elections Results (%) - Democratic Party (Clinton)
2016 Presidential Elections Results (%) - Republican Party (Trump)
2016 Presidential Elections Results (%) - Other
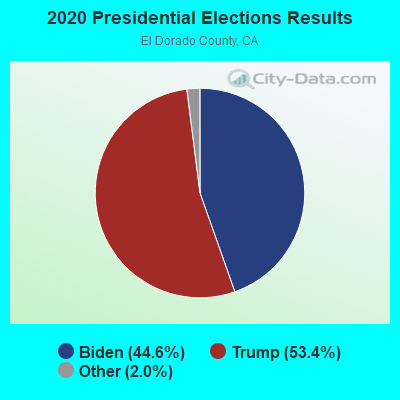
2020 Presidential Elections Results (%) - Democratic Party (Biden)
2020 Presidential Elections Results (%) - Republican Party (Trump)
2020 Presidential Elections Results (%) - Other
Ancestries Reported - Arab (%)
Ancestries Reported - Czech (%)
Ancestries Reported - Danish (%)
Ancestries Reported - Dutch (%)
Ancestries Reported - English (%)
Ancestries Reported - French (%)
Ancestries Reported - French Canadian (%)
Ancestries Reported - German (%)
Ancestries Reported - Greek (%)
Ancestries Reported - Hungarian (%)
Ancestries Reported - Irish (%)
Ancestries Reported - Italian (%)
Ancestries Reported - Lithuanian (%)
Ancestries Reported - Norwegian (%)
Ancestries Reported - Polish (%)
Ancestries Reported - Portuguese (%)
Ancestries Reported - Russian (%)
Ancestries Reported - Scotch-Irish (%)
Ancestries Reported - Scottish (%)
Ancestries Reported - Slovak (%)
Ancestries Reported - Subsaharan African (%)
Ancestries Reported - Swedish (%)
Ancestries Reported - Swiss (%)
Ancestries Reported - Ukrainian (%)
Ancestries Reported - United States (%)
Ancestries Reported - Welsh (%)
Ancestries Reported - West Indian (%)
Ancestries Reported - Other (%)
Educational Attainment - No schooling completed (%)
Educational Attainment - Less than high school (%)
Educational Attainment - High school or equivalent (%)
Educational Attainment - Less than 1 year of college (%)
Educational Attainment - 1 or more years of college (%)
Educational Attainment - Associate degree (%)
Educational Attainment - Bachelor's degree (%)
Educational Attainment - Master's degree (%)
Educational Attainment - Professional school degree (%)
Educational Attainment - Doctorate degree (%)
School Enrollment - Nursery, preschool (%)
School Enrollment - Kindergarten (%)
School Enrollment - Grade 1 to 4 (%)
School Enrollment - Grade 5 to 8 (%)
School Enrollment - Grade 9 to 12 (%)
School Enrollment - College undergrad (%)
School Enrollment - Graduate or professional (%)
School Enrollment - Not enrolled in school (%)
School enrollment - Public schools (%)
School enrollment - Private schools (%)
School enrollment - Not enrolled (%)
Median number of rooms in houses and condos
Median number of rooms in apartments
Housing units lacking complete plumbing facilities (%)
Housing units lacking complete kitchen facilities (%)
Density of houses
Urban houses (%)
Rural houses (%)
Households with people 60 years and over (%)
Households with people 65 years and over (%)
Households with people 75 years and over (%)
Households with one or more nonrelatives (%)
Households with no nonrelatives (%)
Population in households (%)
Family households (%)
Nonfamily households (%)
Population in families (%)
Family households with own children (%)
Median number of bedrooms in owner occupied houses
Mean number of bedrooms in owner occupied houses
Median number of bedrooms in renter occupied houses
Mean number of bedrooms in renter occupied houses
Median number of vehichles in owner occupied houses
Mean number of vehichles in owner occupied houses
Median number of vehichles in renter occupied houses
Mean number of vehichles in renter occupied houses
Mortgage status - with mortgage (%)
Mortgage status - with second mortgage (%)
Mortgage status - with home equity loan (%)
Mortgage status - with both second mortgage and home equity loan (%)
Mortgage status - without a mortgage (%)
Average family size
Average family size - White
Average family size - Black or African American
Average family size - Asian
Average family size - Hispanic or Latino
Average family size - American Indian and Alaska Native
Average family size - Multirace
Average family size - Other Race
Geographical mobility - Same house 1 year ago (%)
Geographical mobility - Moved within same county (%)
Geographical mobility - Moved from different county within same state (%)
Geographical mobility - Moved from different state (%)
Geographical mobility - Moved from abroad (%)
Place of birth - Born in state of residence (%)
Place of birth - Born in other state (%)
Place of birth - Native, outside of US (%)
Place of birth - Foreign born (%)
Housing units in structures - 1, detached (%)
Housing units in structures - 1, attached (%)
Housing units in structures - 2 (%)
Housing units in structures - 3 or 4 (%)
Housing units in structures - 5 to 9 (%)
Housing units in structures - 10 to 19 (%)
Housing units in structures - 20 to 49 (%)
Housing units in structures - 50 or more (%)
Housing units in structures - Mobile home (%)
Housing units in structures - Boat, RV, van, etc. (%)
House/condo owner moved in on average (years ago)
Renter moved in on average (years ago)
Year householder moved into unit - Moved in 1999 to March 2000 (%)
Year householder moved into unit - Moved in 1995 to 1998 (%)
Year householder moved into unit - Moved in 1990 to 1994 (%)
Year householder moved into unit - Moved in 1980 to 1989 (%)
Year householder moved into unit - Moved in 1970 to 1979 (%)
Year householder moved into unit - Moved in 1969 or earlier (%)
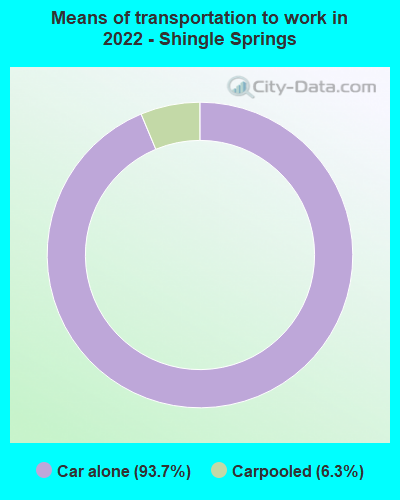
Means of transportation to work - Drove car alone (%)
Means of transportation to work - Carpooled (%)
Means of transportation to work - Public transportation (%)
Means of transportation to work - Bus or trolley bus (%)
Means of transportation to work - Streetcar or trolley car (%)
Means of transportation to work - Subway or elevated (%)
Means of transportation to work - Railroad (%)
Means of transportation to work - Ferryboat (%)
Means of transportation to work - Taxicab (%)
Means of transportation to work - Motorcycle (%)
Means of transportation to work - Bicycle (%)
Means of transportation to work - Walked (%)
Means of transportation to work - Other means (%)
Working at home (%)
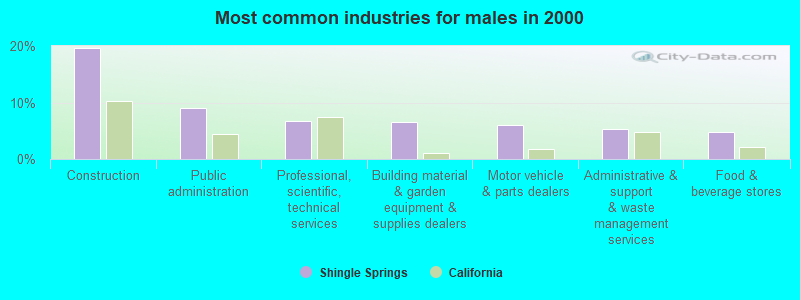
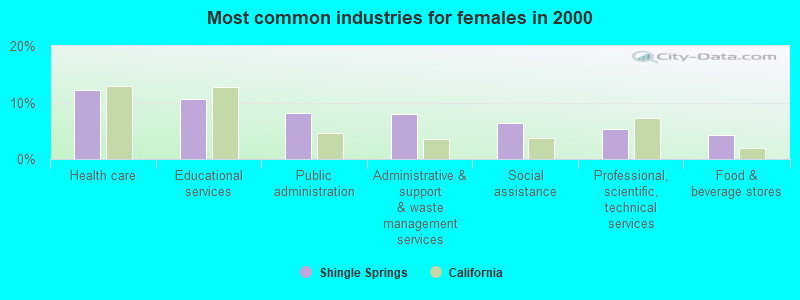
Industry diversity
Most Common Industries - Agriculture, forestry, fishing and hunting, and mining (%)
Most Common Industries - Agriculture, forestry, fishing and hunting (%)
Most Common Industries - Mining, quarrying, and oil and gas extraction (%)
Most Common Industries - Construction (%)
Most Common Industries - Manufacturing (%)
Most Common Industries - Wholesale trade (%)
Most Common Industries - Retail trade (%)
Most Common Industries - Transportation and warehousing, and utilities (%)
Most Common Industries - Transportation and warehousing (%)
Most Common Industries - Utilities (%)
Most Common Industries - Information (%)
Most Common Industries - Finance and insurance, and real estate and rental and leasing (%)
Most Common Industries - Finance and insurance (%)
Most Common Industries - Real estate and rental and leasing (%)
Most Common Industries - Professional, scientific, and management, and administrative and waste management services (%)
Most Common Industries - Professional, scientific, and technical services (%)
Most Common Industries - Management of companies and enterprises (%)
Most Common Industries - Administrative and support and waste management services (%)
Most Common Industries - Educational services, and health care and social assistance (%)
Most Common Industries - Educational services (%)
Most Common Industries - Health care and social assistance (%)
Most Common Industries - Arts, entertainment, and recreation, and accommodation and food services (%)
Most Common Industries - Arts, entertainment, and recreation (%)
Most Common Industries - Accommodation and food services (%)
Most Common Industries - Other services, except public administration (%)
Most Common Industries - Public administration (%)
Occupation diversity
Most Common Occupations - Management, business, science, and arts occupations (%)
Most Common Occupations - Management, business, and financial occupations (%)
Most Common Occupations - Management occupations (%)
Most Common Occupations - Business and financial operations occupations (%)
Most Common Occupations - Computer, engineering, and science occupations (%)
Most Common Occupations - Computer and mathematical occupations (%)
Most Common Occupations - Architecture and engineering occupations (%)
Most Common Occupations - Life, physical, and social science occupations (%)
Most Common Occupations - Education, legal, community service, arts, and media occupations (%)
Most Common Occupations - Community and social service occupations (%)
Most Common Occupations - Legal occupations (%)
Most Common Occupations - Education, training, and library occupations (%)
Most Common Occupations - Arts, design, entertainment, sports, and media occupations (%)
Most Common Occupations - Healthcare practitioners and technical occupations (%)
Most Common Occupations - Health diagnosing and treating practitioners and other technical occupations (%)
Most Common Occupations - Health technologists and technicians (%)
Most Common Occupations - Service occupations (%)
Most Common Occupations - Healthcare support occupations (%)
Most Common Occupations - Protective service occupations (%)
Most Common Occupations - Fire fighting and prevention, and other protective service workers including supervisors (%)
Most Common Occupations - Law enforcement workers including supervisors (%)
Most Common Occupations - Food preparation and serving related occupations (%)
Most Common Occupations - Building and grounds cleaning and maintenance occupations (%)
Most Common Occupations - Personal care and service occupations (%)
Most Common Occupations - Sales and office occupations (%)
Most Common Occupations - Sales and related occupations (%)
Most Common Occupations - Office and administrative support occupations (%)
Most Common Occupations - Natural resources, construction, and maintenance occupations (%)
Most Common Occupations - Farming, fishing, and forestry occupations (%)
Most Common Occupations - Construction and extraction occupations (%)
Most Common Occupations - Installation, maintenance, and repair occupations (%)
Most Common Occupations - Production, transportation, and material moving occupations (%)
Most Common Occupations - Production occupations (%)
Most Common Occupations - Transportation occupations (%)
Most Common Occupations - Material moving occupations (%)
People in Group quarters - Institutionalized population (%)
People in Group quarters - Correctional institutions (%)
People in Group quarters - Federal prisons and detention centers (%)
People in Group quarters - Halfway houses (%)
People in Group quarters - Local jails and other confinement facilities (including police lockups) (%)
People in Group quarters - Military disciplinary barracks (%)
People in Group quarters - State prisons (%)
People in Group quarters - Other types of correctional institutions (%)
People in Group quarters - Nursing homes (%)
People in Group quarters - Hospitals/wards, hospices, and schools for the handicapped (%)
People in Group quarters - Hospitals/wards and hospices for chronically ill (%)
People in Group quarters - Hospices or homes for chronically ill (%)
People in Group quarters - Military hospitals or wards for chronically ill (%)
People in Group quarters - Other hospitals or wards for chronically ill (%)
People in Group quarters - Hospitals or wards for drug/alcohol abuse (%)
People in Group quarters - Mental (Psychiatric) hospitals or wards (%)
People in Group quarters - Schools, hospitals, or wards for the mentally retarded (%)
People in Group quarters - Schools, hospitals, or wards for the physically handicapped (%)
People in Group quarters - Institutions for the deaf (%)
People in Group quarters - Institutions for the blind (%)
People in Group quarters - Orthopedic wards and institutions for the physically handicapped (%)
People in Group quarters - Wards in general hospitals for patients who have no usual home elsewhere (%)
People in Group quarters - Wards in military hospitals for patients who have no usual home elsewhere (%)
People in Group quarters - Juvenile institutions (%)
People in Group quarters - Long-term care (%)
People in Group quarters - Homes for abused, dependent, and neglected children (%)
People in Group quarters - Residential treatment centers for emotionally disturbed children (%)
People in Group quarters - Training schools for juvenile delinquents (%)
People in Group quarters - Short-term care, detention or diagnostic centers for delinquent children (%)
People in Group quarters - Type of juvenile institution unknown (%)
People in Group quarters - Noninstitutionalized population (%)
People in Group quarters - College dormitories (includes college quarters off campus) (%)
People in Group quarters - Military quarters (%)
People in Group quarters - On base (%)
People in Group quarters - Barracks, unaccompanied personnel housing (UPH), (Enlisted/Officer), ;and similar group living quarters for military personnel (%)
People in Group quarters - Transient quarters for temporary residents (%)
People in Group quarters - Military ships (%)
People in Group quarters - Group homes (%)
People in Group quarters - Homes or halfway houses for drug/alcohol abuse (%)
People in Group quarters - Homes for the mentally ill (%)
People in Group quarters - Homes for the mentally retarded (%)
People in Group quarters - Homes for the physically handicapped (%)
People in Group quarters - Other group homes (%)
People in Group quarters - Religious group quarters (%)
People in Group quarters - Dormitories (%)
People in Group quarters - Agriculture workers' dormitories on farms (%)
People in Group quarters - Job Corps and vocational training facilities (%)
People in Group quarters - Other workers' dormitories (%)
People in Group quarters - Crews of maritime vessels (%)
People in Group quarters - Other nonhousehold living situations (%)
People in Group quarters - Other noninstitutional group quarters (%)
Residents speaking English at home (%)
Residents speaking English at home - Born in the United States (%)
Residents speaking English at home - Native, born elsewhere (%)
Residents speaking English at home - Foreign born (%)
Residents speaking Spanish at home (%)
Residents speaking Spanish at home - Born in the United States (%)
Residents speaking Spanish at home - Native, born elsewhere (%)
Residents speaking Spanish at home - Foreign born (%)
Residents speaking other language at home (%)
Residents speaking other language at home - Born in the United States (%)
Residents speaking other language at home - Native, born elsewhere (%)
Residents speaking other language at home - Foreign born (%)
Class of Workers - Employee of private company (%)
Class of Workers - Self-employed in own incorporated business (%)
Class of Workers - Private not-for-profit wage and salary workers (%)
Class of Workers - Local government workers (%)
Class of Workers - State government workers (%)
Class of Workers - Federal government workers (%)
Class of Workers - Self-employed workers in own not incorporated business and Unpaid family workers (%)
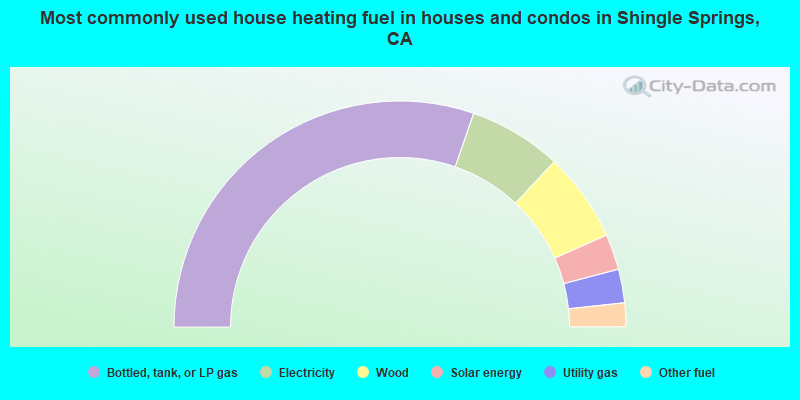
House heating fuel used in houses and condos - Utility gas (%)
House heating fuel used in houses and condos - Bottled, tank, or LP gas (%)
House heating fuel used in houses and condos - Electricity (%)
House heating fuel used in houses and condos - Fuel oil, kerosene, etc. (%)
House heating fuel used in houses and condos - Coal or coke (%)
House heating fuel used in houses and condos - Wood (%)
House heating fuel used in houses and condos - Solar energy (%)
House heating fuel used in houses and condos - Other fuel (%)
House heating fuel used in houses and condos - No fuel used (%)
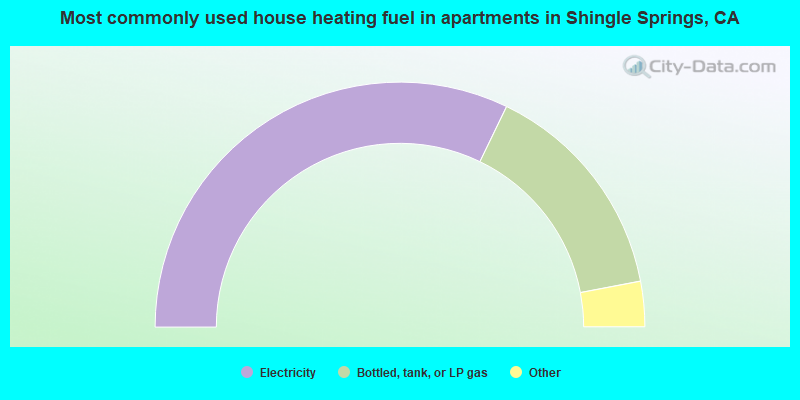
House heating fuel used in apartments - Utility gas (%)
House heating fuel used in apartments - Bottled, tank, or LP gas (%)
House heating fuel used in apartments - Electricity (%)
House heating fuel used in apartments - Fuel oil, kerosene, etc. (%)
House heating fuel used in apartments - Coal or coke (%)
House heating fuel used in apartments - Wood (%)
House heating fuel used in apartments - Solar energy (%)
House heating fuel used in apartments - Other fuel (%)
House heating fuel used in apartments - No fuel used (%)
Armed forces status - In Armed Forces (%)
Armed forces status - Civilian (%)
Armed forces status - Civilian - Veteran (%)
Armed forces status - Civilian - Nonveteran (%)
Fatal accidents locations in years 2005-2021
Fatal accidents locations in 2005
Fatal accidents locations in 2006
Fatal accidents locations in 2007
Fatal accidents locations in 2008
Fatal accidents locations in 2009
Fatal accidents locations in 2010
Fatal accidents locations in 2011
Fatal accidents locations in 2012
Fatal accidents locations in 2013
Fatal accidents locations in 2014
Fatal accidents locations in 2015
Fatal accidents locations in 2016
Fatal accidents locations in 2017
Fatal accidents locations in 2018
Fatal accidents locations in 2019
Fatal accidents locations in 2020
Fatal accidents locations in 2021
Alcohol use - People drinking some alcohol every month (%)
Alcohol use - People not drinking at all (%)
Alcohol use - Average days/month drinking alcohol
Alcohol use - Average drinks/week
Alcohol use - Average days/year people drink much
Audiometry - Average condition of hearing (%)
Audiometry - People that can hear a whisper from across a quiet room (%)
Audiometry - People that can hear normal voice from across a quiet room (%)
Audiometry - Ears ringing, roaring, buzzing (%)
Audiometry - Had a job exposure to loud noise (%)
Audiometry - Had off-work exposure to loud noise (%)
Blood Pressure & Cholesterol - Has high blood pressure (%)
Blood Pressure & Cholesterol - Checking blood pressure at home (%)
Blood Pressure & Cholesterol - Frequently checking blood cholesterol (%)
Blood Pressure & Cholesterol - Has high cholesterol level (%)
Consumer Behavior - Money monthly spent on food at supermarket/grocery store
Consumer Behavior - Money monthly spent on food at other stores
Consumer Behavior - Money monthly spent on eating out
Consumer Behavior - Money monthly spent on carryout/delivered foods
Consumer Behavior - Income spent on food at supermarket/grocery store (%)
Consumer Behavior - Income spent on food at other stores (%)
Consumer Behavior - Income spent on eating out (%)
Consumer Behavior - Income spent on carryout/delivered foods (%)
Current Health Status - General health condition (%)
Current Health Status - Blood donors (%)
Current Health Status - Has blood ever tested for HIV virus (%)
Current Health Status - Left-handed people (%)
Dermatology - People using sunscreen (%)
Diabetes - Diabetics (%)
Diabetes - Had a blood test for high blood sugar (%)
Diabetes - People taking insulin (%)
Diet Behavior & Nutrition - Diet health (%)
Diet Behavior & Nutrition - Milk product consumption (# of products/month)
Diet Behavior & Nutrition - Meals not home prepared (#/week)
Diet Behavior & Nutrition - Meals from fast food or pizza place (#/week)
Diet Behavior & Nutrition - Ready-to-eat foods (#/month)
Diet Behavior & Nutrition - Frozen meals/pizza (#/month)
Drug Use - People that ever used marijuana or hashish (%)
Drug Use - Ever used hard drugs (%)
Drug Use - Ever used any form of cocaine (%)
Drug Use - Ever used heroin (%)
Drug Use - Ever used methamphetamine (%)
Health Insurance - People covered by health insurance (%)
Kidney Conditions-Urology - Avg. # of times urinating at night
Medical Conditions - People with asthma (%)
Medical Conditions - People with anemia (%)
Medical Conditions - People with psoriasis (%)
Medical Conditions - People with overweight (%)
Medical Conditions - Elderly people having difficulties in thinking or remembering (%)
Medical Conditions - People who ever received blood transfusion (%)
Medical Conditions - People having trouble seeing even with glass/contacts (%)
Medical Conditions - People with arthritis (%)
Medical Conditions - People with gout (%)
Medical Conditions - People with congestive heart failure (%)
Medical Conditions - People with coronary heart disease (%)
Medical Conditions - People with angina pectoris (%)
Medical Conditions - People who ever had heart attack (%)
Medical Conditions - People who ever had stroke (%)
Medical Conditions - People with emphysema (%)
Medical Conditions - People with thyroid problem (%)
Medical Conditions - People with chronic bronchitis (%)
Medical Conditions - People with any liver condition (%)
Medical Conditions - People who ever had cancer or malignancy (%)
Mental Health - People who have little interest in doing things (%)
Mental Health - People feeling down, depressed, or hopeless (%)
Mental Health - People who have trouble sleeping or sleeping too much (%)
Mental Health - People feeling tired or having little energy (%)
Mental Health - People with poor appetite or overeating (%)
Mental Health - People feeling bad about themself (%)
Mental Health - People who have trouble concentrating on things (%)
Mental Health - People moving or speaking slowly or too fast (%)
Mental Health - People having thoughts they would be better off dead (%)
Oral Health - Average years since last visit a dentist
Oral Health - People embarrassed because of mouth (%)
Oral Health - People with gum disease (%)
Oral Health - General health of teeth and gums (%)
Oral Health - Average days a week using dental floss/device
Oral Health - Average days a week using mouthwash for dental problem
Oral Health - Average number of teeth
Pesticide Use - Households using pesticides to control insects (%)
Pesticide Use - Households using pesticides to kill weeds (%)
Physical Activity - People doing vigorous-intensity work activities (%)
Physical Activity - People doing moderate-intensity work activities (%)
Physical Activity - People walking or bicycling (%)
Physical Activity - People doing vigorous-intensity recreational activities (%)
Physical Activity - People doing moderate-intensity recreational activities (%)
Physical Activity - Average hours a day doing sedentary activities
Physical Activity - Average hours a day watching TV or videos
Physical Activity - Average hours a day using computer
Physical Functioning - People having limitations keeping them from working (%)
Physical Functioning - People limited in amount of work they can do (%)
Physical Functioning - People that need special equipment to walk (%)
Physical Functioning - People experiencing confusion/memory problems (%)
Physical Functioning - People requiring special healthcare equipment (%)
Prescription Medications - Average number of prescription medicines taking
Preventive Aspirin Use - Adults 40+ taking low-dose aspirin (%)
Reproductive Health - Vaginal deliveries (%)
Reproductive Health - Cesarean deliveries (%)
Reproductive Health - Deliveries resulted in a live birth (%)
Reproductive Health - Pregnancies resulted in a delivery (%)
Reproductive Health - Women breastfeeding newborns (%)
Reproductive Health - Women that had a hysterectomy (%)
Reproductive Health - Women that had both ovaries removed (%)
Reproductive Health - Women that have ever taken birth control pills (%)
Reproductive Health - Women taking birth control pills (%)
Reproductive Health - Women that have ever used Depo-Provera or injectables (%)
Reproductive Health - Women that have ever used female hormones (%)
Sexual Behavior - People 18+ that ever had sex (vaginal, anal, or oral) (%)
Sexual Behavior - Males 18+ that ever had vaginal sex with a woman (%)
Sexual Behavior - Males 18+ that ever performed oral sex on a woman (%)
Sexual Behavior - Males 18+ that ever had anal sex with a woman (%)
Sexual Behavior - Males 18+ that ever had any sex with a man (%)
Sexual Behavior - Females 18+ that ever had vaginal sex with a man (%)
Sexual Behavior - Females 18+ that ever performed oral sex on a man (%)
Sexual Behavior - Females 18+ that ever had anal sex with a man (%)
Sexual Behavior - Females 18+ that ever had any kind of sex with a woman (%)
Sexual Behavior - Average age people first had sex
Sexual Behavior - Average number of female sex partners in lifetime (males 18+)
Sexual Behavior - Average number of female vaginal sex partners in lifetime (males 18+)
Sexual Behavior - Average age people first performed oral sex on a woman (18+)
Sexual Behavior - Average number of woman performed oral sex on in lifetime (18+)
Sexual Behavior - Average number of male sex partners in lifetime (males 18+)
Sexual Behavior - Average number of male anal sex partners in lifetime (males 18+)
Sexual Behavior - Average age people first performed oral sex on a man (18+)
Sexual Behavior - Average number of male oral sex partners in lifetime (18+)
Sexual Behavior - People using protection when performing oral sex (%)
Sexual Behavior - Average number of times people have vaginal or anal sex a year
Sexual Behavior - People having sex without condom (%)
Sexual Behavior - Average number of male sex partners in lifetime (females 18+)
Sexual Behavior - Average number of male vaginal sex partners in lifetime (females 18+)
Sexual Behavior - Average number of female sex partners in lifetime (females 18+)
Sexual Behavior - Circumcised males 18+ (%)
Sleep Disorders - Average hours sleeping at night
Sleep Disorders - People that has trouble sleeping (%)
Smoking-Cigarette Use - People smoking cigarettes (%)
Taste & Smell - People 40+ having problems with smell (%)
Taste & Smell - People 40+ having problems with taste (%)
Taste & Smell - People 40+ that ever had wisdom teeth removed (%)
Taste & Smell - People 40+ that ever had tonsils teeth removed (%)
Taste & Smell - People 40+ that ever had a loss of consciousness because of a head injury (%)
Taste & Smell - People 40+ that ever had a broken nose or other serious injury to face or skull (%)
Taste & Smell - People 40+ that ever had two or more sinus infections (%)
Weight - Average height (inches)
Weight - Average weight (pounds)
Weight - Average BMI
Weight - People that are obese (%)
Weight - People that ever were obese (%)
Weight - People trying to lose weight (%)
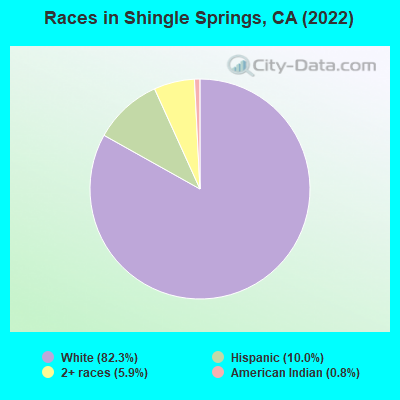
3,061 82.3% White alone 371 10.0% Hispanic 218 5.9% Two or more races 28 0.8% American Indian alone
Latest news from Shingle Springs, CA collected exclusively by city-data.com from local newspapers, TV, and radio stations
Ancestries: European (10.5%), German (9.1%), American (9.0%), Scandinavian (5.8%), Irish (5.5%), English (4.9%).
Current Local Time:
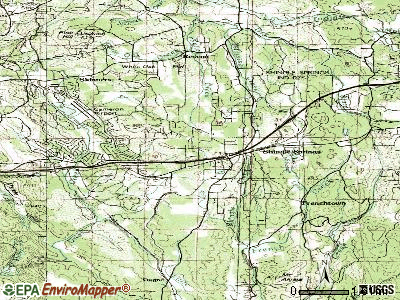
Land area: 5.21 square miles.
Population density: 851 people per square mile (low).
125 residents are foreign born (2.8% Latin America , 0.5% North America ).
This place:
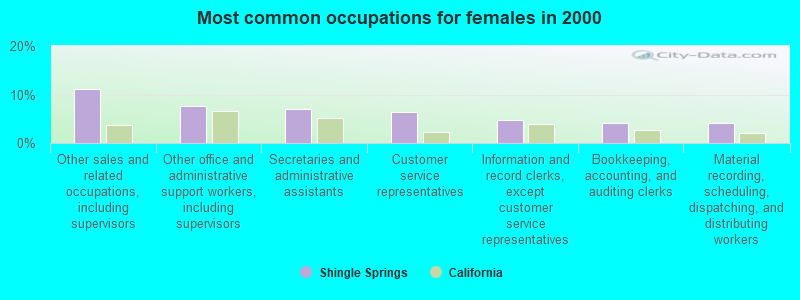
3.4%California:
26.5%
Median real estate property taxes paid for housing units with mortgages in 2022: $4,722 (0.6%)Median real estate property taxes paid for housing units with no mortgage in 2022: $2,991 (0.5%)
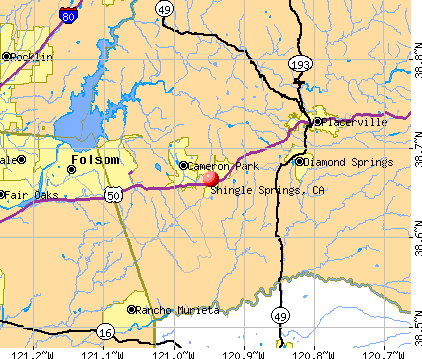
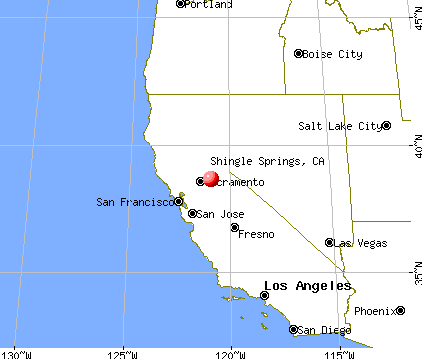
Nearest city with pop. 50,000+: Folsom, CA
Nearest city with pop. 200,000+: Sacramento, CA
Nearest city with pop. 1,000,000+: Los Angeles, CA
Nearest cities:
Latitude: 38.67 N, Longitude: 120.95 W
Unemployment in December 2023:
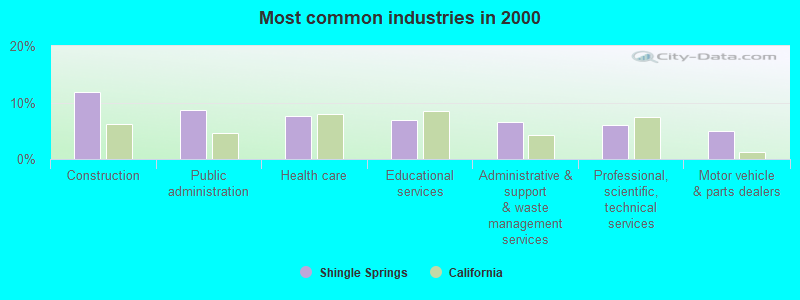
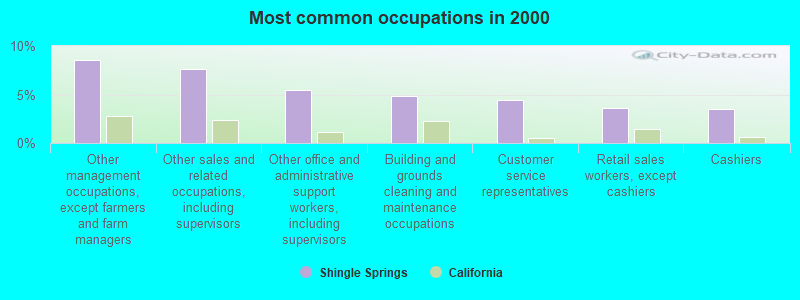
Most common occupations in Shingle Springs, CA (%)
Both Males Females
Other management occupations, except farmers and farm managers (8.5%)
Other sales and related occupations, including supervisors (7.7%)
Other office and administrative support workers, including supervisors (5.5%)
Building and grounds cleaning and maintenance occupations (4.8%)
Customer service representatives (4.4%)
Retail sales workers, except cashiers (3.6%)
Cashiers (3.5%)
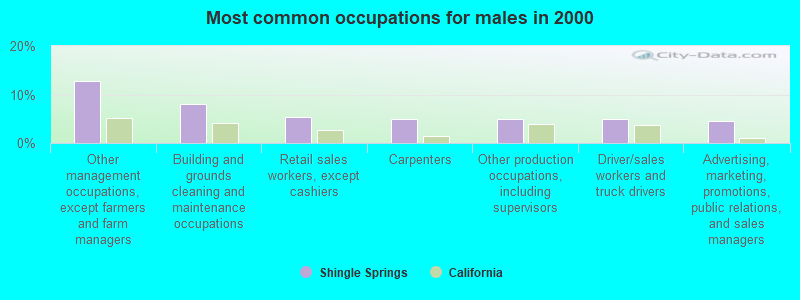
Other management occupations, except farmers and farm managers (12.7%)
Building and grounds cleaning and maintenance occupations (8.1%)
Retail sales workers, except cashiers (5.4%)
Carpenters (4.9%)
Other production occupations, including supervisors (4.9%)
Driver/sales workers and truck drivers (4.9%)
Advertising, marketing, promotions, public relations, and sales managers (4.5%)
Other sales and related occupations, including supervisors (11.1%)
Other office and administrative support workers, including supervisors (7.7%)
Secretaries and administrative assistants (7.1%)
Customer service representatives (6.4%)
Information and record clerks, except customer service representatives (4.7%)
Bookkeeping, accounting, and auditing clerks (4.2%)
Material recording, scheduling, dispatching, and distributing workers (4.2%)
Earthquake activity:
Shingle Springs-area historical earthquake activity is significantly above California state average. It is 7670% greater than the overall U.S. average. On 4/18/1906 at 13:12:21, a magnitude 7.9 (7.9 UK, Class: Major, Intensity: VIII - XII) earthquake occurred 120.5 miles away from the city center, causing $524,000,000 total damage On 10/3/1915 at 06:52:48, a magnitude 7.6 (7.6 UK) earthquake occurred 223.3 miles away from Shingle Springs center On 10/18/1989 at 00:04:15, a magnitude 7.1 (6.5 MB, 7.1 MS, 6.9 MW, 7.0 ML) earthquake occurred 116.6 miles away from the city center, causing 62 deaths ( 62 shaking deaths) and 3757 injuries, causing $1,305,032,704 total damage On 12/21/1932 at 06:10:09, a magnitude 7.2 (7.2 UK) earthquake occurred 155.2 miles away from the city center On 7/21/1952 at 11:52:14, a magnitude 7.7 (7.7 UK) earthquake occurred 275.5 miles away from the city center, causing $50,000,000 total damage On 11/4/1927 at 13:51:53, a magnitude 7.5 (7.5 UK) earthquake occurred 259.4 miles away from the city center Magnitude types: body-wave magnitude (MB), local magnitude (ML), surface-wave magnitude (MS), moment magnitude (MW) Natural disasters: The number of natural disasters in El Dorado County (17) is near the US average (15).Major Disasters (Presidential) Declared: 8Emergencies Declared: 2Floods: 12, Mudslides: 6, Winter Storms: 6, Landslides: 5, Storms: 5, Fires: 2, Drought: 1, Heavy Rain: 1, Hurricane: 1, Other: 1 (Note: some incidents may be assigned to more than one category). Hospitals and medical centers near Shingle Springs: CAMERON PARK DIALYSIS (Dialysis Facility, about 2 miles away; CAMERON PARK, CA)
SNOWLINE HOSPICE OF EL DORADO, INC (Hospital, about 7 miles away; DIAMOND SPRINGS, CA)
GOLD COUNTRY HEALTH CENTER (Nursing Home, about 8 miles away; PLACERVILLE, CA)
ACTION HOME NRSG SRVS (Home Health Center, about 8 miles away; EL DORADO HILLS, CA)
THE PINES AT PLACERVILLE HEALTHCARE CENTER (Nursing Home, about 10 miles away; PLACERVILLE, CA)
MARSHALL MEDICAL CENTER (1-RH) (about 10 miles away; PLACERVILLE, CA)
WESTERN SLOPE HEALTH CENTER (Nursing Home, about 10 miles away; PLACERVILLE, CA)
Amtrak stations near Shingle Springs: 2 miles: CAMERON PARK (US HWY. 50 & CAMERON PARK DR.) - Bus Station Services: fully wheelchair accessible, enclosed waiting area, public restrooms, public payphones, full-service food facilities, free short-term parking.
9 miles: PLACERVILLE (222 MAIN ST.) - Bus Station Services: fully wheelchair accessible, public payphones, full-service food facilities, free short-term parking, call for taxi service.
18 miles: ROCKLIN (ROCKLIN RD. & RAILROAD AVE.) - Bus Station Services: partially wheelchair accessible, free short-term parking.
Colleges/universities with over 2000 students nearest to Shingle Springs:
Folsom Lake College (about 10 miles; Folsom, CA ; Full-time enrollment: 5,308)
Sierra College (about 17 miles; Rocklin, CA ; FT enrollment: 11,488)
American River College (about 22 miles; Sacramento, CA ; FT enrollment: 20,452)
California State University-Sacramento (about 27 miles; Sacramento, CA ; FT enrollment: 22,234)
Cosumnes River College (about 30 miles; Sacramento, CA ; FT enrollment: 9,327)
Sacramento City College (about 31 miles; Sacramento, CA ; FT enrollment: 15,963)
University of Phoenix-Sacramento Valley Campus (about 32 miles; Sacramento, CA ; FT enrollment: 2,855)
Public high school in Shingle Springs: PONDEROSA HIGH Students: 1,355, Location: 3661 PONDEROSA RD., Grades: 9-12)Public elementary/middle schools in Shingle Springs: BUCKEYE ELEMENTARY Students: 289, Location: 4561 BUCKEYE RD., Grades: KG-5)MILLER'S HILL Students: 96, Location: 7900 S. SHINGLE RD., Grades: 4-8)LATROBE ELEMENTARY Students: 40, Location: 7680 S. SHINGLE RD., Grades: KG-3)CALIFORNIA MONTESSORI PROJECT-SHINGLE SPRINGS CAMP Location: 4645 BUCKEYE RD., Grades: KG-8, Charter school )
See full list of schools located in Shingle Springs El Dorado County has a predicted average indoor radon screening level between 2 and 4 pCi/L (pico curies per liter) - Moderate Potential Drinking water stations with addresses in Shingle Springs and their reported violations in the past:
GOLD COUNTRY BAPTIST CHURCH (Population served: 275, Groundwater):
Past monitoring violations:
One regular monitoring violation
Drinking water stations with addresses in Shingle Springs that have no violations reported:
KIT CARSON LODGE (Population served: 3,000, Primary Water Source Type: Groundwater)
Average household size: This place:
2.7 peopleCalifornia:
2.9 people
Percentage of family households: This place:
76.9%Whole state:
68.7%
Percentage of households with unmarried partners: This place:
5.4%Whole state:
7.2%
Likely homosexual households (counted as self-reported same-sex unmarried-partner households)
Lesbian couples: 0.4% of all households Gay men: 0.3% of all households
82 people in other noninstitutional facilities in 2010people in emergency and transitional shelters (with sleeping facilities) for people experiencing homelessness in 2010people in other noninstitutional group quarters in 2000
Banks with branches in Shingle Springs (2011 data):
Bank of America, National Association: Cameron Park Branch at 4070 Cameron Park Drive, branch established on 1973/08/20. Info updated 2009/11/18: Bank assets: $1,451,969.3 mil, Deposits: $1,077,176.8 mil, headquarters in Charlotte, NC, positive income , 5782 total offices , Holding Company: Bank Of America Corporation
El Dorado Savings Bank, F.S.B.: Cameron Park Branch at 4060 Cameron Park Dr, branch established on 1986/06/30. Info updated 2011/07/21: Bank assets: $1,706.7 mil, Deposits: $1,536.5 mil, headquarters in Placerville, CA, positive income , Mortgage Lending Specialization, 35 total offices
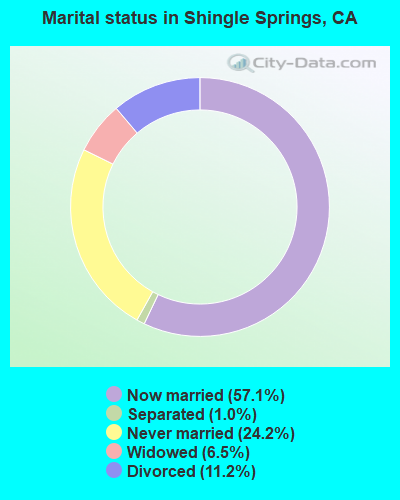
For population 15 years and over in Shingle Springs:
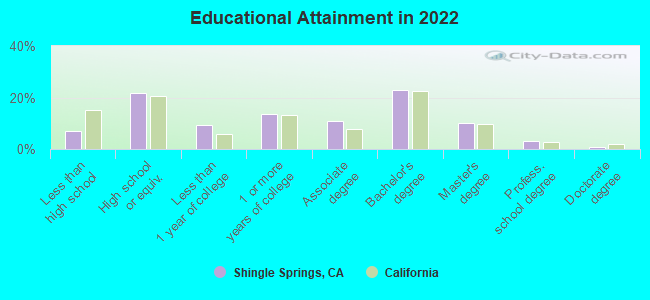
Never married: 24.2%Now married: 57.1%Separated: 1.0%Widowed: 6.5%Divorced: 11.2% For population 25 years and over in Shingle Springs:
High school or higher: 93.0%Bachelor's degree or higher: 36.1%Graduate or professional degree: 12.2%Unemployed: 3.9%Mean travel time to work (commute): 27.3 minutes
Education Gini index (Inequality in education) Here:
9.2California average:
15.5
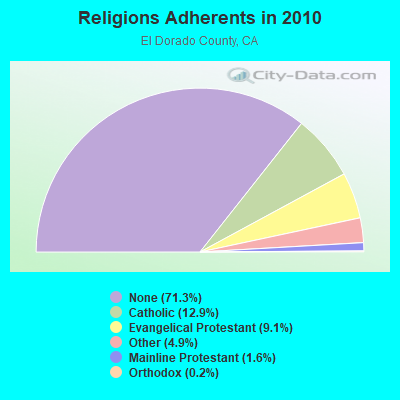
Religion statistics for Shingle Springs, CA (based on El Dorado County data)
Religion Adherents Congregations Catholic 23,298 6 Evangelical Protestant 16,538 69 Other 8,928 30 Mainline Protestant 2,937 11 Orthodox 315 2 None 129,042 -
Source: Clifford Grammich, Kirk Hadaway, Richard Houseal, Dale E.Jones, Alexei Krindatch, Richie Stanley and Richard H.Taylor. 2012. 2010 U.S.Religion Census: Religious Congregations & Membership Study. Association of Statisticians of American Religious Bodies. Jones, Dale E., et al. 2002. Congregations and Membership in the United States 2000. Nashville, TN: Glenmary Research Center. Graphs represent county-level data
Food Environment Statistics: Number of grocery stores : 33El Dorado County :
1.88 / 10,000 pop.California :
2.14 / 10,000 pop.
Number of supercenters and club stores : 1El Dorado County :
0.06 / 10,000 pop.California :
0.04 / 10,000 pop.
Number of convenience stores (no gas) : 17El Dorado County :
0.97 / 10,000 pop.State :
0.62 / 10,000 pop.
Number of convenience stores (with gas) : 40This county :
2.28 / 10,000 pop.State :
1.49 / 10,000 pop.
Number of full-service restaurants : 173El Dorado County :
9.87 / 10,000 pop.California :
7.42 / 10,000 pop.
Adult diabetes rate : This county :
6.7%California :
7.3%
Adult obesity rate : Here :
19.9%California :
21.3%
Low-income preschool obesity rate : El Dorado County :
13.1%State :
17.9%
Health and Nutrition: Healthy diet rate : This city:
50.4%State:
49.4%
Average overall health of teeth and gums : Shingle Springs:
48.0%California:
48.0%
People feeling badly about themselves : This city:
23.7%California:
20.2%
People not drinking alcohol at all : Shingle Springs:
9.6%California:
11.2%
Average hours sleeping at night : Shingle Springs:
6.9California:
6.8
Overweight people : Here:
34.4%California:
31.5%
General health condition : This city:
56.2%California:
56.4%
Average condition of hearing : Here:
77.8%California:
80.9%
More about Health and Nutrition of Shingle Springs, CA Residents
Businesses in Shingle Springs, CA
Name Count Name Count
Applebee's 1 Nissan 1 CVS 2 Subaru 1 Honda 1 Subway 1 New Balance 1 U-Haul 1
Strongest AM radio stations in Shingle Springs:
KHTK (1140 AM; 50 kW; SACRAMENTO, CA; Owner: INFINITY RADIO SUBSIDIARY OPERATIONS INC.)
KSTE (650 AM; 25 kW; RANCHO CORDOVA, CA; Owner: AMFM RADIO LICENSES, L.L.C.)
KFIA (710 AM; 25 kW; CARMICHAEL, CA; Owner: VISTA BROADCASTING INC.)
KAHI (950 AM; 10 kW; AUBURN, CA; Owner: IHR EDUCATIONAL BROADCASTING)
KLIB (1110 AM; 10 kW; ROSEVILLE, CA; Owner: WAY BROADCASTING, INC.)
KFBK (1530 AM; 50 kW; SACRAMENTO, CA; Owner: AMFM RADIO LICENSES, L.L.C.)
KFSG (1690 AM; 10 kW; ROSEVILLE, CA; Owner: WAY BROADCASTING, INC.)
KCBC (770 AM; 50 kW; RIVERBANK, CA; Owner: KIERTRON, INC.)
KTKZ (1380 AM; 5 kW; SACRAMENTO, CA; Owner: VISTA BROADCASTING, INC.)
KEBR (1210 AM; 5 kW; ROCKLIN, CA; Owner: FAMILY STATIONS, INC.)
KSMH (1620 AM; 10 kW; WEST SACRAMENTO, CA; Owner: IHR EDUCATIONAL BROADCASTING)
KCBS (740 AM; 50 kW; SAN FRANCISCO, CA; Owner: INFINITY BROADCASTING OPERATIONS, INC.)
KKOH (780 AM; 50 kW; RENO, NV; Owner: CITADEL BROADCASTING COMPANY)
Strongest FM radio stations in Shingle Springs:
KCCL-FM (101.9 FM; SHINGLE SPRINGS, CA; Owner: ENTRAVISION HOLDINGS, LLC)
KNCI (105.1 FM; SACRAMENTO, CA; Owner: INFINITY RADIO SUBSIDIARY OPERATIONS INC.)
KRXQ (98.5 FM; SACRAMENTO, CA; Owner: ENTERCOM SACRAMENTO LICENSE, LLC)
K256AG (99.1 FM; CLARKSVILLE, CA; Owner: EDUCATIONAL MEDIA FOUNDATION)
KWOD (106.5 FM; SACRAMENTO, CA; Owner: ENTERCOM SACRAMENTO LICENSE, LLC)
KZSA (92.1 FM; PLACERVILLE, CA; Owner: FIRST BROADCASTING INVESTMENTS, L.P.)
KEDR (88.1 FM; SACRAMENTO, CA; Owner: FAMILY STATIONS, INC.)
KZZO (100.5 FM; SACRAMENTO, CA; Owner: INFINITY RADIO OPERATIONS INC.)
KXCL (103.9 FM; YUBA CITY, CA; Owner: HARLAN COMMUNICATIONS, INC.)
KHYL (101.1 FM; AUBURN, CA; Owner: AMFM RADIO LICENSES, L.L.C.)
KOSL (94.3 FM; JACKSON, CA; Owner: HBC LICENSE CORPORATION)
KWYL (102.9 FM; SOUTH LAKE TAHOE, CA; Owner: CITADEL BROADCASTING COMPANY)
KKSF-FM1 (103.7 FM; PLEASANTON, ETC., CA; Owner: AMFM RADIO LICENSES, L.L.C.)
KTHX-FM (100.1 FM; DAYTON, NV; Owner: NM LICENSING, LLC)
KRNO (106.9 FM; INCLINE VILLAGE, NV; Owner: AMERICOM LAS VEGAS LIMITED PARTNERSHIP)
KODS (103.7 FM; CARNELIAN BAY, CA; Owner: AMERICOM, A CALIFORNIA LIMITED PARTNERSHIP)
KLCA (96.5 FM; TAHOE CITY, CA; Owner: AMERICOM LAS VEGAS LIMITED PARTNERSHIP)
KKTO (90.5 FM; TAHOE CITY, CA; Owner: CALIFORNIA STATE UNIVERSITY)
KDOT (104.5 FM; RENO, NV; Owner: LOTUS RADIO CORP.)
KOZZ-FM (105.7 FM; RENO, NV; Owner: LOTUS RADIO CORP.)
TV broadcast stations around Shingle Springs:
KMMK-LP (Channel 14; SACRAMENTO, CA; Owner: CABALLERO TELEVISION TEXAS, L.L.C.)
KGTN-LP (Channel 62; PLACERVILLE, CA; Owner: PRAISE THE LORD STUDIO CHAPEL)
KEZT-CA (Channel 23; SACRAMENTO, CA; Owner: TELEFUTURA SACRAMENTO LLC)
KSPX (Channel 29; SACRAMENTO, CA; Owner: PAXSON SACRAMENTO LICENSE, INC.)
KTXL (Channel 40; SACRAMENTO, CA; Owner: CHANNEL 40, INC.)
KQCA (Channel 58; STOCKTON, CA; Owner: KCRA HEARST-ARGYLE TELEVISION, INC.)
KCRA-TV (Channel 3; SACRAMENTO, CA; Owner: KCRA HEARST-ARGYLE TELEVISION, INC.)
KOVR (Channel 13; STOCKTON, CA; Owner: SCI - SACRAMENTO LICENSEE, LLC)
KXTV (Channel 10; SACRAMENTO, CA; Owner: KXTV, INC.)
KUVS (Channel 19; MODESTO, CA; Owner: KUVS LICENSE PARTNERSHIP, G.P.)
KVIE (Channel 6; SACRAMENTO, CA; Owner: KVIE, INC.)
KMAX-TV (Channel 31; SACRAMENTO, CA; Owner: UPN STATIONS GROUP INC.)
K22FR (Channel 22; SACRAMENTO, CA; Owner: NATIONAL MINORITY T.V., INC.)
K27EU (Channel 27; SACRAMENTO, CA; Owner: ABUNDANT LIFE BROADCASTING, INC.)
K69FB (Channel 69; SACRAMENTO, CA; Owner: TRINITY BROADCASTING NETWORK)
K17EH (Channel 17; EUREKA, CA; Owner: MS COMMUNICATIONS, LLC)
KCSO-LP (Channel 33; SACRAMENTO, CA; Owner: SAINTE 51, L.P.)
KSAO-LP (Channel 49; SACRAMENTO, CA; Owner: GARY M. COCOLA FAMILY TRUST, GARY M. COCOLA TRUSTEE)
KBTV-LP (Channel 8; SACRAMENTO, CA; Owner: INCISOR COMMUNICATIONS, L.L.C.)
KMUM-CA (Channel 15; SACRAMENTO, CA; Owner: CABALLERO TELEVISION TEXAS, L.L.C.)
K27FX (Channel 27; EUREKA, CA; Owner: MS COMMUNICATIONS, LLC)
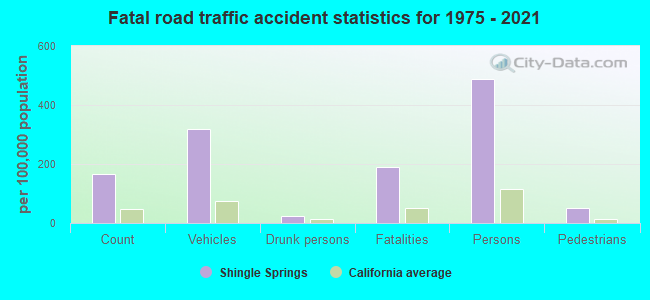
Shingle Springs fatal accident statistics for 1975 - 2021
Shingle Springs fatal accident list:
Oct 29, 2021 04:38 PM, Durock Rd, Pin Ln, Lat: 38.657425, Lon: -120.952422, Vehicles: 2, Persons: 2, Fatalities: 1Lat: 38.684417, Lon: -120.928994, Vehicles: 1, Persons: 2, Fatalities: 1, Drunk persons involved: 1Lat: 38.661325, Lon: -120.942903, Vehicles: 3, Persons: 4, Pedestrians: 1, Fatalities: 1Lat: 38.674794, Lon: -120.920800, Vehicles: 1, Persons: 2, Fatalities: 1Lat: 38.667453, Lon: -120.928411, Vehicles: 1, Persons: 1, Fatalities: 1Lat: 38.663740, Lon: -120.935050, Vehicles: 1, Persons: 4, Fatalities: 2Lat: 38.664170, Lon: -120.930670, Vehicles: 4, Persons: 5, Pedestrians: 1, Fatalities: 1
FCC Registered Cell Phone Towers: 2 (
See the full list of FCC Registered Cell Phone Towers in Shingle Springs )
FCC Registered Antenna Towers: 180 (
See the full list of FCC Registered Antenna Towers )
FCC Registered Private Land Mobile Towers: 2
Pine Hill (Lat: 38.719444 Lon: -120.990556), Type: Tower, Structure height: 50 m, Call Sign: WNXM919, Assigned Frequencies: 929.112 MHz, Grant Date: 08/24/1999, Expiration Date: 08/24/2009, Cancellation Date: 12/22/2008, Certifier: Shawn E Endsley, Registrant: Usa Mobility Wireless, Inc., 300 Technology Drive #400, Plano, TX 75074, Phone: (972) 801-1626, Fax: (972) 801-1699, Email:
Pine Hill (Lat: 38.719333 Lon: -120.990500), Type: Tower, Structure height: 50 m, Call Sign: WPHI484, Assigned Frequencies: 929.862 MHz, Grant Date: 07/24/2000, Expiration Date: 07/24/2010, Cancellation Date: 07/09/2001, Certifier: Donna Comer, Registrant: Paging Network Of San Francisco Inc, 1500 International Pkwy, Suite 300, Richardson, TX 75081, Phone: (972) 801-0304, Fax: (972) 801-0330 FCC Registered Broadcast Land Mobile Towers: 3
Cdf Weather Telem Sta 4.5 Mi S (Lat: 38.601306 Lon: -120.930778), Structure height: 2 m, Call Sign: WPBJ541, Licensee ID: L00009514, Assigned Frequencies: 151.190 MHz, 159.225 MHz, Grant Date: 10/24/2002, Expiration Date: 12/23/2012, Cancellation Date: 07/23/2009, Registrant: State Of California, 601 Sequoia Pacific Blvd, Sacramento, CA 95814-0282, Phone: (916) 657-9999 2.5 Mi Nw (Lat: 38.671861 Lon: -120.978278), Type: Building, Structure height: 6 m, Call Sign: WNLW755, Assigned Frequencies: 173.396 MHz, Grant Date: 03/08/2023, Expiration Date: 06/03/2033, Registrant: El Dorado Irrigation District, 2890 Mosquito Rd, Placerville, CA 95667, Phone: (530) 642-4087, Email:
MOB, Lat: 38.669694 Lon: -120.909361, Call Sign: WRAB805, Assigned Frequencies: 452.412 MHz, 452.712 MHz, 452.787 MHz, 452.812 MHz, 452.837 MHz, Grant Date: 10/03/2017, Expiration Date: 10/03/2027, Certifier: Jacqueere Murray, Registrant: Bearcom Operating LLC, Dallas, TX 75355-9001, Phone: (800) 458-9887, Email:
FCC Registered Microwave Towers: 10 (
See the full list of FCC Registered Microwave Towers in this town )
FCC Registered Paging Towers: 3 (
See the full list of FCC Registered Paging Towers )
FCC Registered Amateur Radio Licenses: 234 (
See the full list of FCC Registered Amateur Radio Licenses in Shingle Springs )
FAA Registered Aircraft Manufacturers and Dealers: 7 (
See the full list of FAA Registered Manufacturers and Dealers in Shingle Springs )
FAA Registered Aircraft: 22 (
See the full list of FAA Registered Aircraft )
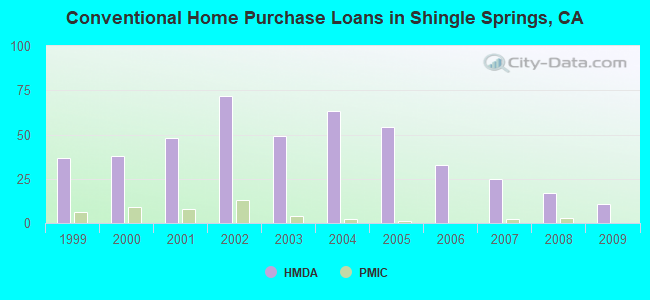
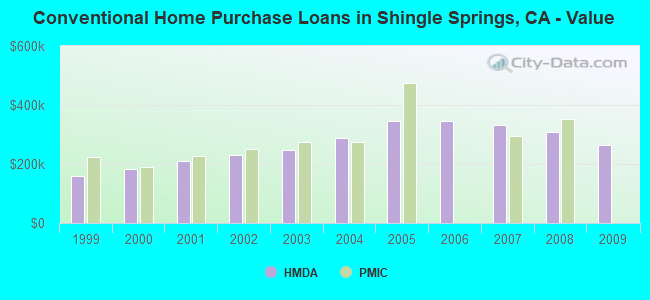
Home Mortgage Disclosure Act Aggregated Statistics For Year 2009(Based on 1 partial tract) A) FHA, FSA/RHS & VA B) Conventional C) Refinancings D) Home Improvement Loans F) Non-occupant Loans on G) Loans On Manufactured Number Average Value Number Average Value Number Average Value Number Average Value Number Average Value Number Average Value
LOANS ORIGINATED 7 $318,284 11 $263,409 77 $272,203 2 $239,185 3 $247,627 0 $0 APPLICATIONS APPROVED, NOT ACCEPTED 2 $278,170 1 $388,880 10 $269,879 0 $0 1 $144,760 0 $0 APPLICATIONS DENIED 2 $239,345 3 $157,810 26 $338,377 2 $136,535 2 $177,165 1 $23,360 APPLICATIONS WITHDRAWN 0 $0 3 $301,363 13 $300,225 2 $246,585 1 $226,020 0 $0 FILES CLOSED FOR INCOMPLETENESS 0 $0 0 $0 2 $377,525 0 $0 0 $0 0 $0
Aggregated Statistics For Year 2008(Based on 1 partial tract) A) FHA, FSA/RHS & VA B) Conventional C) Refinancings D) Home Improvement Loans F) Non-occupant Loans on G) Loans On Manufactured Number Average Value Number Average Value Number Average Value Number Average Value Number Average Value Number Average Value
LOANS ORIGINATED 2 $396,115 17 $307,634 41 $288,372 6 $120,030 6 $248,450 1 $95,740 APPLICATIONS APPROVED, NOT ACCEPTED 0 $0 2 $186,545 6 $346,108 1 $228,330 1 $296,760 1 $58,890 APPLICATIONS DENIED 1 $449,740 3 $341,173 20 $348,280 3 $91,680 2 $316,825 1 $179,630 APPLICATIONS WITHDRAWN 1 $119,430 1 $461,920 9 $343,073 2 $253,000 1 $197,400 0 $0 FILES CLOSED FOR INCOMPLETENESS 0 $0 1 $333,280 3 $283,160 1 $152,000 0 $0 0 $0
Aggregated Statistics For Year 2007(Based on 1 partial tract) B) Conventional C) Refinancings D) Home Improvement Loans E) Loans on Dwellings For 5+ Families F) Non-occupant Loans on G) Loans On Manufactured Number Average Value Number Average Value Number Average Value Number Average Value Number Average Value Number Average Value
LOANS ORIGINATED 25 $332,803 55 $317,880 9 $151,522 1 $431,980 5 $326,434 3 $121,840 APPLICATIONS APPROVED, NOT ACCEPTED 8 $309,589 12 $318,664 5 $93,568 0 $0 2 $323,735 1 $152,330 APPLICATIONS DENIED 7 $285,807 23 $326,740 7 $231,193 0 $0 2 $343,805 2 $146,075 APPLICATIONS WITHDRAWN 2 $265,340 14 $334,992 3 $294,453 0 $0 0 $0 0 $0 FILES CLOSED FOR INCOMPLETENESS 2 $248,230 5 $396,972 1 $326,700 0 $0 0 $0 0 $0
Aggregated Statistics For Year 2006(Based on 1 partial tract) B) Conventional C) Refinancings D) Home Improvement Loans F) Non-occupant Loans on G) Loans On Manufactured Number Average Value Number Average Value Number Average Value Number Average Value Number Average Value
LOANS ORIGINATED 33 $345,998 82 $334,136 16 $139,023 7 $337,507 2 $106,595 APPLICATIONS APPROVED, NOT ACCEPTED 4 $339,528 11 $349,727 3 $141,690 1 $481,660 0 $0 APPLICATIONS DENIED 7 $307,051 25 $337,554 5 $224,576 3 $357,403 3 $180,840 APPLICATIONS WITHDRAWN 6 $442,122 20 $407,927 2 $184,240 0 $0 1 $126,010 FILES CLOSED FOR INCOMPLETENESS 0 $0 4 $286,560 1 $64,150 0 $0 0 $0
Aggregated Statistics For Year 2005(Based on 1 partial tract) B) Conventional C) Refinancings D) Home Improvement Loans F) Non-occupant Loans on G) Loans On Manufactured Number Average Value Number Average Value Number Average Value Number Average Value Number Average Value
LOANS ORIGINATED 54 $345,322 107 $336,659 22 $141,320 9 $313,720 1 $170,420 APPLICATIONS APPROVED, NOT ACCEPTED 9 $251,210 10 $292,514 3 $35,970 1 $338,540 2 $63,825 APPLICATIONS DENIED 8 $258,511 36 $339,802 12 $140,510 2 $286,560 5 $193,122 APPLICATIONS WITHDRAWN 7 $381,734 28 $303,021 5 $185,688 1 $220,430 1 $285,240 FILES CLOSED FOR INCOMPLETENESS 1 $257,940 6 $343,860 1 $456,320 0 $0 0 $0
Aggregated Statistics For Year 2004(Based on 1 partial tract) B) Conventional C) Refinancings D) Home Improvement Loans F) Non-occupant Loans on G) Loans On Manufactured Number Average Value Number Average Value Number Average Value Number Average Value Number Average Value
LOANS ORIGINATED 63 $289,499 120 $272,475 15 $154,257 10 $243,986 3 $160,553 APPLICATIONS APPROVED, NOT ACCEPTED 8 $284,750 15 $248,241 3 $88,940 0 $0 1 $106,270 APPLICATIONS DENIED 10 $228,655 31 $275,925 5 $118,440 3 $181,280 2 $97,550 APPLICATIONS WITHDRAWN 9 $287,692 27 $321,628 3 $121,840 2 $212,865 0 $0 FILES CLOSED FOR INCOMPLETENESS 1 $121,400 9 $272,741 1 $164,500 0 $0 0 $0
Aggregated Statistics For Year 2003(Based on 1 partial tract) A) FHA, FSA/RHS & VA B) Conventional C) Refinancings D) Home Improvement Loans E) Loans on Dwellings For 5+ Families F) Non-occupant Loans on Number Average Value Number Average Value Number Average Value Number Average Value Number Average Value Number Average Value
LOANS ORIGINATED 1 $251,030 49 $248,187 255 $221,808 12 $62,894 1 $1,821,670 10 $238,722 APPLICATIONS APPROVED, NOT ACCEPTED 0 $0 6 $180,073 28 $230,770 4 $43,428 0 $0 2 $154,960 APPLICATIONS DENIED 0 $0 4 $263,118 43 $241,012 6 $47,322 0 $0 4 $240,828 APPLICATIONS WITHDRAWN 1 $12,500 6 $220,703 43 $213,773 1 $51,980 0 $0 1 $179,300 FILES CLOSED FOR INCOMPLETENESS 0 $0 2 $220,925 7 $267,430 0 $0 0 $0 0 $0
Aggregated Statistics For Year 2002(Based on 1 partial tract) A) FHA, FSA/RHS & VA B) Conventional C) Refinancings D) Home Improvement Loans E) Loans on Dwellings For 5+ Families F) Non-occupant Loans on Number Average Value Number Average Value Number Average Value Number Average Value Number Average Value Number Average Value
LOANS ORIGINATED 4 $238,360 72 $230,835 160 $202,771 11 $55,123 1 $866,260 7 $208,727 APPLICATIONS APPROVED, NOT ACCEPTED 1 $166,140 10 $204,375 18 $214,179 2 $37,670 0 $0 2 $153,805 APPLICATIONS DENIED 1 $128,640 5 $186,806 31 $198,748 8 $32,324 0 $0 1 $258,590 APPLICATIONS WITHDRAWN 0 $0 4 $209,902 26 $217,937 3 $76,217 0 $0 0 $0 FILES CLOSED FOR INCOMPLETENESS 0 $0 0 $0 5 $279,386 0 $0 0 $0 0 $0
Aggregated Statistics For Year 2001(Based on 1 partial tract) A) FHA, FSA/RHS & VA B) Conventional C) Refinancings D) Home Improvement Loans F) Non-occupant Loans on Number Average Value Number Average Value Number Average Value Number Average Value Number Average Value
LOANS ORIGINATED 2 $149,035 48 $211,273 116 $183,012 8 $44,826 8 $170,998 APPLICATIONS APPROVED, NOT ACCEPTED 0 $0 7 $175,074 10 $176,278 1 $47,050 1 $197,070 APPLICATIONS DENIED 0 $0 5 $148,642 23 $143,501 4 $34,792 1 $19,080 APPLICATIONS WITHDRAWN 0 $0 6 $190,820 20 $181,032 2 $57,410 1 $123,050 FILES CLOSED FOR INCOMPLETENESS 0 $0 3 $160,443 4 $228,242 2 $33,885 0 $0
Aggregated Statistics For Year 2000(Based on 1 partial tract) A) FHA, FSA/RHS & VA B) Conventional C) Refinancings D) Home Improvement Loans F) Non-occupant Loans on Number Average Value Number Average Value Number Average Value Number Average Value Number Average Value
LOANS ORIGINATED 3 $189,943 38 $181,851 23 $135,448 5 $44,612 2 $210,065 APPLICATIONS APPROVED, NOT ACCEPTED 0 $0 3 $165,047 3 $119,427 2 $48,365 0 $0 APPLICATIONS DENIED 0 $0 7 $213,521 13 $158,628 5 $55,074 0 $0 APPLICATIONS WITHDRAWN 0 $0 4 $257,525 8 $153,355 1 $14,150 0 $0 FILES CLOSED FOR INCOMPLETENESS 0 $0 1 $144,430 2 $199,045 0 $0 0 $0
Aggregated Statistics For Year 1999(Based on 1 partial tract) A) FHA, FSA/RHS & VA B) Conventional C) Refinancings D) Home Improvement Loans F) Non-occupant Loans on Number Average Value Number Average Value Number Average Value Number Average Value Number Average Value
LOANS ORIGINATED 5 $164,996 37 $159,181 43 $146,913 8 $33,118 2 $178,210 APPLICATIONS APPROVED, NOT ACCEPTED 0 $0 6 $154,098 12 $133,346 2 $46,075 1 $105,370 APPLICATIONS DENIED 1 $224,960 6 $170,642 17 $127,927 4 $27,528 1 $174,820 APPLICATIONS WITHDRAWN 0 $0 3 $129,420 11 $154,493 0 $0 1 $85,380 FILES CLOSED FOR INCOMPLETENESS 0 $0 1 $204,640 1 $177,870 0 $0 0 $0
Detailed HMDA statistics for the following Tracts:
0308.03
Private Mortgage Insurance Companies Aggregated Statistics For Year 2008(Based on 1 partial tract) A) Conventional B) Refinancings Number Average Value Number Average Value
LOANS ORIGINATED 3 $351,373 0 $0 APPLICATIONS APPROVED, NOT ACCEPTED 1 $261,880 1 $265,500 APPLICATIONS DENIED 0 $0 0 $0 APPLICATIONS WITHDRAWN 0 $0 0 $0 FILES CLOSED FOR INCOMPLETENESS 0 $0 0 $0
Aggregated Statistics For Year 2007(Based on 1 partial tract) A) Conventional B) Refinancings Number Average Value Number Average Value
LOANS ORIGINATED 2 $296,430 2 $522,780 APPLICATIONS APPROVED, NOT ACCEPTED 0 $0 0 $0 APPLICATIONS DENIED 0 $0 0 $0 APPLICATIONS WITHDRAWN 0 $0 0 $0 FILES CLOSED FOR INCOMPLETENESS 0 $0 0 $0
Aggregated Statistics For Year 2005(Based on 1 partial tract) A) Conventional B) Refinancings Number Average Value Number Average Value
LOANS ORIGINATED 1 $474,090 1 $266,490 APPLICATIONS APPROVED, NOT ACCEPTED 0 $0 0 $0 APPLICATIONS DENIED 0 $0 0 $0 APPLICATIONS WITHDRAWN 0 $0 0 $0 FILES CLOSED FOR INCOMPLETENESS 0 $0 0 $0
Aggregated Statistics For Year 2004(Based on 1 partial tract) A) Conventional B) Refinancings Number Average Value Number Average Value
LOANS ORIGINATED 2 $275,375 0 $0 APPLICATIONS APPROVED, NOT ACCEPTED 0 $0 1 $195,100 APPLICATIONS DENIED 0 $0 0 $0 APPLICATIONS WITHDRAWN 0 $0 0 $0 FILES CLOSED FOR INCOMPLETENESS 0 $0 0 $0
Aggregated Statistics For Year 2003(Based on 1 partial tract) A) Conventional B) Refinancings Number Average Value Number Average Value
LOANS ORIGINATED 4 $274,880 4 $228,738 APPLICATIONS APPROVED, NOT ACCEPTED 1 $371,110 2 $297,580 APPLICATIONS DENIED 0 $0 0 $0 APPLICATIONS WITHDRAWN 1 $169,760 0 $0 FILES CLOSED FOR INCOMPLETENESS 0 $0 0 $0
Aggregated Statistics For Year 2002(Based on 1 partial tract) A) Conventional B) Refinancings C) Non-occupant Loans on Number Average Value Number Average Value Number Average Value
LOANS ORIGINATED 13 $250,015 5 $218,324 1 $187,200 APPLICATIONS APPROVED, NOT ACCEPTED 1 $128,310 1 $222,070 0 $0 APPLICATIONS DENIED 0 $0 0 $0 0 $0 APPLICATIONS WITHDRAWN 1 $246,090 0 $0 0 $0 FILES CLOSED FOR INCOMPLETENESS 0 $0 0 $0 0 $0
Aggregated Statistics For Year 2001(Based on 1 partial tract) A) Conventional B) Refinancings Number Average Value Number Average Value
LOANS ORIGINATED 8 $227,586 4 $182,760 APPLICATIONS APPROVED, NOT ACCEPTED 1 $317,810 2 $197,730 APPLICATIONS DENIED 0 $0 0 $0 APPLICATIONS WITHDRAWN 1 $211,880 0 $0 FILES CLOSED FOR INCOMPLETENESS 0 $0 0 $0
Aggregated Statistics For Year 2000(Based on 1 partial tract) A) Conventional B) Refinancings Number Average Value Number Average Value
LOANS ORIGINATED 9 $190,126 2 $218,620 APPLICATIONS APPROVED, NOT ACCEPTED 2 $182,100 1 $96,070 APPLICATIONS DENIED 0 $0 0 $0 APPLICATIONS WITHDRAWN 0 $0 0 $0 FILES CLOSED FOR INCOMPLETENESS 0 $0 0 $0
Aggregated Statistics For Year 1999(Based on 1 partial tract) A) Conventional B) Refinancings C) Non-occupant Loans on Number Average Value Number Average Value Number Average Value
LOANS ORIGINATED 6 $222,197 5 $185,594 1 $107,400 APPLICATIONS APPROVED, NOT ACCEPTED 0 $0 1 $287,300 0 $0 APPLICATIONS DENIED 0 $0 0 $0 0 $0 APPLICATIONS WITHDRAWN 0 $0 0 $0 0 $0 FILES CLOSED FOR INCOMPLETENESS 0 $0 0 $0 0 $0
Detailed PMIC statistics for the following Tracts:
0308.03
Shingle Springs compared to California state average:
Unemployed percentage significantly below state average. Black race population percentage significantly below state average. Hispanic race population percentage below state average. Median age significantly above state average. Foreign-born population percentage significantly below state average. Renting percentage below state average. Length of stay since moving in significantly above state average. Number of rooms per house above state average. Shingle Springs on our top lists :
#25 on the list of "Top 101 cities with the most residents born in Other South America (population 500+)"
#19 on the list of "Top 101 counties with the lowest number of births per 1000 residents 2007-2013"
#54 on the list of "Top 101 counties with the largest decrease in the number of births per 1000 residents 2000-2006 to 2007-2013 (pop 50,000+)"
#84 on the list of "Top 101 counties with highest percentage of residents voting for 3rd party candidates in the 2012 Presidential Election (pop. 50,000+)"
Top Patent Applicants
Hernan A. Castro (27)
Alan D. Ross (11)
Jared E. Hulbert (10)
Hernan Castro (10)
Alan Ross (5)
Dennis R. Flaharty (5)
David A. Richard (5)
William Melton (5)
Jared Hulbert (5)
James S. Coke (5)
Total of 168 patent applications in 2008-2024.


 Recent articles from our blog. Our writers, many of them Ph.D. graduates or candidates, create easy-to-read articles on a wide variety of topics.

 (11.4 miles
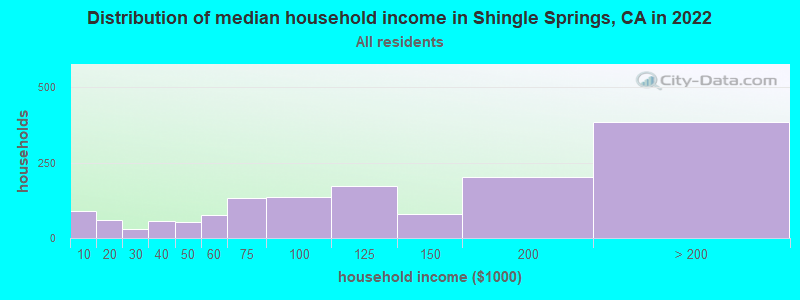

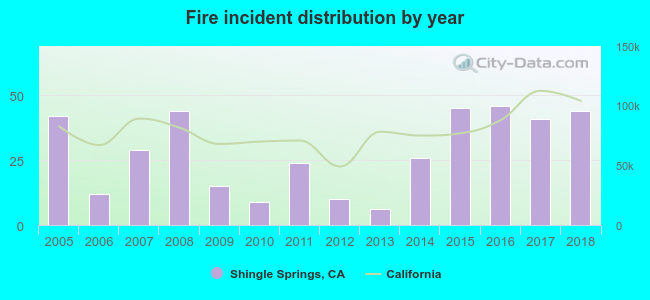 Based on the data from the years 2005 - 2018 the average number of fires per year is 28. The highest number of reported fires - 46 took place in 2016, and the least - 6 in 2013. The data has a rising trend.
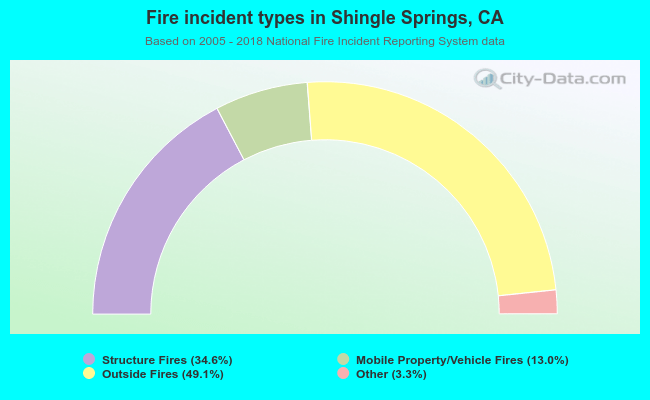 When looking into fire subcategories, the most incidents belonged to: Outside Fires (49.1%), and Structure Fires (34.6%).